Assessing the Performances of Protein Function Prediction Algorithms from the Perspectives of Identification Accuracy and False Discovery Rate

 ,
,
Abstract
1. Introduction
2. Results and Discussion
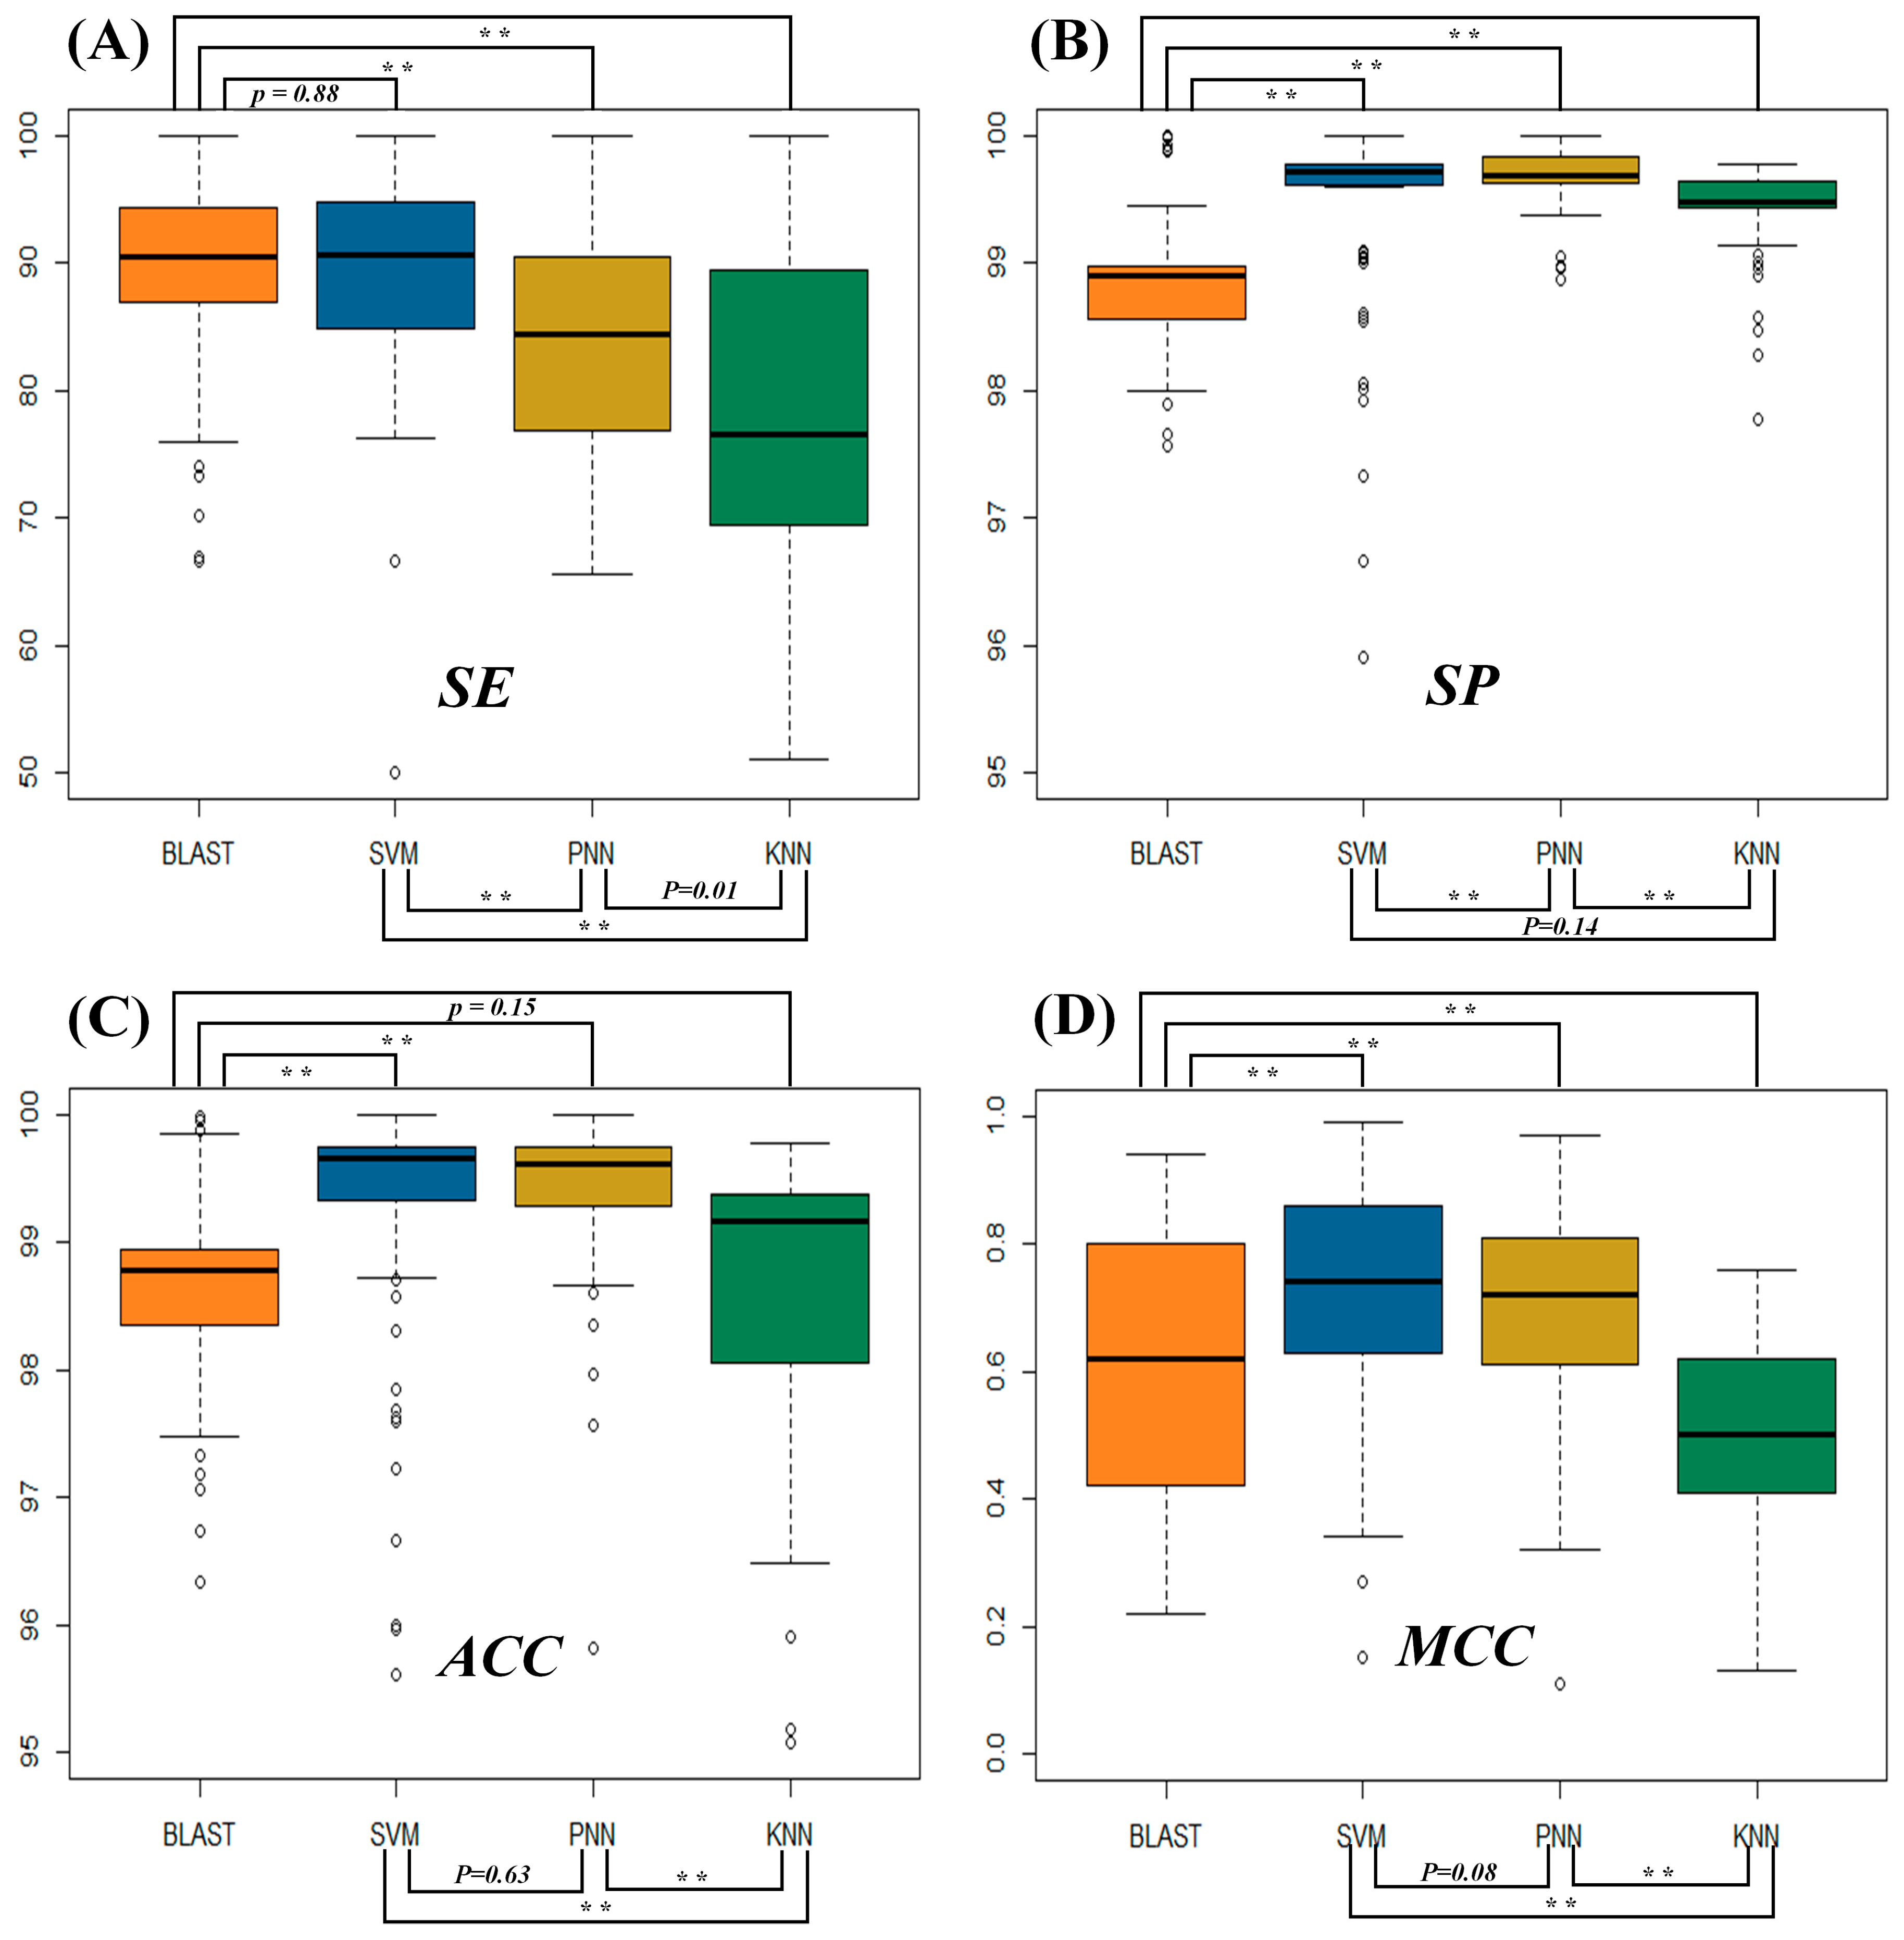
2.1. Assessment of the Identification Accuracies Measured by Four Popular Metrics
2.2. Evaluating the Statistical Differences in SE and MCC among Four Metrics
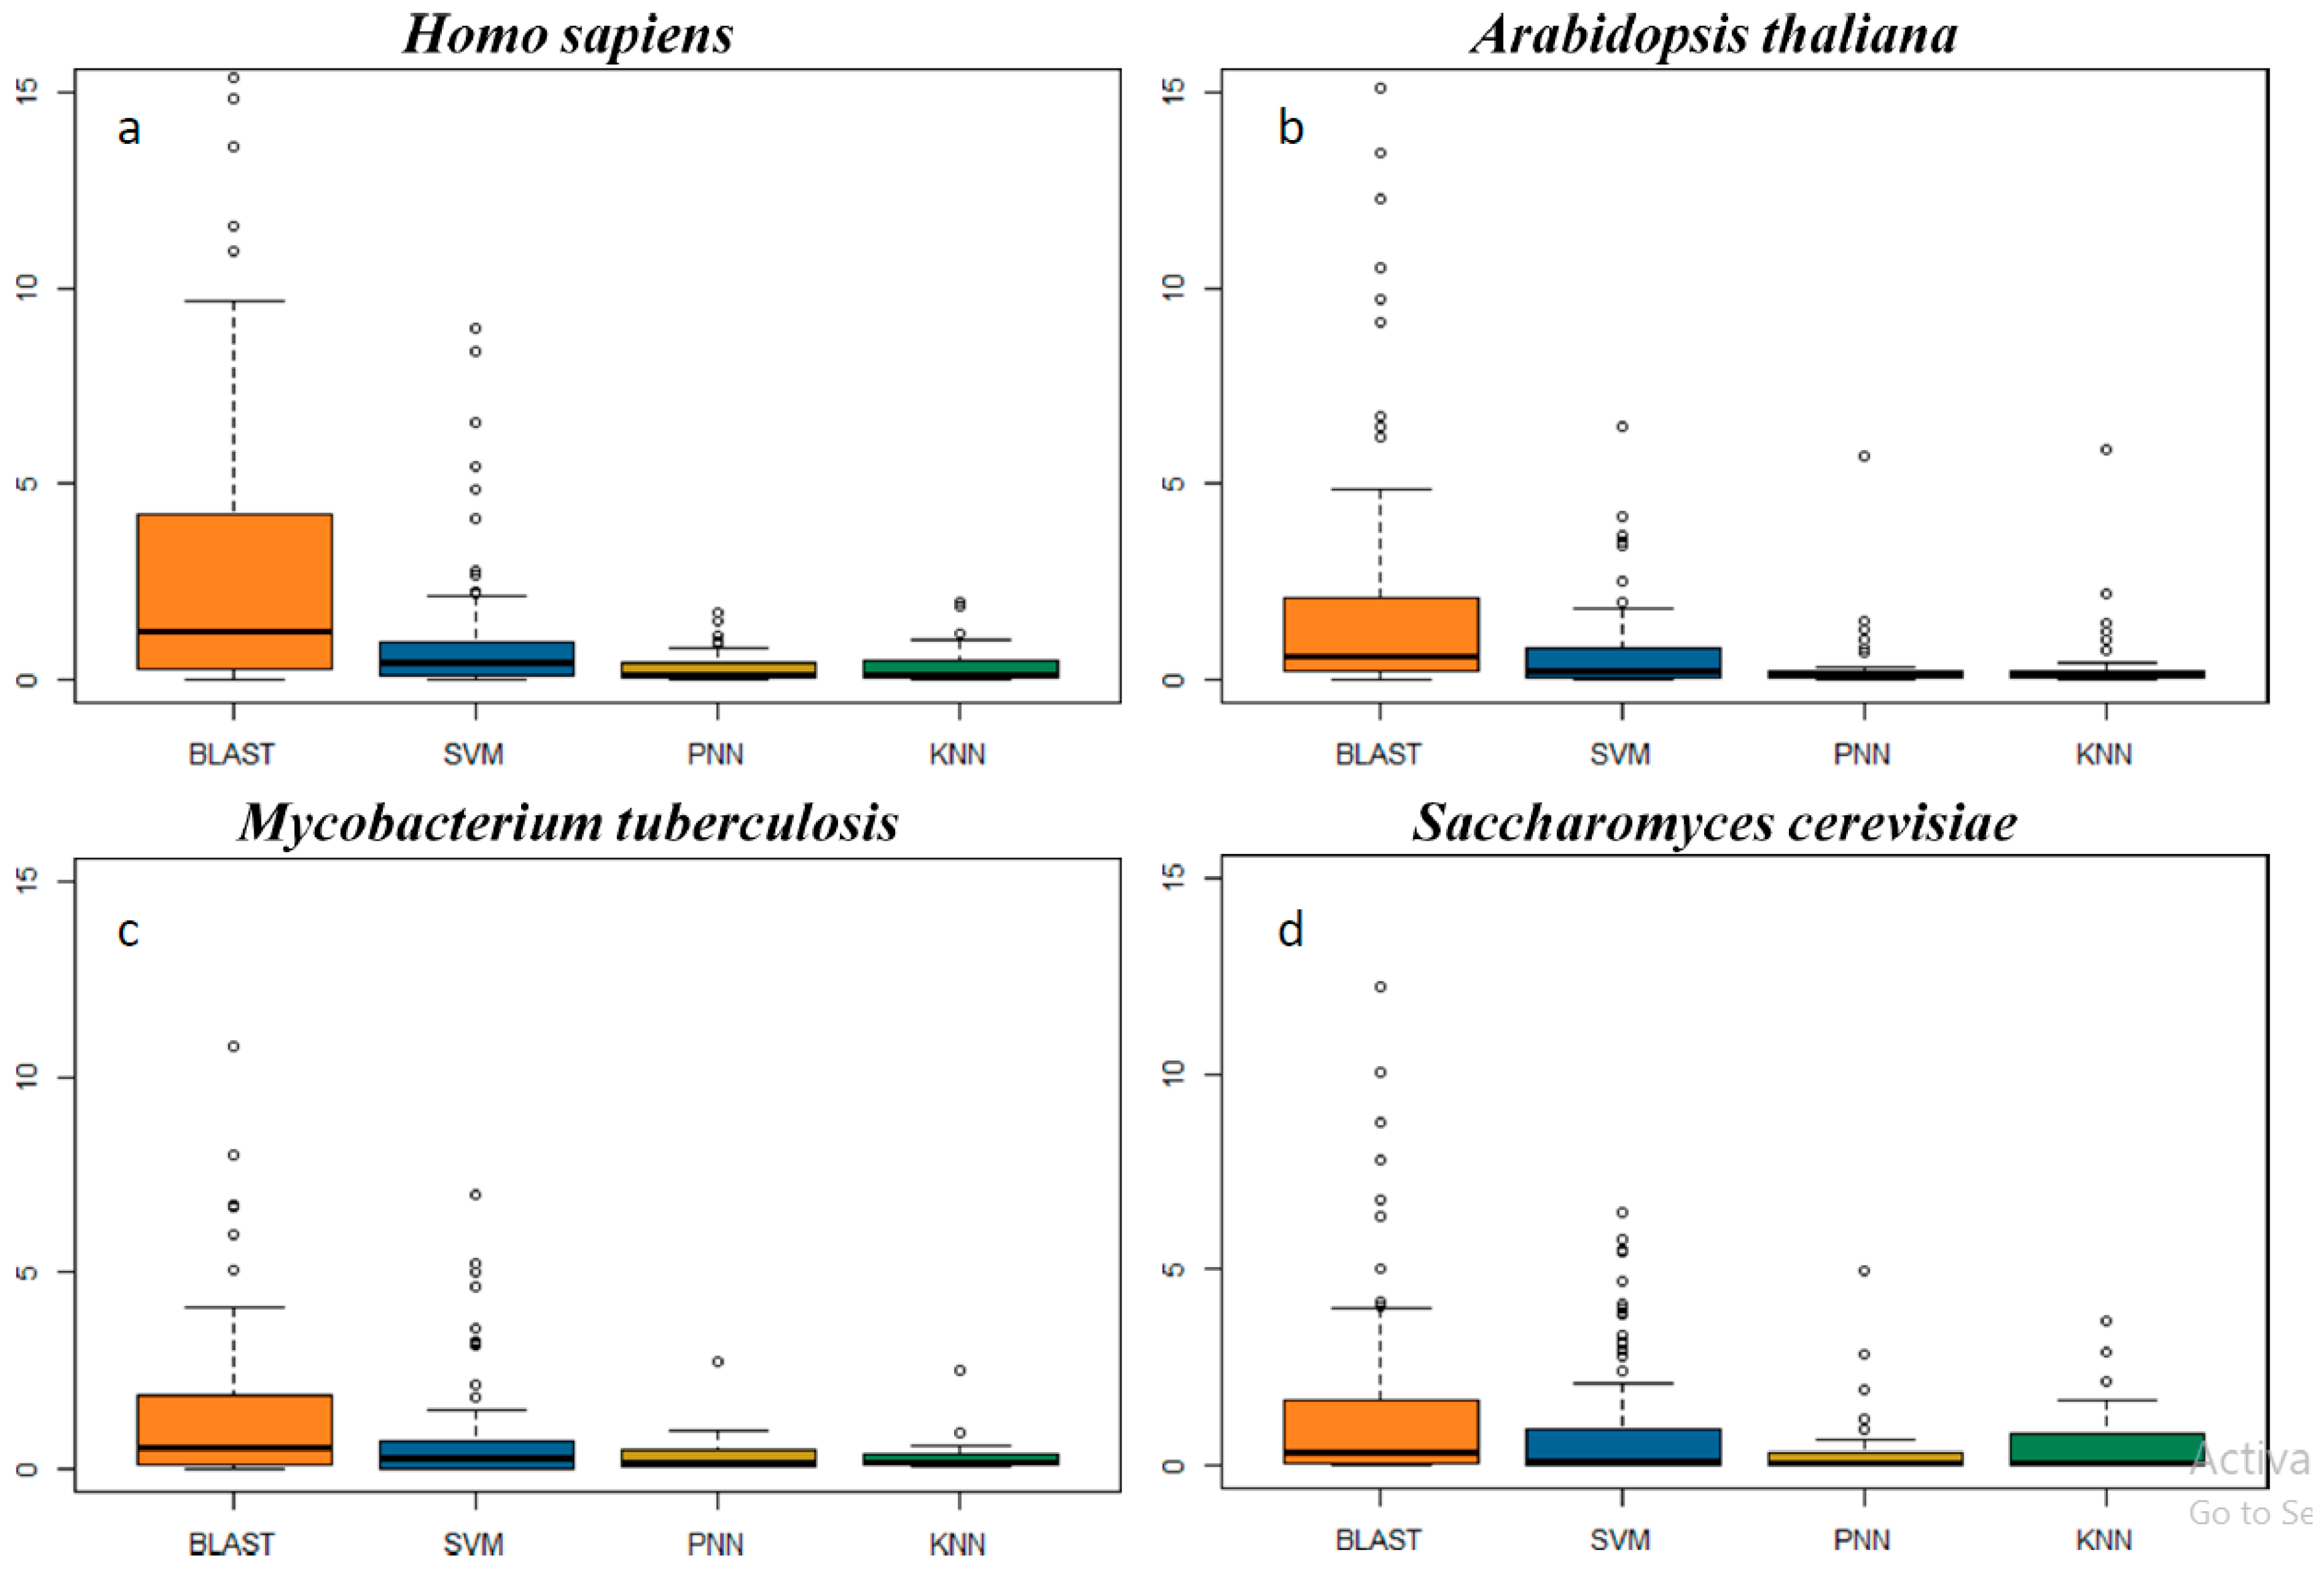
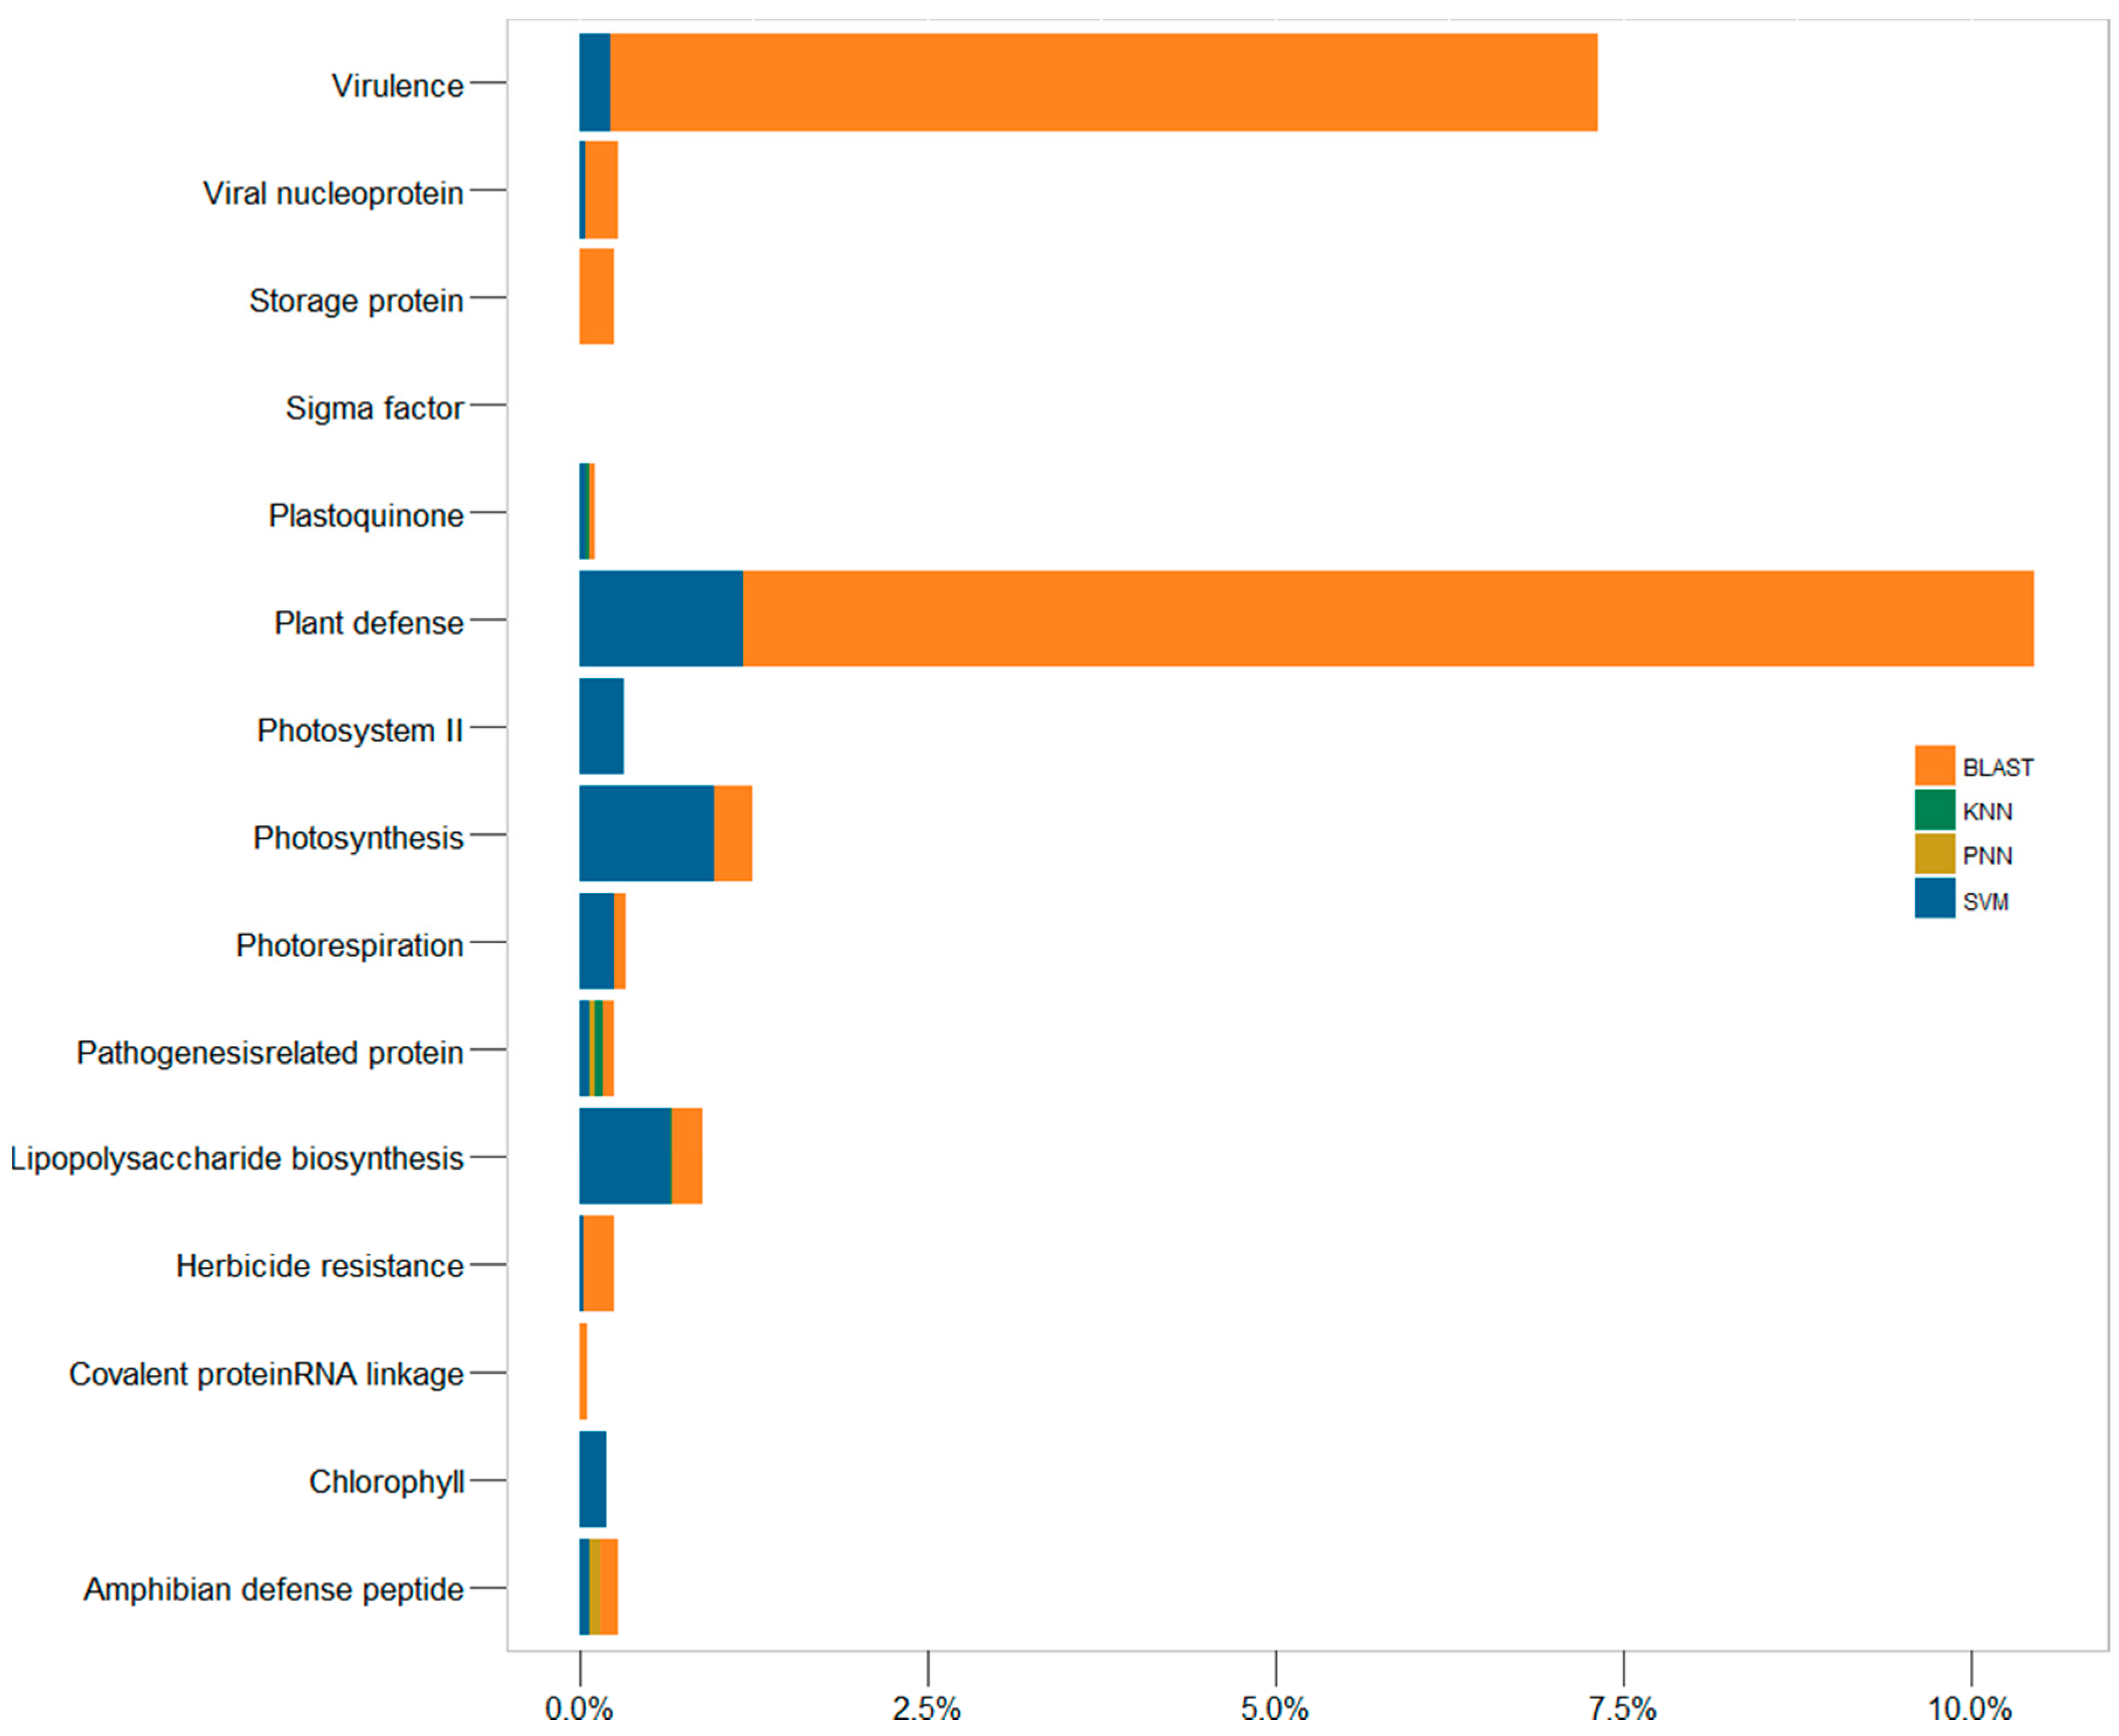
2.3. In-Depth Assessment of the False Discovery Rate by Genome Scanning
3. Materials and Methods
3.1. Collecting the Protein Sequences of Different Functional Families
3.2. Construction of the Training and Testing Datasets
3.3. Feature Vectors Used for Representing the Protein Sequence
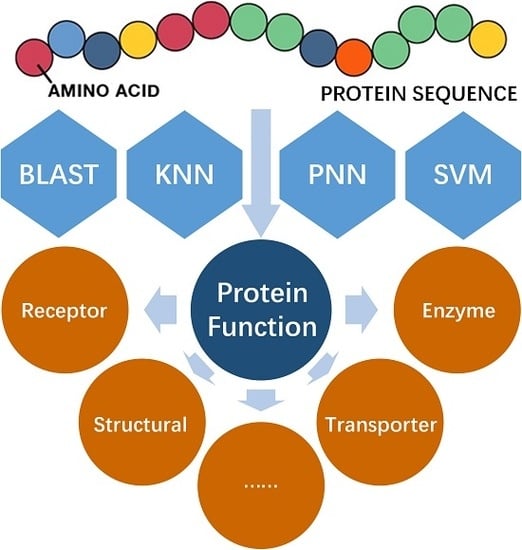
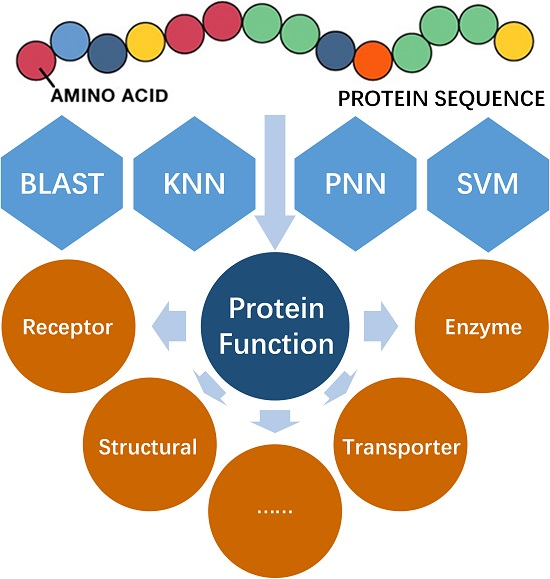
3.4. Functional Prediction of Protein Constructed by Machine Learning
3.5. Construction of Protein Functional Prediction Model Based on Sequence Similarity
3.6. Assessing the Identification Accuracies of the Studied Methods
3.7. The Rates of False Discovery of the In Silico Methods Studied Here
4. Conclusions
Supplementary Materials
Acknowledgments
Author Contributions
Conflicts of Interest
References
- Baldi, P.; Brunak, S.; Chauvin, Y.; Andersen, C.A.; Nielsen, H. Assessing the accuracy of prediction algorithms for classification: An overview. Bioinformatics 2000, 16, 412–424. [Google Scholar] [CrossRef] [PubMed]
- Jackson, S.P.; Bartek, J. The DNA-damage response in human biology and disease. Nature 2009, 461, 1071–1078. [Google Scholar] [CrossRef] [PubMed]
- Weinberg, S.E.; Chandel, N.S. Targeting mitochondria metabolism for cancer therapy. Nat. Chem. Biol. 2015, 11, 9–15. [Google Scholar] [CrossRef] [PubMed]
- Grant, M.A. Integrating computational protein function prediction into drug discovery initiatives. Drug Dev. Res. 2011, 72, 4–16. [Google Scholar] [CrossRef] [PubMed]
- Li, B.; Tang, J.; Yang, Q.; Li, S.; Cui, X.; Li, Y.; Chen, Y.; Xue, W.; Li, X.; Zhu, F. Noreva: Normalization and evaluation of MS-based metabolomics data. Nucleic Acids Res. 2017, 45, 162–170. [Google Scholar] [CrossRef] [PubMed]
- Li, B.; Tang, J.; Yang, Q.; Cui, X.; Li, S.; Chen, S.; Cao, Q.; Xue, W.; Chen, N.; Zhu, F. Performance evaluation and online realization of data-driven normalization methods used in lc/ms based untargeted metabolomics analysis. Sci. Rep. 2016, 6, 38881. [Google Scholar] [CrossRef] [PubMed]
- Xu, J.; Wang, P.; Yang, H.; Zhou, J.; Li, Y.; Li, X.; Xue, W.; Yu, C.; Tian, Y.; Zhu, F. Comparison of FDA approved kinase targets to clinical trial ones: Insights from their system profiles and drug-target interaction networks. BioMed Res. Int. 2016, 2016, 2509385. [Google Scholar] [CrossRef] [PubMed]
- Huerta-Cepas, J.; Szklarczyk, D.; Forslund, K.; Cook, H.; Heller, D.; Walter, M.C.; Rattei, T.; Mende, D.R.; Sunagawa, S.; Kuhn, M.; et al. Eggnog 4.5: A hierarchical orthology framework with improved functional annotations for eukaryotic, prokaryotic and viral sequences. Nucleic Acids Res. 2016, 44, 286–293. [Google Scholar] [CrossRef] [PubMed]
- Szklarczyk, D.; Jensen, L.J. Protein-protein interaction databases. Methods Mol. Biol. 2015, 1278, 39–56. [Google Scholar] [PubMed]
- Jeanquartier, F.; Jean-Quartier, C.; Holzinger, A. Integrated web visualizations for protein-protein interaction databases. BMC Bioinform. 2015, 16, 195. [Google Scholar] [CrossRef] [PubMed]
- Szklarczyk, D.; Santos, A.; von Mering, C.; Jensen, L.J.; Bork, P.; Kuhn, M. Stitch 5: Augmenting protein-chemical interaction networks with tissue and affinity data. Nucleic Acids Res. 2016, 44, 380–384. [Google Scholar] [CrossRef] [PubMed]
- Franceschini, A.; Szklarczyk, D.; Frankild, S.; Kuhn, M.; Simonovic, M.; Roth, A.; Lin, J.; Minguez, P.; Bork, P.; von Mering, C.; et al. String v9.1: Protein-protein interaction networks, with increased coverage and integration. Nucleic Acids Res. 2013, 41, 808–815. [Google Scholar] [CrossRef] [PubMed]
- Szklarczyk, D.; Franceschini, A.; Wyder, S.; Forslund, K.; Heller, D.; Huerta-Cepas, J.; Simonovic, M.; Roth, A.; Santos, A.; Tsafou, K.P.; et al. String v10: Protein-protein interaction networks, integrated over the tree of life. Nucleic Acids Res. 2015, 43, 447–452. [Google Scholar] [CrossRef] [PubMed]
- Szklarczyk, D.; Franceschini, A.; Kuhn, M.; Simonovic, M.; Roth, A.; Minguez, P.; Doerks, T.; Stark, M.; Muller, J.; Bork, P.; et al. The string database in 2011: Functional interaction networks of proteins, globally integrated and scored. Nucleic Acids Res. 2011, 39, 561–568. [Google Scholar] [CrossRef] [PubMed]
- Szklarczyk, D.; Morris, J.H.; Cook, H.; Kuhn, M.; Wyder, S.; Simonovic, M.; Santos, A.; Doncheva, N.T.; Roth, A.; Bork, P.; et al. The string database in 2017: Quality-controlled protein-protein association networks, made broadly accessible. Nucleic Acids Res. 2017, 45, 362–368. [Google Scholar] [CrossRef] [PubMed]
- Finn, R.D.; Coggill, P.; Eberhardt, R.Y.; Eddy, S.R.; Mistry, J.; Mitchell, A.L.; Potter, S.C.; Punta, M.; Qureshi, M.; Sangrador-Vegas, A.; et al. The pfam protein families database: Towards a more sustainable future. Nucleic Acids Res. 2016, 44, 279–285. [Google Scholar] [CrossRef] [PubMed]
- Li, Y.H.; Yu, C.Y.; Li, X.X.; Zhang, P.; Tang, J.; Yang, Q.; Fu, T.; Zhang, X.; Cui, X.; Tu, G.; et al. Therapeutic target database update 2018: Enriched resource for facilitating bench-to-clinic research of targeted therapeutics. Nucleic Acids Res. 2017. [Google Scholar] [CrossRef]
- Yang, H.; Qin, C.; Li, Y.H.; Tao, L.; Zhou, J.; Yu, C.Y.; Xu, F.; Chen, Z.; Zhu, F.; Chen, Y.Z. Therapeutic target database update 2016: Enriched resource for bench to clinical drug target and targeted pathway information. Nucleic Acids Res. 2016, 44, 1069–1074. [Google Scholar] [CrossRef] [PubMed]
- Zhu, F.; Shi, Z.; Qin, C.; Tao, L.; Liu, X.; Xu, F.; Zhang, L.; Song, Y.; Liu, X.; Zhang, J.; et al. Therapeutic target database update 2012: A resource for facilitating target-oriented drug discovery. Nucleic Acids Res. 2012, 40, 1128–1136. [Google Scholar] [CrossRef] [PubMed]
- Zhu, F.; Han, B.; Kumar, P.; Liu, X.; Ma, X.; Wei, X.; Huang, L.; Guo, Y.; Han, L.; Zheng, C.; et al. Update of ttd: Therapeutic target database. Nucleic Acids Res. 2010, 38, 787–791. [Google Scholar] [CrossRef] [PubMed]
- Li, Y.H.; Wang, P.P.; Li, X.X.; Yu, C.Y.; Yang, H.; Zhou, J.; Xue, W.W.; Tan, J.; Zhu, F. The human kinome targeted by FDA approved multi-target drugs and combination products: A comparative study from the drug-target interaction network perspective. PLoS ONE 2016, 11, e0165737. [Google Scholar] [CrossRef] [PubMed]
- Zhu, F.; Ma, X.H.; Qin, C.; Tao, L.; Liu, X.; Shi, Z.; Zhang, C.L.; Tan, C.Y.; Chen, Y.Z.; Jiang, Y.Y. Drug discovery prospect from untapped species: Indications from approved natural product drugs. PLoS ONE 2012, 7, e39782. [Google Scholar] [CrossRef] [PubMed]
- Erdin, S.; Lisewski, A.M.; Lichtarge, O. Protein function prediction: Towards integration of similarity metrics. Curr. Opin. Struct. Biol. 2011, 21, 180–188. [Google Scholar] [CrossRef] [PubMed]
- Sayers, E.W.; Barrett, T.; Benson, D.A.; Bolton, E.; Bryant, S.H.; Canese, K.; Chetvernin, V.; Church, D.M.; Dicuccio, M.; Federhen, S.; et al. Database resources of the national center for biotechnology information. Nucleic Acids Res. 2012, 40, 13–25. [Google Scholar] [CrossRef] [PubMed]
- Barrell, D.; Dimmer, E.; Huntley, R.P.; Binns, D.; O’Donovan, C.; Apweiler, R. The goa database in 2009—An integrated gene ontology annotation resource. Nucleic Acids Res. 2009, 37, 396–403. [Google Scholar] [CrossRef] [PubMed]
- The UniProt Consortium. Activities at the universal protein resource (UniProt). Nucleic Acids Res. 2014, 42, 191–198. [Google Scholar]
- Bork, P.; Koonin, E.V. Predicting functions from protein sequences—where are the bottlenecks? Nat. Genet. 1998, 18, 313–318. [Google Scholar] [CrossRef] [PubMed]
- Chitale, M.; Hawkins, T.; Park, C.; Kihara, D. ESG: Extended similarity group method for automated protein function prediction. Bioinformatics 2009, 25, 1739–1745. [Google Scholar] [CrossRef] [PubMed]
- Enright, A.J.; Van Dongen, S.; Ouzounis, C.A. An efficient algorithm for large-scale detection of protein families. Nucleic Acids Res. 2002, 30, 1575–1584. [Google Scholar] [CrossRef] [PubMed]
- Sahraeian, S.M.; Luo, K.R.; Brenner, S.E. Sifter search: A web server for accurate phylogeny-based protein function prediction. Nucleic Acids Res. 2015, 43, 141–147. [Google Scholar] [CrossRef] [PubMed]
- Teichmann, S.A.; Murzin, A.G.; Chothia, C. Determination of protein function, evolution and interactions by structural genomics. Curr. Opin. Struct. Biol. 2001, 11, 354–363. [Google Scholar] [CrossRef]
- Enright, A.J.; Iliopoulos, I.; Kyrpides, N.C.; Ouzounis, C.A. Protein interaction maps for complete genomes based on gene fusion events. Nature 1999, 402, 86–90. [Google Scholar] [CrossRef] [PubMed]
- Aravind, L. Guilt by association: Contextual information in genome analysis. Genome Res. 2000, 10, 1074–1077. [Google Scholar] [CrossRef] [PubMed]
- Kotlyar, M.; Pastrello, C.; Pivetta, F.; Lo Sardo, A.; Cumbaa, C.; Li, H.; Naranian, T.; Niu, Y.; Ding, Z.; Vafaee, F.; et al. In silico prediction of physical protein interactions and characterization of interactome orphans. Nat. Methods 2015, 12, 79–84. [Google Scholar] [CrossRef] [PubMed]
- Jensen, L.J.; Gupta, R.; Staerfeldt, H.H.; Brunak, S. Prediction of human protein function according to gene ontology categories. Bioinformatics 2003, 19, 635–642. [Google Scholar] [CrossRef] [PubMed]
- Cai, C.Z.; Han, L.Y.; Ji, Z.L.; Chen, X.; Chen, Y.Z. SVM-prot: Web-based support vector machine software for functional classification of a protein from its primary sequence. Nucleic Acids Res. 2003, 31, 3692–3697. [Google Scholar] [CrossRef] [PubMed]
- Lobley, A.E.; Nugent, T.; Orengo, C.A.; Jones, D.T. Ffpred: An integrated feature-based function prediction server for vertebrate proteomes. Nucleic Acids Res. 2008, 36, 297–302. [Google Scholar] [CrossRef] [PubMed]
- Zhu, F.; Qin, C.; Tao, L.; Liu, X.; Shi, Z.; Ma, X.; Jia, J.; Tan, Y.; Cui, C.; Lin, J.; et al. Clustered patterns of species origins of nature-derived drugs and clues for future bioprospecting. Proc. Natl. Acad. Sci. USA 2011, 108, 12943–12948. [Google Scholar] [CrossRef] [PubMed]
- Das, S.; Sillitoe, I.; Lee, D.; Lees, J.G.; Dawson, N.L.; Ward, J.; Orengo, C.A. Cath funfhmmer web server: Protein functional annotations using functional family assignments. Nucleic Acids Res. 2015, 43, 148–153. [Google Scholar] [CrossRef] [PubMed]
- Wang, P.; Zhang, X.; Fu, T.; Li, S.; Li, B.; Xue, W.; Yao, X.; Chen, Y.; Zhu, F. Differentiating physicochemical properties between addictive and nonaddictive adhd drugs revealed by molecular dynamics simulation studies. ACS Chem. Neurosci. 2017, 8, 1416–1428. [Google Scholar] [CrossRef] [PubMed]
- Xue, W.; Wang, P.; Li, B.; Li, Y.; Xu, X.; Yang, F.; Yao, X.; Chen, Y.Z.; Xu, F.; Zhu, F. Identification of the inhibitory mechanism of fda approved selective serotonin reuptake inhibitors: An insight from molecular dynamics simulation study. Phys. Chem. Chem. Phys. 2016, 18, 3260–3271. [Google Scholar] [CrossRef] [PubMed]
- Zheng, G.; Xue, W.; Wang, P.; Yang, F.; Li, B.; Li, X.; Li, Y.; Yao, X.; Zhu, F. Exploring the inhibitory mechanism of approved selective norepinephrine reuptake inhibitors and reboxetine enantiomers by molecular dynamics study. Sci. Rep. 2016, 6, 26883. [Google Scholar] [CrossRef] [PubMed]
- Wang, P.; Yang, F.; Yang, H.; Xu, X.; Liu, D.; Xue, W.; Zhu, F. Identification of dual active agents targeting 5-ht1a and sert by combinatorial virtual screening methods. Biomed. Mater. Eng. 2015, 26 (Suppl. 1), 2233–2239. [Google Scholar] [CrossRef] [PubMed]
- Li, D.; Ju, Y.; Zou, Q. Protein folds prediction with hierarchical structured SVM. Curr. Proteom. 2016, 13, 79–85. [Google Scholar] [CrossRef]
- Wei, L.; Tang, J.; Zou, Q. Skipcpp-pred: An improved and promising sequence-based predictor for predicting cell-penetrating peptides. BMC Genom. 2017, 18 (Suppl. 7), 742. [Google Scholar] [CrossRef]
- Wan, S.; Duan, Y.; Zou, Q. Hpslpred: An ensemble multi-label classifier for human protein subcellular location prediction with imbalanced source. Proteomics 2017, 17. [Google Scholar] [CrossRef] [PubMed]
- Wei, L.; Xing, P.; Su, R.; Shi, G.; Ma, Z.S.; Zou, Q. Cppred-rf: A sequence-based predictor for identifying cell-penetrating peptides and their uptake efficiency. J. Proteome Res. 2017, 16, 2044–2053. [Google Scholar] [CrossRef] [PubMed]
- Friedberg, I.; Harder, T.; Godzik, A. JAFA: A protein function annotation meta-server. Nucleic Acids Res. 2006, 34, 379–381. [Google Scholar] [CrossRef] [PubMed]
- Wass, M.N.; Barton, G.; Sternberg, M.J. Combfunc: Predicting protein function using heterogeneous data sources. Nucleic Acids Res. 2012, 40, 466–470. [Google Scholar] [CrossRef] [PubMed]
- Jones, P.; Binns, D.; Chang, H.Y.; Fraser, M.; Li, W.; McAnulla, C.; McWilliam, H.; Maslen, J.; Mitchell, A.; Nuka, G.; et al. Interproscan 5: Genome-scale protein function classification. Bioinformatics 2014, 30, 1236–1240. [Google Scholar] [CrossRef] [PubMed]
- Piovesan, D.; Giollo, M.; Leonardi, E.; Ferrari, C.; Tosatto, S.C. Inga: Protein function prediction combining interaction networks, domain assignments and sequence similarity. Nucleic Acids Res. 2015, 43, 134–140. [Google Scholar] [CrossRef] [PubMed]
- Bandyopadhyay, S.; Ray, S.; Mukhopadhyay, A.; Maulik, U. A review of in silico approaches for analysis and prediction of hiv-1-human protein-protein interactions. Brief. Bioinform. 2015, 16, 830–851. [Google Scholar] [CrossRef] [PubMed]
- Boratyn, G.M.; Camacho, C.; Cooper, P.S.; Coulouris, G.; Fong, A.; Ma, N.; Madden, T.L.; Matten, W.T.; McGinnis, S.D.; Merezhuk, Y.; et al. Blast: A more efficient report with usability improvements. Nucleic Acids Res. 2013, 41, 29–33. [Google Scholar] [CrossRef] [PubMed]
- Pearson, W.R. Blast and fasta similarity searching for multiple sequence alignment. Methods Mol. Biol. 2014, 1079, 75–101. [Google Scholar] [PubMed]
- Radivojac, P.; Clark, W.T.; Oron, T.R.; Schnoes, A.M.; Wittkop, T.; Sokolov, A.; Graim, K.; Funk, C.; Verspoor, K.; Ben-Hur, A.; et al. A large-scale evaluation of computational protein function prediction. Nat. Methods 2013, 10, 221–227. [Google Scholar] [CrossRef] [PubMed]
- Jiang, Y.; Oron, T.R.; Clark, W.T.; Bankapur, A.R.; D’Andrea, D.; Lepore, R.; Funk, C.S.; Kahanda, I.; Verspoor, K.M.; Ben-Hur, A.; et al. An expanded evaluation of protein function prediction methods shows an improvement in accuracy. Genome Biol. 2016, 17, 184. [Google Scholar] [CrossRef] [PubMed]
- Liang, Y.; Zhang, S. Predict protein structural class by incorporating two different modes of evolutionary information into chou’s general pseudo amino acid composition. J. Mol. Graph. Model. 2017, 78, 110–117. [Google Scholar] [CrossRef] [PubMed]
- Pradhan, D.; Padhy, S.; Sahoo, B. Enzyme classification using multiclass support vector machine and feature subset selection. Comput. Biol. Chem. 2017, 70, 211–219. [Google Scholar] [CrossRef] [PubMed]
- Meher, P.K.; Sahu, T.K.; Banchariya, A.; Rao, A.R. Dirprot: A computational approach for discriminating insecticide resistant proteins from non-resistant proteins. BMC Bioinform. 2017, 18, 190. [Google Scholar] [CrossRef] [PubMed]
- Zhu, F.; Han, L.; Zheng, C.; Xie, B.; Tammi, M.T.; Yang, S.; Wei, Y.; Chen, Y. What are next generation innovative therapeutic targets? Clues from genetic, structural, physicochemical, and systems profiles of successful targets. J. Pharmacol. Exp. Ther. 2009, 330, 304–315. [Google Scholar] [CrossRef] [PubMed]
- Zhu, F.; Han, L.Y.; Chen, X.; Lin, H.H.; Ong, S.; Xie, B.; Zhang, H.L.; Chen, Y.Z. Homology-free prediction of functional class of proteins and peptides by support vector machines. Curr. Protein Pept. Sci. 2008, 9, 70–95. [Google Scholar] [PubMed]
- Zhu, F.; Zheng, C.J.; Han, L.Y.; Xie, B.; Jia, J.; Liu, X.; Tammi, M.T.; Yang, S.Y.; Wei, Y.Q.; Chen, Y.Z. Trends in the exploration of anticancer targets and strategies in enhancing the efficacy of drug targeting. Curr. Mol. Pharmacol. 2008, 1, 213–232. [Google Scholar] [CrossRef] [PubMed]
- Li, Y.H.; Xu, J.Y.; Tao, L.; Li, X.F.; Li, S.; Zeng, X.; Chen, S.Y.; Zhang, P.; Qin, C.; Zhang, C.; et al. SVM-prot 2016: A web-server for machine learning prediction of protein functional families from sequence irrespective of similarity. PLoS ONE 2016, 11, e0155290. [Google Scholar] [CrossRef] [PubMed]
- Cai, C.Z.; Han, L.Y.; Ji, Z.L.; Chen, Y.Z. Enzyme family classification by support vector machines. Proteins 2004, 55, 66–76. [Google Scholar] [CrossRef] [PubMed]
- Han, L.Y.; Cai, C.Z.; Ji, Z.L.; Cao, Z.W.; Cui, J.; Chen, Y.Z. Predicting functional family of novel enzymes irrespective of sequence similarity: A statistical learning approach. Nucleic Acids Res. 2004, 32, 6437–6444. [Google Scholar] [CrossRef] [PubMed]
- Shen, H.B.; Yang, J.; Chou, K.C. Fuzzy KNN for predicting membrane protein types from pseudo-amino acid composition. J. Theor. Biol. 2006, 240, 9–13. [Google Scholar] [CrossRef] [PubMed]
- Nath, N.; Mitchell, J.B. Is EC class predictable from reaction mechanism? BMC Bioinform. 2012, 13, 60. [Google Scholar] [CrossRef] [PubMed]
- Naveed, M.; Khan, A. Gpcr-mpredictor: Multi-level prediction of g protein-coupled receptors using genetic ensemble. Amino Acids 2012, 42, 1809–1823. [Google Scholar] [CrossRef] [PubMed]
- Hayat, M.; Khan, A. Predicting membrane protein types by fusing composite protein sequence features into pseudo amino acid composition. J. Theor. Biol. 2011, 271, 10–17. [Google Scholar] [CrossRef] [PubMed]
- Khan, Z.U.; Hayat, M.; Khan, M.A. Discrimination of acidic and alkaline enzyme using chou’s pseudo amino acid composition in conjunction with probabilistic neural network model. J. Theor. Biol. 2015, 365, 197–203. [Google Scholar] [CrossRef] [PubMed]
- Li, H.; Yap, C.W.; Ung, C.Y.; Xue, Y.; Li, Z.R.; Han, L.Y.; Lin, H.H.; Chen, Y.Z. Machine learning approaches for predicting compounds that interact with therapeutic and ADMET related proteins. J. Pharm. Sci. 2007, 96, 2838–2860. [Google Scholar] [CrossRef] [PubMed]
- Fujimoto, M.S.; Suvorov, A.; Jensen, N.O.; Clement, M.J.; Bybee, S.M. Detecting false positive sequence homology: A machine learning approach. BMC Bioinform. 2016, 17, 101. [Google Scholar] [CrossRef] [PubMed]
- Pearson, W.R. Protein function prediction: Problems and pitfalls. Curr. Protoc. Bioinform. 2015, 51, 1–18. [Google Scholar]
- Boman, H.G. Peptide antibiotics and their role in innate immunity. Annu. Rev. Immunol. 1995, 13, 61–92. [Google Scholar] [CrossRef] [PubMed]
- Hancock, R.E.; Diamond, G. The role of cationic antimicrobial peptides in innate host defences. Trends Microbiol. 2000, 8, 402–410. [Google Scholar] [CrossRef]
- Radek, K.; Gallo, R. Antimicrobial peptides: Natural effectors of the innate immune system. Semin. Immunopathol. 2007, 29, 27–43. [Google Scholar] [CrossRef] [PubMed]
- Iwamuro, S.; Kobayashi, T. An efficient protocol for DNA amplification of multiple amphibian skin antimicrobial peptide cDNAs. Methods Mol. Biol. 2010, 615, 159–176. [Google Scholar] [PubMed]
- Brown, J.B.; Akutsu, T. Identification of novel DNA repair proteins via primary sequence, secondary structure, and homology. BMC Bioinform. 2009, 10, 25. [Google Scholar] [CrossRef] [PubMed]
- Crappe, J.; Van Criekinge, W.; Trooskens, G.; Hayakawa, E.; Luyten, W.; Baggerman, G.; Menschaert, G. Combining in silico prediction and ribosome profiling in a genome-wide search for novel putatively coding sorfs. BMC Genom. 2013, 14, 648. [Google Scholar] [CrossRef] [PubMed]
- Virgen-Slane, R.; Rozovics, J.M.; Fitzgerald, K.D.; Ngo, T.; Chou, W.; van der Heden van Noort, G.J.; Filippov, D.V.; Gershon, P.D.; Semler, B.L. An RNA virus hijacks an incognito function of a DNA repair enzyme. Proc. Natl. Acad. Sci. USA 2012, 109, 14634–14639. [Google Scholar] [CrossRef] [PubMed]
- Cheng, X.; Xiao, X.; Chou, K.C. pLoc-mPlant: Predict subcellular localization of multi-location plant proteins by incorporating the optimal go information into general PseAAC. Mol. Biosyst. 2017, 13, 1722–1727. [Google Scholar] [CrossRef] [PubMed]
- Cheng, X.; Xiao, X.; Chou, K.C. pLoc-mEuk: Predict subcellular localization of multi-label eukaryotic proteins by extracting the key go information into general PseAAC. Genomics 2018, 110, 50–58. [Google Scholar] [CrossRef] [PubMed]
- Cheng, X.; Xiao, X.; Chou, K.C. pLoc-mVirus: Predict subcellular localization of multi-location virus proteins via incorporating the optimal go information into general PseAAC. Gene 2017, 628, 315–321. [Google Scholar] [CrossRef] [PubMed]
- Cheng, X.; Zhao, S.G.; Lin, W.Z.; Xiao, X.; Chou, K.C. Ploc-manimal: Predict subcellular localization of animal proteins with both single and multiple sites. Bioinformatics 2017, 33, 3524–3531. [Google Scholar] [CrossRef] [PubMed]
- Qiu, W.R.; Sun, B.Q.; Xiao, X.; Xu, Z.C.; Jia, J.H.; Chou, K.C. iKCR-PseENs: Identify lysine crotonylation sites in histone proteins with pseudo components and ensemble classifier. Genomics 2017. [Google Scholar] [CrossRef] [PubMed]
- Chou, K.C. Impacts of bioinformatics to medicinal chemistry. Med. Chem. 2015, 11, 218–234. [Google Scholar] [CrossRef] [PubMed]
- Chou, K.C. An unprecedented revolution in medicinal chemistry driven by the progress of biological science. Curr. Top. Med. Chem. 2017, 17, 2337–2358. [Google Scholar] [CrossRef] [PubMed]
- Chen, W.; Feng, P.; Yang, H.; Ding, H.; Lin, H.; Chou, K.C. iRNA-AI: Identifying the adenosine to inosine editing sites in RNA sequences. Oncotarget 2017, 8, 4208–4217. [Google Scholar] [CrossRef] [PubMed]
- Cheng, X.; Zhao, S.G.; Xiao, X.; Chou, K.C. iATC-mISF: A multi-label classifier for predicting the classes of anatomical therapeutic chemicals. Bioinformatics 2017, 33, 341–346. [Google Scholar] [CrossRef] [PubMed]
- Feng, P.; Ding, H.; Yang, H.; Chen, W.; Lin, H.; Chou, K.C. iRNA-PseCOLL: Identifying the occurrence sites of different rna modifications by incorporating collective effects of nucleotides into PseKNC. Mol. Ther. Nucleic Acids 2017, 7, 155–163. [Google Scholar] [CrossRef] [PubMed]
- Liu, B.; Wang, S.; Long, R.; Chou, K.C. iRSpot-EL: Identify recombination spots with an ensemble learning approach. Bioinformatics 2017, 33, 35–41. [Google Scholar] [CrossRef] [PubMed]
- Liu, B.; Yang, F.; Chou, K.C. 2l-pirna: A two-layer ensemble classifier for identifying piwi-interacting RNAS and their function. Mol. Ther. Nucleic Acids 2017, 7, 267–277. [Google Scholar] [CrossRef] [PubMed]
- Liu, L.M.; Xu, Y.; Chou, K.C. iPGK-PseAAC: Identify lysine phosphoglycerylation sites in proteins by incorporating four different tiers of amino acid pairwise coupling information into the general PseAAC. Med. Chem. 2017, 13, 552–559. [Google Scholar] [CrossRef] [PubMed]
- Qiu, W.R.; Jiang, S.Y.; Xu, Z.C.; Xiao, X.; Chou, K.C. iRNAm5C-PseDNC: Identifying RNA 5-methylcytosine sites by incorporating physical-chemical properties into pseudo dinucleotide composition. Oncotarget 2017, 8, 41178–41188. [Google Scholar] [CrossRef] [PubMed]
- Qiu, W.R.; Sun, B.Q.; Xiao, X.; Xu, D.; Chou, K.C. iPhos-PseEVO: Identifying human phosphorylated proteins by incorporating evolutionary information into general PseAAC via grey system theory. Mol. Inform. 2017, 36. [Google Scholar] [CrossRef] [PubMed]
- Su, Q.; Lu, W.; Du, D.; Chen, F.; Niu, B.; Chou, K.C. Prediction of the aquatic toxicity of aromatic compounds to tetrahymena pyriformis through support vector regression. Oncotarget 2017, 8, 49359–49369. [Google Scholar] [CrossRef] [PubMed]
- Xu, Y.; Wang, Z.; Li, C.; Chou, K.C. iPreny-PseAAC: Identify c-terminal cysteine prenylation sites in proteins by incorporating two tiers of sequence couplings into PseAAC. Med. Chem. 2017, 13, 544–551. [Google Scholar] [CrossRef] [PubMed]
- Chou, K.C. Some remarks on protein attribute prediction and pseudo amino acid composition. J. Theor. Biol. 2011, 273, 236–247. [Google Scholar] [CrossRef] [PubMed]
- Chowdhury, S.Y.; Shatabda, S.; Dehzangi, A. iDNAProt-ES: Identification of DNA-binding proteins using evolutionary and structural features. Sci. Rep. 2017, 7, 14938. [Google Scholar] [CrossRef] [PubMed]
- Filos, D.; Chouvarda, I.; Tachmatzidis, D.; Vassilikos, V.; Maglaveras, N. Beat-to-beat p-wave morphology as a predictor of paroxysmal atrial fibrillation. Comput. Methods Progr. Biomed. 2017, 151, 111–121. [Google Scholar] [CrossRef] [PubMed]
- Rahimi, M.; Bakhtiarizadeh, M.R.; Mohammadi-Sangcheshmeh, A. Oogenesis_pred: A sequence-based method for predicting oogenesis proteins by six different modes of chou’s pseudo amino acid composition. J. Theor. Biol. 2017, 414, 128–136. [Google Scholar] [CrossRef] [PubMed]
- Sun, M.A.; Zhang, Q.; Wang, Y.; Ge, W.; Guo, D. Prediction of redox-sensitive cysteines using sequential distance and other sequence-based features. BMC Bioinform. 2016, 17, 316. [Google Scholar] [CrossRef] [PubMed]
- Wang, Y.; Li, X.; Tao, B. Improving classification of mature microrna by solving class imbalance problem. Sci. Rep. 2016, 6, 25941. [Google Scholar] [CrossRef] [PubMed]
- Meher, P.K.; Sahu, T.K.; Rao, A.R. Prediction of donor splice sites using random forest with a new sequence encoding approach. BioData Min. 2016, 9, 4. [Google Scholar] [CrossRef] [PubMed]
- Bock, J.R.; Gough, D.A. Predicting protein—Protein interactions from primary structure. Bioinformatics 2001, 17, 455–460. [Google Scholar] [CrossRef] [PubMed]
- Karchin, R.; Karplus, K.; Haussler, D. Classifying g-protein coupled receptors with support vector machines. Bioinformatics 2002, 18, 147–159. [Google Scholar] [CrossRef] [PubMed]
- Dobson, P.D.; Doig, A.J. Distinguishing enzyme structures from non-enzymes without alignments. J. Mol. Biol. 2003, 330, 771–783. [Google Scholar] [CrossRef]
- Des Jardins, M.; Karp, P.D.; Krummenacker, M.; Lee, T.J.; Ouzounis, C.A. Prediction of enzyme classification from protein sequence without the use of sequence similarity. Proc. Int. Conf. Intell. Syst. Mol. Biol. 1997, 5, 92–99. [Google Scholar] [PubMed]
- Du, R.; Mercante, D.; Fang, Z. An artificial functional family filter in homolog searching in next-generation sequencing metagenomics. PLoS ONE 2013, 8, e58669. [Google Scholar] [CrossRef] [PubMed]
- Tian, W.; Skolnick, J. How well is enzyme function conserved as a function of pairwise sequence identity? J. Mol. Biol. 2003, 333, 863–882. [Google Scholar] [CrossRef] [PubMed]
- Wommack, K.E.; Bhavsar, J.; Ravel, J. Metagenomics: Read length matters. Appl. Environ. Microbiol. 2008, 74, 1453–1463. [Google Scholar] [CrossRef] [PubMed]
- Ju, Z.; He, J.J. Prediction of lysine propionylation sites using biased svm and incorporating four different sequence features into chou’s pseaac. J. Mol. Graph. Model. 2017, 76, 356–363. [Google Scholar] [CrossRef] [PubMed]
- Jia, J.; Liu, Z.; Xiao, X.; Liu, B.; Chou, K.C. iPPI-Esml: An ensemble classifier for identifying the interactions of proteins by incorporating their physicochemical properties and wavelet transforms into PseAAC. J. Theor. Biol. 2015, 377, 47–56. [Google Scholar] [CrossRef] [PubMed]
- Jia, J.; Liu, Z.; Xiao, X.; Liu, B.; Chou, K.C. iCAR-PseCp: Identify carbonylation sites in proteins by monte carlo sampling and incorporating sequence coupled effects into general PseAAC. Oncotarget 2016, 7, 34558–34570. [Google Scholar] [CrossRef] [PubMed]
- Liu, B.; Long, R.; Chou, K.C. iDHS-EL: Identifying DNASE I hypersensitive sites by fusing three different modes of pseudo nucleotide composition into an ensemble learning framework. Bioinformatics 2016, 32, 2411–2418. [Google Scholar] [CrossRef] [PubMed]
- Liu, Z.; Xiao, X.; Yu, D.J.; Jia, J.; Qiu, W.R.; Chou, K.C. pRNAm-PC: Predicting n(6)-methyladenosine sites in rna sequences via physical-chemical properties. Anal. Biochem. 2016, 497, 60–67. [Google Scholar] [CrossRef] [PubMed]
- Qiu, W.R.; Sun, B.Q.; Xiao, X.; Xu, Z.C.; Chou, K.C. iPTM-mLys: Identifying multiple lysine ptm sites and their different types. Bioinformatics 2016, 32, 3116–3123. [Google Scholar] [CrossRef] [PubMed]
- Xu, Y.; Shao, X.J.; Wu, L.Y.; Deng, N.Y.; Chou, K.C. iSNO-AAPair: Incorporating amino acid pairwise coupling into pseaac for predicting cysteine s-nitrosylation sites in proteins. PeerJ 2013, 1, e171. [Google Scholar] [CrossRef] [PubMed]
- Chen, W.; Feng, P.M.; Lin, H.; Chou, K.C. iRSpot-PseDNC: Identify recombination spots with pseudo dinucleotide composition. Nucleic Acids Res. 2013, 41, e68. [Google Scholar] [CrossRef] [PubMed]
- Chou, K.C. Some remarks on predicting multi-label attributes in molecular biosystems. Mol. Biosyst. 2013, 9, 1092–1100. [Google Scholar] [CrossRef] [PubMed]


| UniProt Keyword | Protein Functional Family | GO Category | BLAST | SVM | PNN | KNN | ||||||||||||
|---|---|---|---|---|---|---|---|---|---|---|---|---|---|---|---|---|---|---|
| SE % | SP % | AC % | MCC | SE % | SP % | AC % | MCC | SE % | SP % | AC % | MCC | SE % | SP % | AC % | MCC | |||
| KW-0020 | Allergen | - | 76.32 | 98.92 | 98.78 | 0.48 | 84.81 | 99.69 | 99.66 | 0.57 | 86.42 | 99.84 | 99.81 | 0.69 | 74.07 | 99.48 | 99.32 | 0.41 |
| KW-0049 | Antioxidant | GO:0016209 | 94.15 | 99.23 | 99.20 | 0.60 | 89.00 | 99.76 | 99.73 | 0.67 | 86.00 | 99.84 | 99.80 | 0.71 | 69.00 | 99.42 | 99.24 | 0.43 |
| KW-0117 | Actin capping | GO:0051693 | 94.55 | 99.08 | 99.07 | 0.35 | 93.98 | 99.75 | 99.74 | 0.70 | 91.18 | 99.80 | 99.78 | 0.71 | 73.53 | 99.42 | 99.22 | 0.43 |
| KW-0147 | Chitin-binding | GO:0008061 | 86.96 | 98.96 | 98.94 | 0.34 | 91.75 | 99.72 | 99.68 | 0.78 | 75.36 | 99.61 | 99.47 | 0.63 | 93.84 | 98.57 | 98.05 | 0.37 |
| KW-0157 | Chromophore | GO:0018298 | 96.70 | 98.54 | 98.51 | 0.70 | 93.83 | 99.74 | 99.68 | 0.86 | 86.91 | 99.66 | 99.52 | 0.80 | 89.38 | 99.48 | 98.53 | 0.59 |
| KW-0195 | Cyclin | GO:0061575 | 89.34 | 98.92 | 98.89 | 0.44 | 97.96 | 99.78 | 99.78 | 0.60 | 89.80 | 99.84 | 99.83 | 0.62 | 75.51 | 99.63 | 99.53 | 0.39 |
| KW-0251 | Elongation factor | GO:0003746 | 99.51 | 98.57 | 98.60 | 0.83 | 96.72 | 99.67 | 99.62 | 0.92 | 84.14 | 99.67 | 99.29 | 0.85 | 95.84 | 99.46 | 97.21 | 0.63 |
| KW-0339 | Growth factor | GO:0008083 | 94.05 | 98.99 | 98.95 | 0.65 | 84.30 | 99.69 | 99.62 | 0.76 | 86.01 | 99.81 | 99.72 | 0.80 | 76.54 | 99.66 | 99.16 | 0.61 |
| KW-0343 | GTPase activation | GO:0005096 | 76.06 | 98.57 | 98.40 | 0.47 | 92.45 | 99.67 | 99.65 | 0.66 | 86.73 | 99.82 | 99.78 | 0.72 | 61.95 | 99.44 | 99.25 | 0.46 |
| KW-0344 | Guanine-nucleotide releasing factor | GO:0005085 | 74.09 | 98.57 | 98.44 | 0.39 | 83.33 | 99.72 | 99.69 | 0.57 | 89.74 | 99.64 | 99.62 | 0.56 | 93.59 | 99.15 | 98.95 | 0.31 |
| KW-0396 | Initiation factor | GO:0003743 | 96.88 | 98.92 | 98.86 | 0.83 | 91.36 | 99.66 | 99.50 | 0.87 | 74.21 | 99.82 | 99.32 | 0.81 | 77.64 | 99.45 | 97.98 | 0.65 |
| KW-0497 | Mitogen | GO:0051781 | 89.25 | 98.98 | 98.96 | 0.40 | 92.74 | 99.73 | 99.66 | 0.85 | 83.60 | 99.61 | 99.45 | 0.75 | 85.22 | 99.62 | 98.78 | 0.62 |
| KW-0505 | Motor protein | GO:0098840 | 93.38 | 98.96 | 98.91 | 0.63 | 89.47 | 99.75 | 99.72 | 0.69 | 80.70 | 99.86 | 99.80 | 0.72 | 64.04 | 99.45 | 99.25 | 0.46 |
| KW-0514 | Muscle protein | - | 94.22 | 98.95 | 98.92 | 0.57 | 95.38 | 99.75 | 99.73 | 0.74 | 89.23 | 99.69 | 99.65 | 0.67 | 80.00 | 99.60 | 99.32 | 0.51 |
| KW-0515 | Mutator protein | GO:1990633 | 97.65 | 98.97 | 98.97 | 0.42 | 83.82 | 99.79 | 99.76 | 0.60 | 77.94 | 99.84 | 99.80 | 0.61 | 70.59 | 99.45 | 99.32 | 0.38 |
| KW-0568 | Pathogenesis related protein | GO:0009607 | 92.86 | 98.98 | 98.97 | 0.29 | 93.36 | 99.78 | 99.74 | 0.89 | 94.87 | 99.63 | 99.58 | 0.84 | 91.20 | 99.71 | 98.72 | 0.64 |
| KW-0734 | Signal transduction inhibitor | GO:0009968 | 81.25 | 98.97 | 98.94 | 0.31 | 84.62 | 99.71 | 99.69 | 0.45 | 84.62 | 99.68 | 99.66 | 0.43 | 87.18 | 99.63 | 99.54 | 0.34 |
| KW-0786 | Thiamine pyrophosphate binding | - | 97.08 | 98.95 | 98.93 | 0.71 | 96.04 | 99.73 | 99.70 | 0.85 | 87.70 | 99.89 | 99.79 | 0.87 | 74.76 | 99.43 | 98.80 | 0.58 |
| KW-0830 | Ubiquinone binding | - | 98.37 | 98.50 | 98.49 | 0.87 | 94.07 | 99.72 | 99.56 | 0.92 | 82.58 | 99.46 | 98.98 | 0.82 | 91.47 | 99.73 | 97.20 | 0.68 |
| KW-0847 | Vitamin C binding | GO:0031418 | 94.21 | 98.96 | 98.94 | 0.46 | 91.89 | 99.79 | 99.78 | 0.53 | 97.30 | 99.69 | 99.69 | 0.48 | 81.08 | 99.64 | 99.56 | 0.35 |
| UniProt Keyword | Protein Functional Family | Homo Sapiens | Arabidopsis Thaliana | ||||||||
|---|---|---|---|---|---|---|---|---|---|---|---|
| UniProt (%) | SVM (%) | BLAST (%) | PNN (%) | KNN (%) | UniProt (%) | SVM (%) | BLAST (%) | PNN (%) | KNN (%) | ||
| KW-0117 | Actin capping | 0.09 | 0.12 | 0.72 | 0.10 | 0.10 | 0.05 | 0.07 | 0.11 | 0.05 | 0.05 |
| KW-0020 | Allergen | 0.02 | 0.18 | 3.68 | 0.11 | 0.04 | 0.01 | 0.17 | 6.22 | 0.07 | 0.09 |
| KW-0049 | Antioxidant | 0.07 | 0.09 | 0.50 | 0.08 | 0.07 | 0.09 | 0.16 | 1.11 | 0.12 | 0.13 |
| KW-0147 | Chitin-binding | 0.02 | 0.16 | 0.36 | 0.02 | 0.10 | 0.08 | 0.24 | 3.57 | 0.08 | 0.18 |
| KW-0157 | Chromophore | 0.07 | 0.15 | 2.10 | 0.07 | 0.10 | 0.28 | 0.38 | 0.88 | 0.23 | 0.30 |
| KW-0195 | Cyclin | 0.16 | 0.24 | 0.40 | 0.18 | 0.19 | 0.33 | 0.36 | 0.61 | 0.34 | 0.34 |
| KW-0251 | Elongation factor | 0.08 | 0.11 | 0.45 | 0.08 | 0.09 | 0.15 | 0.19 | 0.48 | 0.14 | 0.16 |
| KW-0339 | Growth factor | 0.65 | 0.93 | 2.50 | 0.71 | 0.73 | 0.12 | 0.18 | 0.24 | 0.13 | 0.14 |
| KW-0343 | GTPase activation | 0.97 | 1.19 | 5.47 | 0.93 | 1.02 | 0.28 | 0.24 | 1.36 | 0.21 | 0.23 |
| KW-0344 | Guanine-nucleotide releasing factor | 0.73 | 0.86 | 5.37 | 0.73 | 0.75 | 0.18 | 0.20 | 2.12 | 0.17 | 0.19 |
| KW-0396 | Initiation factor | 0.24 | 0.39 | 1.70 | 0.26 | 0.25 | 0.26 | 0.38 | 1.71 | 0.24 | 0.28 |
| KW-0497 | Mitogen | 0.20 | 0.65 | 4.37 | 0.30 | 0.35 | 0.00 | 0.07 | 0.52 | 0.01 | 0.02 |
| KW-0505 | Motor protein | 0.66 | 0.75 | 4.07 | 0.67 | 0.67 | 0.59 | 0.45 | 2.14 | 0.34 | 0.42 |
| KW-0514 | Muscle protein | 0.31 | 0.42 | 4.35 | 0.37 | 0.39 | 0.00 | 0.17 | 1.26 | 0.11 | 0.13 |
| KW-0515 | Mutator protein | 0.01 | 0.02 | 0.05 | 0.01 | 0.01 | 0.01 | 0.01 | 0.05 | 0.01 | 0.01 |
| KW-0568 | Pathogenesis-related protein | 0.00 | 0.08 | 0.09 | 0.04 | 0.05 | 0.13 | 0.20 | 0.91 | 0.15 | 0.16 |
| KW-0734 | Signal transduction inhibitor | 0.22 | 0.23 | 1.22 | 0.21 | 0.21 | 0.01 | 0.01 | 0.74 | 0.01 | 0.01 |
| KW-0786 | Thiamine pyrophosphate binding | 0.06 | 0.07 | 0.13 | 0.06 | 0.06 | 0.12 | 0.15 | 0.28 | 0.13 | 0.14 |
| KW-0830 | Ubiquinone binding | 0.08 | 0.71 | 0.12 | 0.19 | 0.60 | 0.13 | 0.25 | 0.42 | 0.17 | 0.18 |
| KW-0847 | Vitamin C binding | 0.10 | 0.12 | 0.18 | 0.10 | 0.09 | 0.07 | 0.11 | 0.53 | 0.07 | 0.08 |
© 2018 by the authors. Licensee MDPI, Basel, Switzerland. This article is an open access article distributed under the terms and conditions of the Creative Commons Attribution (CC BY) license (http://creativecommons.org/licenses/by/4.0/).
Share and Cite
Yu, C.Y.; Li, X.X.; Yang, H.; Li, Y.H.; Xue, W.W.; Chen, Y.Z.; Tao, L.; Zhu, F. Assessing the Performances of Protein Function Prediction Algorithms from the Perspectives of Identification Accuracy and False Discovery Rate. Int. J. Mol. Sci. 2018, 19, 183. https://doi.org/10.3390/ijms19010183
Yu CY, Li XX, Yang H, Li YH, Xue WW, Chen YZ, Tao L, Zhu F. Assessing the Performances of Protein Function Prediction Algorithms from the Perspectives of Identification Accuracy and False Discovery Rate. International Journal of Molecular Sciences. 2018; 19(1):183. https://doi.org/10.3390/ijms19010183
Chicago/Turabian StyleYu, Chun Yan, Xiao Xu Li, Hong Yang, Ying Hong Li, Wei Wei Xue, Yu Zong Chen, Lin Tao, and Feng Zhu. 2018. "Assessing the Performances of Protein Function Prediction Algorithms from the Perspectives of Identification Accuracy and False Discovery Rate" International Journal of Molecular Sciences 19, no. 1: 183. https://doi.org/10.3390/ijms19010183
APA StyleYu, C. Y., Li, X. X., Yang, H., Li, Y. H., Xue, W. W., Chen, Y. Z., Tao, L., & Zhu, F. (2018). Assessing the Performances of Protein Function Prediction Algorithms from the Perspectives of Identification Accuracy and False Discovery Rate. International Journal of Molecular Sciences, 19(1), 183. https://doi.org/10.3390/ijms19010183