Article

Functional Testing of SLC26A4 Variants—Clinical and Molecular Analysis of a Cohort with Enlarged Vestibular Aqueduct from Austria

1
Department of Otorhinolaryngology, Head and Neck Surgery, Paracelsus Medical University, Müllner Hauptstraße 48, A-5020 Salzburg, Austria
2
Institute of Pharmacology and Toxicology, Paracelsus Medical University, Strubergasse 21, A-5020 Salzburg, Austria
3
PharmGenetix Gmbh, Sonystrasse 20, A-5081 Niederalm Anif, Austria
4
Department of Otorhinolaryngology, Head & Neck Surgery and Oncology, University Medical Center Hamburg-Eppendorf, Martinistraße 52, D-20251 Hamburg, Germany
5
Center for Health and Bioresources, Austrian Institute of Technology, Muthgasse 11, A-1190 Vienna, Austria
*
Authors to whom correspondence should be addressed.
Int. J. Mol. Sci. 2018, 19(1), 209; https://doi.org/10.3390/ijms19010209
Submission received: 24 November 2017 / Revised: 20 December 2017 / Accepted: 28 December 2017 / Published: 10 January 2018
(This article belongs to the Special Issue Ion Transporters and Channels in Physiology and Pathophysiology)

Abstract

:
The prevalence and spectrum of sequence alterations in the SLC26A4 gene, which codes for the anion exchanger pendrin, are population-specific and account for at least 50% of cases of non-syndromic hearing loss associated with an enlarged vestibular aqueduct. A cohort of nineteen patients from Austria with hearing loss and a radiological alteration of the vestibular aqueduct underwent Sanger sequencing of SLC26A4 and GJB2, coding for connexin 26. The pathogenicity of sequence alterations detected was assessed by determining ion transport and molecular features of the corresponding SLC26A4 protein variants. In this group, four uncharacterized sequence alterations within the SLC26A4 coding region were found. Three of these lead to protein variants with abnormal functional and molecular features, while one should be considered with no pathogenic potential. Pathogenic SLC26A4 sequence alterations were only found in 12% of patients. SLC26A4 sequence alterations commonly found in other Caucasian populations were not detected. This survey represents the first study on the prevalence and spectrum of SLC26A4 sequence alterations in an Austrian cohort and further suggests that genetic testing should always be integrated with functional characterization and determination of the molecular features of protein variants in order to unequivocally identify or exclude a causal link between genotype and phenotype.

1. Introduction

To provide the best possible care for patients affected by hearing loss, and their families, the search for a possible genetic etiology of the disease is mandatory when environmental causes are likely to be excluded. Identification of the genetic cause of deafness provides valuable information for accurate diagnosis, reliable prognosis and precise genetic counseling, and can be essential for some forms of genetic deafness that may become amenable for treatment in the future [1]. Molecular diagnostic based on sequencing of candidate genes plays a major role in this context. However, hearing loss is genetically heterogeneous and, with the exception of syndromic cases, the genotype-phenotype correlation is not straightforward. Furthermore, obtaining sufficient information on the clinical impact of a genetic variant may represent a great challenge [2].
The gap junction-β2 (GJB2) gene, encoding the connexin 26 protein, is the most prevalent gene associated with autosomal recessive non-syndromic hearing loss (ARNSHL) and is responsible for about 50% of cases of genetic deafness in numerous populations [3]. In addition, the causal relation between sequence alterations in the SLC26A4 gene and hereditary hearing loss is firmly established [4,5,6,7]. Pathogenic sequence alterations in SLC26A4 are the second most common cause of ARNSHL in most populations [1,8]. Therefore, in cases that manifest hearing loss, especially congenital sensorineural hearing loss associated with malformations of the inner ear, SLC26A4 variants and their possible clinical implications must be considered in the molecular work-up. However, the actual pathogenic potential of many SLC26A4 sequence alterations identified by genetic testing remains unclear due to a lack or incomplete knowledge about the function of the corresponding protein product.
The SLC26A4 gene encodes for a protein called pendrin (SLC26A4; OMIM (Available online: http://www.ncbi.nlm.nih.gov/omim) #605646), an electroneutral Cl/I/HCO3 anion exchanger [9,10,11] expressed in the inner ear [12] and thyroid [13], among other tissues. Clinical manifestations of functionally impaired SLC26A4 protein variants range from non-syndromic deafness (DFNB4; MIM #600791) to Pendred syndrome (PS; MIM #274600), the second most common type of autosomal recessive syndromic hearing loss [14]. DFNB4 is defined as hereditary hearing loss with the radiologic finding of an enlarged vestibular aqueduct (EVA), and is also referred to as non-syndromic EVA. PS is characterized by defects in the inner ear, with congenital hearing loss and EVA possibly accompanied by vestibular symptoms, as well as in the thyroid, with signs of impaired iodide organification, incompletely penetrant goiter and, occasionally, hypothyroidism [15]. The simultaneous presence of further malformations of the inner ear, in particular the Mondini malformation of the cochlea, are frequently found in the context of DFNB4 or PS [16]. The role of SLC26A4 sequence alterations in determining PS and EVA was firmly established by several studies, either focusing on hearing impairment [17,18], alteration of the vestibular aqueduct [19], suppression of thyroid function [20] or combinations of these clinical manifestations [21]. To date, biallelic mutations of the SLC26A4 gene are considered necessary for the development of PS, while non-syndromic EVA may be found in individuals with one, two or no SLC26A4 mutant alleles [17,22]. The number as well as the type of SLC26A4 mutant alleles has been found to influence the severity of hearing loss [17,18].
The spectrum and prevalence of SLC26A4 mutations in EVA cohorts are ethnic-specific [18,23]. In this context, a literature review [24] underscores the absence of data from Austria, with the exception of isolated case reports [25]. We therefore present the analysis of the SLC26A4 gene in a cohort of nineteen Austrian patients with hearing loss, 18 of whom have unilateral or bilateral EVA and one has bilateral agenesis of the vestibular aqueduct. Four uncharacterized SLC26A4 variants were detected in this cohort, one of them described for the first time, and their pathogenic potential was assessed based on functional and molecular features.

2. Results

2.1. Clinical Features

Clinical information for each individual patient is summarized in Table 1, Tables S1 and S2.

2.2. Detection of Sequence Variations in the GJB2 and SLC26A4 Genes

Sequence variations detected in the GJB2 coding region and in the SLC26A4 exons or intron-exon boundaries are summarized in Table 2. All SLC26A4 sequence variations detected by Sanger sequencing are outlined in Table S3.
Of the four exonic SLC26A4 sequence variations detected in this cohort, one (c.343T>G) is novel, for two (c.343T>G and c.1301C>A) a SNP ID was not assigned (Tables S3 and S4) and all lead to an amino acid substitution within the encoded protein. None of the four corresponding protein variants has been previously characterized on a functional or molecular level.

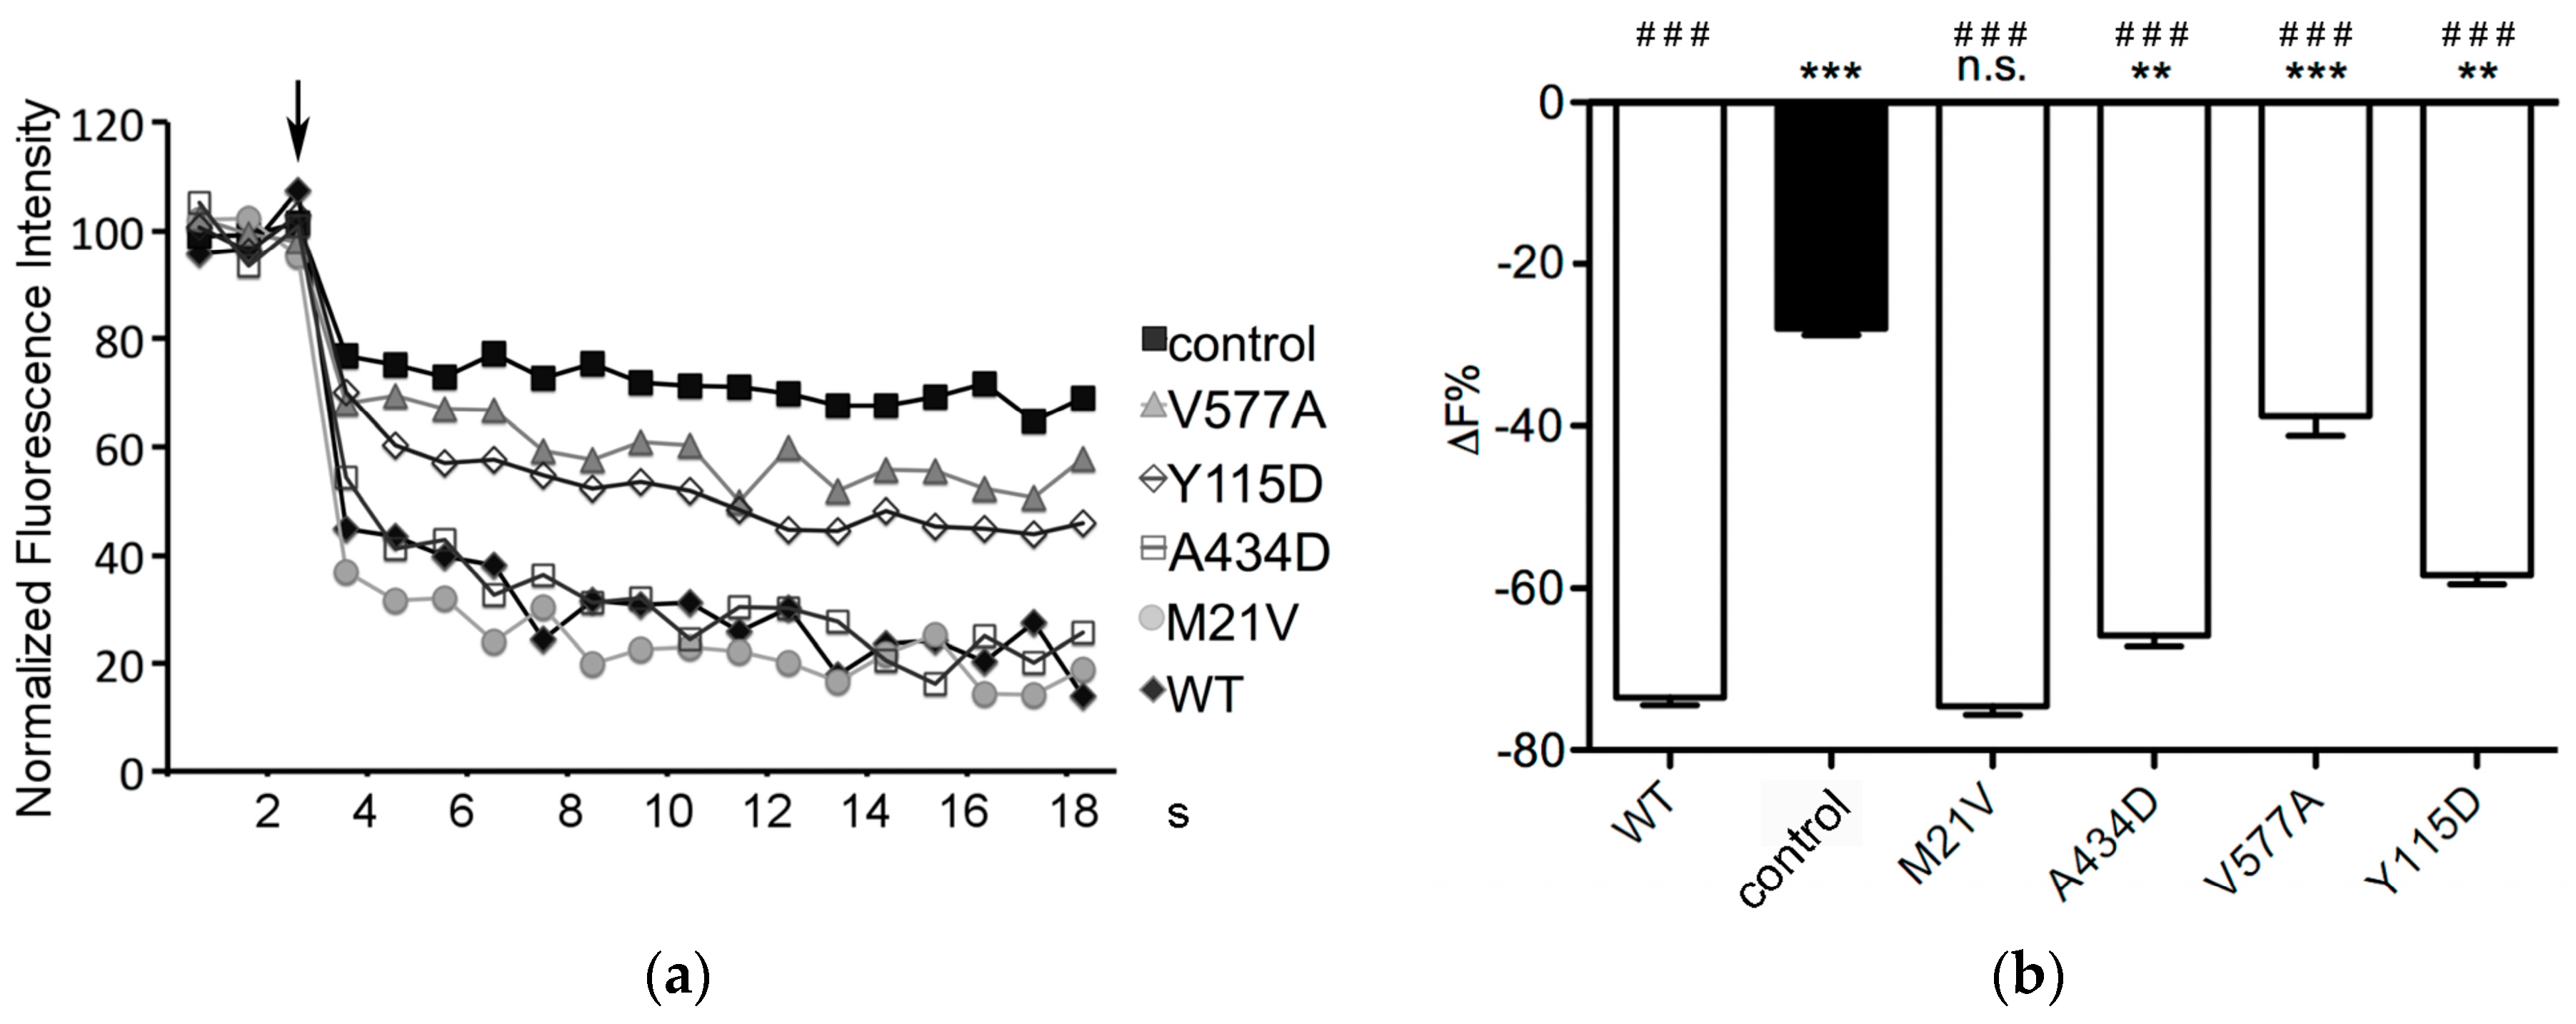
2.3. Function of SLC26A4 Protein Variants

The function of the four pendrin protein variants (p.M21V, p.Y115D, p.A434D and p.V577A) was determined based on the ability of transporting the iodide anion following heterologous expression in HEK 293 Phoenix cells (Figure 1).
Iodide influx measured in cells expressing pendrin p.Y115D, p.A434D or p.V577A was significantly reduced compared to that measured in cells expressing wild type pendrin and significantly higher than that measured in control cells, indicating that the ion transport function of these variants, although not completely lost, is compromised. The transport activity of pendrin p.M21V was indistinguishable from wild type. The results of the functional test are summarized in Table 3.

2.4. Subcellular Localization of Pendrin Variants

To define the subcellular localization of the pendrin variants, their possible co-localization with the plasma membrane (Figure 2) or ER (Figure 3) was determined by confocal imaging following expression in HeLa cells.
Similarly to wild type pendrin, pendrin p.M21V co-localized with the plasma membrane and not with the ER. Conversely, pendrin p.Y115D and p.V577A did not reach the plasma membrane, but did co-localize with the ER. Pendrin p.A434D co-localized with both the plasma membrane and ER. The results of the subcellular localization studies are summarized in Table 3.

2.5. Total and Plasma Membrane Expression Levels of Pendrin Variants

Expression levels of pendrin variants were determined in the whole cell and in the region of the plasma membrane by confocal imaging following expression in HeLa cells. The total expression levels of all of the functionally impaired pendrin variants (p.Y115D, p.A434D and p.V577A) were substantially reduced with respect to those of the wild type. In contrast, the total expression levels of the fully functional pendrin variant p.M21V were not significantly different from the wild type (Figure 4).
Consistent with previous observations [27], expression levels of pendrin variants in the plasma membrane region determined on a single-cell level (Figure 5) mirrored total expression levels. Expression levels of pendrin variants are summarized in Table 3.

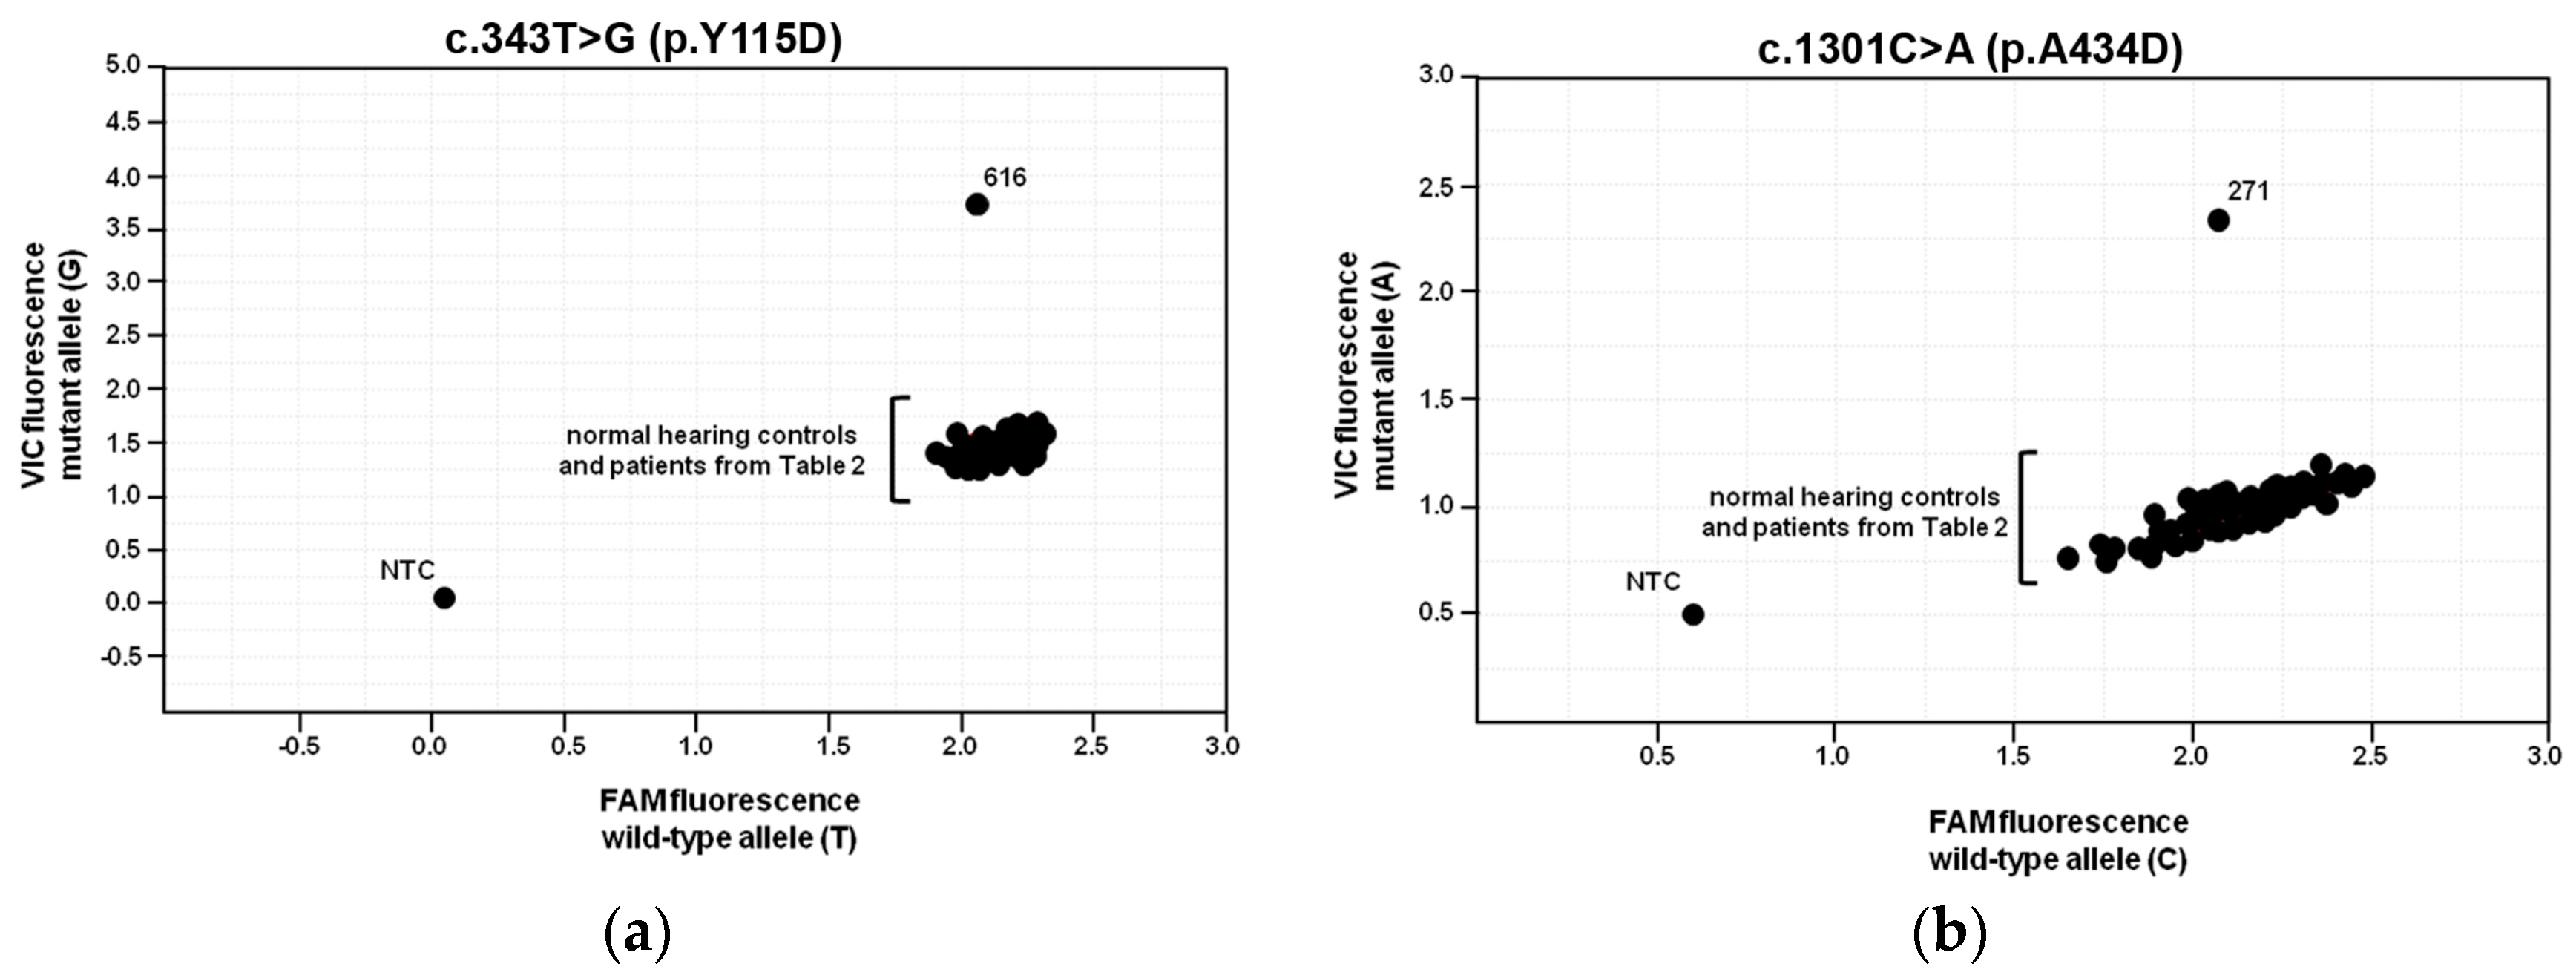
2.6. Population Frequencies of c.343T>G and c.1301C>A

The presence of the two (c.343T>G and c.1301C>A) exonic SLC26A4 sequence variations was assessed in 125 healthy volunteers with no self-reported hearing disorders using custom designed genotyping assays. The genotyping results for patient 616 (heterozygous for c.343T>G) and patient 271 (heterozygous for c.1301C>A) and all other patients outlined in Table 2 (wild-type at both positions) matched that from the Sanger sequencing results, indicating that both custom genotyping assays worked correctly (Figure 6). All of the normal hearing control samples were homozygous wild-type for both sequence variations. The frequency of both sequence variants was 0.69% and each fulfilled the Hardy-Weinberg equilibrium expectation.

3. Discussion

A great diversity of clinical manifestations, in particular audiometric characteristics of hearing loss and vestibular symptoms, typically reported among patients with EVA [28,29,30], was confirmed in our cohort of 19 patients from Austria, including one patient with agenesis of the vestibular aqueduct on both sides (Table 1, Tables S1 and S2). An intraoperative gusher phenomenon of cerebro-spinal fluid during cochlea implant surgery was observed in 7 of 23 operated ears (30.4%) (Table S1), an incidence that is relatively high compared to other groups [31,32]. However, the condition was manageable in all cases by accurate sealing during surgery without any postoperative leakage observed. The incidence was independent from SLC26A4 genotype.
A total of 12 of 19 patients (63.2%), including the patient with agenesis of the vestibular aqueduct, complained of dizziness or vertigo to a certain extent (Table S2). This is in agreement with other reports [29,33]. However, Zalewski et al. [29] concluded that, although vestibular symptoms are commonly found in EVA patients, a causative relation cannot be identified. Vestibular disorders, such as Menière’s disease or vestibular migraine, need to be considered in cases of reported episodic or progressive dizziness or vertigo. Clinical diagnosis of these vestibular disorders is based on clinical findings defined by Lopez-Escamez et al. [34] for Menière’s disease and Lempert et al. [35] for vestibular migraine. None of our patients fulfilled the diagnostic criteria for any of those two diagnoses. None of the patients had a low frequency sensorineural hearing loss. Reported vestibular symptoms did not appear in repeated attacks accompanied by cochlear symptoms, such as tinnitus or aural fullness. Only one patient (patient ID 395) reported headache but not in connection with episodic vertigo and without any sensation of an aura (Table S2). Caloric testing and head impulse testing results are reported in Table S2. Vestibular diagnosis in patients undergoing cochlear implant at our department is done prior to surgery in patients older than 15 years. Therefore, data on vestibular function are not available for all patients. Unfortunately, there is no objective data on vestibular function of patient 271 (bearing biallelic sequence alterations in SLC26A4) due to young age. However, parents did not report difficulties in motor development, giving a clinical hint on adequate vestibular function. Patient 358 reported episodic dizziness and showed symmetric reduction of excitability during caloric testing on both sides. Patient 616 did not show signs of vestibular dysfunction with physiological caloric testing and head impulse test.
Two previously reported GJB2 variants (c.35delG and c.88A>G) were found in our cohort (Table 2). The GJB2 variant c.35delG, leading to premature protein chain termination, was unequivocally established by numerous studies as pathogenic [36,37] and represents the most common cause of hearing loss worldwide [24]. In our cohort, the variant c.35delG was detected in homozygosity in two unrelated Caucasian patients with bilateral EVA and no SLC26A4 sequence alterations, and can reasonably be considered as the genetic determinant of deafness in these individuals (Table 2).
The GJB2 variant c.88A>G leads to the amino acid substitution p.I30V, and was first detected as a single allelic mutation in one patient of a cohort of 324 Taiwanese individuals with prelingual deafness [38]. To our knowledge, no functional or molecular tests for the GJB2 variant p.I30V have been performed. However, bioinformatic predictions indicate that this amino acid change may be tolerated, and the corresponding protein variant may have no pathogenic potential [39]. In our cohort, the c.88A>G GJB2 variant was found in two siblings of Arab descent (patient ID 267 and 308, Table 1 and Table 2) with bilateral EVA, renal tubular acidosis (RTA) and no sequence alterations on the other GJB2 allele. Whether monoallelic GJB2 sequence alterations can be sufficient to determine deafness is currently unclear [37,40]. Importantly, mutations in ATP6V1B1, which encodes the B1-subunit of H+-ATPase, can cause RTA, early onset hearing loss and bilateral EVA [41] and may reasonably account for the pathological phenotype encountered in these two subjects.
Although the link between GJB2 mutations and temporal bone anomalies is not clearly established [42,43], GJB2 variants can be detected in EVA patients with variable prevalence depending on the specific population and the criterion adopted to define EVA [43,44,45]. In our cohort, both patients with biallelic GJB2 mutations (patient ID 307 and 421) presented bilateral EVA, thus supporting a link between GJB2 dysfunction and inner ear malformations. It is possible, however, that the homozygous variant c.35delG determines non-syndromic hearing loss in these patients, which also manifest EVA as the consequence of undetected pathogenic sequence alterations in SLC26A4 or other genes. Of note, both patients show signs of vestibular dysfunction (Table S2) and patient 307 presents the most severe hearing loss phenotype (bilateral complete absence of hearing function) observed in this cohort (Table S1).
Four SLC26A4 variants were found in this cohort (Table 2); for two of them (c.61A>G, SNP ID rs375716219, and c.1730T>C, SNP ID rs56017519) an SNP ID was assigned, however, functional characterization is missing (according to: https://www.ncbi.nlm.nih.gov/snp/, the clinical significance was not assessed for the former and uncertain for the latter, respectively). The other two SLC26A4 variants (c.343T>G and c.1301C>A) are not reported in the SNP database. To assess their pathogenic potential, the functional and molecular features of the corresponding protein variants were assessed by in vitro studies, and the protein variants were subsequently classified according to the American College of Medical Genetics and Genomics Standards and Guidelines [26] (Table 3).
Sequence alterations c.1301C>A and c.1730T>C encoding the pendrin protein variants p.A434D and p.V577A were found in compound heterozygosity in a patient with congenital hearing loss, incomplete partition 2 (IP2) and no sequence alterations in GJB2 (patient ID 271, Table 1 and Table 2). The former sequence alteration was inherited from the mother and the latter from the father, both of whom had normal hearing. Variant p.A434D showed a 16% reduction of iodide transport activity (Figure 1 and Table 3). Following heterologous expression, this variant co-localized with both the plasma membrane (Figure 2) and the ER (Figure 3). The total cellular and plasma membrane expression levels of this variant appear substantially reduced compared to the wild type (Figure 4 and Figure 5), although residual expression (p < 0.001 compared to p.V577A, Figure 4) and partial plasma membrane targeting (Figure 2) allowed for residual transport activity (Figure 1). The functional and molecular defects of variant p.V577A appeared more severe in terms of loss in ion transport function (76% reduction, Figure 1 and Table 3), complete retention in the ER (Figure 2 and Figure 3) and dramatic reduction of expression (Figure 4 and Figure 5). We conclude that both SLC26A4 variants show functional and molecular features compatible with the pathological phenotype of the patient (Table 3). Evidence of thyroid malfunction due to pendrin dysfunction may unequivocally be obtained through perchlorate discharge testing [22]. Assessing the thyroid function by perchlorate testing in this patient was not possible; therefore, definite discrimination between non-syndromic EVA and Pendred syndrome could not be ascertained. Ultrasound of the thyroid gland showed no signs of pathologic volume changes. To date, the patient is eight years old, and manifest goiter may appear in the second decade of life [46,47]. A clinical follow-up will be performed including perchlorate testing when possible.
The SLC26A4 variant c.343T>G was found in heterozygosity with the wild type allele in an individual with fluctuating hearing loss, bilateral EVA and no GJB2 mutations (patient ID 616, Table 1 and Table 2). The corresponding protein variant p.Y115D showed substantially reduced activity and expression levels (Figure 1, Figure 4 and Figure 5 and Table 3), loss of targeting at the plasma membrane and retention within the ER (Figure 2 and Figure 3). The functional and molecular features of this variant are consistent with a pathogenic potential when another dysfunctional allele is present (Table 3). Whether monoallelic pendrin mutations are sufficient to determine a pathological phenotype is currently unclear. Some studies support the hypothesis of a second, undetected SLC26A4 mutation that accounts for EVA in these cases [48,49]. For example, sequence alterations within the promoter or cis-regulatory (enhancer) regions leading to a reduced transcription may per se be insufficient to determine a pathological phenotype, but can be pathogenic in combination with another dysfunctional allele. These sequence alterations may reside in upstream regions distant from SLC26A4, intergenic regions or even other genes [50]. For this patient, the only other sequence alteration in SLC26A4 with an allele frequency <1%, of which the clinical significance was not assessed, was found in the 3’UTR (g.55910G>A, rs375630290, Table S3). Therefore, the genetic cause of deafness for this patient remains undetermined.
For 7 of 19 patients (6 of 18 families, 33%) a family history of hearing loss was recorded (Table S1). The pedigree of these families is presented in Figure S1. No candidate causative variants were identified for these familial cases (as discussed above, the GJB2 variant c.88A>G found in patients 267 and 308 and the SLC26A4 variant c.61A>G found in patient 358 are most likely with no pathogenic potential).
PS/non-syndromic EVA have also been associated with monoallelic sequence alterations in the SLC26A4 and FOXI1 or KCNJ10 genes, with a double-heterozygosity inheritance model [51,52]. FOXI1 (OMIM #601093) is a transcription factor for SLC26A4 [52,53], and KCNJ10 (OMIM #602208) is an inwardly rectifying K+ channel essential for the maintenance of the endocochlear potential [54]. Although later studies showed that sequence alterations in FOXI1 or KCNJ10 are rare in the context of PS/non-syndromic EVA [55,56,57,58], analysis of these genes may be of value in individuals with monoallelic pathogenic SLC26A4 sequence alterations.
SLC26A4 variants with no reduction in ion transport function are found in the general [59,60], deaf with no EVA [59,60] and deaf with EVA [27,61,62,63,64] populations. Including these variants into genotype-phenotype correlation analyses may lead to false conclusions [65]. Therefore, unequivocal assessment of pathogenic potential of a SLC26A4 sequence alteration requires functional studies of the corresponding protein variant. In our cohort, the SLC26A4 variant c.61A>G was found in heterozygosity with the wild type allele in an individual with profound hearing loss, bilateral IP2 and no GJB2 mutations (patient ID 358, Table 1 and Table 2). The corresponding protein variant p.M21V did not show alterations in function (Figure 1), subcellular localization (Figure 2 and Figure 3) or expression levels (Figure 4 and Figure 5) compared to the wild type, and should therefore be considered as having no pathogenic potential (Table 3). No additional sequence alterations with an allele frequency <1% were found in SLC26A4 in this patient (Table S3), therefore pendrin dysfunction most likely does not account for the hearing loss in this patient.
In Caucasian cohorts, approximately 50% of all individuals with unilateral or bilateral hearing loss and EVA carry at least one mutant SLC26A4 allele [22,23,66]. For example, in a cohort of 100 unrelated French individuals with EVA, SLC26A4 mutations (either monoallelic or biallelic) were found in 40% of subjects [67]. In our cohort of 17 unrelated individuals with EVA, only 2 (12%) presented at least one pathogenic SLC26A4 allele (p = 0.02 compared to the above mentioned French cohort). Therefore, SLC26A4 mutations seem to be under-represented in our cohort, thus indicating that additional genes may be involved in determining EVA in the Austrian population.
The spectrum of SLC26A4 variants is strictly related to the ethnicity of patients. The c.1001+1G>A, p.V138F, p.T416P, p.L236P and p.G209V pathogenic variants are prevalent in the Caucasian population, with p.V138F being predominant in Germany and Czech Republic, two countries geographically close to Austria [24]. None of these mutations were found in our cohort. Indeed, a novel pathogenic variant (p.Y115D) was detected. The novel pathogenic variant was not detected in 125 population-matched healthy control individuals (Figure 6). In addition, the previously reported SLC26A4 variants found in our cohort (p.M21V and p.V577A) are not frequently found in the general population—according to: https://www.ncbi.nlm.nih.gov/snp/, the minor allele frequency (MAF) is 0.0042% for c.61A>G (p.M21V), SNP ID: rs375716219, and 0.001647% for c.1730T>C (p.V577A), SNP ID: rs56017519, respectively (Table S4)—nor in deaf individuals [24]. The MAF of all four exonic SLC26A4 variants (Table S4) is lower than 0.005, a threshold value for pathogenic autosomal-recessive variants suggested by Shearer et al. [68]. These observations underscore that SLC26A4 variants found in our cohort, including the variant characterized as non-pathogenic in this work, are uncommon in the general population. Therefore, in terms of prevalence and spectrum of SLC26A4 mutations, the Austrian population seems to present characteristics distinct from those of other Caucasian-European groups. Expansion of the cohort subject of this study will be essential to establish if the pathogenic SLC26A4 allelic variants more commonly found in Caucasians are either rare or absent in the Austrian population.

4. Materials and Methods

4.1. Patients

Eighteen Austrian subjects (10 females and 8 males aged between 8 and 51 years; average age 27 years) diagnosed with sensorineural (n = 16), mixed (n = 1) or conductive (n = 1) hearing loss and EVA, as well as one subject with agenesis of the vestibular aqueduct (patient ID 365) were included in the study (Table 1). Of these, two (patient ID 267 and 308) were siblings of Arab origin. All the other patients were unrelated subjects of Caucasian, or mixed Caucasian and African (patient ID 395) ethnicity. The research was prospectively reviewed and approved by a duly constituted ethics committee (415-E/2092/6-2017, 9 May 2017) and has therefore been performed in accordance with the principles embodied in the 1964 Declaration of Helsinki and its later amendments (Available online: https://www.wma.net/policies-post/wma-declaration-of-helsinki-ethical-principles-for-medical-research-involving-human-subjects/). Written informed consent was obtained from all subjects or their legal representatives prior to blood sampling and genetic testing. For all patients, imaging studies of the inner ear by computer tomography (CT) of the temporal bones were performed. EVA was defined as an enlargement of the vestibular aqueduct ≥1.5 mm midway between the endolymphatic sac and the vestibule. An abnormal cochlea was considered as Mondini malformation in cases of a normal basal turn and cavity-like appearing distal turns with a missing interscalar ridge between the basal turn and the distal turns on the axial plane of the CT scan [69]. IP2 was defined as the combination of EVA and Mondini malformation [70]. None of the patients presented overt goiter or alterations of clinical or laboratory thyroid functional parameters. Individual characterization of hearing loss (HL) was based on side-specific pure-tone audiometric testing results, as well as the patient’s history. The type of HL was defined as conductive, mixed or sensorineural based on air- and bone-conduction thresholds. The severity of HL was classified on decibel hearing level (dB HL) thresholds, either as mild for values between 26 and 40 dB HL, moderate between 41 and 60 dB HL, severe between 61 and 80 dB HL or profound for values above 80 dB HL. Ears with no perception at all were considered as deaf. Frequencies possibly affected by HL were divided into low, middle or high frequency range. Onset of HL was defined through patient’s history, since newborn screening tests were either not performed or results were not available. Related to the time of speech development, the onset of HL was defined as congenital, prelingual, perilingual or postlingual. Clinical course of HL with possible hearing drops was obtained through audiometric tests and patient’s history. Surgical reports were screened for intraoperative gusher phenomenon, defined as visible efflux of cerebro-spinal fluid after cochleostomy, during cochlear implant surgery.

4.2. Genomic DNA Samples

Patient whole blood was collected in plastic tubes with potassium-ethylenediaminetetraacetic acid (S-Monovette®, Sarstedt, Nümbrecht, Germany) via venipuncture. Total genomic DNA (gDNA) was purified from ~350 μL blood with the EZ1 DNA Blood 350 μL kit (Qiagen, Hilden, Germany) using the EZ1 Advanced XL platform (Qiagen) according to the manufacturer’s instructions. Quantification was performed with the QIAxpert (Qiagen) spectrophotometer. Only samples with an A260/A280 between 1.7 and 1.9 were used for downstream analysis.

4.3. Genomic DNA Analysis

Fifty μL endpoint polymerase chain reaction (PCR) reactions for amplifying different areas of the SLC26A4 gene contained 1× JumpStart REDAccuTaq Long and Accurate (JS RAT LA) DNA Polymerase buffer (Sigma-Aldrich, St. Louis, MO, USA), 1 mM dNTPs (Thermo Fisher Scientific; Waltham, MA, USA), 10% dimethyl sulfoxide (Sigma-Aldrich), 0.8 μM forward and reverse primers and 5 units JS RAT LA DNA Polymerase (Sigma-Aldrich). Amplification and sequencing primers and cycling parameters are described in Table S5.
The entire coding region of GJB2 (exon 2) was amplified by PCR as described above using the following primers: forward, 5′ CACGTTCAAGAGGGTTTG 3′, and reverse, 5′ TGAGCCTTGACAGCTGAGC 3′. The same primers were used for sequencing.
The PCR products were purified and Sanger sequenced (Microsynth AG, Balgach, Switzerland). The resulting sequences were compared against the NCBI Homo sapiens GJB2 (OMIM ID: 121011, GenBank ID: NG_008358.1) or SLC26A4 (OMIM ID: 605646, NCBI ID: AC078937.1) DNA sequence reference assembly.

4.4. Plasmid Constructs

The pTARGET (Promega Corporation, Madison, WI, USA) vector, containing the cDNA of wild type or mutated human pendrin [9], was used for functional tests.
The pEYFPN1 vector (Clontech, Mountain View, CA, USA), containing the cDNA of wild type or mutated human pendrin, was used for co-localization and determination of pendrin expression levels via imaging. Following transfection of this construct in cells, pendrin is produced with the enhanced yellow fluorescent protein (EYFP) fused to its C-terminus [27].
Sequence alterations in the cDNA of pendrin were obtained using the QuikChange® site-directed mutagenesis kit (Stratagene, La Jolla, CA, USA) and the primers listed in the Table S6.
The sequence of all plasmid inserts was verified by Sanger sequencing (Microsynth AG).

4.5. Cell Lines

Human embryonic kidney (HEK) 293 Phoenix [71] and HeLa (cervical adenocarcinoma, CCL-2, American Type Cell Culture Collection, Manassas, VA, USA) cells were cultured as previously described [9,27].

4.6. Pendrin Functional Test

For testing the function of pendrin variants, the influx of iodide was measured in cells expressing wild type or mutated pendrin and in control cells. The functional test was performed as already described [9,59,72,73], with adaptations allowing for the use of a multiplate reader [27,60,74,75,76]. Shortly, cells were seeded into black 96-well plates, grown overnight and co-transfected with 0.1 μg of a plasmid encoding for EYFP H148Q;I152L (an EYFP variant with substantially improved sensitivity for iodide [77]) and 0.1 μg of pTARGET plasmid bearing the cDNA of wild type or mutated pendrin. Control cells were co-transfected with EYFP H148Q;I152L and the empty pTARGET vectors. Transfection was done by the calcium phosphate co-precipitation method. Experiments were performed at room temperature 48 h post-transfection. Cells were initially bathed in 70 μL of high chloride solution (in mM: KCl 2, NaCl 135, CaCl2 1, MgCl2 1, d-glucose 10, 4-(2-hydroxyethyl)-1-piperazineethane sulfonic acid (HEPES) 20, 308 mOsm/KgH2O with mannitol, pH 7.4), and the baseline fluorescence intensity was measured (1 measurement/s for 3 s). Subsequently, 140 μL of high iodide solution (in mM: KCl 2, NaI 135, CaCl2 1, MgCl2 1, d-glucose 10, HEPES 20, 308 mOsm/KgH2O with mannitol, pH 7.4) were injected into each well and the fluorescence intensity was measured again (1 measurement/s for 16 s). Owing on the chloride/iodide exchanger activity of pendrin [9,10,11], iodide enters the cytosol of pendrin-expressing cells from the extracellular medium and leads to a decrease of EYFP H148Q;I152L fluorescence. Therefore, negative % fluorescence variations (ΔF%) indicate a flux of iodide from the extracellular to the intracellular milieu and reflect pendrin transport efficiency.
Fluorescence intensity was quantified with the VICTORTM X3 Multilabel Plate Reader (Perkin Elmer, Waltham, MA, USA) equipped with a liquid dispenser and the following filters: excitation: F485 (excitation center wavelength (CWL): 485 nm, bandwidth: 14 nm), emission: F535 (emission CWL: 535 nm, bandwidth: 25 nm).

4.7. Co-Localization Experiments

HeLa cells were seeded into 6-well plates, grown overnight, transfected with 1.5 μg of plasmid DNA and 3 µL of Metafectene Pro (Biontex, München, Germany), transferred on glass slides for microscopy (48 h post-transfection) and imaged (72 h post-transfection).
Subcellular localization of pendrin variants was determined by co-localization between wild type or mutant SLC26A4 with EYFP fused to the C-terminus and markers of the plasma membrane (CellMaskTM Deep Red plasma membrane stain, C10046, Invitrogen Molecular Probes, Waltham, MA, USA) or endoplasmic reticulum (ER) (ER-TrackerTM Red, BODIPYTM TR glibenclamide, E34250, Invitrogen Molecular Probes).
To stain the plasma membrane, living cells were washed thrice with ice-cold Hank’s balanced salt solution (HBSS, Sigma-Aldrich), incubated on ice for 5 min with 1.25 µg/mL CellMaskTM Deep Red plasma membrane stain in HBSS, washed again thrice with ice-cold HBSS and imaged immediately in HBSS.
To stain the ER, living cells were washed thrice with room temperature HBSS, incubated for 20 min at 37 °C and 5% CO2 with 1 µM ER-TrackerTM Red in Krebs-Henseleit buffer (Sigma-Aldrich), washed again thrice and immediately imaged in HBSS at room temperature.
Co-localization was detected and quantified as previously described [27]. Shortly, imaging was performed by sequential acquisition with a Leica TCS SP5II AOBS confocal microscope (Leica Microsystems, Wetzlar, Germany) equipped with a HCX PL APO 63×/1.20 Lambda blue water immersion objective and controlled by the LAS AF SP5 software (Leica Microsystems). For co-localization with the plasma membrane, EYFP was excited with the 514 nm line of the Argon laser and emission was detected in the 525–600 nm range; the CellMaskTM Deep Red stain was excited at 633 nm (Helium Neon laser) and emission was detected in the 655–750 nm range. For co-localization with the ER, EYFP was excited with the 514 nm line of the Argon laser and emission was detected in the 525–555 nm range; ER-TrackerTM Red was excited at 561 nm (diode-pumped solid-state (DPSS) laser) and emission was detected in the 571–650 nm range. Co-localization with plasma membrane or ER markers was quantified and expressed as the Pearson’s correlation coefficient [78], overlap coefficient and co-localization rate. The co-localization parameters of wild type pendrin were considered as indicators of a preferential co-localization with the plasma membrane and poor co-localization with the ER.

4.8. Determination of Wild Type and Mutant Pendrin Total Expression Levels by Imaging

Determination of total expression levels of pendrin variants was performed as previously described [27]. Shortly, HeLa cells expressing wild type or mutant SLC26A4 with EYFP fused to the C-terminus were fixed with 4% paraformaldehyde for 30 min, counterstained with 0.1 μg/mL 4′,6-diamidino-2-phenylindole (DAPI) for 10 min, washed and imaged in HBSS. Wild type or mutant SLC26A4 expression levels, given by the fluorescence intensity of EYFP, were normalized for the cell density, given by the fluorescence intensity of DAPI. Imaging was performed by confocal microscopy as described above. EYFP was excited with the 514 nm line of the Argon laser and emission was detected between 525 and 600 nm; DAPI was excited with a diode laser (405 nm) and emission was detected between 430 and 470 nm. Laser power and photomultipliers gain were kept rigorously constant for acquisition of all images.

4.9. Determination of Wild Type and Mutant Pendrin Expression Levels in the Plasma Membrane Region

Determination of expression levels of pendrin variants in the region of the plasma membrane was performed as previously described [27]. Shortly, HeLa cells expressing wild type or mutant SLC26A4 with EYFP fused to the C-terminus and the enhanced cyan fluorescent protein (ECFP) (pECFPC1 vector, Clontech) were stained with CellMaskTM Deep Red plasma membrane stain, washed and imaged in HBSS. EYFP fluorescence intensity of three regions of interest of the plasma membrane of a single cell was corrected for the background fluorescence, averaged and normalized for the background-subtracted ECFP fluorescence intensity measured in the cytosol of the same cell, to obtain wild type or mutant SLC26A4 expression levels normalized for the transfection efficiency of the single cell. Imaging was performed by confocal microscopy as described above. EYFP was excited with the 514 nm line of the Argon laser and emission was detected between 525 and 580 nm. ECFP was excited with a diode laser (405 nm) and emission was detected between 450 and 490 nm. CellMaskTM Deep Red stain was excited at 633 nm (HeNe laser) and emission was detected in the 643–750 nm range. Laser power and photomultipliers gain were kept rigorously constant for acquisition of all images.

4.10. Sequence Variation Genotyping Assays

Ten μL end-point genotyping reactions containing 1× TaqMan® Universal PCR Master Mix no AmpErase® UNG, 1× hydrolysis probe assay and 13.5 ng gDNA were performed in MicroAmp® Optical 384-well Reaction Plates on the QuantStudio™ 12K Flex Real-Time PCR System (all from Thermo Fisher Scientific). Cycling parameters were: 60 °C for 30 s, 95 °C for 10 min., followed by 50 cycles of 92 °C for 15 s and 60 °C for 90 s, and a final 30 s at 60 °C. The two hydrolysis probe assays used in the 384-well format targeted SLC26A4 c.343T>G and c.1301C>A and were custom designed and manufactured by Thermo Fisher Scientific.

4.11. Salts and Chemicals

All salts and chemicals used were of pro analysis grade.

4.12. Statistical Analysis

All data are expressed as arithmetic means ± SEM and analyzed with GraphPad Prism software (version 4.00 for Windows, GraphPad Software, San Diego, CA, USA). Significant differences between data sets were verified by one way Analysis of Variance (ANOVA) with Bonferroni’s or Dunnet’s post-tests, or by the Fisher exact test, as appropriate. A p value < 0.05 was considered as statistically significant; (n) corresponds to the number of independent measurements. To determine departure from Hardy-Weinberg equilibrium, a chi-squared test with one degree of freedom was used.

5. Conclusions

To conclude, we presented the first characterization of a cohort of Austrian deaf patients with EVA. Biallelic GJB2 and SLC26A4 sequence variations with functional impact could be identified as the genetic determinant of deafness for two and one patient, respectively. Prevalence and spectrum of SLC26A4 pathogenic variants are distinct from other Caucasian cohorts. Specifically, SLC26A4 pathogenic variants seem to be under-represented in this cohort, thus providing an imperative towards the investigation of additional genes and/or genomic regions that may be involved in determining deafness and EVA. High throughput sequencing technologies, such as whole exome sequencing, would be of great value in this context. Further, this study underscores the importance of integrating genetic analysis, functional testing and identification of molecular features of protein variants to unambiguously identify or exclude the genetic cause of deafness.

Supplementary Materials

Supplementary materials can be found at www.mdpi.com/1422-0067/19/1/209/s1.

Acknowledgments

This work was supported in part by the Paracelsus Medical University Research Fund—PMU FFF: #L-16/04/005-ROS to Sebastian Roesch. We would sincerely like to thank the participants in this study and their families. Also, we gratefully acknowledge the expert secretarial assistance of Elisabeth Mooslechner, as well as laboratory assistance of Michaela Zopf and Markus Kwik.

Author Contributions

Charity Nofziger, Wolfgang Patsch, Gerd Rasp, Markus Paulmichl and Silvia Dossena conceived and designed the experiments; Sebastian Roesch, Emanuele Bernardinelli, Charity Nofziger and Silvia Dossena performed the experiments; Emanuele Bernardinelli, Charity Nofziger and Silvia Dossena analyzed and all authors interpreted the data; Sebastian Roesch and Silvia Dossena wrote and all authors revised the paper.

Conflicts of Interest

The authors declare no conflict of interest.

Abbreviations

ARNSHLAutosomal Recessive Non-Syndromic Hearing Loss
ATP6V1B1ATPase H+ Transporting V1 Subunit B1
CTComputed Tomography
DFNB4Deafness B4
ECFPEnhanced Cyan Fluorescent Protein
EREndoplasmic Reticulum
EVAEnlarged Vestibular Aqueduct
EYFPEnhanced Yellow Fluorescent Protein
FOXI1Forkhead Box I1
GJB2Gap Junction Protein β2
HBSSHank’s Balanced Salt Solution
IP2Incomplete Partition 2
KCNJ10Potassium Channel, Inwardly Rectifying, Subfamily J, Member 10
MAFMinor Allele Frequency
PSPendred Syndrome
RTARenal Tubular Acidosis
SLC26A4Solute Carrier Family 26 Member A4
SNPSingle Nucleotide Polymorphism

References

  1. Da Silva Costa, S.M.; Ramos, P.Z.; Arrojo Martins, F.T.; Sartorato, E.L. Genetic Diagnosis of Deafness. In The Role of Pendrin in Health and Disease; Dossena, S., Paulmichl, M., Eds.; Springer International Publishing: Basel, Switzerland, 2017; pp. 61–83. [Google Scholar]
  2. Rehm, H.L. Disease-targeted sequencing: A cornerstone in the clinic. Nat. Rev. Genet. 2013, 14, 295–300. [Google Scholar] [CrossRef] [PubMed]
  3. Kenneson, A.; Van Naarden Braun, K.; Boyle, C. GJB2 (connexin 26) variants and nonsyndromic sensorineural hearing loss: A HuGE review. Genet. Med. 2002, 4, 258–274. [Google Scholar] [CrossRef] [PubMed]
  4. Everett, L.A.; Glaser, B.; Beck, J.C.; Idol, J.R.; Buchs, A.; Heyman, M.; Adawi, F.; Hazani, E.; Nassir, E.; Baxevanis, A.D.; et al. Pendred syndrome is caused by mutations in a putative sulphate transporter gene (PDS). Nat. Genet. 1997, 17, 411–422. [Google Scholar] [CrossRef] [PubMed]
  5. Alasti, F.; Van Camp, G.; Smith, R.J.H. Pendred Syndrome/DFNB4. In GeneReviews(R); Pagon, R.A., Adam, M.P., Ardinger, H.H., Wallace, S.E., Amemiya, A., Bean, L.J.H., Bird, T.D., Ledbetter, N., Mefford, H.C., Smith, R.J.H., et al., Eds.; University of Washington: Seattle, WA, USA, 1993. [Google Scholar]
  6. Ito, T.; Muskett, J.; Chattaraj, P.; Choi, B.Y.; Lee, K.Y.; Zalewski, C.K.; King, K.A.; Li, X.; Wangemann, P.; Shawker, T.; et al. SLC26A4 mutation testing for hearing loss associated with enlargement of the vestibular aqueduct. World J. Otorhinolaryngol. 2013, 3, 26–34. [Google Scholar] [CrossRef] [PubMed]
  7. Roesch, S.; Tóth, M.; Rasp, G. Pendrin-Linked Deafness in Humans. In The Role of Pendrin in Health and Disease; Dossena, S., Paulmichl, M., Eds.; Springer International Publishing: Basel, Switzerland, 2017; pp. 37–60. [Google Scholar]
  8. Hilgert, N.; Smith, R.J.; Van Camp, G. Forty-six genes causing nonsyndromic hearing impairment: Which ones should be analyzed in DNA diagnostics? Mutat. Res. 2009, 681, 189–196. [Google Scholar] [CrossRef] [PubMed]
  9. Dossena, S.; Rodighiero, S.; Vezzoli, V.; Bazzini, C.; Sironi, C.; Meyer, G.; Furst, J.; Ritter, M.; Garavaglia, M.L.; Fugazzola, L.; et al. Fast fluorometric method for measuring pendrin (SLC26A4) Cl/I transport activity. Cell. Physiol. Biochem. 2006, 18, 67–74. [Google Scholar] [CrossRef] [PubMed]
  10. Yoshida, A.; Hisatome, I.; Taniguchi, S.; Sasaki, N.; Yamamoto, Y.; Miake, J.; Fukui, H.; Shimizu, H.; Okamura, T.; Okura, T.; et al. Mechanism of iodide/chloride exchange by pendrin. Endocrinology 2004, 145, 4301–4308. [Google Scholar] [CrossRef] [PubMed]
  11. Shcheynikov, N.; Yang, D.; Wang, Y.; Zeng, W.; Karniski, L.P.; Therefore, I.; Wall, S.M.; Muallem, S. The Slc26a4 transporter functions as an electroneutral Cl/I/HCO3 exchanger: Role of Slc26a4 and Slc26a6 in I and HCO3 secretion and in regulation of CFTR in the parotid duct. J. Physiol. 2008, 586, 3813–3824. [Google Scholar] [CrossRef] [PubMed]
  12. Everett, L.A.; Morsli, H.; Wu, D.K.; Green, E.D. Expression pattern of the mouse ortholog of the Pendred’s syndrome gene (Pds) suggests a key role for pendrin in the inner ear. Proc. Natl. Acad. Sci. USA 1999, 96, 9727–9732. [Google Scholar] [CrossRef] [PubMed]
  13. Royaux, I.E.; Suzuki, K.; Mori, A.; Katoh, R.; Everett, L.A.; Kohn, L.D.; Green, E.D. Pendrin, the protein encoded by the Pendred syndrome gene (PDS), is an apical porter of iodide in the thyroid and is regulated by thyroglobulin in FRTL-5 cells. Endocrinology 2000, 141, 839–845. [Google Scholar] [CrossRef] [PubMed]
  14. Shearer, A.E.; Hildebrand, M.S.; Smith, R.J.H. Hereditary hearing loss and deafness overview. In GeneReviews((R)); Adam, M.P., Ardinger, H.H., Pagon, R.A., Wallace, S.E., Bean, L.J.H., Mefford, H.C., Stephens, K., Amemiya, A., Ledbetter, N., Eds.; University of Washington: Seattle, WA, USA, 1993. [Google Scholar]
  15. Fraser, G.R. Association of congenital deafness with goitre (Pendred’s syndrome) a study of 207 families. Ann. Hum. Genet. 1965, 28, 201–249. [Google Scholar] [CrossRef] [PubMed]
  16. Phelps, P.D.; Coffey, R.A.; Trembath, R.C.; Luxon, L.M.; Grossman, A.B.; Britton, K.E.; Kendall-Taylor, P.; Graham, J.M.; Cadge, B.C.; Stephens, S.G.; et al. Radiological malformations of the ear in Pendred syndrome. Clin. Radiol. 1998, 53, 268–273. [Google Scholar] [CrossRef]
  17. King, K.A.; Choi, B.Y.; Zalewski, C.; Madeo, A.C.; Manichaikul, A.; Pryor, S.P.; Ferruggiaro, A.; Eisenman, D.; Kim, H.J.; Niparko, J.; et al. SLC26A4 genotype, but not cochlear radiologic structure, is correlated with hearing loss in ears with an enlarged vestibular aqueduct. Laryngoscope 2010, 120, 384–389. [Google Scholar] [CrossRef] [PubMed]
  18. Rah, Y.C.; Kim, A.R.; Koo, J.W.; Lee, J.H.; Oh, S.H.; Choi, B.Y. Audiologic presentation of enlargement of the vestibular aqueduct according to the SLC26A4 genotypes. Laryngoscope 2015, 125, E216–E222. [Google Scholar] [CrossRef] [PubMed]
  19. Greinwald, J.; DeAlarcon, A.; Cohen, A.; Uwiera, T.; Zhang, K.; Benton, C.; Halstead, M.; Meinzen-Derr, J. Significance of unilateral enlarged vestibular aqueduct. Laryngoscope 2013, 123, 1537–1546. [Google Scholar] [CrossRef] [PubMed]
  20. Soh, L.M.; Druce, M.; Grossman, A.B.; Differ, A.M.; Rajput, L.; Bitner-Glindzicz, M.; Korbonits, M. Evaluation of genotype-phenotype relationships in patients referred for endocrine assessment in suspected Pendred syndrome. Eur. J. Endocrinol. 2015, 172, 217–226. [Google Scholar] [CrossRef] [PubMed]
  21. Muskett, J.A.; Chattaraj, P.; Heneghan, J.F.; Reimold, F.R.; Shmukler, B.E.; Brewer, C.C.; King, K.A.; Zalewski, C.K.; Shawker, T.H.; Butman, J.A.; et al. Atypical patterns of segregation of familial enlargement of the vestibular aqueduct. Laryngoscope 2016, 126, E240–E247. [Google Scholar] [CrossRef] [PubMed]
  22. Pryor, S.P.; Madeo, A.C.; Reynolds, J.C.; Sarlis, N.J.; Arnos, K.S.; Nance, W.E.; Yang, Y.; Zalewski, C.K.; Brewer, C.C.; Butman, J.A.; et al. SLC26A4/PDS genotype-phenotype correlation in hearing loss with enlargement of the vestibular aqueduct (EVA): Evidence that Pendred syndrome and non-syndromic EVA are distinct clinical and genetic entities. J. Med. Genet. 2005, 42, 159–165. [Google Scholar] [CrossRef] [PubMed]
  23. Chattaraj, P.; Reimold, F.R.; Muskett, J.A.; Shmukler, B.E.; Chien, W.W.; Madeo, A.C.; Pryor, S.P.; Zalewski, C.K.; Butman, J.A.; Brewer, C.C.; et al. Use of SLC26A4 mutation testing for unilateral enlargement of the vestibular aqueduct. JAMA Otolaryngol. Head Neck Surg. 2013, 139, 907–913. [Google Scholar] [CrossRef] [PubMed]
  24. Tsukada, K.; Nishio, S.Y.; Hattori, M.; Usami, S. Ethnic-specific spectrum of GJB2 and SLC26A4 mutations: Their origin and a literature review. Ann. Otol. Rhinol. Laryngol. 2015, 124, 61S–76S. [Google Scholar] [CrossRef] [PubMed]
  25. Wolf, A.; Frohne, A.; Allen, M.; Parzefall, T.; Koenighofer, M.; Schreiner, M.M.; Schoefer, C.; Frei, K.; Lucas, T. A novel mutation in SLC26A4 causes nonsyndromic autosomal recessive hearing impairment. Otol. Neurotol. 2017, 38, 173–179. [Google Scholar] [CrossRef] [PubMed]
  26. Richards, S.; Aziz, N.; Bale, S.; Bick, D.; Das, S.; Gastier-Foster, J.; Grody, W.W.; Hegde, M.; Lyon, E.; Spector, E.; et al. Standards and guidelines for the interpretation of sequence variants: A joint consensus recommendation of the American College of Medical Genetics and Genomics and the Association for Molecular Pathology. Genet. Med. 2015, 17, 405–424. [Google Scholar] [CrossRef] [PubMed]
  27. De Moraes, V.C.; Bernardinelli, E.; Zocal, N.; Fernandez, J.A.; Nofziger, C.; Castilho, A.M.; Sartorato, E.L.; Paulmichl, M.; Dossena, S. Reduction of cellular expression levels is a common feature of functionally affected pendrin (SLC26A4) protein variants. Mol. Med. 2016. [Google Scholar] [CrossRef] [PubMed]
  28. Noordman, B.J.; van Beeck Calkoen, E.; Witte, B.; Goverts, T.; Hensen, E.; Merkus, P. Prognostic factors for sudden drops in hearing level after minor head injury in patients with an enlarged vestibular aqueduct: A meta-analysis. Otol. Neurotol. 2015, 36, 4–11. [Google Scholar] [CrossRef] [PubMed]
  29. Zalewski, C.K.; Chien, W.W.; King, K.A.; Muskett, J.A.; Baron, R.E.; Butman, J.A.; Griffith, A.J.; Brewer, C.C. Vestibular dysfunction in patients with enlarged vestibular aqueduct. Otolaryngol. Head Neck Surg. 2015, 153, 257–262. [Google Scholar] [CrossRef] [PubMed]
  30. Noguchi, Y.; Fukuda, S.; Fukushima, K.; Gyo, K.; Hara, A.; Nakashima, T.; Ogawa, K.; Okamoto, M.; Sato, H.; Usami, S.I.; et al. A nationwide study on enlargement of the vestibular aqueduct in Japan. Auris Nasus Larynx 2017, 44, 33–39. [Google Scholar] [CrossRef] [PubMed]
  31. Kim, B.G.; Sim, N.S.; Kim, S.H.; Kim, U.K.; Kim, S.; Choi, J.Y. Enlarged cochlear aqueducts: A potential route for CSF gushers in patients with enlarged vestibular aqueducts. Otol. Neurotol. 2013, 34, 1660–1665. [Google Scholar] [CrossRef] [PubMed]
  32. Manzoor, N.F.; Wick, C.C.; Wahba, M.; Gupta, A.; Piper, R.; Murray, G.S.; Otteson, T.; Megerian, C.A.; Semaan, M.T. Bilateral sequential cochlear implantation in patients with enlarged vestibular aqueduct (EVA) syndrome. Otol. Neurotol. 2016, 37, e96–e103. [Google Scholar] [CrossRef] [PubMed]
  33. Grimmer, J.F.; Hedlund, G. Vestibular symptoms in children with enlarged vestibular aqueduct anomaly. Int. J. Pediatr. Otorhinolaryngol. 2007, 71, 275–282. [Google Scholar] [CrossRef] [PubMed]
  34. Lopez-Escamez, J.A.; Carey, J.; Chung, W.H.; Goebel, J.A.; Magnusson, M.; Mandala, M.; Newman-Toker, D.E.; Strupp, M.; Suzuki, M.; Trabalzini, F.; et al. Diagnostic criteria for Meniere’s disease. J. Vestib. Res. 2015, 25, 1–7. [Google Scholar] [CrossRef] [PubMed]
  35. Lempert, T.; Olesen, J.; Furman, J.; Waterston, J.; Seemungal, B.; Carey, J.; Bisdorff, A.; Versino, M.; Evers, S.; Newman-Toker, D. Vestibular migraine: Diagnostic criteria. J. Vestib. Res. 2012, 22, 167–172. [Google Scholar] [CrossRef] [PubMed]
  36. Zelante, L.; Gasparini, P.; Estivill, X.; Melchionda, S.; D’Agruma, L.; Govea, N.; Mila, M.; Monica, M.D.; Lutfi, J.; Shohat, M.; et al. Connexin26 mutations associated with the most common form of non-syndromic neurosensory autosomal recessive deafness (DFNB1) in Mediterraneans. Hum. Mol. Genet. 1997, 6, 1605–1609. [Google Scholar] [CrossRef] [PubMed]
  37. Azaiez, H.; Chamberlin, G.P.; Fischer, S.M.; Welp, C.L.; Prasad, S.D.; Taggart, R.T.; del Castillo, I.; Van Camp, G.; Smith, R.J. GJB2: The spectrum of deafness-causing allele variants and their phenotype. Hum. Mutat. 2004, 24, 305–311. [Google Scholar] [CrossRef] [PubMed]
  38. Hwa, H.L.; Ko, T.M.; Hsu, C.J.; Huang, C.H.; Chiang, Y.L.; Oong, J.L.; Chen, C.C.; Hsu, C.K. Mutation spectrum of the connexin 26 (GJB2) gene in Taiwanese patients with prelingual deafness. Genet. Med. 2003, 5, 161–165. [Google Scholar] [CrossRef] [PubMed]
  39. Zheng, J.; Ying, Z.; Cai, Z.; Sun, D.; He, Z.; Gao, Y.; Zhang, T.; Zhu, Y.; Chen, Y.; Guan, M.X. GJB2 Mutation Spectrum and Genotype-Phenotype Correlation in 1067 Han chinese subjects with non-syndromic hearing loss. PLoS ONE 2015, 10, e0128691. [Google Scholar] [CrossRef] [PubMed]
  40. Wilch, E.; Azaiez, H.; Fisher, R.A.; Elfenbein, J.; Murgia, A.; Birkenhager, R.; Bolz, H.; Da Silva-Costa, S.M.; Del Castillo, I.; Haaf, T.; et al. A novel DFNB1 deletion allele supports the existence of a distant cis-regulatory region that controls GJB2 and GJB6 expression. Clin. Genet. 2010, 78, 267–274. [Google Scholar] [CrossRef] [PubMed] [Green Version]
  41. Yashima, T.; Noguchi, Y.; Kawashima, Y.; Rai, T.; Ito, T.; Kitamura, K. Novel ATP6V1B1 mutations in distal renal tubular acidosis and hearing loss. Acta Otolaryngol. 2010, 130, 1002–1008. [Google Scholar] [CrossRef] [PubMed]
  42. Propst, E.J.; Blaser, S.; Stockley, T.L.; Harrison, R.V.; Gordon, K.A.; Papsin, B.C. Temporal bone imaging in GJB2 deafness. Laryngoscope 2006, 116, 2178–2186. [Google Scholar] [CrossRef] [PubMed]
  43. Kenna, M.A.; Rehm, H.L.; Frangulov, A.; Feldman, H.A.; Robson, C.D. Temporal bone abnormalities in children with GJB2 mutations. Laryngoscope 2011, 121, 630–635. [Google Scholar] [CrossRef] [PubMed]
  44. Dewan, K.; Wippold, F.J., 2nd; Lieu, J.E. Enlarged vestibular aqueduct in pediatric sensorineural hearing loss. Otolaryngol. Head Neck Surg. 2009, 140, 552–558. [Google Scholar] [CrossRef] [PubMed]
  45. Lee, K.H.; Larson, D.A.; Shott, G.; Rasmussen, B.; Cohen, A.P.; Benton, C.; Halsted, M.; Choo, D.; Meinzen-Derr, J.; Greinwald, J.H., Jr. Audiologic and temporal bone imaging findings in patients with sensorineural hearing loss and GJB2 mutations. Laryngoscope 2009, 119, 554–558. [Google Scholar] [CrossRef] [PubMed]
  46. Madeo, A.C.; Manichaikul, A.; Reynolds, J.C.; Sarlis, N.J.; Pryor, S.P.; Shawker, T.H.; Griffith, A.J. Evaluation of the thyroid in patients with hearing loss and enlarged vestibular aqueducts. Arch. Otolaryngol. Head Neck Surg. 2009, 135, 670–676. [Google Scholar] [CrossRef] [PubMed]
  47. Birkeland, A.C.; Lesperance, M.M. Clinical challenges in diagnosing the genetic etiology of hearing loss. In Genetics of Deafness. Monographs in Human Genetics; Karger Publishers: Basel, Switzerland, 2016; Volume 20, pp. 40–55. [Google Scholar]
  48. Azaiez, H.; Yang, T.; Prasad, S.; Sorensen, J.L.; Nishimura, C.J.; Kimberling, W.J.; Smith, R.J. Genotype-phenotype correlations for SLC26A4-related deafness. Hum. Genet. 2007, 122, 451–457. [Google Scholar] [CrossRef] [PubMed]
  49. Choi, B.Y.; Madeo, A.C.; King, K.A.; Zalewski, C.K.; Pryor, S.P.; Muskett, J.A.; Nance, W.E.; Butman, J.A.; Brewer, C.C.; Griffith, A.J. Segregation of enlarged vestibular aqueducts in families with non-diagnostic SLC26A4 genotypes. J. Med. Genet. 2009, 46, 856–861. [Google Scholar] [CrossRef] [PubMed]
  50. Chattaraj, P.; Munjal, T.; Honda, K.; Rendtorff, N.D.; Ratay, J.S.; Muskett, J.A.; Risso, D.S.; Roux, I.; Gertz, E.M.; Schaffer, A.A.; et al. A common SLC26A4-linked haplotype underlying non-syndromic hearing loss with enlargement of the vestibular aqueduct. J. Med. Genet. 2017, 54, 665–673. [Google Scholar] [CrossRef] [PubMed]
  51. Yang, T.; Gurrola, J.G.; Wu, H.; Chiu, S.M.; Wangemann, P.; Snyder, P.M.; Smith, R.J. Mutations of KCNJ10 together with mutations of SLC26A4 cause digenic nonsyndromic hearing loss associated with enlarged vestibular aqueduct syndrome. Am. J. Hum. Genet. 2009, 84, 651–657. [Google Scholar] [CrossRef] [PubMed]
  52. Yang, T.; Vidarsson, H.; Rodrigo-Blomqvist, S.; Rosengren, S.S.; Enerback, S.; Smith, R.J. Transcriptional control of SLC26A4 is involved in Pendred syndrome and nonsyndromic enlargement of vestibular aqueduct (DFNB4). Am. J. Hum. Genet. 2007, 80, 1055–1063. [Google Scholar] [CrossRef] [PubMed]
  53. Hulander, M.; Kiernan, A.E.; Blomqvist, S.R.; Carlsson, P.; Samuelsson, E.J.; Johansson, B.R.; Steel, K.P.; Enerback, S. Lack of pendrin expression leads to deafness and expansion of the endolymphatic compartment in inner ears of Foxi1 null mutant mice. Development 2003, 130, 2013–2025. [Google Scholar] [CrossRef] [PubMed]
  54. Singh, R.; Wangemann, P. Free radical stress-mediated loss of Kcnj10 protein expression in stria vascularis contributes to deafness in Pendred syndrome mouse model. Am. J. Physiol. Ren. Physiol. 2008, 294, F139–F148. [Google Scholar] [CrossRef] [PubMed]
  55. Pique, L.M.; Brennan, M.L.; Davidson, C.J.; Schaefer, F.; Greinwald, J., Jr.; Schrijver, I. Mutation analysis of the SLC26A4, FOXI1 and KCNJ10 genes in individuals with congenital hearing loss. PeerJ 2014, 2, e384. [Google Scholar] [CrossRef] [PubMed]
  56. Landa, P.; Differ, A.M.; Rajput, K.; Jenkins, L.; Bitner-Glindzicz, M. Lack of significant association between mutations of KCNJ10 or FOXI1 and SLC26A4 mutations in Pendred syndrome/enlarged vestibular aqueducts. BMC Med. Genet. 2013, 14, 85. [Google Scholar] [CrossRef] [PubMed]
  57. Chen, K.; Wang, X.; Sun, L.; Jiang, H. Screening of SLC26A4, FOXI1, KCNJ10, and GJB2 in bilateral deafness patients with inner ear malformation. Otolaryngol. Head Neck Surg. 2012, 146, 972–978. [Google Scholar] [CrossRef] [PubMed]
  58. Cirello, V.; Bazzini, C.; Vezzoli, V.; Muzza, M.; Rodighiero, S.; Castorina, P.; Maffini, A.; Botta, G.; Persani, L.; Beck-Peccoz, P.; et al. Molecular and functional studies of 4 candidate loci in Pendred syndrome and nonsyndromic hearing loss. Mol. Cell. Endocrinol. 2012, 351, 342–350. [Google Scholar] [CrossRef] [PubMed]
  59. Pera, A.; Dossena, S.; Rodighiero, S.; Gandia, M.; Botta, G.; Meyer, G.; Moreno, F.; Nofziger, C.; Hernandez-Chico, C.; Paulmichl, M. Functional assessment of allelic variants in the SLC26A4 gene involved in Pendred syndrome and nonsyndromic EVA. Proc. Natl. Acad. Sci. USA 2008, 105, 18608–18613. [Google Scholar] [CrossRef] [PubMed]
  60. Dossena, S.; Bizhanova, A.; Nofziger, C.; Bernardinelli, E.; Ramsauer, J.; Kopp, P.; Paulmichl, M. Identification of allelic variants of pendrin (SLC26A4) with loss and gain of function. Cell. Physiol. Biochem. 2011, 28, 467–476. [Google Scholar] [CrossRef] [PubMed]
  61. Taylor, J.P.; Metcalfe, R.A.; Watson, P.F.; Weetman, A.P.; Trembath, R.C. Mutations of the PDS gene, encoding pendrin, are associated with protein mislocalization and loss of iodide efflux: Implications for thyroid dysfunction in Pendred syndrome. J. Clin. Endocrinol. Metab. 2002, 87, 1778–1784. [Google Scholar] [CrossRef] [PubMed]
  62. Yoon, J.S.; Park, H.J.; Yoo, S.Y.; Namkung, W.; Jo, M.J.; Koo, S.K.; Park, H.Y.; Lee, W.S.; Kim, K.H.; Lee, M.G. Heterogeneity in the processing defect of SLC26A4 mutants. J. Med. Genet. 2008, 45, 411–419. [Google Scholar] [CrossRef] [PubMed]
  63. Choi, B.Y.; Stewart, A.K.; Nishimura, K.K.; Cha, W.J.; Seong, M.W.; Park, S.S.; Kim, S.W.; Chun, Y.S.; Chung, J.W.; Park, S.N.; et al. Efficient molecular genetic diagnosis of enlarged vestibular aqueducts in East Asians. Genet. Test. Mol. Biomark. 2009, 13, 679–687. [Google Scholar] [CrossRef] [PubMed]
  64. Ishihara, K.; Okuyama, S.; Kumano, S.; Iida, K.; Hamana, H.; Murakoshi, M.; Kobayashi, T.; Usami, S.; Ikeda, K.; Haga, Y.; et al. Salicylate restores transport function and anion exchanger activity of missense pendrin mutations. Hear. Res. 2010, 270, 110–118. [Google Scholar] [CrossRef] [PubMed]
  65. Choi, B.Y.; Stewart, A.K.; Madeo, A.C.; Pryor, S.P.; Lenhard, S.; Kittles, R.; Eisenman, D.; Kim, H.J.; Niparko, J.; Thomsen, J.; et al. Hypo-functional SLC26A4 variants associated with nonsyndromic hearing loss and enlargement of the vestibular aqueduct: Genotype-phenotype correlation or coincidental polymorphisms? Hum. Mutat. 2009, 30, 599–608. [Google Scholar] [CrossRef] [PubMed]
  66. Rose, J.; Muskett, J.A.; King, K.A.; Zalewski, C.K.; Chattaraj, P.; Butman, J.A.; Kenna, M.A.; Chien, W.W.; Brewer, C.C.; Griffith, A.J. Hearing loss associated with enlarged vestibular aqueduct and zero or one mutant allele of SLC26A4. Laryngoscope 2017, 127, E238–E243. [Google Scholar] [CrossRef] [PubMed]
  67. Albert, S.; Blons, H.; Jonard, L.; Feldmann, D.; Chauvin, P.; Loundon, N.; Sergent-Allaoui, A.; Houang, M.; Joannard, A.; Schmerber, S.; et al. SLC26A4 gene is frequently involved in nonsyndromic hearing impairment with enlarged vestibular aqueduct in Caucasian populations. Eur. J. Hum. Genet. 2006, 14, 773–779. [Google Scholar] [CrossRef] [PubMed]
  68. Shearer, A.E.; Eppsteiner, R.W.; Booth, K.T.; Ephraim, S.S.; Gurrola, J., 2nd; Simpson, A.; Black-Ziegelbein, E.A.; Joshi, S.; Ravi, H.; Giuffre, A.C.; et al. Utilizing ethnic-specific differences in minor allele frequency to recategorize reported pathogenic deafness variants. Am. J. Hum. Genet. 2014, 95, 445–453. [Google Scholar] [CrossRef] [PubMed]
  69. Leung, K.J.; Quesnel, A.M.; Juliano, A.F.; Curtin, H.D. Correlation of CT, MR, and histopathology in incomplete partition-ii cochlear anomaly. Otol. Neurotol. 2016, 37, 434–437. [Google Scholar] [CrossRef] [PubMed]
  70. Sennaroglu, L.; Saatci, I. A new classification for cochleovestibular malformations. Laryngoscope 2002, 112, 2230–2241. [Google Scholar] [CrossRef] [PubMed]
  71. DiCiommo, D.P.; Duckett, A.; Burcescu, I.; Bremner, R.; Gallie, B.L. Retinoblastoma protein purification and transduction of retina and retinoblastoma cells using improved alphavirus vectors. Investig. Ophthalmol. Vis. Sci. 2004, 45, 3320–3329. [Google Scholar] [CrossRef] [PubMed]
  72. Fugazzola, L.; Cirello, V.; Dossena, S.; Rodighiero, S.; Muzza, M.; Castorina, P.; Lalatta, F.; Ambrosetti, U.; Beck-Peccoz, P.; Botta, G.; et al. High phenotypic intrafamilial variability in patients with Pendred syndrome and a novel duplication in the SLC26A4 gene: Clinical characterization and functional studies of the mutated SLC26A4 protein. Eur. J. Endocrinol. 2007, 157, 331–338. [Google Scholar] [CrossRef] [PubMed]
  73. Dror, A.A.; Politi, Y.; Shahin, H.; Lenz, D.R.; Dossena, S.; Nofziger, C.; Fuchs, H.; Hrabe de Angelis, M.; Paulmichl, M.; Weiner, S.; et al. Calcium oxalate stone formation in the inner ear as a result of an Slc26a4 mutation. J. Biol. Chem. 2010, 285, 21724–21735. [Google Scholar] [CrossRef] [PubMed]
  74. Dossena, S.; Nofziger, C.; Brownstein, Z.; Kanaan, M.; Avraham, K.B.; Paulmichl, M. Functional characterization of pendrin mutations found in the Israeli and Palestinian populations. Cell. Physiol. Biochem. 2011, 28, 477–484. [Google Scholar] [CrossRef] [PubMed]
  75. Procino, G.; Milano, S.; Tamma, G.; Dossena, S.; Barbieri, C.; Nicoletti, M.C.; Ranieri, M.; Di Mise, A.; Nofziger, C.; Svelto, M.; et al. Co-regulated pendrin and aquaporin 5 expression and trafficking in Type-B intercalated cells under potassium depletion. Cell. Physiol. Biochem. 2013, 32, 184–199. [Google Scholar] [CrossRef] [PubMed]
  76. Bernardinelli, E.; Costa, R.; Nofziger, C.; Paulmichl, M.; Dossena, S. Effect of known inhibitors of ion transport on pendrin (SLC26A4) activity in a human kidney cell line. Cell. Physiol. Biochem. 2016, 38, 1984–1998. [Google Scholar] [CrossRef] [PubMed]
  77. Galietta, L.J.; Haggie, P.M.; Verkman, A.S. Green fluorescent protein-based halide indicators with improved chloride and iodide affinities. FEBS Lett. 2001, 499, 220–224. [Google Scholar] [CrossRef]
  78. Adler, J.; Parmryd, I. Quantifying colocalization by correlation: The Pearson correlation coefficient is superior to the Mander’s overlap coefficient. Cytom. A 2010, 77, 733–742. [Google Scholar] [CrossRef] [PubMed]
Figure 1. Functionality of wild type pendrin and four pendrin variants identified in Austrian deaf patients with enlarged vestibular aqueduct (EVA). (a) Representative measurements of intracellular fluorescence intensity in HEK 293 Phoenix cells transfected with wild type (WT) or mutated pendrin and the iodide sensor enhanced yellow fluorescent protein (EYFP) H148Q;I152L or EYFP H148Q;I152L alone (control) and bathed in chloride- or iodide-containing solutions. The arrow indicates the addition of iodide to the extracellular solution. Fluorescence intensity was normalized for the average of fluorescence intensity in the chloride-containing solution; (b) Percentage of fluorescence decrease (ΔF%) determined over the experimental period (19 s) in cells expressing the indicated pendrin variants and in control cells. Error bars represent SEM. *** p < 0.001, ** p < 0.01, n.s.: not statistically significant compared to wild type; ### p < 0.001 compared to control, one-way ANOVA with Bonferroni’s multiple comparison post-test. 36 ≤ n ≤ 107 independent measurements collected in 3–9 independent experiments.
Ijms 19 00209 g001
Figure 2. Co-localization of wild type pendrin and its variants with the plasma membrane. (a) From left to right: fluorescent signal of EYFP (green) fused to the C-terminus of the indicated pendrin variants and plasma membrane (magenta) of living HeLa cells 72 h after transfection, corresponding merge image and scatter plot. Scale bar: 12 µm; (b) Pearson’s correlation coefficient, overlap coefficient and co-localization rate referred to the co-localization of wild type (WT) pendrin and the indicated variants with the plasma membrane. Error bars represent SEM. ** p < 0.01 compared to wild type and therefore excluded from the plasma membrane, n = 12, one-way ANOVA with Dunnet’s multiple comparison post-test. (n) refers to the number of cells from 3 independent experiments.
Ijms 19 00209 g002
Figure 3. Co-localization of wild type pendrin and its variants with the endoplasmic reticulum (ER). (a) From left to right: fluorescent signal of EYFP (green) fused to the C-terminus of the indicated pendrin variants and ER (red) of living HeLa cells 72 h after transfection, corresponding merge image and scatter plot. Scale bar: 12 µm; (b) Pearson’s correlation coefficient, overlap coefficient and co-localization rate referred to the co-localization of wild type (WT) pendrin and the indicated variants with the ER. Error bars represent SEM. ** p < 0.01 compared to wild type and therefore retained within the ER, n = 12, one-way ANOVA with Dunnet’s multiple comparison post-test. (n) refers to the number of cells from 3 independent experiments.
Ijms 19 00209 g003
Figure 4. Total cellular levels of wild type pendrin and its variants in intact cells. (a) From left to right: nuclei counterstained with 4’,6-diamidino-2-phenylindole (DAPI, cyan), fluorescent signal of EYFP (yellow) fused to the C-terminus of the indicated pendrin variants expressed in HeLa cells for 72 h and corresponding merge image. Scale bar: 30 µm; (b) Wild type (WT) and mutated pendrin total expression levels expressed as fluorescence intensity (levels of grey) normalized for the cell density. Error bars represent SEM. n = 24, ** p < 0.01 compared to wild type, one-way ANOVA with Dunnet’s multiple comparison post-test. (n) refers to the number of imaging fields from 6 independent experiments.
Ijms 19 00209 g004
Figure 5. Abundance of wild type pendrin and its variants in the plasma membrane region of living cells. (a) From left to right: fluorescent signal of the transfection marker enhanced cyan fluorescent protein (ECFP, cyan), EYFP fused to the C-terminus of the indicated pendrin variants expressed in HeLa cells for 72 h (green), and plasma membrane (magenta). Scale bar: 15 µm; (b) Wild type (WT) and mutated pendrin fluorescence intensity in three regions of interest of the plasma membrane of a single cell were expressed as levels of grey, averaged and normalized for the fluorescence intensity of ECFP in the cytosol of the same cell. Error bars represent SEM. n = 24, ** p < 0.01 compared to wild type, one-way ANOVA with Bonferroni’s multiple comparison post-test. (n) refers to the number cells from 6 independent experiments.
Ijms 19 00209 g005
Figure 6. Allelic discrimination plots from custom genotyping assays. The original scatter plots generated from the custom genotyping assays for c.343T>G (p.Y115D) (a) and c.1301C>A (p.A434D) (b). Little to no fluorescence from either fluorophore in either assay was generated in the no template controls (NTC). Raw endpoint fluorescence data were analyzed with QuantStudio 12K Flex software v1.2.2 and scatter plots were generated with Taqman Genotyping software v1.3 (Thermo Fisher Scientific, Waltham, MA, USA).
Ijms 19 00209 g006
Table 1. Clinical signs of patients.
Patient IDEthnicitySexAge (year)EVA, SideMondini Malformation, SideSide Affected by HLType of HLFrequencies Affected by HL, Side
119CaucasianMale33BNoBSensorineuralAll, B
267Caucasian (Arab)Female23BNoBSensorineuralAll, B
271CaucasianFemale8BYes, BBSensorineuralAll, B
272CaucasianMale37RNoRConductiveLow and Middle, R
278CaucasianFemale42LNoBSensorineuralAll, B
305CaucasianMale16BYes, BBSensorineuralMiddle and High, R; All, L
307CaucasianMale18BNoBSensorineuralAll, B
308Caucasian (Arab)Male12BNoBSensorineuralAll, B
358CaucasianFemale32BYes, BBSensorineuralAll, B
359CaucasianFemale46BNoBSensorineuralAll, R; Middle and High, L
365CaucasianMale76ANoBSensorineuralAll, B
395Caucasian + AfricanFemale17LNoBSensorineuralMiddle, R; All, L
421CaucasianMale21BNoBSensorineuralAll, B
568CaucasianFemale19BNoBSensorineuralAll, B
569CaucasianMale28BYes, BBSensorineuralAll, B
610CaucasianFemale51BNoBSensorineuralAll, B
616CaucasianFemale32BNoBMixedMiddle and High, R; Low and Middle, L
622CaucasianMale10BYes, BBSensorineuralAll, B
632CaucasianFemale50BNoBSensorineuralAll, B
A, agenesis; B, bilateral; EVA, enlarged vestibular aqueduct; HL, hearing loss; L, left; R, right.
Table 2. GJB2 and SLC26A4 genotype of patients.
Patient IDGJB2SLC26A4Causative Gene
Nucleotide ChangeAmino Acid ChangeNucleotide ChangeAmino Acid Change
Allele 1Allele 2Allele 1Allele 2Allele 1Allele 2Allele 1Allele 2
119WTWTWTWTWTWTWTWTundetermined
267c.88A>GWTp.I30VWTWTWTWTWTundetermined
271WTWTWTWTc.1301C>Ac.1730T>Cp.A434Dp.V577ASLC26A4
272WTWTWTWTWTWTWTWTundetermined
278WTWTWTWTWTWTWTWTundetermined
305WTWTWTWTWTWTWTWTundetermined
307c.35delGc.35delGp.G12VfsX13p.G12VfsX13WTWTWTWTGJB2
308c.88A>GWTp.I30VWTWTWTWTWTundetermined
358WTWTWTWTc.61A>GWTp.M21VWTnot SLC26A4
359WTWTWTWTWTWTWTWTundetermined
365WTWTWTWTWTWTWTWTundetermined
395WTWTWTWTWTWTWTWTundetermined
421c.35delGc.35delGp.G12VfsX13p.G12VfsX13WTWTWTWTGJB2
568WTWTWTWTWTWTWTWTundetermined
569WTWTWTWTWTWTWTWTundetermined
610WTWTWTWTWTWTWTWTundetermined
616WTWTWTWTc.343T>GWTp.Y115DWTundetermined
622WTWTWTWTWTWTWTWTundetermined
632WTWTWTWTWTWTWTWTundetermined
The novel pendrin sequence variant is indicated boldface. WT, wild type.
Table 3. Functional and molecular features of SLC26A4 variants.
SLC26A4 VariantFunctionSubcellular LocalizationExpression LevelsClassification
p.M21Vnot affectedplasma membranenot affectedbenign
p.Y115D33% reductionERreducedpathogenic
p.A434D16% reductionplasma membrane and ERreducedpathogenic
p.V577A76% reductionERreducedpathogenic
The % of reduction in function refers to the wild type, and was calculated by subtracting the intracellular fluorescence decrease observed in control cells from that observed in cells expressing each SLC26A4 variant. A classification of each variant according to the American College of Medical Genetics and Genomics Standards and Guidelines [26] based on functional and molecular features is given, and refers to a condition where a given variant is found in compound heterozygosity with another pathogenic variant. ER, endoplasmic reticulum.

