Photothermal Off-Resonance Tapping for Rapid and Gentle Atomic Force Imaging of Live Cells

 , , and
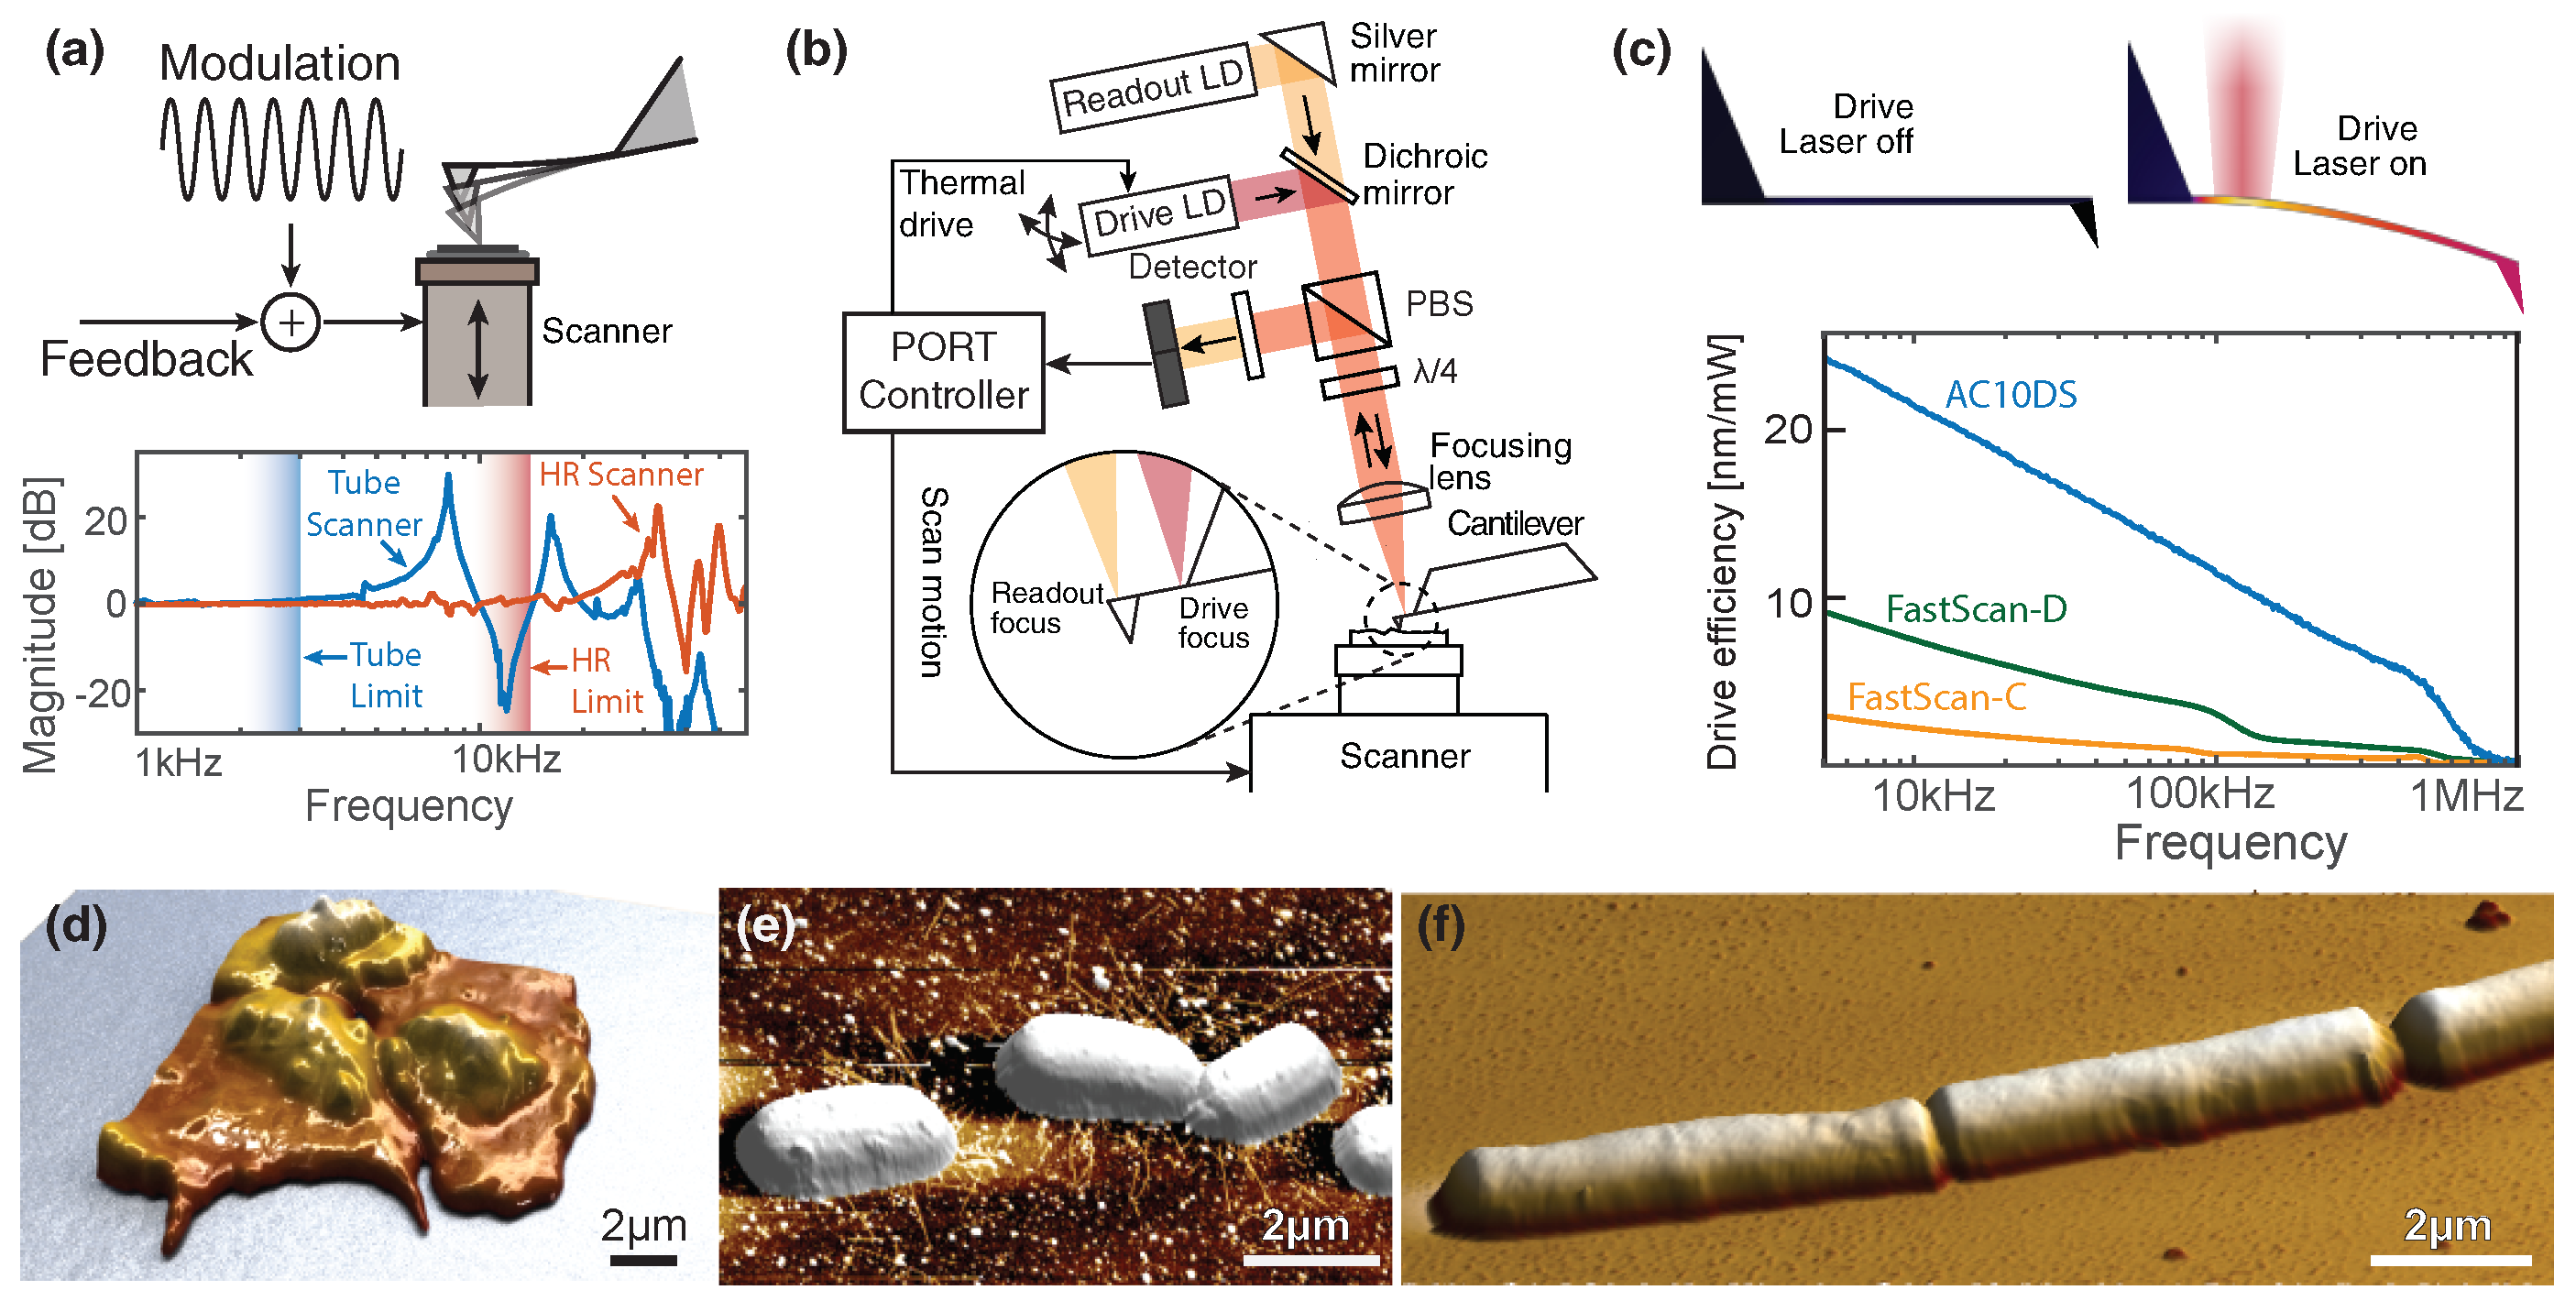
Abstract
:1. Introduction
2. Results
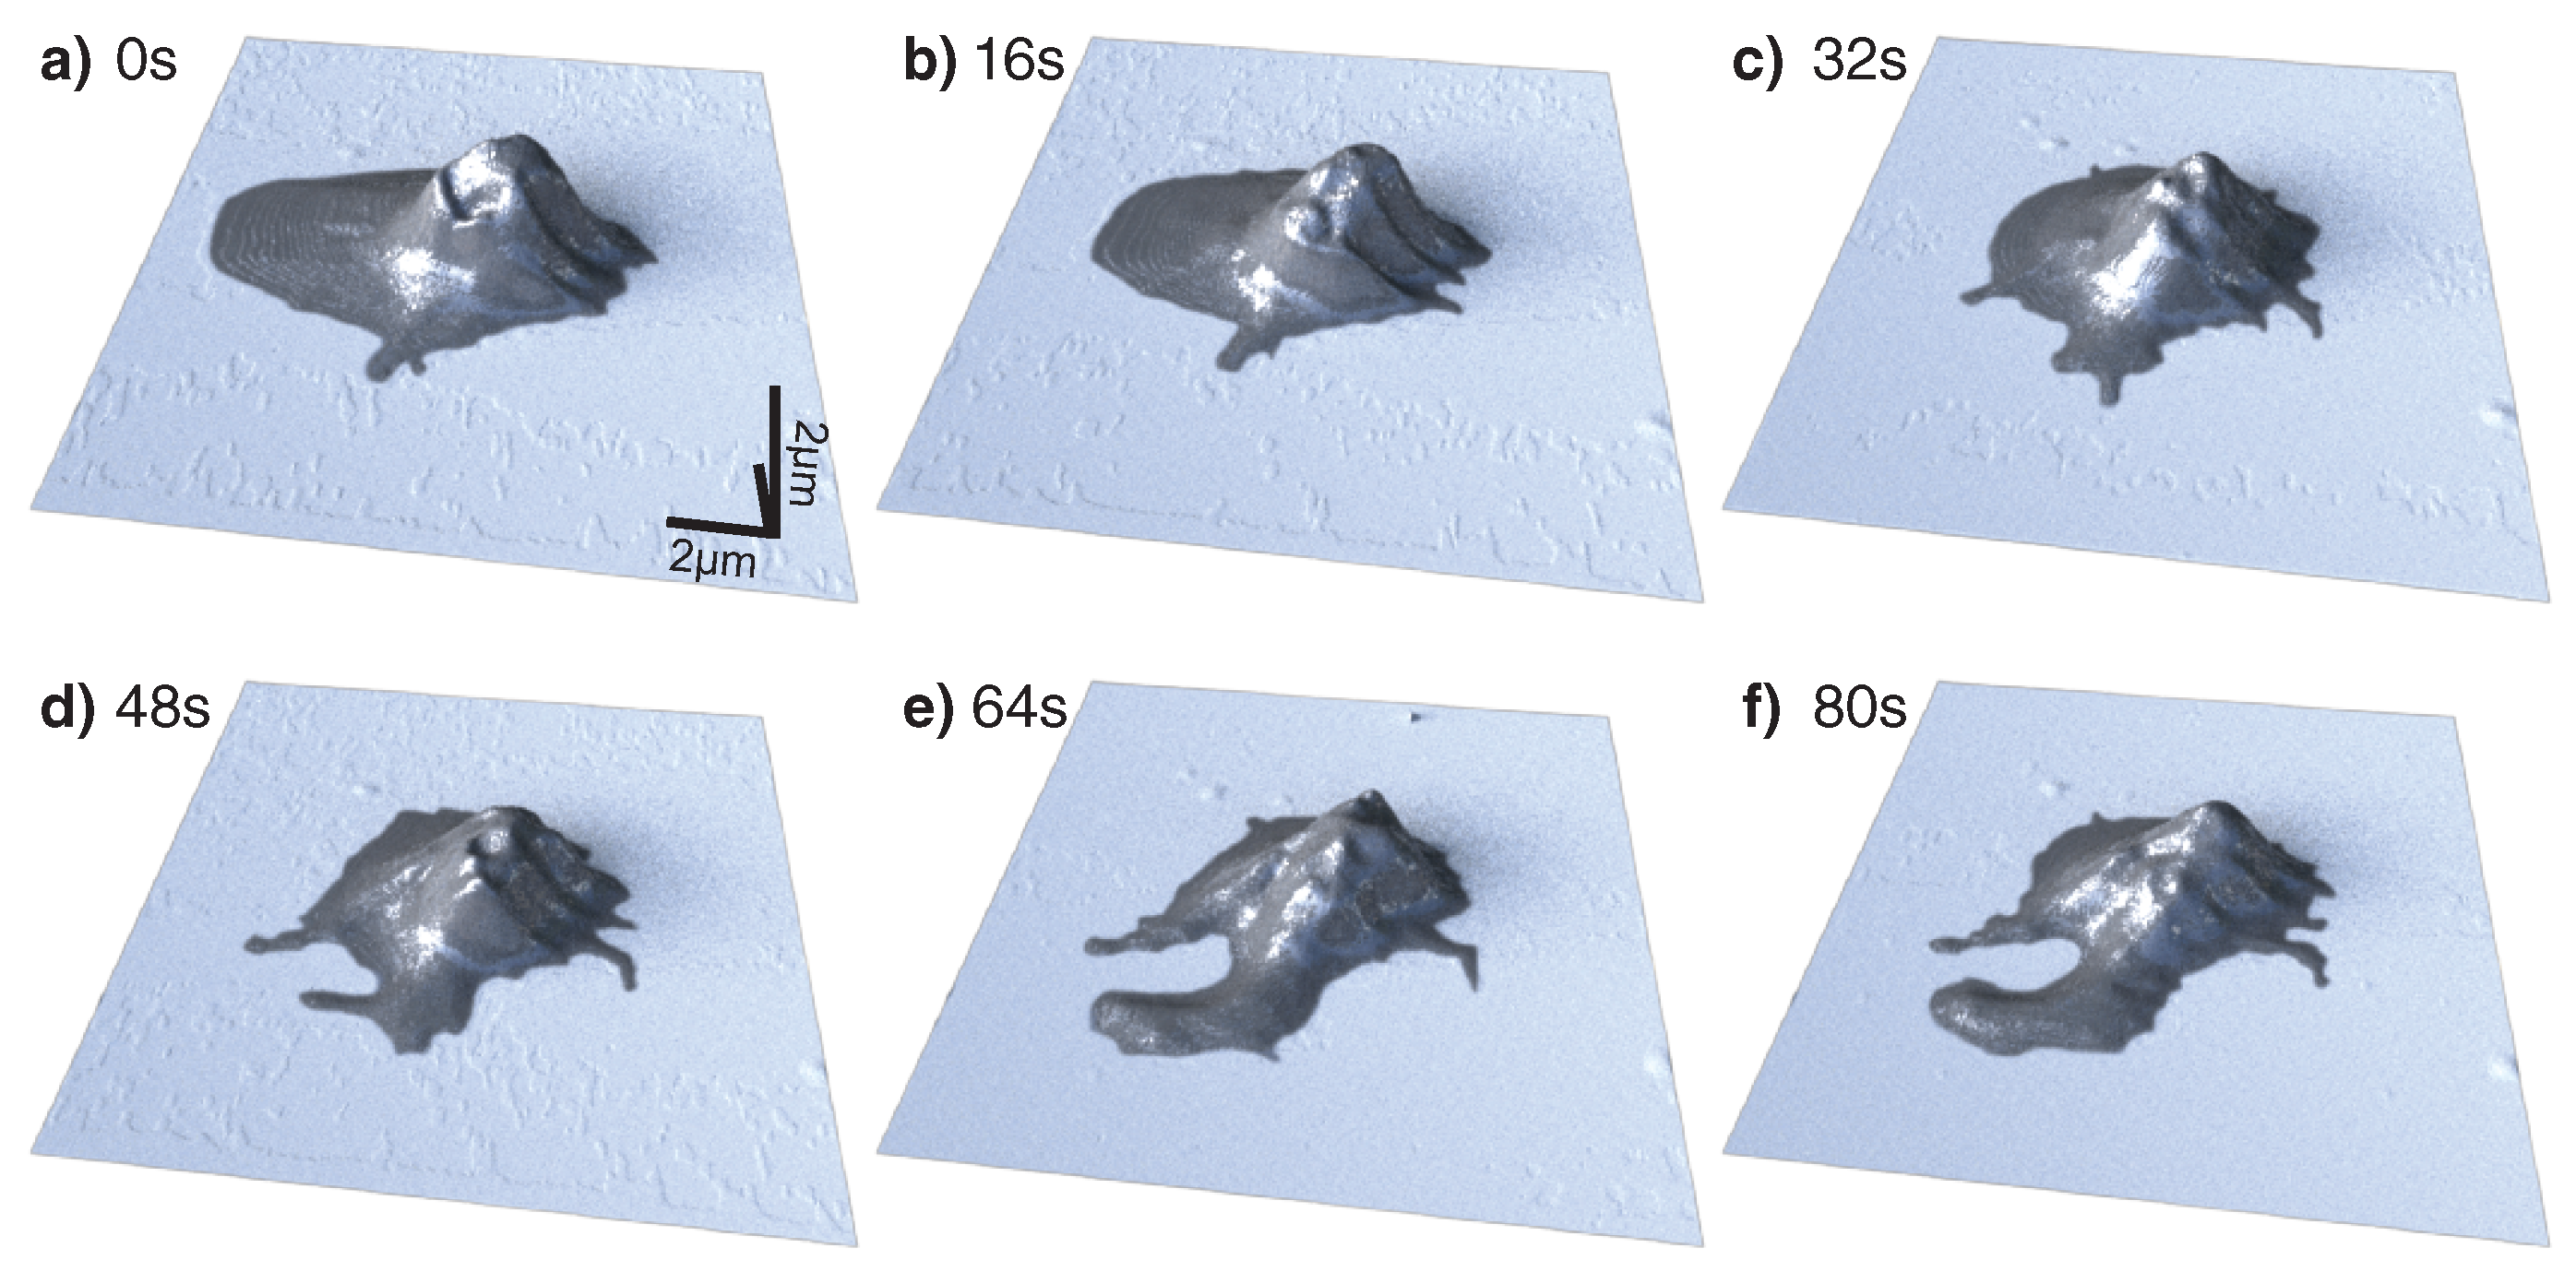
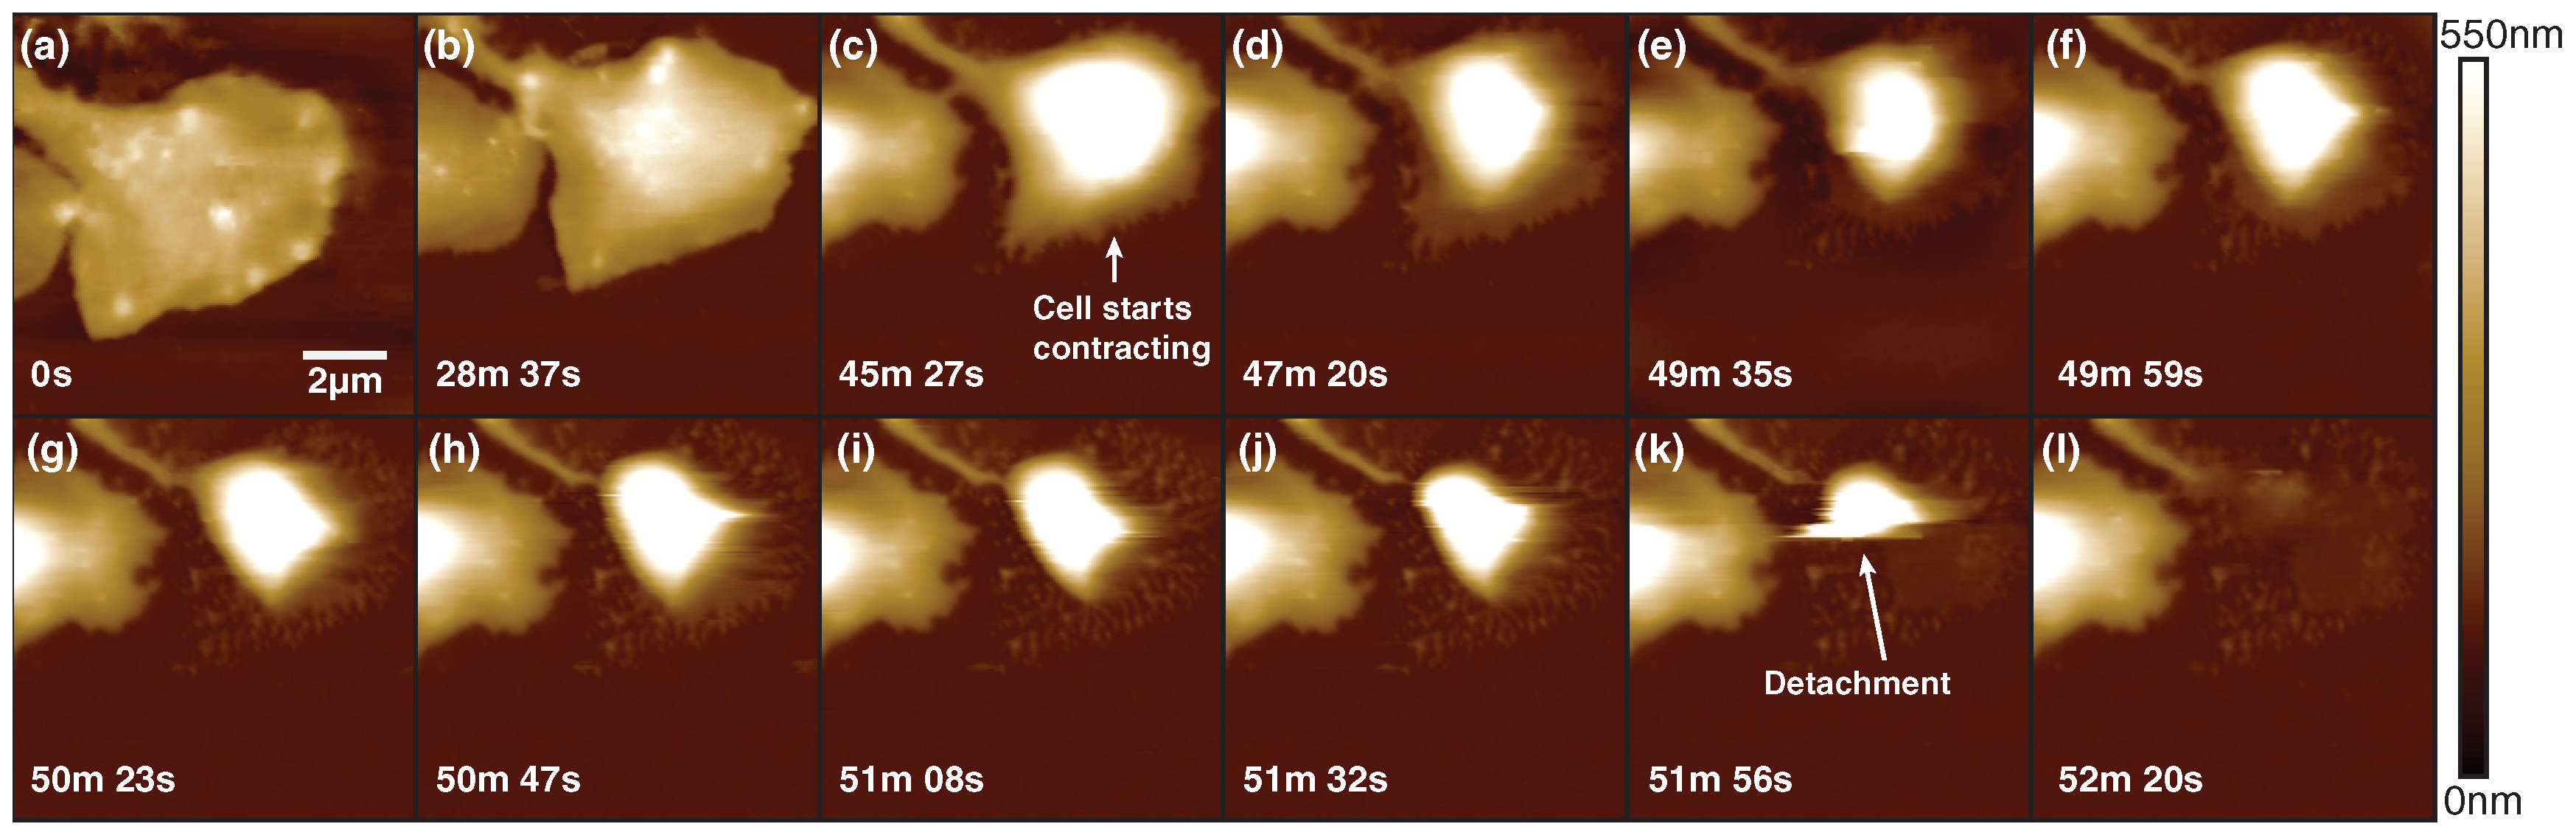
2.1. Thrombocyte Imaging
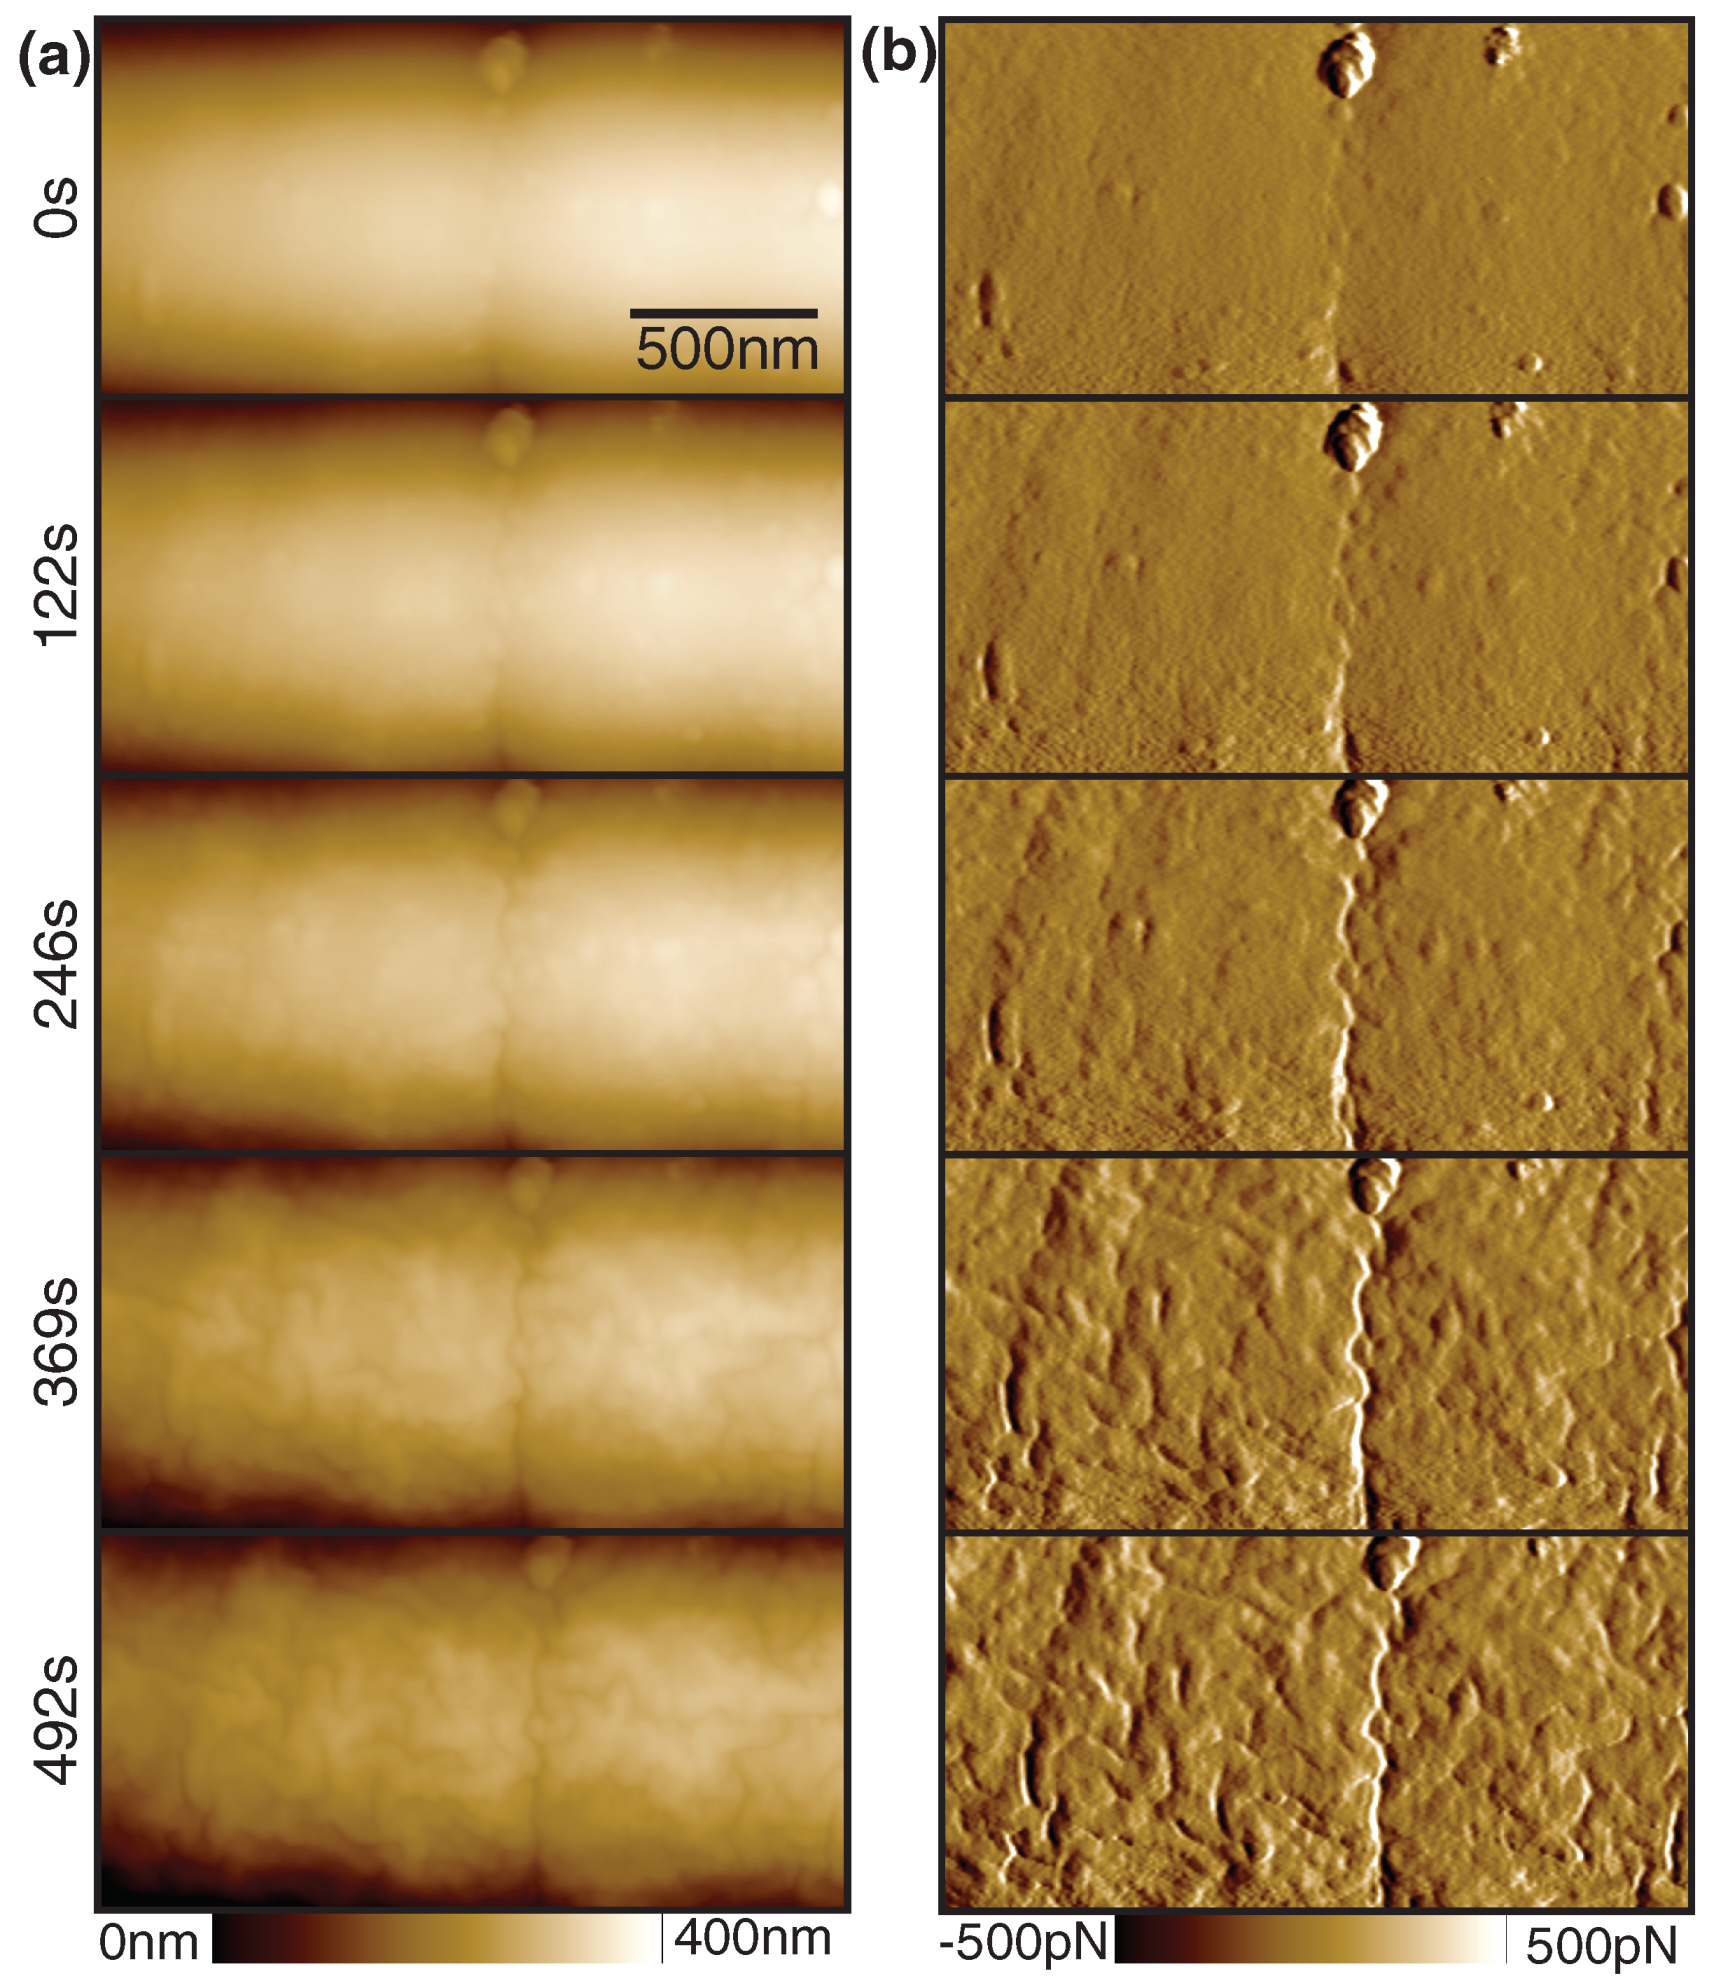
2.2. Bacterial Imaging
3. Discussion
4. Materials and Methods
4.1. Thrombocyte Preparation
4.2. Bacteria Preparation
4.3. AFM Imaging
Supplementary Materials
Author Contributions
Acknowledgments
Conflicts of Interest
Abbreviations
| AFM | Atomic force microscopy |
| FPGA | Field Programmable Gate Array |
| HEPES | 4-(2-hydroxyethyl)-1-piperazineethanesulfonic acid |
| PLL | Poly-l-lysine |
| PORT | Photothermal off-resonance tapping |
| TRIS | tris(hydroxymethyl)aminomethane |
References
- Henderson, E.; Haydon, P.G.; Sakaguchi, D.S. Actin filament dynamics in living glial cells imaged by atomic force microscopy. Science 1992, 257, 1944–1946. [Google Scholar] [CrossRef] [PubMed]
- Dufrêne, Y.F.; Ando, T.; Garcia, R.; Alsteens, D.; Martinez-Martin, D.; Engel, A.; Gerber, C.; Müller, D.J. Imaging modes of atomic force microscopy for application in molecular and cell biology. Nat. Nanotechnol. 2017, 12, 295–307. [Google Scholar] [CrossRef] [PubMed] [Green Version]
- Krotil, H.U.; Stifter, T.; Waschipky, H.; Weishaupt, K.; Hild, S.; Marti, O. Pulsed force mode: A new method for the investigation of surface properties. Surf. Interface Anal. 1999, 27, 336–340. [Google Scholar] [CrossRef]
- Oberleithner, H.; Riethmuller, C.; Schillers, H.; MacGregor, G.A.; de Wardener, H.E.; Hausberg, M. Plasma sodium stiffens vascular endothelium and reduces nitric oxide release. Proc. Natl. Acad. Sci. USA 2007, 104, 16281–16286. [Google Scholar] [CrossRef] [PubMed] [Green Version]
- Raman, A.; Trigueros, S.; Cartagena, A.; Stevenson, A.P.Z.; Susilo, M.; Nauman, E.; Contera, S.A. Mapping nanomechanical properties of live cells using multi-harmonic atomic force microscopy. Nat. Nanotechnol. 2011, 6, 809–814. [Google Scholar] [CrossRef] [PubMed]
- Kailas, L.; Ratcliffe, E.; Hayhurst, E.; Walker, M.; Foster, S.; Hobbs, J. Immobilizing live bacteria for AFM imaging of cellular processes. Ultramicroscopy 2009, 109, 775–780. [Google Scholar] [CrossRef] [PubMed]
- Allison, D.P.; Sullivan, C.J.; Mortensen, N.P.; Retterer, S.T.; Doktycz, M. Bacterial immobilization for imaging by atomic force microscopy. J. Vis. Exp. JoVE 2011, 54. [Google Scholar] [CrossRef] [PubMed]
- Xu, X.; Carrasco, C.; de Pablo, P.J.; Gomez-Herrero, J.; Raman, A. Unmasking imaging forces on soft biological samples in liquids when using dynamic atomic force microscopy: A case study on viral capsids. Biophys. J. 2008, 95, 2520–2528. [Google Scholar] [CrossRef] [PubMed]
- Guzman, H.V.; Perrino, A.P.; Garcia, R. Peak forces in high-resolution imaging of soft matter in liquid. ACS Nano 2013, 7, 3198–3204. [Google Scholar] [CrossRef] [PubMed]
- Putman, C.A.J.; Van der Werf, K.O.; De Grooth, B.G.; Van Hulst, N.F.; Greve, J. Tapping mode atomic force microscopy in liquid. Appl. Phys. Lett. 1994, 64, 2454–2456. [Google Scholar] [CrossRef] [Green Version]
- Nagao, E.; Dvorak, J.A. Phase imaging by atomic force microscopy: Analysis of living homoiothermic vertebrate cells. Biophys. J. 1999, 76, 3289–3297. [Google Scholar] [CrossRef]
- Ortega-Esteban, A.; Horcas, I.; Hernando-Pérez, M.; Ares, P.; Pérez-Berná, A.J.; San Martín, C.; Carrascosa, J.L.; De Pablo, P.J.; Gómez-Herrero, J. Minimizing tip-sample forces in jumping mode atomic force microscopy in liquid. Ultramicroscopy 2012, 114, 56–61. [Google Scholar] [CrossRef] [PubMed]
- Solon, J.; Levental, I.; Sengupta, K.; Georges, P.C.; Janmey, P.A. Fibroblast adaptation and stiffness matching to soft elastic substrates. Biophys. J. 2007, 93, 4453–4461. [Google Scholar] [CrossRef] [PubMed]
- A-Hassan, E.; Heinz, W.F.; Antonik, M.D.; D’Costa, N.P.; Nageswaran, S.; Schoenenberger, C.A.; Hoh, J.H. Relative microelastic mapping of living cells by atomic force microscopy. Biophys. J. 1998, 74, 1564–1578. [Google Scholar] [CrossRef]
- Rosa-Zeiser, A.; Weilandt, E.; Hild, S.; Marti, O. The simultaneous measurement of elastic, electrostatic and adhesive properties by scanning force microscopy: Pulsed-force mode operation. Meas. Sci. Technol. 1997, 8, 1333–1338. [Google Scholar] [CrossRef]
- De Pablo, P.J.; Colchero, J.; Gómez-Herrero, J.; Baró, A.M. Jumping mode scanning force microscopy. Appl. Phys. Lett. 1998, 73, 3300–3302. [Google Scholar] [CrossRef]
- Ludwig, M.; Dettmann, W.; Gaub, H. Atomic force microscope imaging contrast based on molecular recognition. Biophys. J. 1997, 72, 445–448. [Google Scholar] [CrossRef] [Green Version]
- Alsteens, D.; Dupres, V.; Yunus, S.; Latgé, J.P.; Heinisch, J.J.; Dufrêne, Y.F. High-resolution imaging of chemical and biological sites on living cells using peak force tapping atomic force microscopy. Langmuir 2012, 28, 16738–16744. [Google Scholar] [CrossRef] [PubMed]
- Pfreundschuh, M.; Alsteens, D.; Hilbert, M.; Steinmetz, M.O.; Müller, D.J. Localizing chemical groups while imaging single native proteins by high-resolution atomic force microscopy. Nano Lett. 2014, 14, 2957–2964. [Google Scholar] [CrossRef] [PubMed]
- Heu, C.; Berquand, A.; Elie-Caille, C.; Nicod, L. Glyphosate-induced stiffening of HaCaT keratinocytes, a peak force tapping study on living cells. J. Struct. Biol. 2012, 178, 1–7. [Google Scholar] [CrossRef] [PubMed]
- Calzado-Martín, A.; Encinar, M.; Tamayo, J.; Calleja, M.; San Paulo, A. Effect of actin organization on the stiffness of living breast cancer cells revealed by peak-force modulation atomic force microscopy. ACS Nano 2016, 10, 3365–3374. [Google Scholar] [CrossRef] [PubMed]
- Alsteens, D.; Trabelsi, H.; Soumillion, P.; Dufrêne, Y.F. Multiparametric atomic force microscopy imaging of single bacteriophages extruding from living bacteria. Nat. Commun. 2013, 4, 2926. [Google Scholar] [CrossRef] [PubMed] [Green Version]
- Schillers, H.; Medalsy, I.; Hu, S.; Slade, A.L.; Shaw, J.E. PeakForce tapping resolves individual microvilli on living cells. J. Mol. Recognit. 2016, 29, 95–101. [Google Scholar] [CrossRef] [PubMed]
- Eskandarian, H.A.; Odermatt, P.D.; Ven, J.X.Y.; Hannebelle, M.T.M.; Nievergelt, A.P.; Dhar, N.; McKinney, J.D.; Fantner, G.E. Division site selection linked to inherited cell surface wave troughs in mycobacteria. Nat. Microbiol. 2017, 2, 17094. [Google Scholar] [CrossRef] [PubMed]
- Ratcliff, G.C.; Erie, D.A.; Superfine, R. Photothermal modulation for oscillating mode atomic force microscopy in solution. Appl. Phys. Lett. 1998, 72, 1911–1913. [Google Scholar] [CrossRef]
- Ramos, D.; Tamayo, J.; Mertens, J.; Calleja, M. Photothermal excitation of microcantilevers in liquids. J. Appl. Phys. 2006, 99, 124904. [Google Scholar] [CrossRef] [Green Version]
- Labuda, A.; Kobayashi, K.; Kiracofe, D.; Suzuki, K.; Grütter, P.H.; Yamada, H. Comparison of photothermal and piezoacoustic excitation methods for frequency and phase modulation atomic force microscopy in liquid environments. AIP Adv. 2011, 1, 022136. [Google Scholar] [CrossRef] [Green Version]
- Nievergelt, A.P.; Adams, J.D.; Odermatt, P.D.; Fantner, G.E. High-frequency multimodal atomic force microscopy. Beilstein J. Nanotechnol. 2014, 5, 2459–2467. [Google Scholar] [CrossRef] [PubMed] [Green Version]
- Nievergelt, A.P.; Andany, S.H.; Adams, J.D.; Hannebelle, M.T.; Fantner, G.E. Components for high-speed atomic force microscopy optimized for low phase-lag. In Proceedings of the International Conference on Advanced Intelligent Mechatronics (AIM), Munich, Germany, 26–30 June 2017; pp. 731–736. [Google Scholar] [CrossRef]
- Nievergelt, A.P.; Banterle, N.; Andany, S.H.; Gönczy, P.; Fantner, G.E. High-speed photothermal off-resonance atomic force microscopy reveals assembly routes of centriolar scaffold protein SAS-6. Nat. Nanotechnol. 2018, 13, 696–701. [Google Scholar] [CrossRef] [PubMed]
- Nievergelt, A.P.; Erickson, B.W.; Hosseini, N.; Adams, J.D.; Fantner, G.E. Studying biological membranes with extended range high-speed atomic force microscopy. Sci. Rep. 2015, 5, 11987. [Google Scholar] [CrossRef] [PubMed] [Green Version]
- Machlus, K.R.; Thon, J.N.; Italiano, J.E. Interpreting the developmental dance of the megakaryocyte: A review of the cellular and molecular processes mediating platelet formation. Br. J. Haematol. 2014, 165, 227–236. [Google Scholar] [CrossRef] [PubMed]
- Jain, N.C. A Scanning electron microscopic study of platelets of certain animal species. Thromb. Haemost. 1975, 33, 501–507. [Google Scholar] [CrossRef]
- Jones, M.I.; McColl, I.R.; Grant, D.M.; Parker, K.G.; Parker, T.L. Protein adsorption and platelet attachment and activation, on TiN, TiC, and DLC coatings on titanium for cardiovascular applications. J. Biomed. Mater. Res. 2000, 52, 413–421. [Google Scholar] [CrossRef]
- Fantner, G.E.; Barbero, R.J.; Gray, D.S.; Belcher, A.M. Kinetics of antimicrobial peptide activity measured on individual bacterial cells using high-speed atomic force microscopy. Nat. Nanotechnol. 2010, 5, 280–285. [Google Scholar] [CrossRef] [PubMed] [Green Version]
- Peric, O.; Hannebelle, M.; Adams, J.D.; Fantner, G.E. Microfluidic bacterial traps for simultaneous fluorescence and atomic force microscopy. Nano Res. 2017, 10, 3896–3908. [Google Scholar] [CrossRef] [Green Version]
- Boyd, R.D.; Verran, J.; Jones, M.V.; Bhakoo, M. Use of the atomic force microscope to determine the effect of substratum surface topography on bacterial adhesion. Langmuir 2002, 18, 2343–2346. [Google Scholar] [CrossRef]
- Pistolesi, S.; Pogni, R.; Feix, J.B. Membrane insertion and bilayer perturbation by antimicrobial peptide CM15. Biophys. J. 2007, 93, 1651–1660. [Google Scholar] [CrossRef] [PubMed]
- Graham, L.L.; Beveridge, T.J. Structural differentiation of the Bacillus subtilis 168 cell wall. J. Bacteriol. 1994, 176, 1413–1421. [Google Scholar] [CrossRef] [PubMed]
- Mercier, R.; Kawai, Y.; Errington, J. Excess membrane synthesis drives a primitive mode of cell proliferation. Cell 2013, 152, 997–1007. [Google Scholar] [CrossRef] [PubMed]
- Viani, M.B.; Schäffer, T.E.; Chand, A.; Rief, M.; Gaub, H.E.; Hansma, P.K. Small cantilevers for force spectroscopy of single molecules. J. Appl. Phys. 1999, 86, 2258–2262. [Google Scholar] [CrossRef]
- Fantner, G.E.; Schitter, G.; Kindt, J.H.; Ivanov, T.; Ivanova, K.; Patel, R.; Holten-Andersen, N.; Adams, J.; Thurner, P.J.; Rangelow, I.W.; et al. Components for high speed atomic force microscopy. Ultramicroscopy 2006, 106, 881–887. [Google Scholar] [CrossRef] [PubMed]
- Utke, I.; Hoffmann, P.; Melngailis, J. Gas-assisted focused electron beam and ion beam processing and fabrication. J. Vac. Sci. Technol. B Microelectron. Nanom. Struct. 2008, 26, 1197. [Google Scholar] [CrossRef]
- Huth, M.; Porrati, F.; Schwalb, C.; Winhold, M.; Sachser, R.; Dukic, M.; Adams, J.; Fantner, G. Focused electron beam induced deposition: A perspective. Beilstein J. Nanotechnol. 2012, 3, 597–619. [Google Scholar] [CrossRef] [PubMed] [Green Version]
- Uchihashi, T.; Kodera, N.; Ando, T. Guide to video recording of structure dynamics and dynamic processes of proteins by high-speed atomic force microscopy. Nat. Protoc. 2012, 7, 1193–1206. [Google Scholar] [CrossRef] [PubMed]
- Shibata, M.; Uchihashi, T.; Ando, T.; Yasuda, R. Long-tip high-speed atomic force microscopy for nanometer-scale imaging in live cells. Sci. Rep. 2015, 5, 8724. [Google Scholar] [CrossRef] [PubMed]
- Adams, J.D.; Nievergelt, A.; Erickson, B.W.; Yang, C.; Dukic, M.; Fantner, G.E. High-speed imaging upgrade for a standard sample scanning atomic force microscope using small cantilevers. Rev. Sci. Instrum. 2014, 85, 093702. [Google Scholar] [CrossRef] [PubMed] [Green Version]


© 2018 by the authors. Licensee MDPI, Basel, Switzerland. This article is an open access article distributed under the terms and conditions of the Creative Commons Attribution (CC BY) license (http://creativecommons.org/licenses/by/4.0/).
Share and Cite
Nievergelt, A.P.; Brillard, C.; Eskandarian, H.A.; McKinney, J.D.; Fantner, G.E. Photothermal Off-Resonance Tapping for Rapid and Gentle Atomic Force Imaging of Live Cells. Int. J. Mol. Sci. 2018, 19, 2984. https://doi.org/10.3390/ijms19102984
Nievergelt AP, Brillard C, Eskandarian HA, McKinney JD, Fantner GE. Photothermal Off-Resonance Tapping for Rapid and Gentle Atomic Force Imaging of Live Cells. International Journal of Molecular Sciences. 2018; 19(10):2984. https://doi.org/10.3390/ijms19102984
Chicago/Turabian StyleNievergelt, Adrian P., Charlène Brillard, Haig A. Eskandarian, John D. McKinney, and Georg E. Fantner. 2018. "Photothermal Off-Resonance Tapping for Rapid and Gentle Atomic Force Imaging of Live Cells" International Journal of Molecular Sciences 19, no. 10: 2984. https://doi.org/10.3390/ijms19102984
APA StyleNievergelt, A. P., Brillard, C., Eskandarian, H. A., McKinney, J. D., & Fantner, G. E. (2018). Photothermal Off-Resonance Tapping for Rapid and Gentle Atomic Force Imaging of Live Cells. International Journal of Molecular Sciences, 19(10), 2984. https://doi.org/10.3390/ijms19102984