Adsorption of Fibronectin Fragment on Surfaces Using Fully Atomistic Molecular Dynamics Simulations

 , , , and
Abstract
:1. Introduction
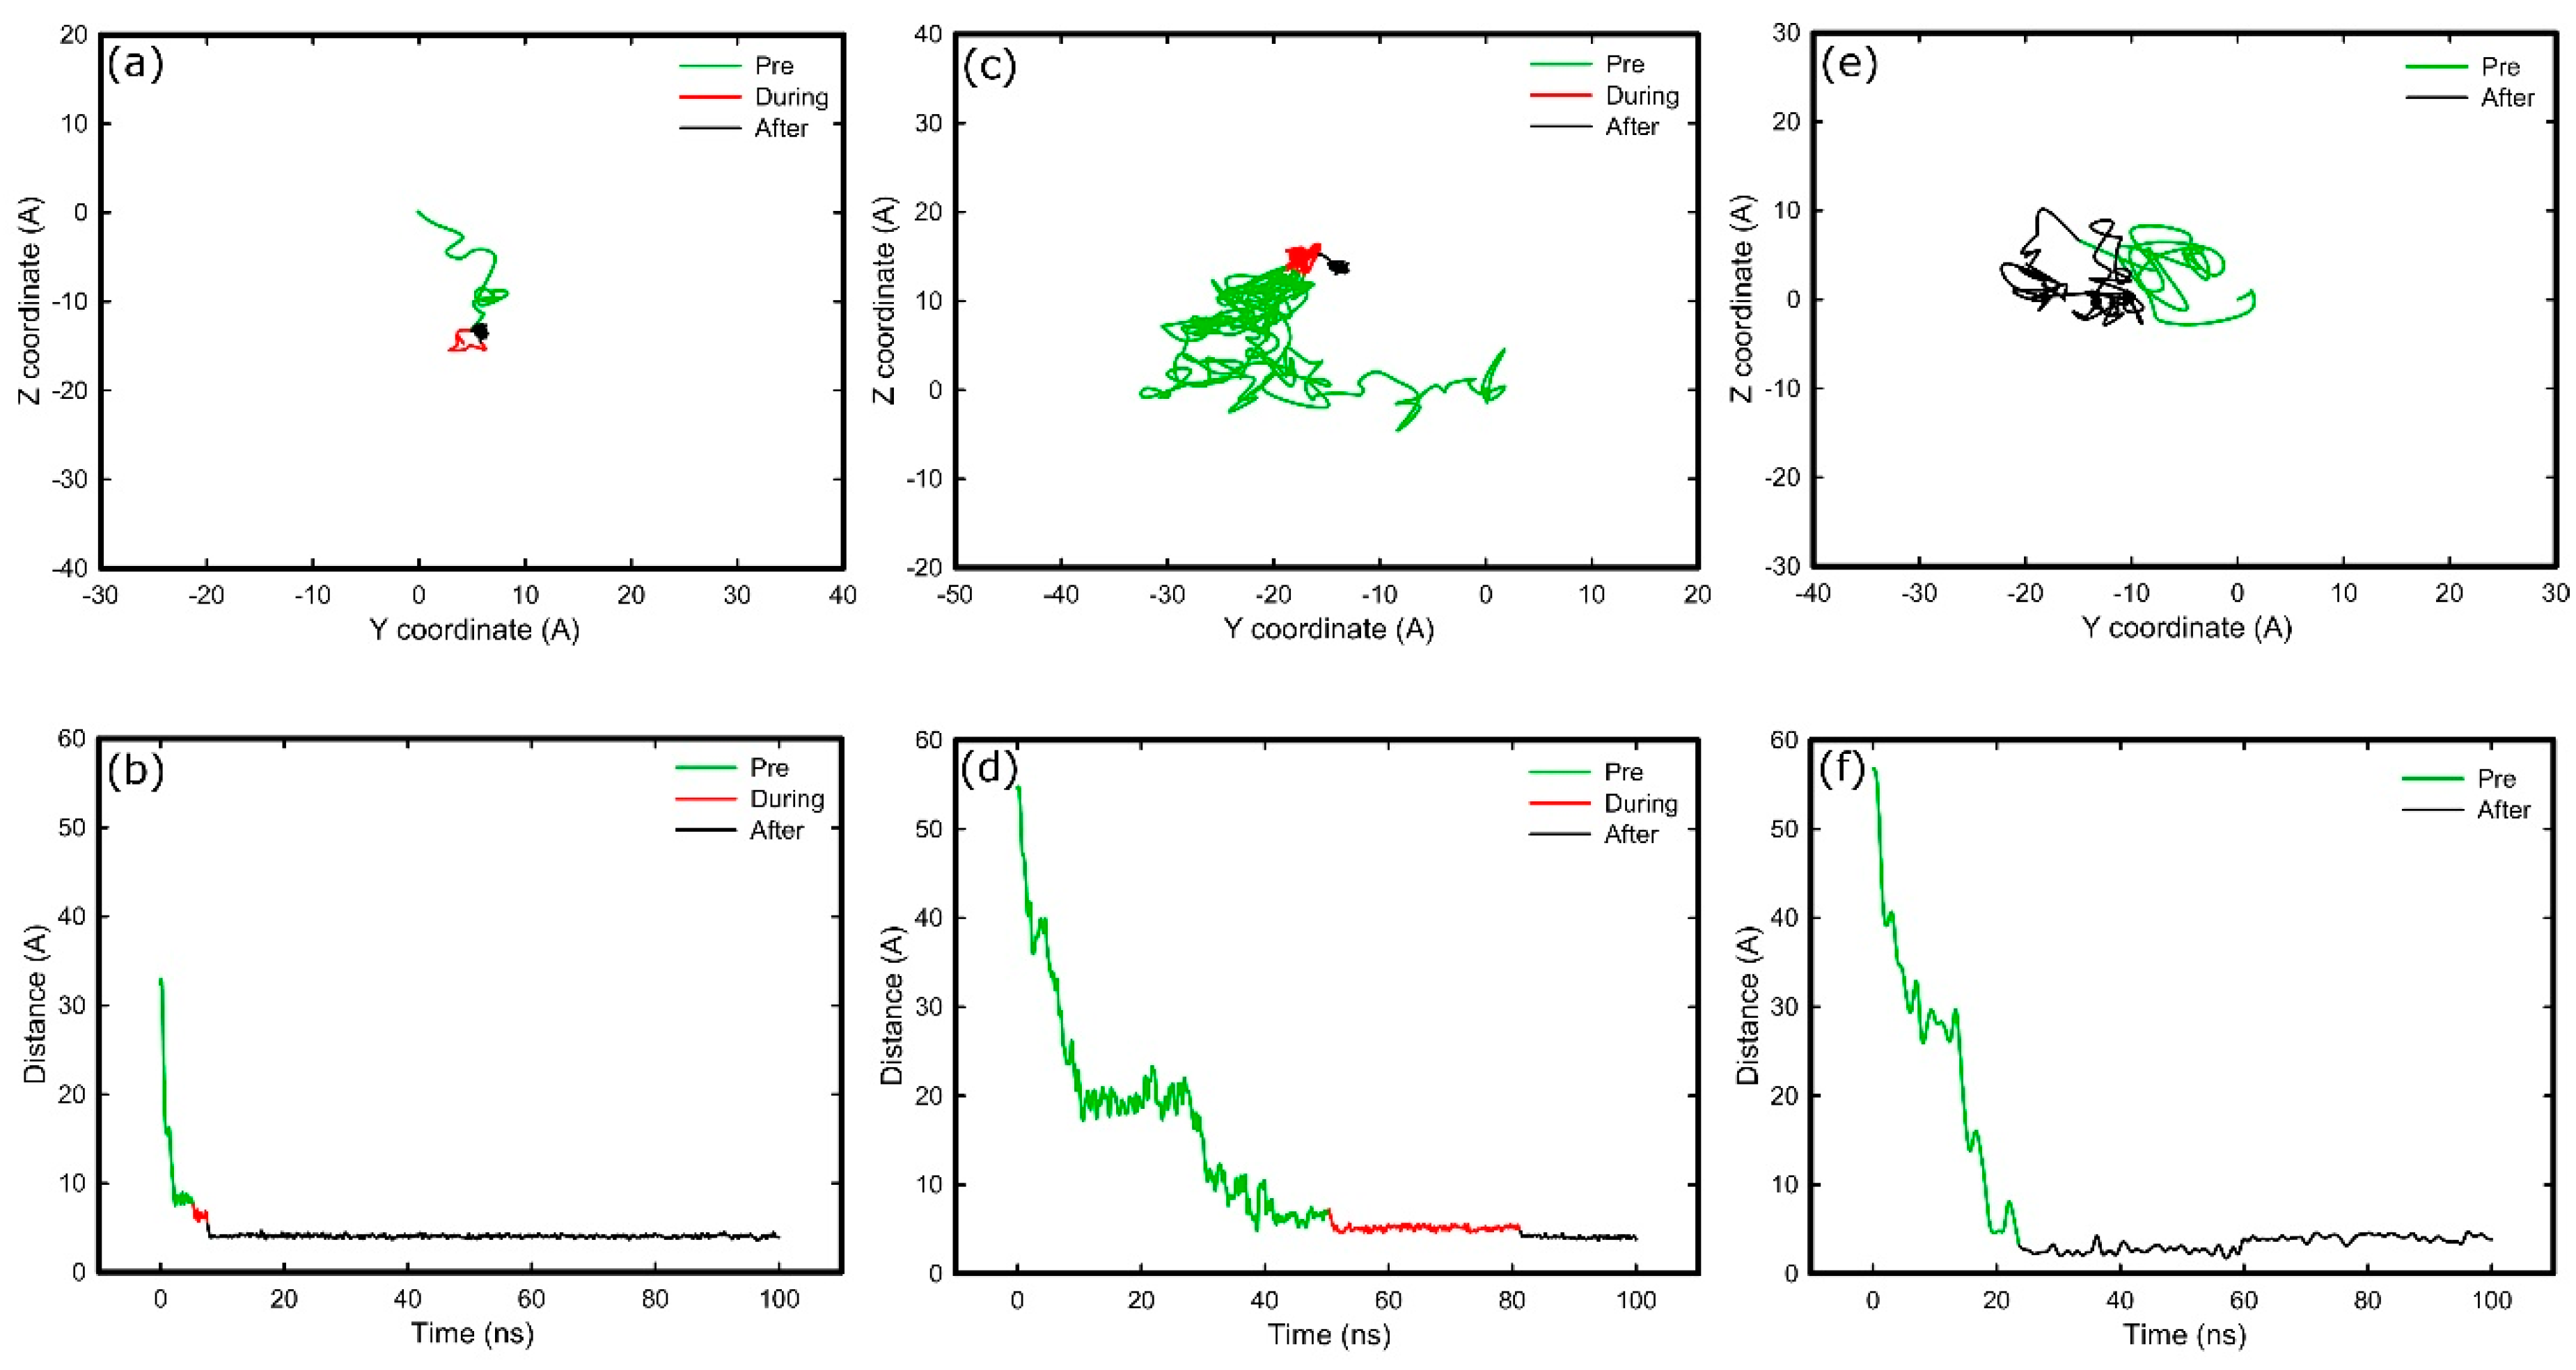
2. Results
2.1. Protein Structural Features
2.2. Simulation in Water
2.3. Adsorption on Positively Charged Surface
2.4. Adsorption on Negatively Charged Surface
2.5. Adsorption on Hydrophobic Surface
2.6. Adsorption on Hydrophilic Surface
3. Discussion
3.1. Adsorption Simulations on Charged Surfaces
3.2. Adsorption on Uncharged Surfaces
3.3. Structural Changes upon Adsorption
4. Materials and Methods
Model Surfaces
5. Conclusions
Supplementary Materials
Author Contributions
Funding
Conflicts of Interest
References
- Bauer, S.; Schmuki, P.; von der Mark, K.; Park, J. Engineering biocompatible implant surfaces part i: Materials and surfaces. Prog. Mater. Sci. 2013, 58, 261–326. [Google Scholar] [CrossRef]
- Puleo, D.A.; Bizios, R. Biological Interactions on Materials Surfaces; Springer: New York, NY, USA, 2009; p. 429. [Google Scholar]
- Anderson, J.M.; Rodriguez, A.; Chang, D.T. Foreign body reaction to biomaterials. Semin. Immunol. 2008, 20, 86–100. [Google Scholar] [CrossRef] [PubMed] [Green Version]
- Ozboyaci, M.; Kokh, D.B.; Corni, S.; Wade, R.C. Modeling and simulation of protein-surface interactions: Achievements and challenges. Q. Rev. Biophys. 2016, 49. [Google Scholar] [CrossRef] [PubMed]
- Potts, J.R.; Campbell, I.D. Structure and function of fibronectin modules. Matrix. Biol. 1996, 15, 313–320, discussion 321. [Google Scholar] [CrossRef]
- Mecham, R.P. The Extracellular Matrix: An Overview; Springer: Berlin/Heidelberg, Germany, 2011; ISBN 978-3-642-16555-9. [Google Scholar]
- Romberger, D.J. Fibronectin. Int. J. Biochem. Cell Biol. 1997, 29, 939–943. [Google Scholar] [CrossRef]
- Erickson, H.P. Reversible unfolding of fibronectin type iii and immunoglobulin domains provides the structural basis for stretch and elasticity of titin and fibronectin. Proc. Natl. Acad. Sci. USA 1994, 91, 10114–10118. [Google Scholar] [CrossRef] [PubMed]
- Liu, L.; Qin, C.; Butler, W.T.; Ratner, B.D.; Jiang, S. Controlling the orientation of bone osteopontin via its specific binding with collagen I to modulate osteoblast adhesion. J. Biomed. Mater. Res. A 2007, 80, 102–110. [Google Scholar] [CrossRef] [PubMed] [Green Version]
- Ulman, A. Formation and structure of self-assembled monolayers. Chem. Rev. 1996, 96, 1533–1554. [Google Scholar] [CrossRef] [PubMed]
- Senaratne, W.; Andruzzi, L.; Ober, C.K. Self-assembled monolayers and polymer brushes in biotechnology: Current applications and future perspectives. Biomacromolecules 2005, 6, 2427–2448. [Google Scholar] [CrossRef] [PubMed]
- Love, J.C.; Estroff, L.A.; Kriebel, J.K.; Nuzzo, R.G.; Whitesides, G.M. Self-assembled monolayers of thiolates on metals as a form of nanotechnology. Chem. Rev. 2005, 105, 1103–1169. [Google Scholar] [CrossRef] [PubMed]
- Cheng, S.S.; Chittur, K.K.; Sukenik, C.N.; Culp, L.A.; Lewandowska, K. The conformation of fibronectin on self-assembled monolayers with different surface-composition—An FTIR/ATR study. J. Colloid Interf. Sci. 1994, 162, 135–143. [Google Scholar] [CrossRef]
- Arima, Y.; Iwata, H. Effect of wettability and surface functional groups on protein adsorption and cell adhesion using well-defined mixed self-assembled monolayers. Biomaterials 2007, 28, 3074–3082. [Google Scholar] [CrossRef] [PubMed]
- Meadows, P.Y.; Walker, G.C. Force microscopy studies of fibronectin adsorption and subsequent cellular adhesion to substrates with well-defined surface chemistries. Langmuir 2005, 21, 4096–4107. [Google Scholar] [CrossRef] [PubMed]
- Ostuni, E.; Yan, L.; Whitesides, G.M. The interaction of proteins and cells with self-assembled monolayers of alkanethiolates on gold and silver. Colloid Surf. B 1999, 15, 3–30. [Google Scholar] [CrossRef]
- Prime, K.L.; Whitesides, G.M. Self-assembled organic monolayers—model systems for studying adsorption of proteins at surfaces. Science 1991, 252, 1164–1167. [Google Scholar] [CrossRef] [PubMed]
- Eisenberg, J.L.; Piper, J.L.; Mrksich, M. Using self-assembled monolayers to model cell adhesion to the 9th and 10th type III domains of fibronectin. Langmuir 2009, 25, 13942–13951. [Google Scholar] [CrossRef] [PubMed]
- Peng, C.; Liu, J.; Zhao, D.; Zhou, J. Adsorption of hydrophobin on different self-assembled monolayers: The role of the hydrophobic dipole and the electric dipole. Langmuir 2014, 30, 11401–11411. [Google Scholar] [CrossRef] [PubMed]
- Benavidez, T.E.; Torrente, D.; Marucho, M.; Garcia, C.D. Adsorption of soft and hard proteins onto OTCEs under the influence of an external electric field. Langmuir 2015, 31, 2455–2462. [Google Scholar] [CrossRef] [PubMed]
- Kubiak-Ossowska, K.; Tokarczyk, K.; Jachimska, B.; Mulheran, P.A. Bovine serum albumin adsorption at a silica surface explored by simulation and experiment. J. Phys. Chem. B 2017, 121, 3975–3986. [Google Scholar] [CrossRef] [PubMed]
- Kubiak-Ossowska, K.; Mulheran, P.A.; Nowak, W. Fibronectin module FNIII9 adsorption at contrasting solid model surfaces studied by atomistic molecular dynamics. J. Phys. Chem. B 2014, 118, 9900–9908. [Google Scholar] [CrossRef] [PubMed] [Green Version]
- Kubiak-Ossowska, K.; Jachimska, B.; Mulheran, P.A. How negatively charged proteins adsorb to negatively charged surfaces: A molecular dynamics study of bsa adsorption on silica. J. Phys. Chem. B 2016, 120, 10463–10468. [Google Scholar] [CrossRef] [PubMed]
- Kubiak-Ossowska, K.; Cwieka, M.; Kaczynska, A.; Jachimska, B.; Mulheran, P.A. Lysozyme adsorption at a silica surface using simulation and experiment: Effects of pH on protein layer structure. Phys. Chem. Chem. Phys. 2015, 17, 24070–24077. [Google Scholar] [CrossRef] [PubMed] [Green Version]
- Panos, M.; Sen, T.Z.; Ahunbay, M.G. Molecular simulation of fibronectin adsorption onto polyurethane surfaces. Langmuir 2012, 28, 12619–12628. [Google Scholar] [CrossRef] [PubMed]
- Mulheran, P.A.; Connell, D.J.; Kubiak-Ossowska, K. Steering protein adsorption at charged surfaces: Electric fields and ionic screening. RSC. Advances 2016, 6, 73709–73716. [Google Scholar] [CrossRef]
- Rabe, M.; Verdes, D.; Seeger, S. Understanding protein adsorption phenomena at solid surfaces. Adv. Colloid Interf. Sci. 2011, 162, 87–106. [Google Scholar] [CrossRef] [PubMed] [Green Version]
- Kubiak-Ossowska, K.; Mulheran, P.A. What governs protein adsorption and immobilization at a charged solid surface? Langmuir 2010, 26, 7690–7694. [Google Scholar] [CrossRef] [PubMed]
- Liao, C.Y.; Xie, Y.; Zhou, J. Computer simulations of fibronectin adsorption on hydroxyapatite surfaces. RSC Adv. 2014, 4, 15759–15769. [Google Scholar] [CrossRef]
- Wang, H.; He, Y.; Ratner, B.D.; Jiang, S. Modulating cell adhesion and spreading by control of FNIII7–10 orientation on charged self-assembled monolayers (SAMs) of alkanethiolates. J. Biomed. Mater. Res. A 2006, 77, 672–678. [Google Scholar] [CrossRef] [PubMed]
- Wilson, K.; Stuart, S.J.; Garcia, A.; Latour, R.A., Jr. A molecular modeling study of the effect of surface chemistry on the adsorption of a fibronectin fragment spanning the 7–10th type iii repeats. J. Biomed. Mater. Res. A 2004, 69, 686–698. [Google Scholar] [CrossRef] [PubMed]
- Shen, J.W.; Wu, T.; Wang, Q.; Pan, H.H. Molecular simulation of protein adsorption and desorption on hydroxyapatite surfaces. Biomaterials 2008, 29, 513–532. [Google Scholar] [CrossRef] [PubMed]
- Agashe, M.; Raut, V.; Stuart, S.J.; Latour, R.A. Molecular simulation to characterize the adsorption behavior of a fibrinogen gamma-chain fragment. Langmuir 2005, 21, 1103–1117. [Google Scholar] [CrossRef] [PubMed]
- Gray, J.J. The interaction of proteins with solid surfaces. Curr. Opin. Struct. Biol. 2004, 14, 110–115. [Google Scholar] [CrossRef] [PubMed]
- Michael, K.E.; Vernekar, V.N.; Keselowsky, B.G.; Meredith, J.C.; Latour, R.A.; Garcia, A.J. Adsorption-induced conformational changes in fibronectin due to interactions with well-defined surface chemistries. Langmuir 2003, 19, 8033–8040. [Google Scholar] [CrossRef]
- Keselowsky, B.G.; Collard, D.M.; Garcia, A.J. Surface chemistry modulates fibronectin conformation and directs integrin binding and specificity to control cell adhesion. J. Biomed. Mater. Res. A 2003, 66, 247–259. [Google Scholar] [CrossRef] [PubMed]
- Zollinger, A.J.; Smith, M.L. Fibronectin, the extracellular glue. Matrix Biol. 2017, 60–61, 27–37. [Google Scholar] [CrossRef] [PubMed]
- Jozwiak, A.B.; Kielty, C.M.; Black, R.A. Surface functionalization of polyurethane for the immobilization of bioactive moieties on tissue scaffolds. J. Mater. Chem. 2008, 18, 2240–2248. [Google Scholar] [CrossRef]
- Papastavrou, G.; Akari, S.; Mohwald, H. Interactions between hydrophilic and hydrophobic surfaces on microscopic scale and the influence of air bubbles as observed by scanning force microscopy in aqueous and alcoholic mediums. Europhys. Lett. 2000, 52, 551–556. [Google Scholar] [CrossRef]
- Kubiak-Ossowska, K.; Mulheran, P.A. Protein diffusion and long-term adsorption states at charged solid surfaces. Langmuir 2012, 28, 15577–15585. [Google Scholar] [CrossRef] [PubMed]
- Phillips, J.C.; Braun, R.; Wang, W.; Gumbart, J.; Tajkhorshid, E.; Villa, E.; Chipot, C.; Skeel, R.D.; Kale, L.; Schulten, K. Scalable molecular dynamics with namd. J. Comput. Chem. 2005, 26, 1781–1802. [Google Scholar] [CrossRef] [PubMed]
- Humphrey, W.; Dalke, A.; Schulten, K. Vmd: Visual molecular dynamics. J. Mol. Graph 1996, 14, 33–38. [Google Scholar] [CrossRef]
- Leahy, D.J.; Aukhil, I.; Erickson, H.P. 2.0 Å crystal structure of a four-domain segment of human fibronectin encompassing the RGD loop and synergy region. Cell 1996, 84, 155–164. [Google Scholar] [CrossRef]
- Essmann, U.; Perera, L.; Berkowitz, M.L.; Darden, T.; Lee, H.; Pedersen, L.G. A smooth particle mesh ewald method. J. Chem. Phys. 1995, 103, 8577–8593. [Google Scholar] [CrossRef]
- Kubiak-Ossowska, K.; Burley, G.; Patwardhan, S.V.; Mulheran, P.A. Spontaneous membrane-translocating peptide adsorption at silica surfaces: A molecular dynamics study. J. Phys. Chem. B 2013, 117, 14666–14675. [Google Scholar] [CrossRef] [PubMed] [Green Version]


| Surface | Anchoring Residues |
|---|---|
| Silica | Ser1261, Asp1263, Thr1265, Glu1278, Asp1279, Ser1286, Ser1288, Asp1289, Tyr1311, Glu1312, Asp1377, Glu1424, Val1426, Ala1428, Thr1429, Asp1438, Pro1480, Arg1508, Thr1509 |
| NH3+ | Glu1312, Thr1509 |
| COO− | Lys1469 |
| CH3–OH | Pro1430, Thr1431, Ser1458, Pro1459, Lys1478, Pro1479, Gly1480 |
| CH3 “head-on” | Thr1454, Gly1455, Gly1456, Asn1457, Lys1478, Pro1479, Gly1480, Val1481, Thr1509, |
| CH3 “side-on” | Lys1275, Asn1276, Thr1355, Pro1376, Ser1378, Thr1454, Gly1455, Gly1456, Asn1457 |
| CH3 “beta-on” | Thr1431, Tyr1446, Asn1457, Ser1458, Pro1459, Gln1461, Phe1463, Thr1464, Pro1466, Ser1475, Gly1476 |
| OH–OH | Thr1429, Pro1430, Thr1431, Pro1479 |
| CH3–OH | Asn1457, Lys1478, Pro1479, Gly1480 |
| Surface | Successful Adsorptions | Anchoring Residues | Resulted Conformation | Cell-Binding Domain | Specific Orientation | Mobile | Anchoring Time (ns) |
|---|---|---|---|---|---|---|---|
| Hydrophobic | 4/14 | Thr1431 | Head-on | Exposed | No | Yes | 35.0 |
| Thr1431 | Beta-on | Buried | No | No | 97.3 | ||
| Asn1457 | Head-on | Exposed | No | Yes | 15.5 | ||
| Asn1457 & Ser1378 | Side-on | Buried | No | Yes | 43.5 | ||
| Hydrophilic | 2/3 | Asn1457 | Head-on | Exposed | No | Yes | 138.5 |
| Thr1429 | Head-on | Exposed | No | No | 71.7 | ||
| + Charged | 2/2 | Ser1261 & Thr1509 | Side-on | Exposed | Yes | Yes | 3.1 |
| Glu1312 & Thr1509 | Side-on | Exposed | Yes | No | 5.3 | ||
| − Charged | 1/2 | Lys1469 | - | Buried | No | No | 53.0 |
© 2018 by the authors. Licensee MDPI, Basel, Switzerland. This article is an open access article distributed under the terms and conditions of the Creative Commons Attribution (CC BY) license (http://creativecommons.org/licenses/by/4.0/).
Share and Cite
Liamas, E.; Kubiak-Ossowska, K.; Black, R.A.; Thomas, O.R.T.; Zhang, Z.J.; Mulheran, P.A. Adsorption of Fibronectin Fragment on Surfaces Using Fully Atomistic Molecular Dynamics Simulations. Int. J. Mol. Sci. 2018, 19, 3321. https://doi.org/10.3390/ijms19113321
Liamas E, Kubiak-Ossowska K, Black RA, Thomas ORT, Zhang ZJ, Mulheran PA. Adsorption of Fibronectin Fragment on Surfaces Using Fully Atomistic Molecular Dynamics Simulations. International Journal of Molecular Sciences. 2018; 19(11):3321. https://doi.org/10.3390/ijms19113321
Chicago/Turabian StyleLiamas, Evangelos, Karina Kubiak-Ossowska, Richard A. Black, Owen R.T. Thomas, Zhenyu J. Zhang, and Paul A. Mulheran. 2018. "Adsorption of Fibronectin Fragment on Surfaces Using Fully Atomistic Molecular Dynamics Simulations" International Journal of Molecular Sciences 19, no. 11: 3321. https://doi.org/10.3390/ijms19113321