Complete Mitochondrial Genome of Suwallia teleckojensis (Plecoptera: Chloroperlidae) and Implications for the Higher Phylogeny of Stoneflies


Abstract
:1. Introduction
2. Results and Discussion
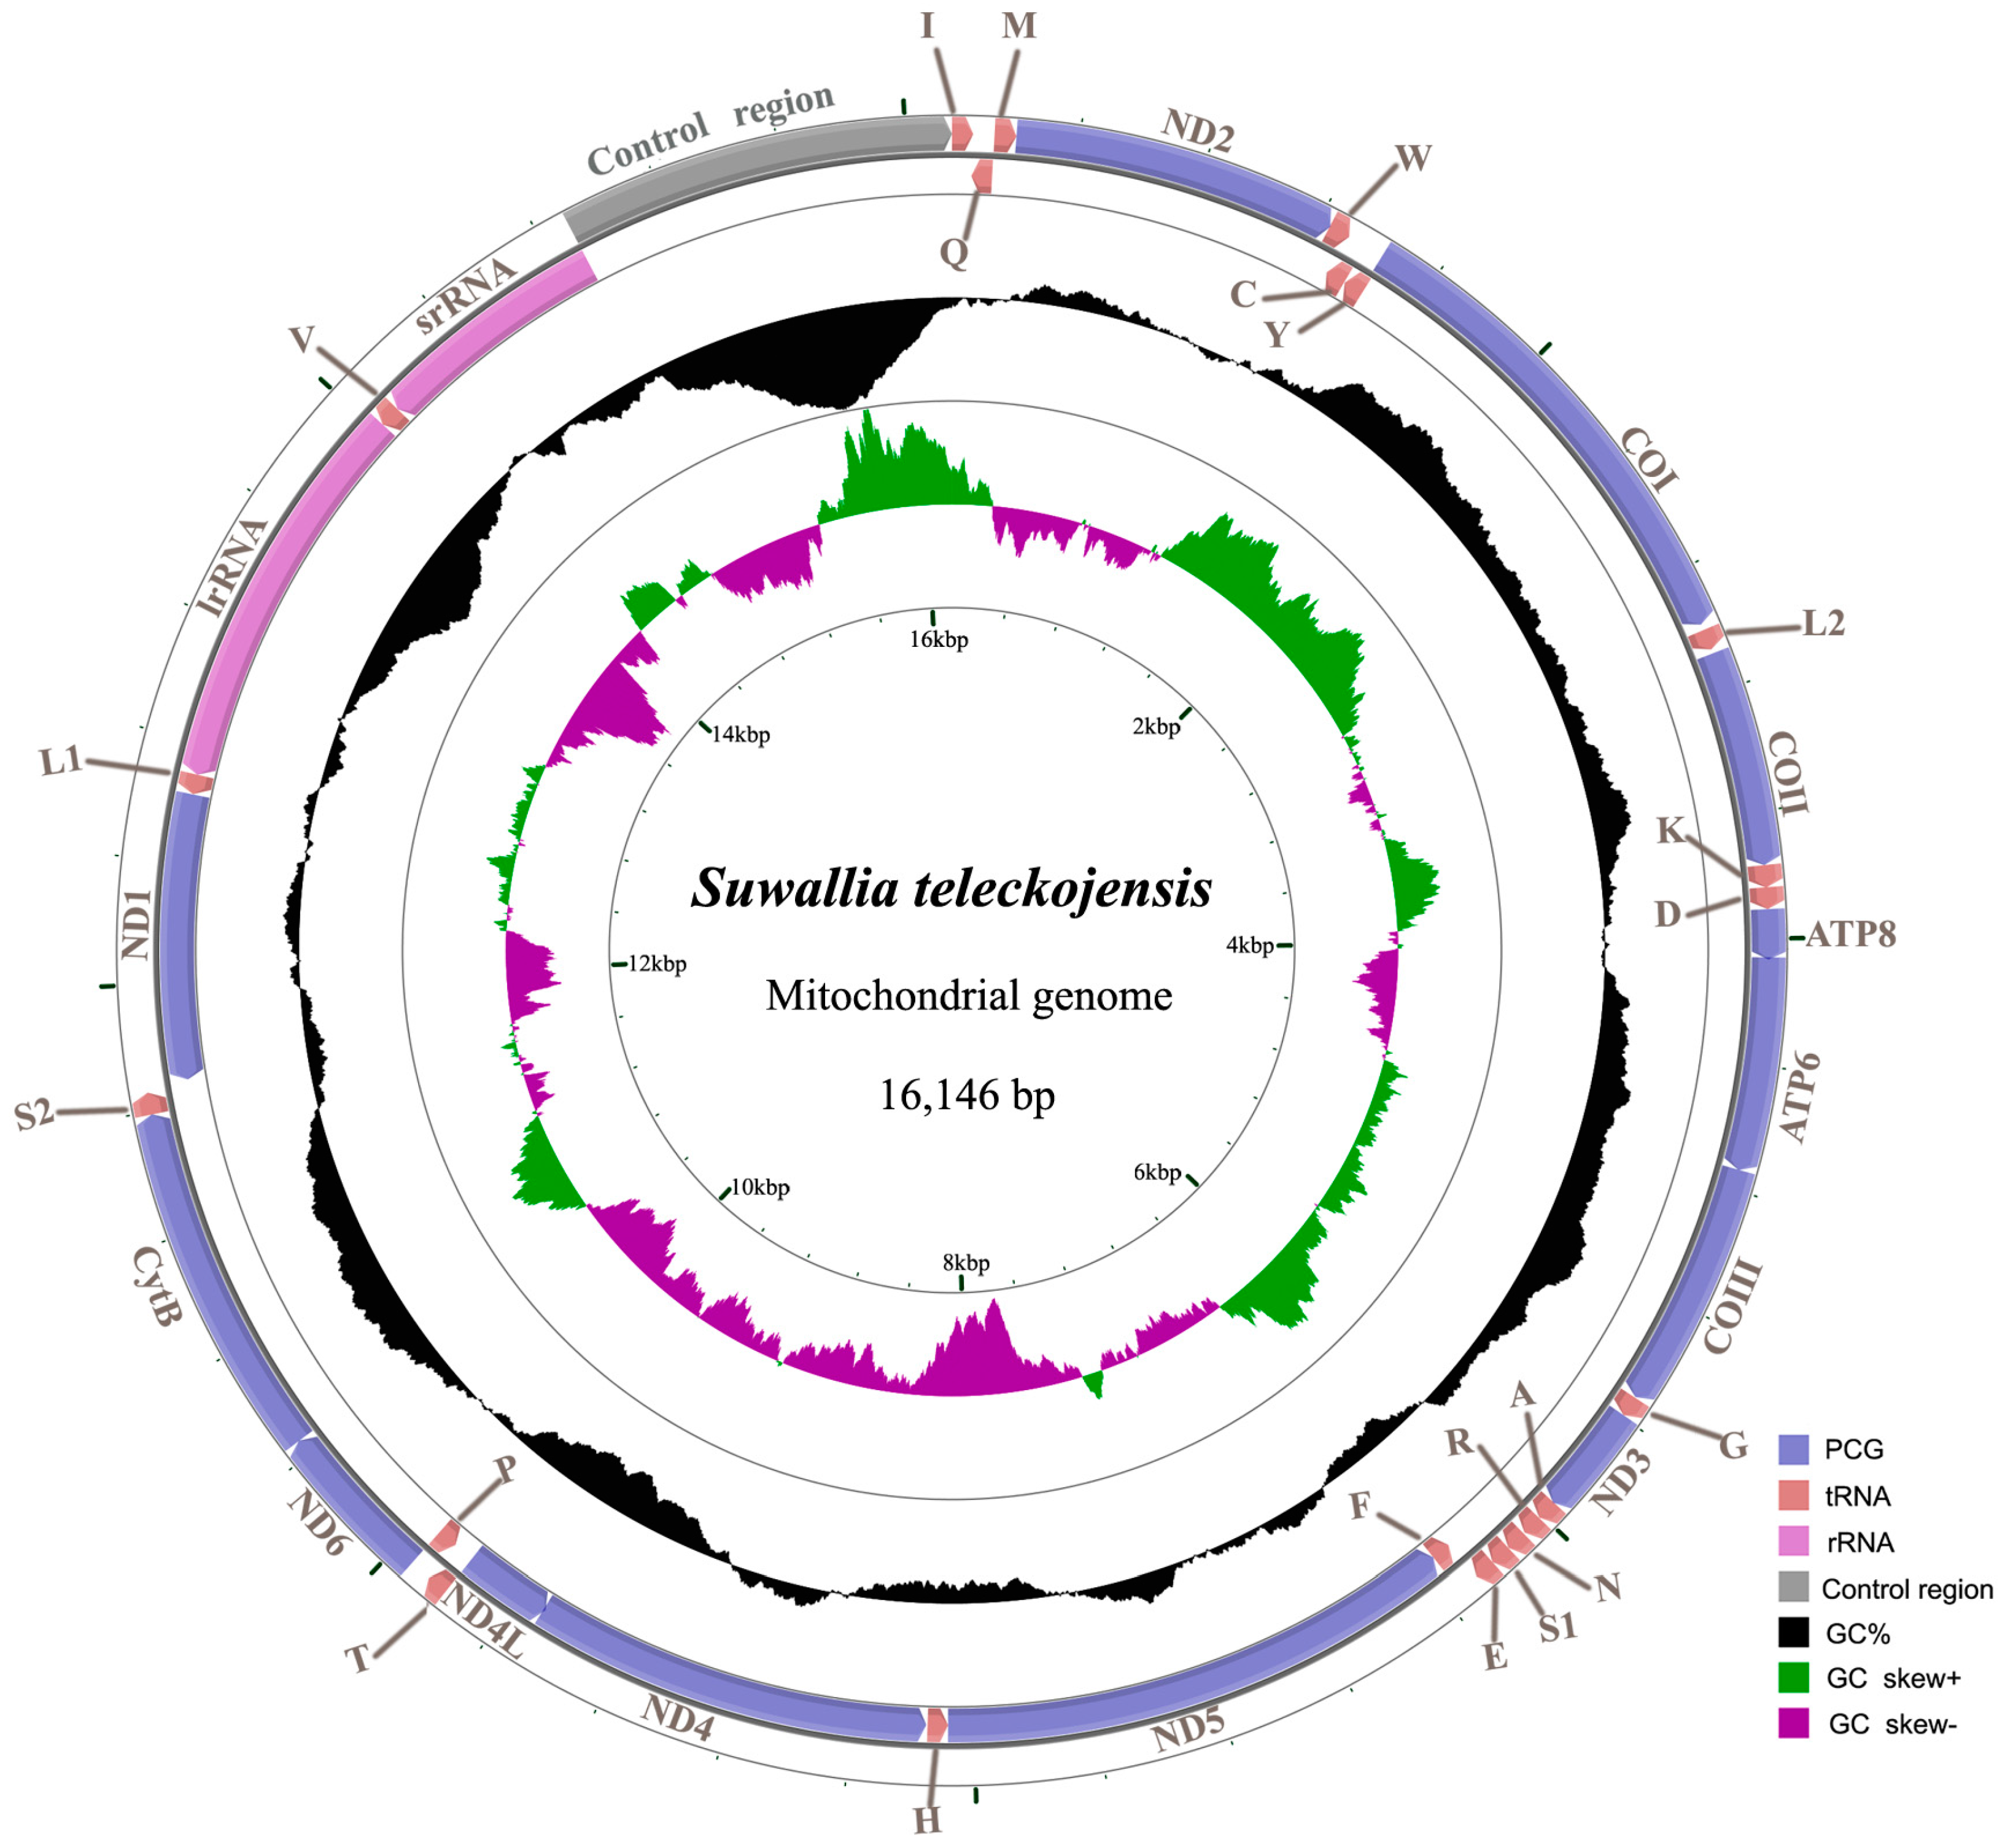
2.1. Genome Organization and Base Composition
2.2. Protein-Coding Genes and Codon Usage
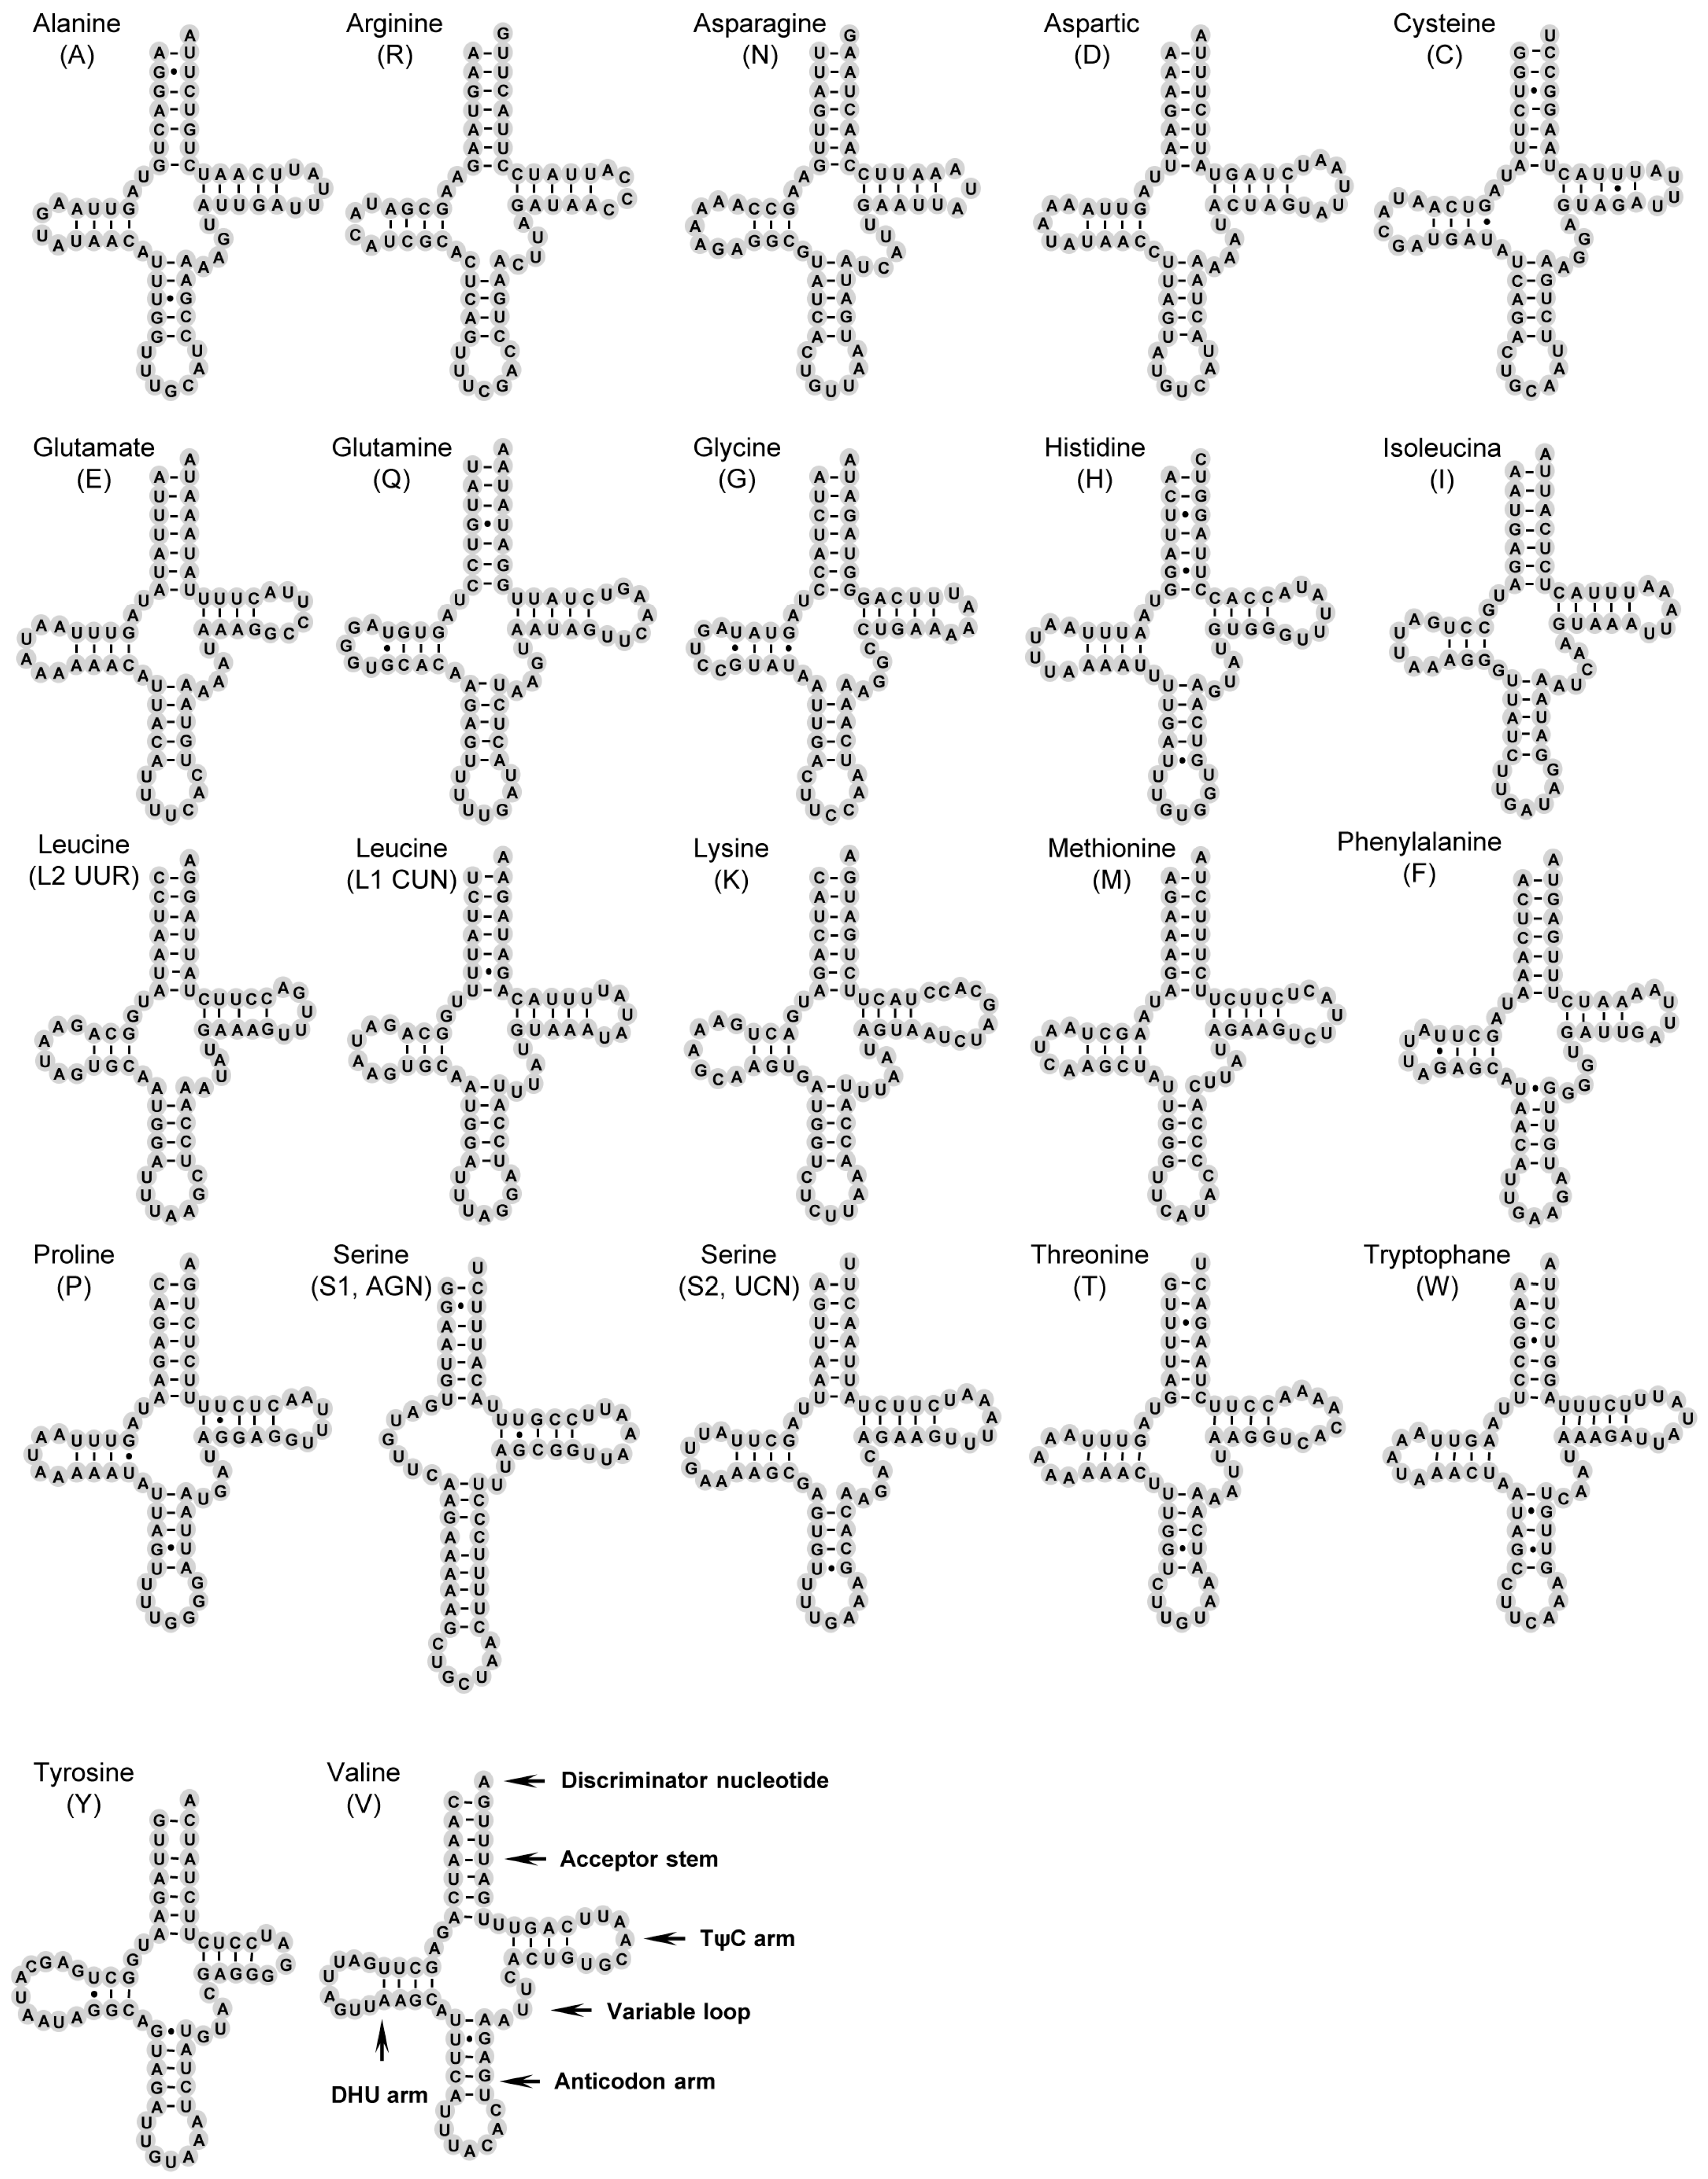
2.3. Transfer RNAs
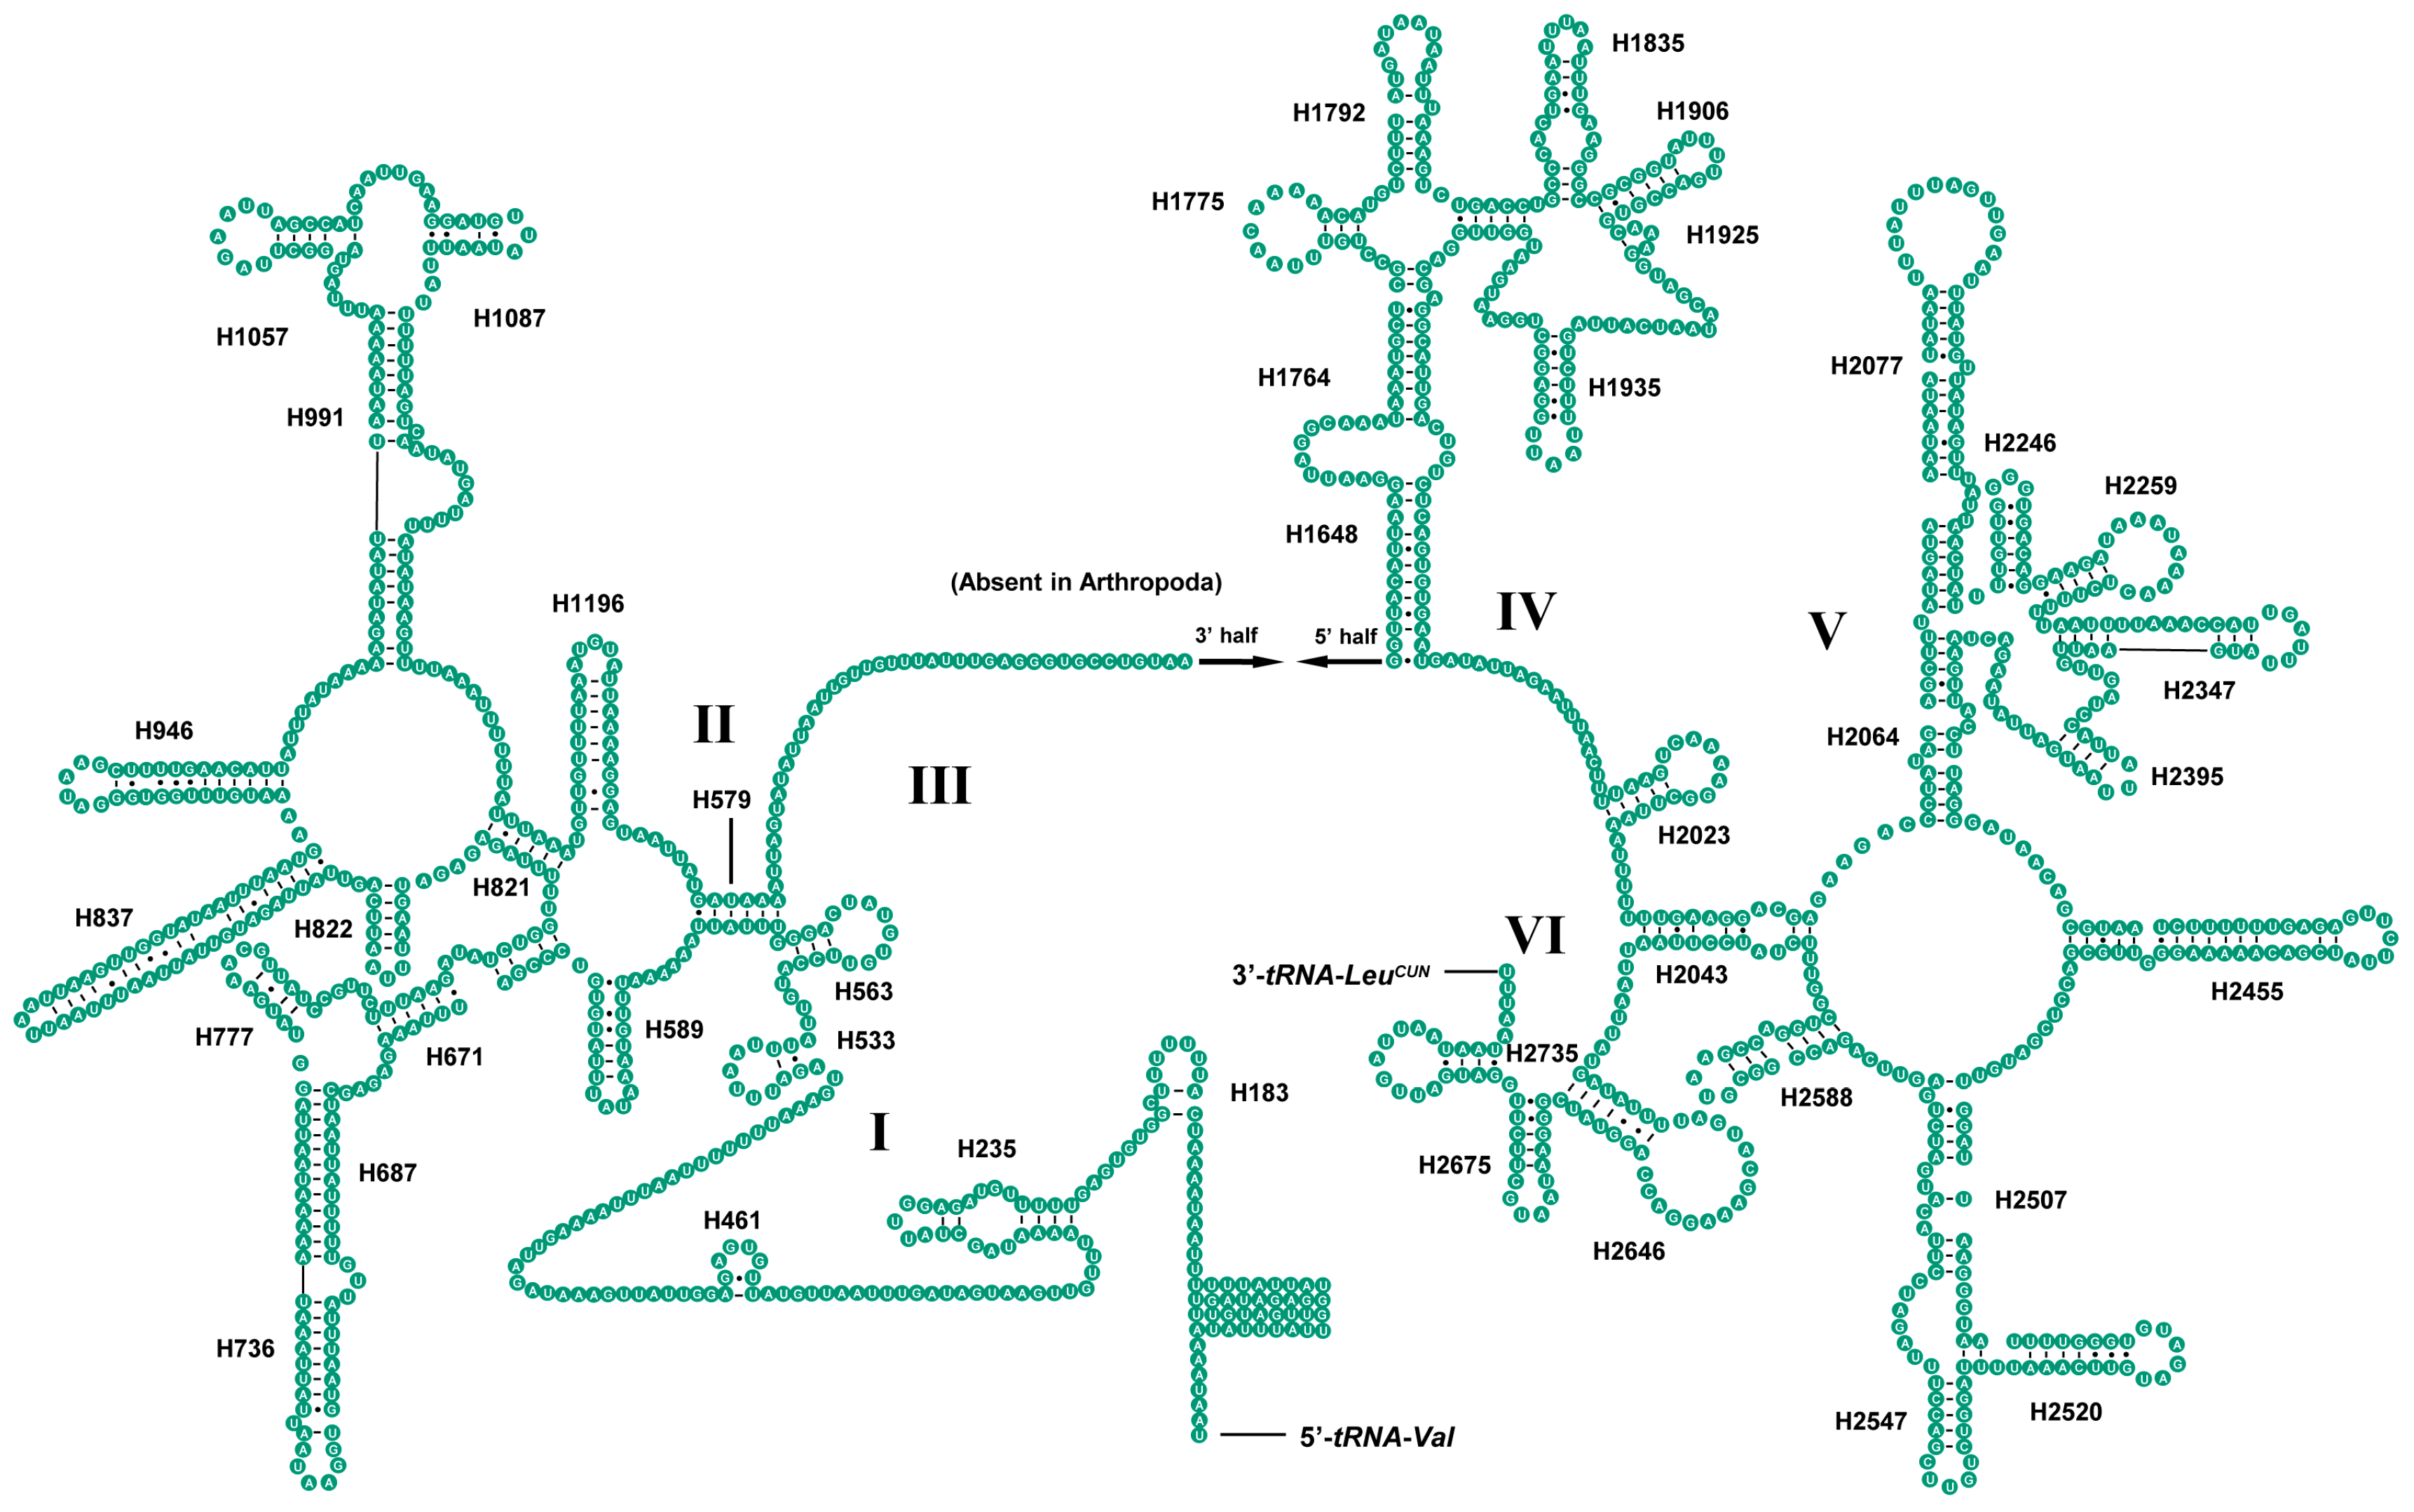
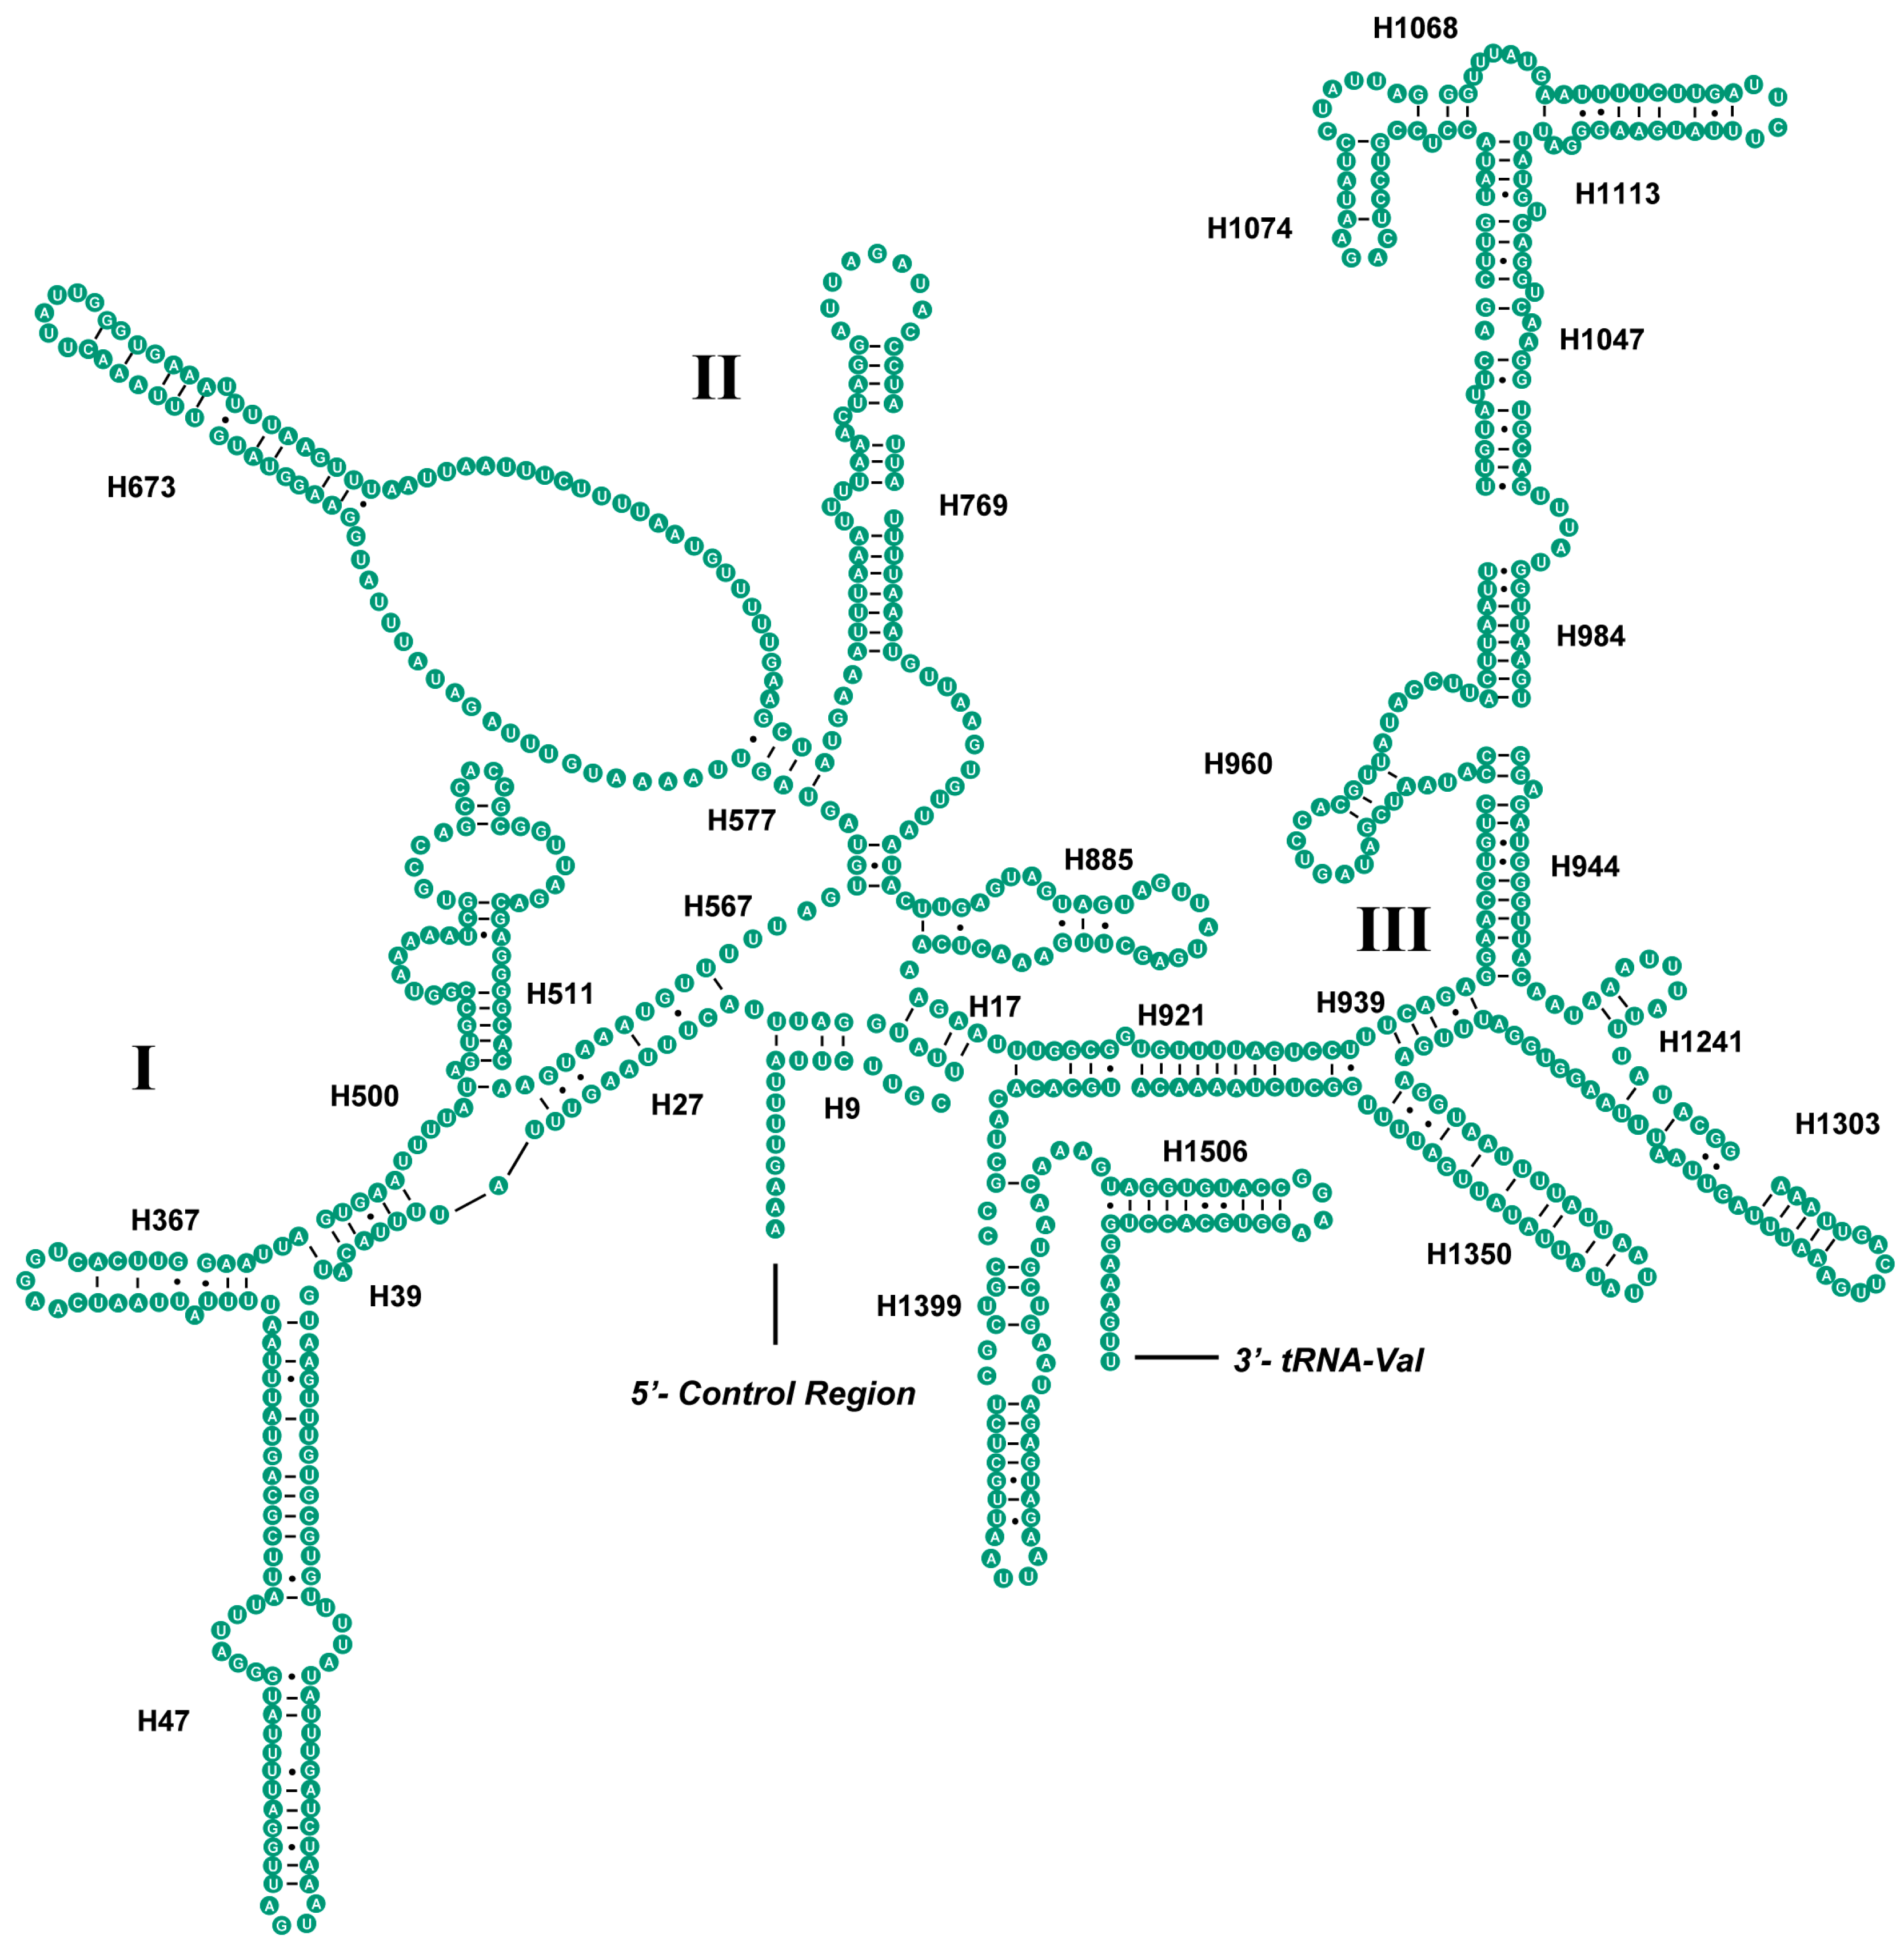
2.4. Ribosomal RNAs
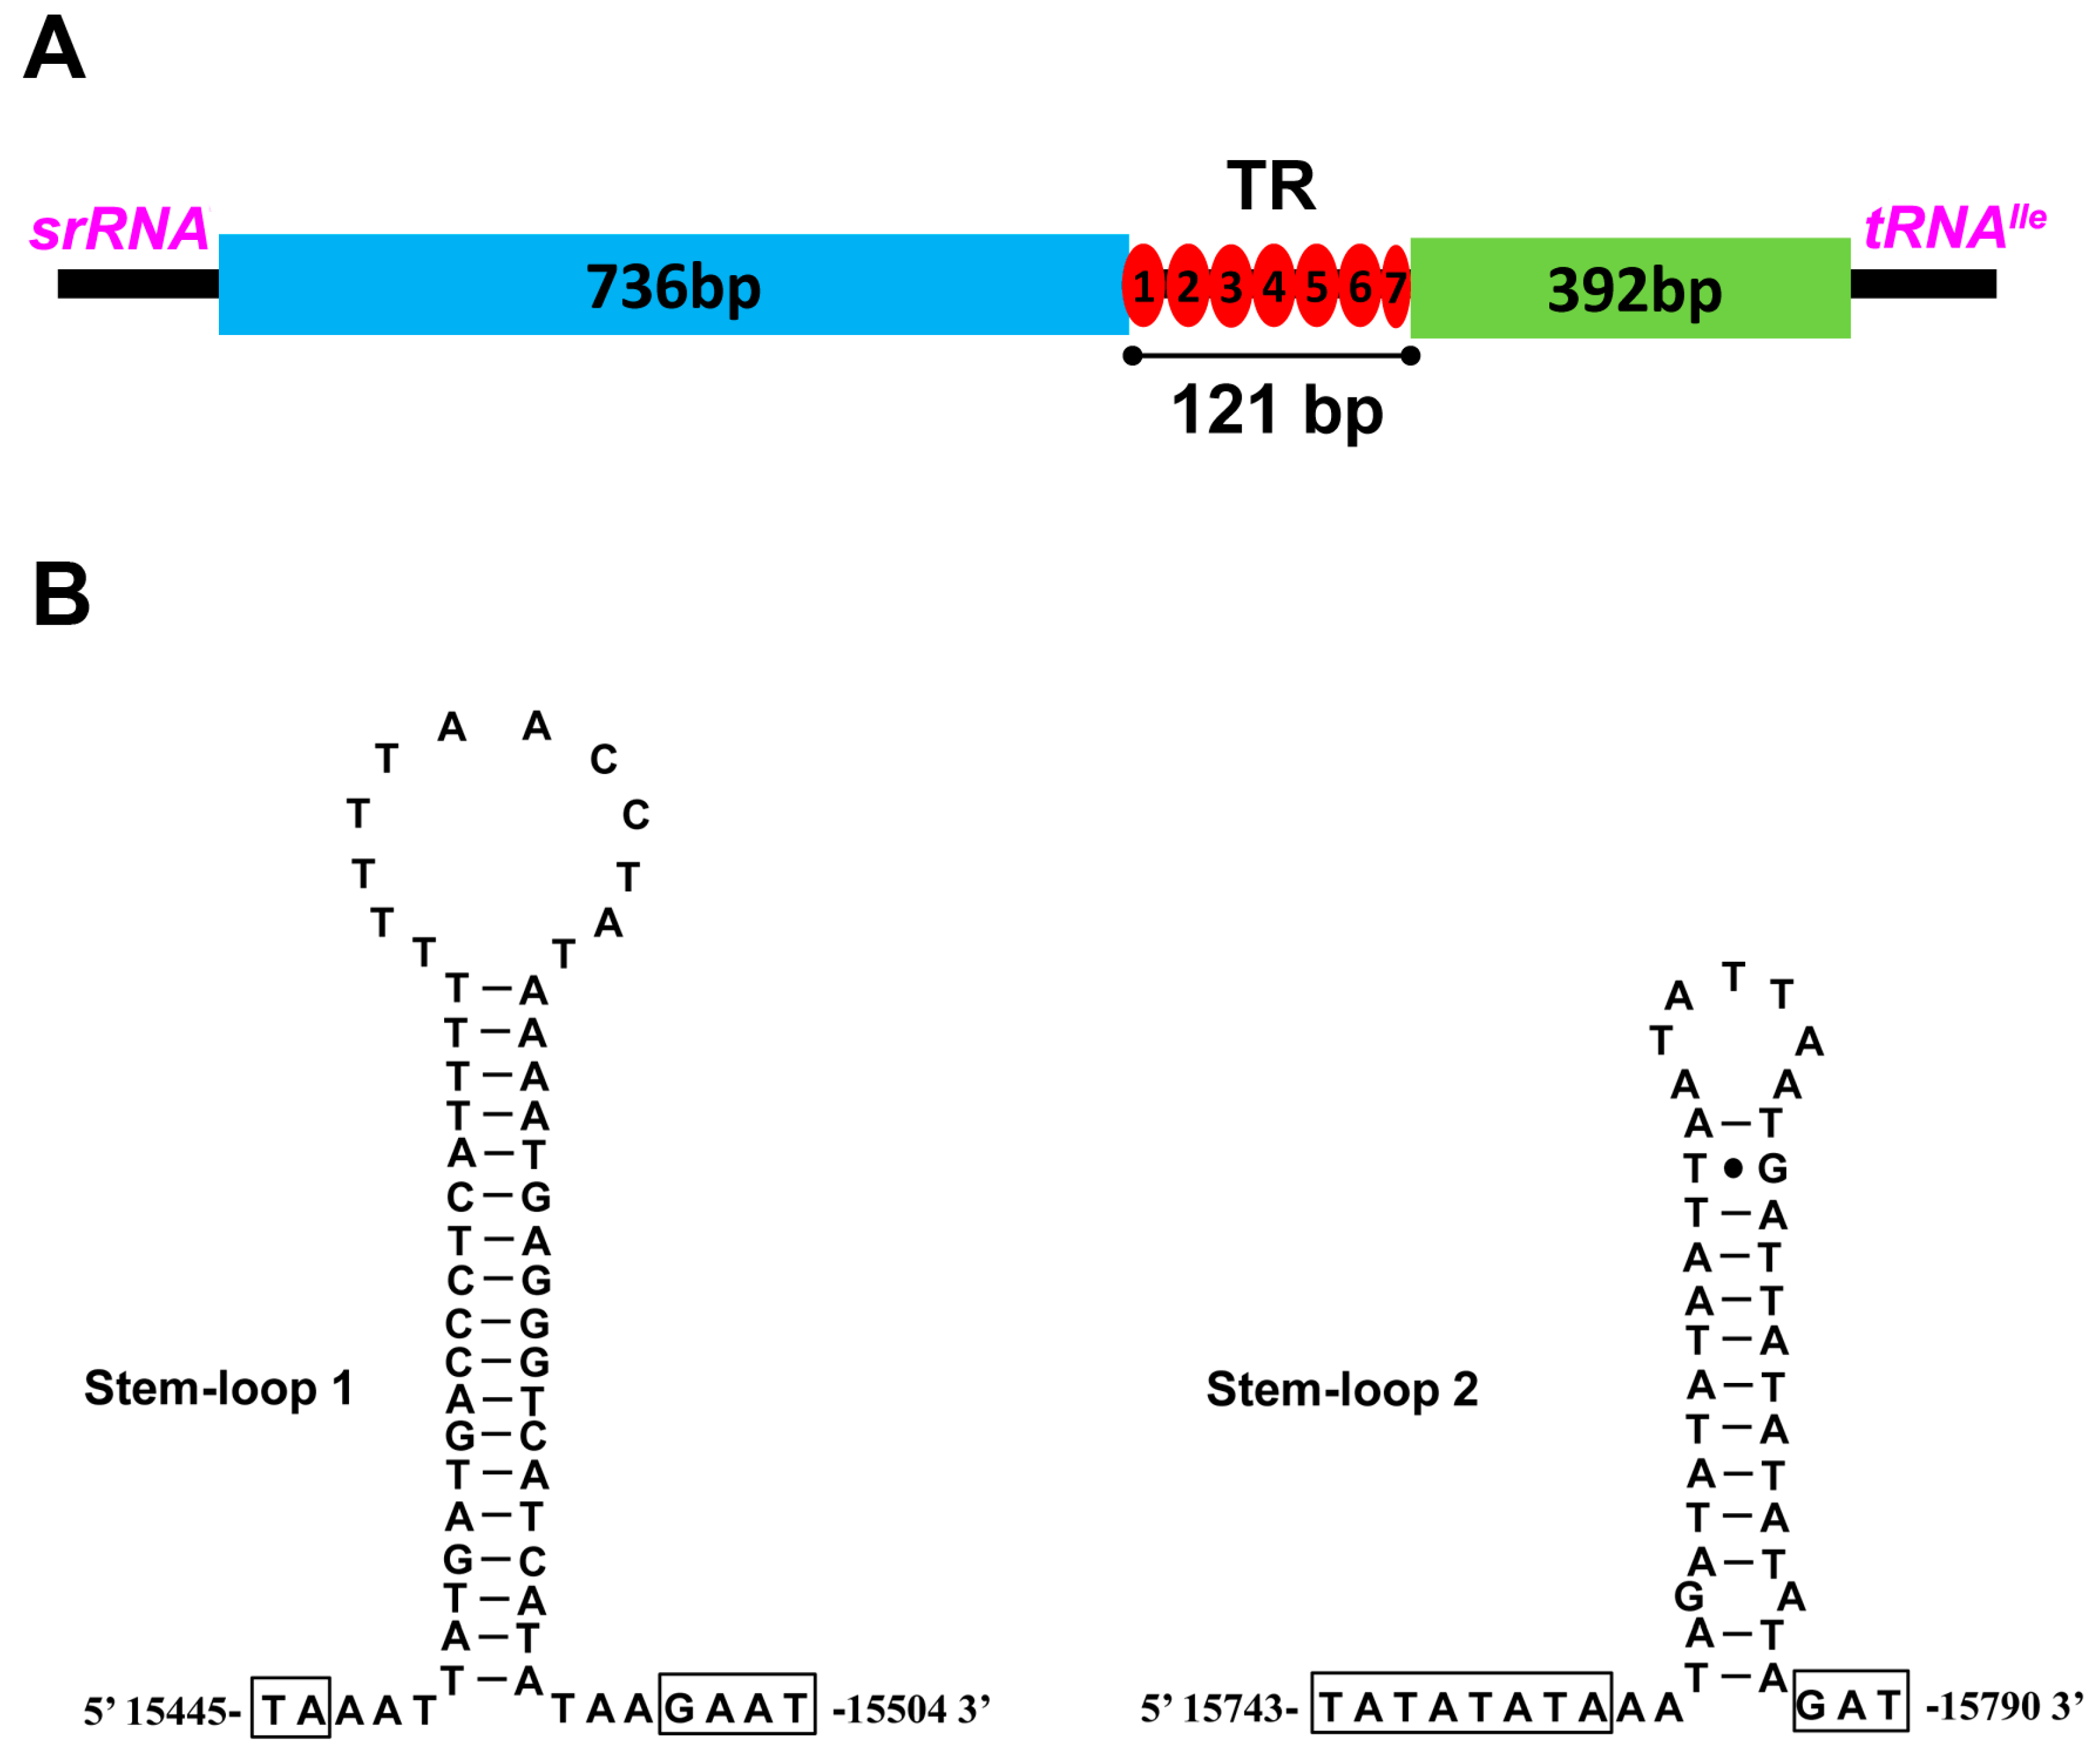
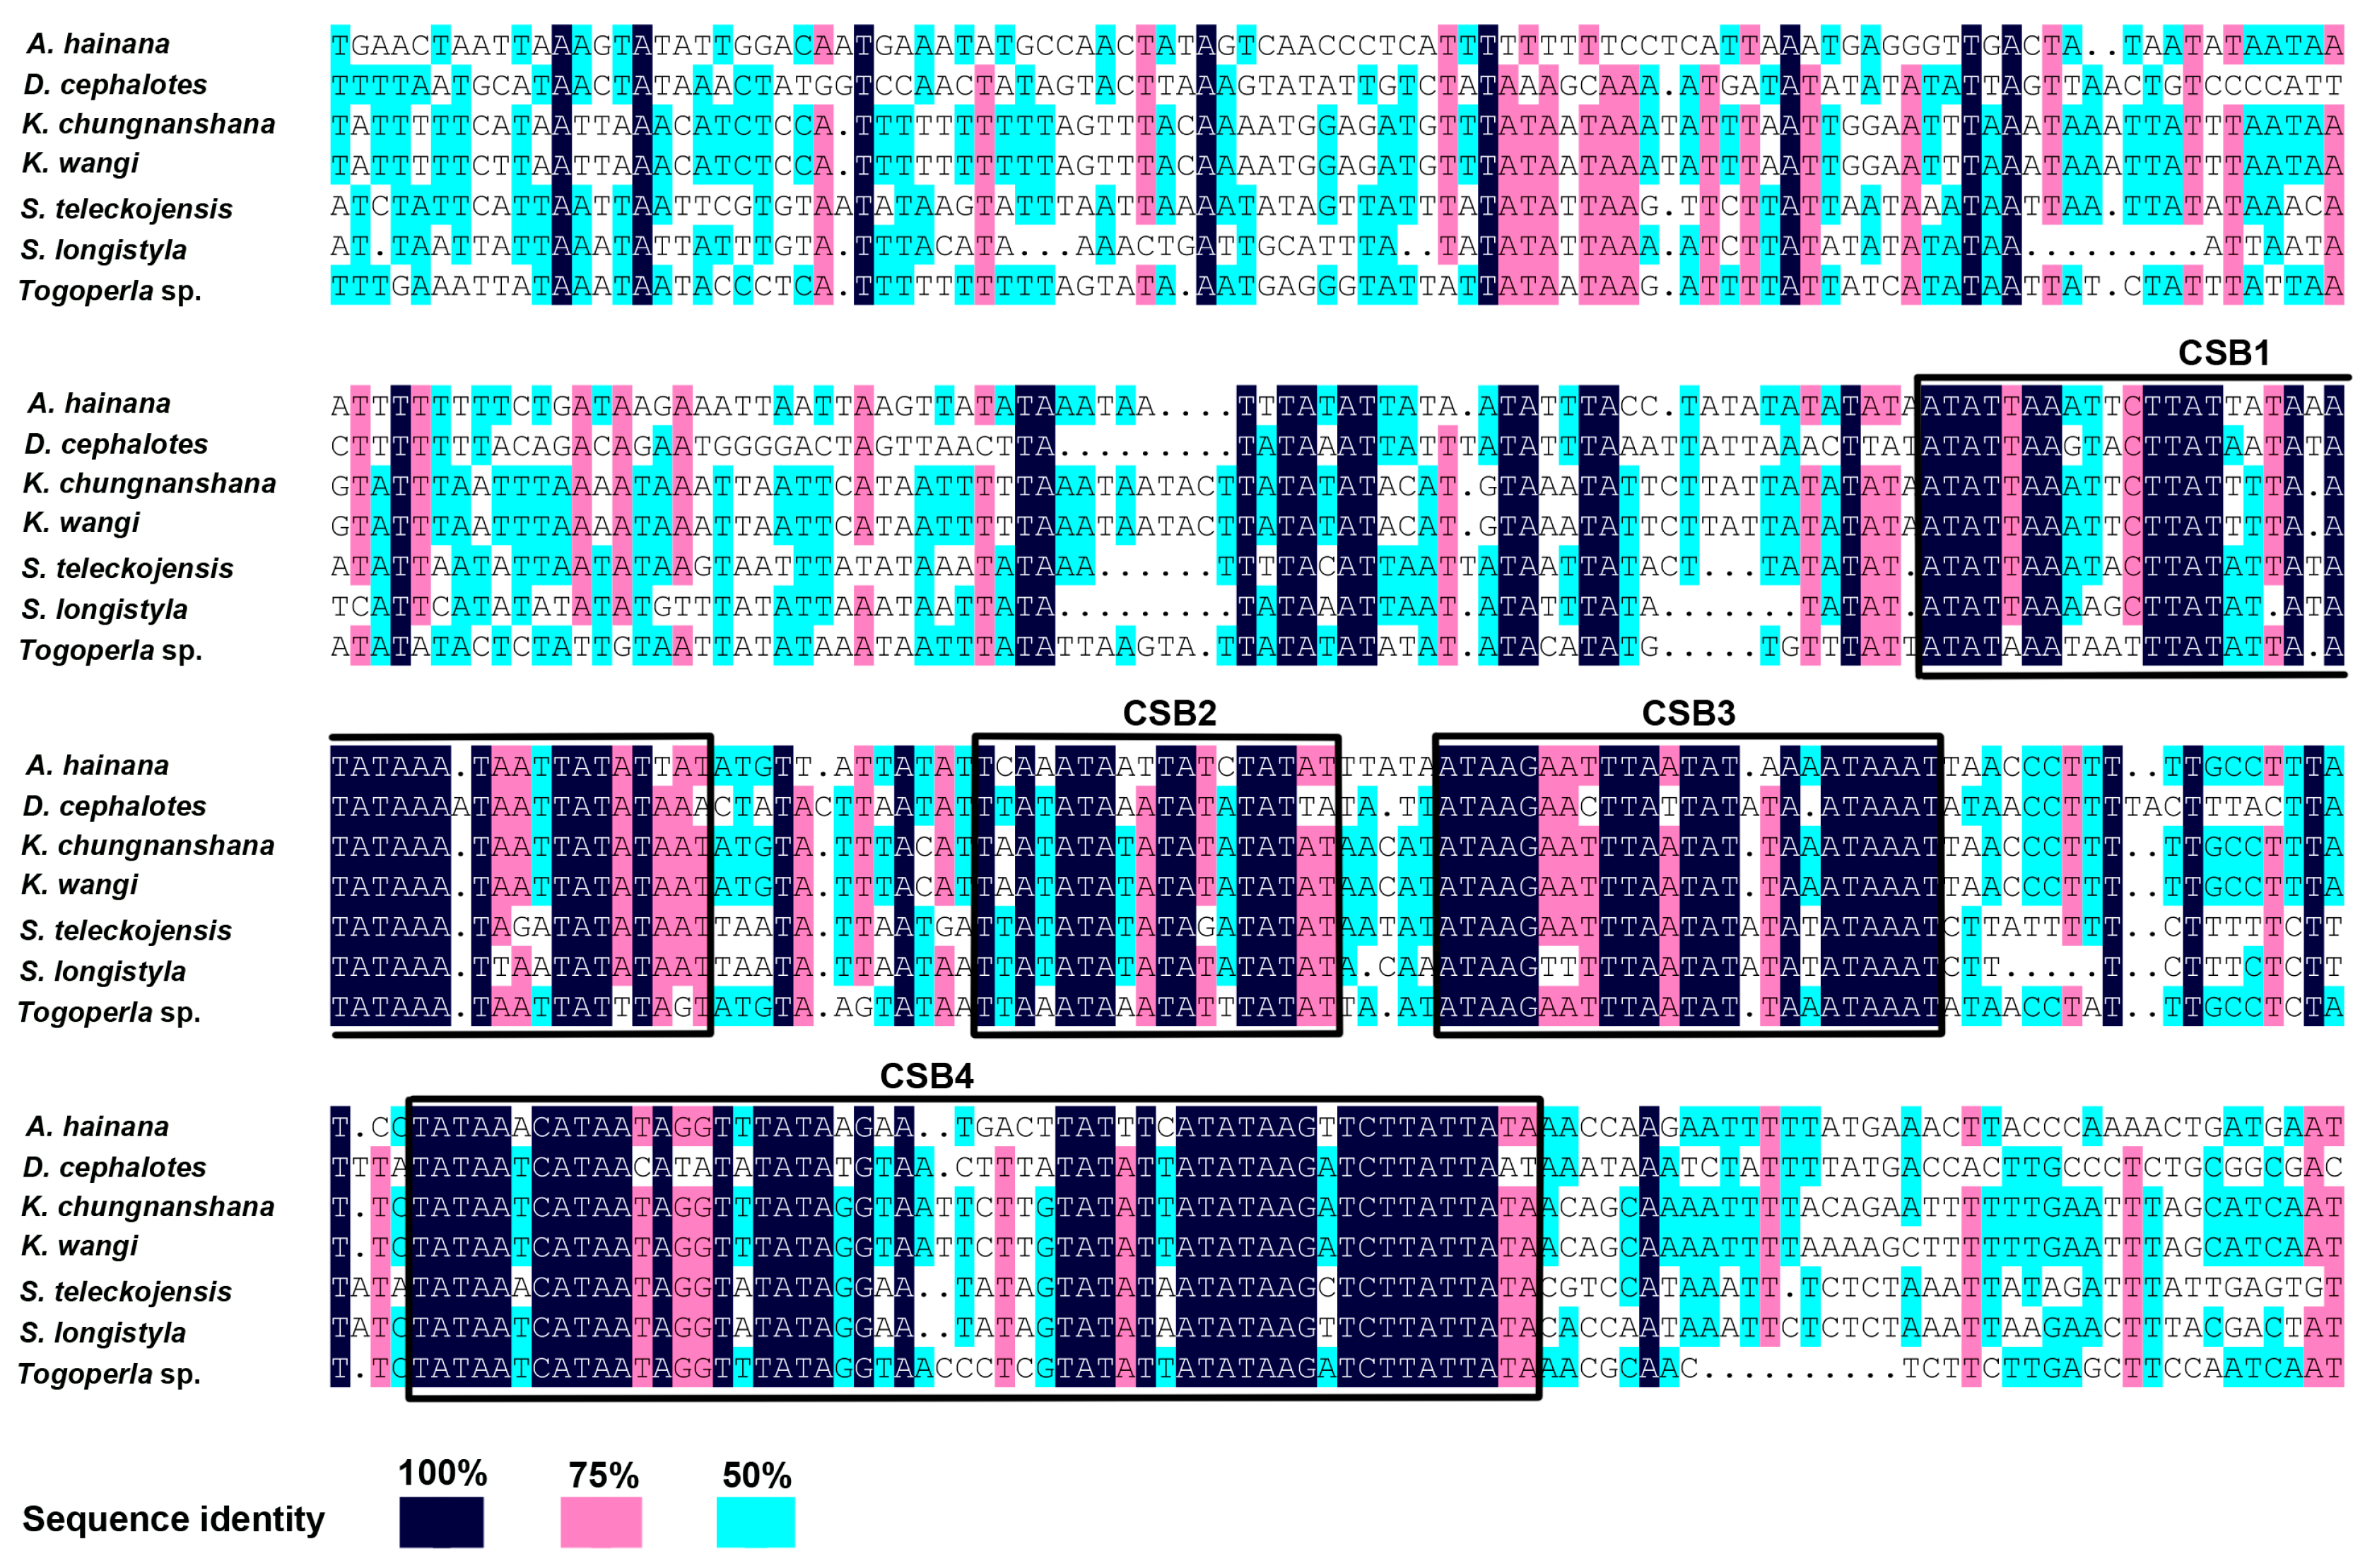
2.5. The Control Region
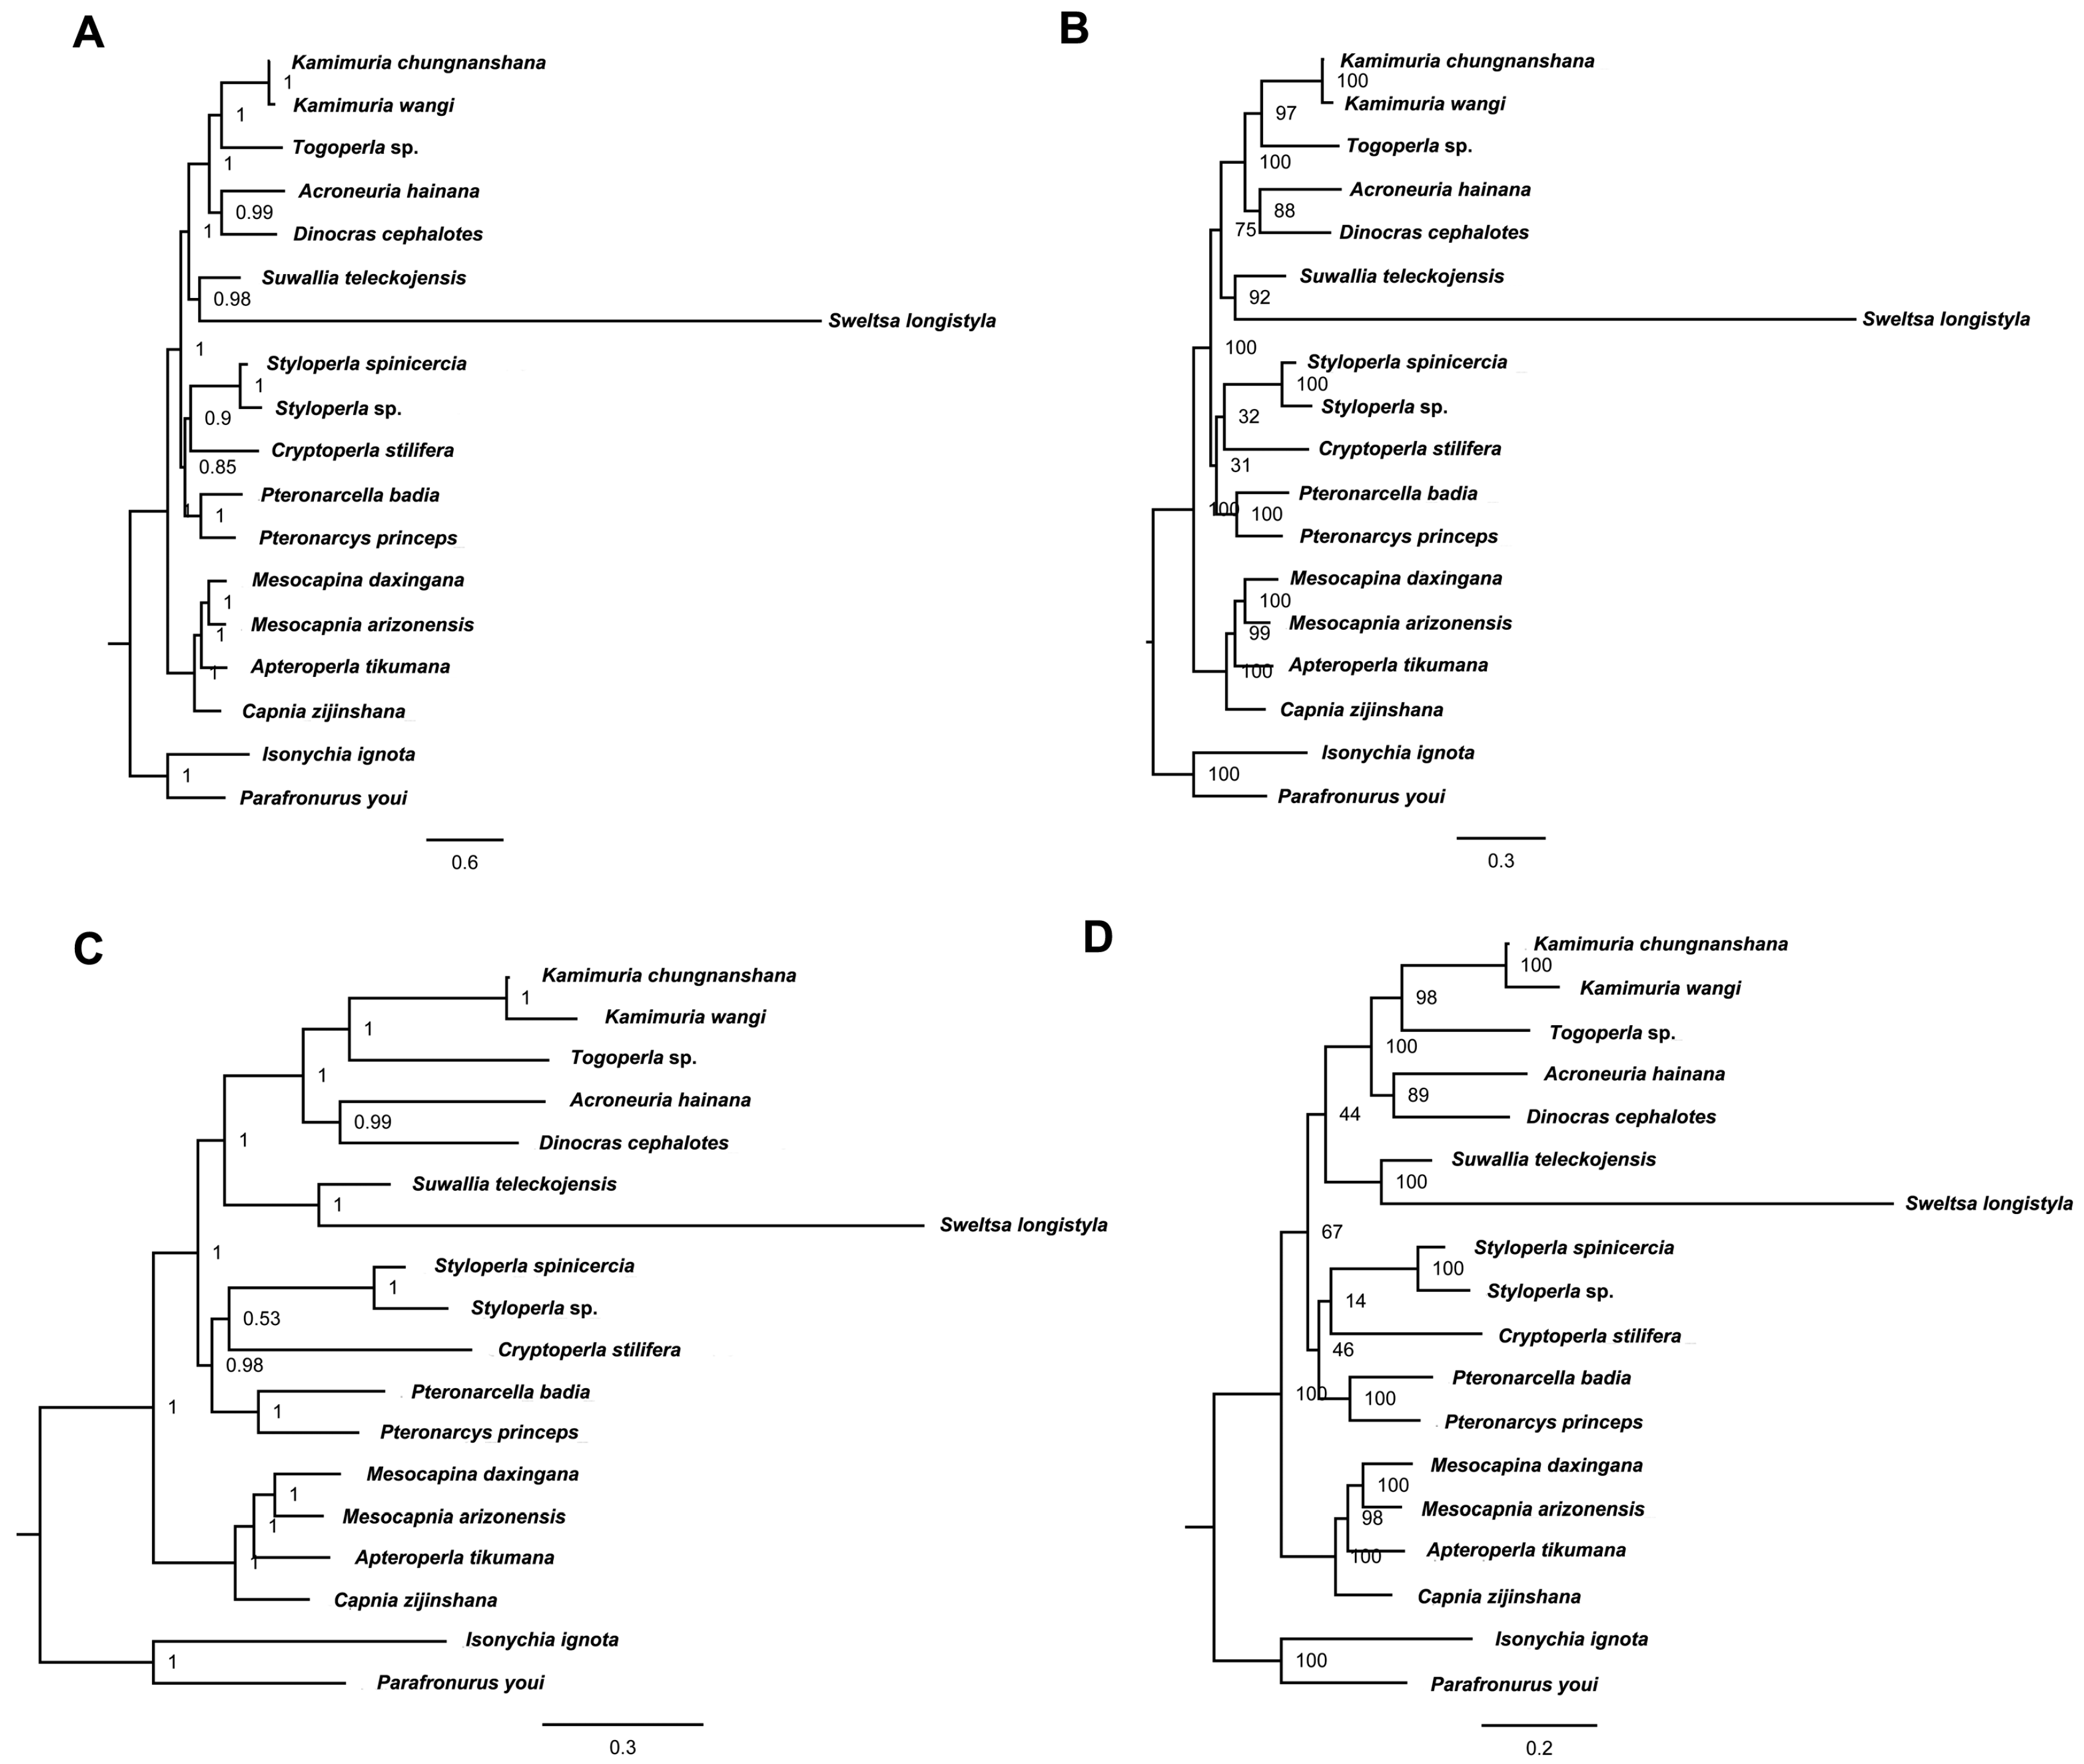
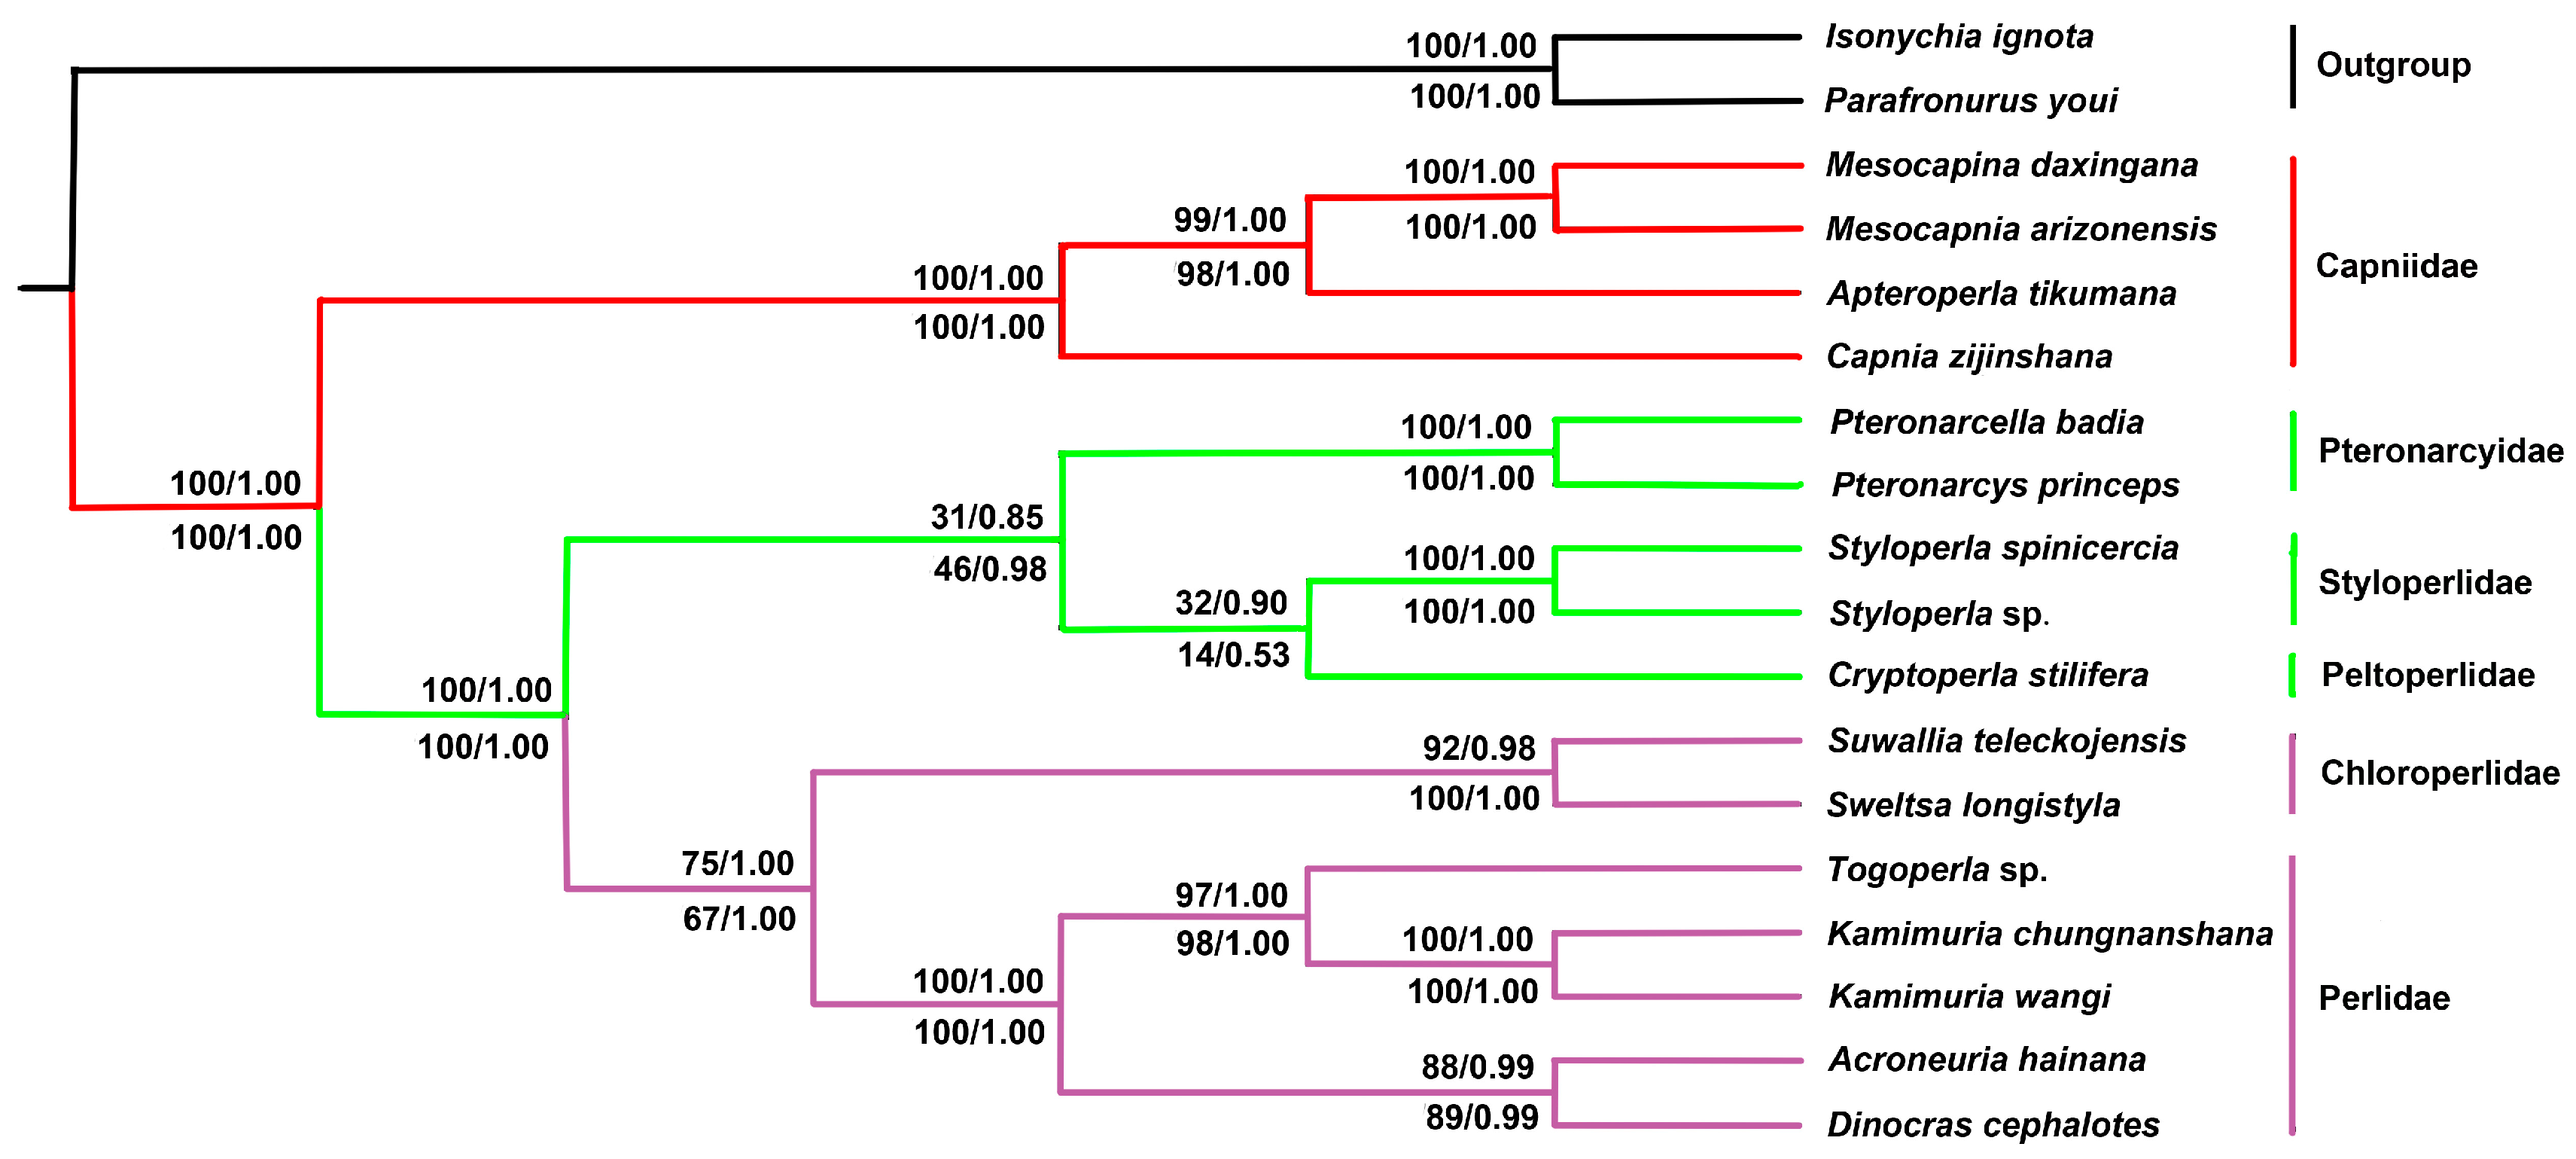
2.6. Phylogenetic Relationship
3. Materials and Methods
3.1. Specimens and DNA Extraction
3.2. Genome Sequencing, Assembly, and Annotation
3.3. Phylogenetic Analysis
Acknowledgments
Author Contributions
Conflicts of Interest
Abbreviations
| mtDNA | Mitochondrial DNA |
| PCG | Protein-Coding Gene |
| tRNA | Transfer RNA |
| rRNA | Ribosomal RNA |
| CR | Control Region |
| SL | Stem-Loop |
| CSB | Conserved Sequence Block |
| ML | Maximum Likelihood |
| BI | Bayesian Inferences |
Appendix A
References
- Boore, J.L. Animal mitochondrial genomes. Nucleic Acids Res. 1999, 27, 1767–1780. [Google Scholar] [CrossRef] [PubMed]
- Wolstenholme, D.R. Animal mitochondrial DNA: Structure and evolution. Int. Rev. Cytol. 1992, 141, 173–216. [Google Scholar] [PubMed]
- Gissi, C.; Iannelli, F.; Pesole, G. Evolution of the mitochondrial genome of metazoa as exemplified by comparison of congeneric species. Heredity 2008, 101, 301–320. [Google Scholar] [CrossRef] [PubMed]
- Fochetti, R.; Figueroa, J.M.T. Global diversity of stoneflies (Plecoptera, Insecta) in freshwater. Hydrobiologia 2008, 595, 365–377. [Google Scholar] [CrossRef] [Green Version]
- Plecoptera Species File Online. Available online: http://Plecoptera.SpeciesFile.org (accessed on 21 January 2018).
- Alexander, K.D.; Stewart, K.W. Revision of the genus Suwallia Ricker (Plecoptera: Chloroperlidae). Trans. Am. Entomol. Soc. 1999, 125, 185–250. [Google Scholar]
- Judson, S.W.; Nelson, C.R. A guide to Mongolian stoneflies (Insecta: Plecoptera). Zootaxa 2012, 3541, 1–118. [Google Scholar]
- Chen, Z.T.; Du, Y.Z. A new species of Suwallia (Plecoptera: Chloroperlidae) from China. Zootaxa 2015, 4018, 297–300. [Google Scholar] [CrossRef] [PubMed]
- Li, W.H.; Murányi, D.; Li, S. New species records of Suwallia Ricker, 1943 (Plecoptera: Chloroperlidae) from China, with description of the nymph of S. decolorata Zhiltzova & Levanidova, 1978. Zootaxa 2015, 3994, 556–564. [Google Scholar] [PubMed]
- Li, W.H.; Murányi, D.; Li, S. The first record of genus Suwallia Ricker, 1943 (Plecoptera: Chloroperlidae) from China. Illiesia 2015, 11, 23–28. [Google Scholar]
- Zwick, P. The Plecoptera—Who are they? The problematic placement of stoneflies in the phylogenetic system of insects. Aquat. Insects 2009, 31, 181–194. [Google Scholar] [CrossRef]
- Wheeler, W.C.; Michael, W.; Wheeler, Q.D.; Carpenter, J.M. The phylogeny of the extant hexapod orders. Cladistics 2001, 17, 113–169. [Google Scholar] [CrossRef]
- Henning, W. Insect Phylogeny; John Wiley and Sons Ltd.: Chichester, UK; New York, NY, USA, 1981; pp. 1–536. [Google Scholar]
- Kukalová-Peck, J. Fossil History and the Evolution of Hexapod Structures. In The Insects of Australia. A Textbook for Students and Research Workers, 2nd ed.; Naumann, I.D., Ed.; Melbourne University Press: Melbourne, Australia, 1991; Volume 1, pp. 141–179. [Google Scholar]
- Yoshizawa, K.; Johnson, K.P. Aligned 18S for Zoraptera (Insecta): Phylogenetic position and molecular evolution. Mol. Phylogenet. Evol. 2005, 37, 572–580. [Google Scholar] [CrossRef] [PubMed]
- Terry, M.D.; Whiting, M.F. Mantophasmatodea and phylogeny of the lower neopterous insects. Cladistics 2005, 21, 240–257. [Google Scholar] [CrossRef]
- Pick, C.; Schneuer, M.; Burmester, T. The occurrence of hemocyanin in Hexapoda. Insect Hemocyanins 2009, 276, 1930–1941. [Google Scholar] [CrossRef] [PubMed]
- Stewart, K.W.; Stark, B.P. Nymphs of North American stonefly genera (Plecoptera). Thomas Say Found. 1988, 12, 1–436. [Google Scholar]
- Uchida, S.; Isobe, Y. Styloperlidae, stat. nov. and Microperlinae, subfam. nov. with a revised system of the family group Systellognatha (Plecoptera). Spixana 1989, 12, 145–182. [Google Scholar]
- Chen, Z.T.; Du, Y.Z. The first two mitochondrial genomes from Taeniopterygidae (Insecta: Plecoptera): Structural features and phylogenetic implications. Int. J. Biol. Macromol. 2017, 111, 70–76. [Google Scholar] [CrossRef] [PubMed]
- Chen, Z.T.; Zhao, M.Y.; Xu, C.; Du, Y.Z. Molecular phylogeny of Systellognatha (Plecoptera: Arctoperlaria) inferred from mitochondrial genome sequences. Int. J. Biol. Macromol. 2018, 111, 542–547. [Google Scholar] [CrossRef] [PubMed]
- Wang, Y.; Cao, J.J.; Li, W.H. The complete mitochondrial genome of the styloperlid stonefly species Styloperla spinicercia Wu (Insecta: Plecoptera) with family-level phylogenetic analyses of the Pteronarcyoidea. Zootaxa 2017, 4243, 125–138. [Google Scholar] [CrossRef] [PubMed]
- Terry, M.D.; Whiting, M.F. Phylogeny of Plecopter: Molecular evidence and evolutionary trends. Entomologische Abhandlungen 2003, 61, 130–131. [Google Scholar]
- Chen, Z.T.; Wu, H.Y.; Du, Y.Z. The nearly complete mitochondrial genome of a stonefly species, Styloperla sp. (Plecoptera: Styloperlidae). Mitochondr. DNA Part A 2016, 27, 2728–2729. [Google Scholar]
- Wang, K.; Ding, S.M.; Yang, D. The complete mitochondrial genome of a stonefly species, Kamimuria chungnanshana Wu, 1948 (Plecoptera: Perlidae). Mitochondr. DNA Part A 2016, 27, 3810–3811. [Google Scholar] [CrossRef] [PubMed]
- Illies, J. Phylogeny and zoogeography of the Plecoptera. Annu. Rev. Entomol. 1965, 10, 117–140. [Google Scholar] [CrossRef]
- Zwick, P. Phylogenetic system and zoogeography of the Plecoptera. Annu. Rev. Entomol. 2000, 45, 709–746. [Google Scholar] [CrossRef] [PubMed]
- Chen, Z.T.; Du, Y.Z. Complete mitochondrial genome of Capnia zijinshana (Plecoptera: Capniidae) and phylogenetic analysis among stoneflies. J. Asia-Pac. Entomol. 2017, 20, 305–312. [Google Scholar] [CrossRef]
- Chen, Z.T.; Du, Y.Z. First Mitochondrial Genome from Nemouridae (Plecoptera) Reveals Novel Features of the Elongated Control Region and Phylogenetic Implications. Int. J. Mol. Sci. 2017, 18, 996. [Google Scholar] [CrossRef] [PubMed]
- Wang, Y.; Cao, J.J.; Li, W.H. The mitochondrial genome of Mesocapina daxingana (Plecoptera: Capniidae). Conserv. Genet. Resour. 2017, 9, 639–642. [Google Scholar] [CrossRef]
- Chen, Z.T.; Du, Y.Z. Comparison of the complete mitochondrial genome of the stonefly Sweltsa longistyla (Plecoptera: Chloroperlidae) with mitogenomes of three other stoneflies. Gene 2015, 558, 82–87. [Google Scholar] [CrossRef] [PubMed]
- Wu, H.Y.; Ji, X.Y.; Yu, W.W.; Du, Y.Z. Complete mitochondrial genome of the stonefly Cryptoperla stilifera Sivec (Plecoptera: Peltoperlidae) and the phylogeny of Polyneopteran insects. Gene 2014, 537, 177–183. [Google Scholar] [CrossRef] [PubMed]
- Misof, B.; Liu, S.; Meusemann, K.; Peters, R.S.; Donath, A.; Mayer, C.; Frandsen, P.B.; Ware, J.; Flouri, T.; Beutel, R.G.; et al. Phylogenomics resolves the timing and pattern of insect evolution. Science 2014, 346, 763–767. [Google Scholar] [CrossRef] [PubMed]
- Qian, Y.H.; Wu, H.Y.; Ji, X.Y.; Yu, W.W.; Du, Y.Z. Mitochondrial genome of the stonefly Kamimuria wangi (Plecoptera: Perlidae) and phylogenetic position of Plecoptera based on mitogenomes. PLoS ONE 2014, 9, e86328. [Google Scholar]
- Elbrecht, V.; Leese, F. The mitochondrial genome of the Arizona Snowfly Mesocapnia arizonensis (Plecoptera, Capniidae). Mitochondr. DNA 2015, 27, 1–2. [Google Scholar] [CrossRef] [PubMed]
- Elbrecht, V.; Poettker, L.; John, U.; Leese, F. The complete mitochondrial genome of the stonefly Dinocras cephalotes (Plecoptera, Perlidae). Mitochondr. DNA 2015, 26, 469–470. [Google Scholar] [CrossRef] [PubMed] [Green Version]
- Huang, M.C.; Wang, Y.Y.; Liu, X.Y.; Li, W.H.; Kang, Z.H.; Wang, K.; Li, X.K.; Yang, D. The complete mitochondrial genome and its remarkable secondary structure for a stonefly Acroneuria hainana Wu (Insecta: Plecoptera, Perlidae). Gene 2015, 557, 52–60. [Google Scholar] [CrossRef] [PubMed]
- James, B.S.; Andrew, T.B. Insect mitochondrial genomics 2: The complete mitochondrial genome sequence of a giant stonefly, Pteronarcys princeps, asymmetric directional mutation bias, and conserved plecopteran A + T-region elements. Genome 2006, 49, 815–824. [Google Scholar]
- Sproul, J.S.; Houston, D.D.; Nelson, C.R.; Evans, P.; Crandall, K.A.; Shiozawa, D.K. Climate oscillations, glacial refugia, and dispersal ability: Factors influencing the genetic structure of the least salmonfly, Pteronarcella badia, (Plecoptera), in Western North America. BMC Evol. Biol. 2015, 15, 1–18. [Google Scholar] [CrossRef] [PubMed]
- Wang, K.; Wang, Y.Y.; Yang, D. The complete mitochondrial genome of a stonefly species, Togoperla sp. (Plecoptera: Perlidae). Mitochondr. DNA Part A 2016, 27, 1703–1704. [Google Scholar]
- Zhou, C.G.; Tan, M.H.; Du, S.Y.; Zhang, R.; Machida, R.; Zhou, X. The mitochondrial genome of the winter stonefly Apteroperla tikumana (Plecoptera, Capniidae). Mitochondr. DNA Part A 2016, 27, 3030–3032. [Google Scholar]
- Min, X.J.; Hickey, D.A. DNA asymmetric strand bias affects the amino acid composition of. DNA Res. 2007, 14, 201–206. [Google Scholar] [CrossRef] [PubMed]
- Boore, J.L. The complete sequence of the mitochondrial genome of Nautilus macromphalus (Mollusca: Cephalopoda). BMC Genom. 2006, 7, 182. [Google Scholar] [CrossRef] [PubMed]
- Ojala, D.; Montoya, J.; Attardi, G. tRNA punctuation model of RNA processing in human mitochondria. Nature 1981, 290, 470–474. [Google Scholar] [CrossRef] [PubMed]
- Stewart, J.B.; Beckenbach, A.T. Insect mitochondrial genomics: The complete mitochondrial genome sequence of the meadow spittlebug Philaenus spumarius (Hemiptera: Auchenorrhyncha: Cercopoidae). Genome 2005, 48, 46–54. [Google Scholar] [CrossRef] [PubMed]
- Sharp, P.M.; Li, W.H. An evolutionary perspective on synonymous codon usage in unicellular organisms. J. Mol. Evol. 1986, 24, 28–38. [Google Scholar] [CrossRef] [PubMed]
- Carapelli, A.; Comandi, S.; Convey, P.; Nardi, F.; Frati, F. The complete mitochondrial genome of the Antarctic springtail Cryptopygus antarcticus (Hexapoda: Collembola). BMC Genom. 2008, 9, 315. [Google Scholar] [CrossRef] [PubMed] [Green Version]
- Lavrov, D.V.; Brown, W.M.; Boore, J.L. A novel type of RNA editing occurs in the mitochondrial tRNAs of the centipede Lithobius forficatus. PNAS 2000, 97, 13738–13742. [Google Scholar] [CrossRef] [PubMed]
- Gutell, R.R.; Lee, J.C.; Cannone, J.J. The accuracy of ribosomal RNA comparative structure models. Curr. Opin. Struct. Biol. 2002, 12, 301–310. [Google Scholar] [CrossRef]
- Li, H.; Liu, H.Y.; Cao, L.M.; Cai, W.Z. The complete mitochondrial genome of the damsel bug Alloeorhynchus bakeri (Hemiptera: Nabidae). Int. J. Biol. Sci. 2012, 8, 93–107. [Google Scholar] [CrossRef] [PubMed]
- Cannone, J.J.; Subramanian, S.; Schnare, M.N.; Collett, J.R.; D’Souza, L.M.; Du, Y.; Feng, B.; Lin, N.; Madabusi, L.V.; Müller, K.M.; et al. The comparative RNA web (CRW) site: An online database of comparative sequence and structure information for ribosomal, intron, and other RNAs. BMC Bioinform. 2002, 3, 15. [Google Scholar] [CrossRef] [Green Version]
- Zhang, D.X.; Hewitt, G.M. Insect mitochondrial control region: A review of its structure, evolution and usefulness in evolutionary studies. Biochem. Syst. Ecol. 1997, 25, 99–120. [Google Scholar] [CrossRef]
- Li, H.; Leavengood, J.M., Jr.; Chapman, E.G.; Burkhardt, D.; Song, F.; Jiang, P.; Liu, J.; Zhou, X.G.; Cai, W.Z. Mitochondrial phylogenomics of Hemiptera reveals adaptive innovations driving the diversification of true bugs. Proc. R. Soc. B. 2017, 284, 1862. [Google Scholar] [CrossRef] [PubMed]
- Liu, Y.Q.; Song, F.; Jiang, P.; Wilson, J.J.; Cai, W.Z.; Li, H. Compositional heterogeneity in true bug mitochondrial phylogenomics. Mol. Phylogenet. Evol. 2018, 118, 135–144. [Google Scholar] [CrossRef] [PubMed]
- Hall, T.A. BioEdit: A user-friendly biological sequence alignment editor and analysis program for Windows 95/98/NT. Nucleic Acids Symp. Ser. 1999, 41, 95–98. [Google Scholar]
- Laslett, D.; Canbäck, B. ARWEN: A program to detect tRNA genes in metazoan mitochondrial nucleotide sequences. Bioinformatics 2008, 24, 172–175. [Google Scholar] [CrossRef] [PubMed]
- Tamura, K.; Peterson, D.; Peterson, N.; Stecher, G.; Nei, M.; Kumar, S. MEGA5: Molecular evolutionary genetics analysis using maximum likelihood, evolutionary distance, and maximum parsimony methods. Mol. Biol. Evol. 2011, 28, 2731–2739. [Google Scholar] [CrossRef] [PubMed]
- Perna, N.T.; Kocher, T.D. Patterns of nucleotide composition at four-fold degenerate sites of animal mitochondrial genomes. J. Mol. Evol. 1995, 41, 353–358. [Google Scholar] [CrossRef] [PubMed]
- Markham, N.R.; Zuker, M. DINAMelt web server for nucleic acid melting prediction. Nucleic Acids Res. 2006, 33, W577–W581. [Google Scholar] [CrossRef] [PubMed]
- Abascal, F.; Zardoya, R.; Telford, M.J. TranslatorX: Multiple alignment of nucleotide sequences guided by amino acid translations. Nucleic Acids Res. 2010, 38, 7–13. [Google Scholar] [CrossRef] [PubMed]
- Katoh, K.; Standley, D.M. MAFFT multiple sequence alignment sofware version 7: Improvements in performance and usability. Mol. Biol. Evol. 2013, 30, 772–780. [Google Scholar] [CrossRef] [PubMed]
- Castresana, J. Selection of conserved blocks from multiple alignments for their use in phylogenetic analysis. Mol. Biol. Evol. 2000, 17, 540–552. [Google Scholar] [CrossRef] [PubMed]
- Posada, D. jModelTest: Phylogenetic model averaging. Mol. Biol. Evol. 2008, 25, 1253–1256. [Google Scholar] [CrossRef] [PubMed]
- Ronquist, F.; Teslenko, M.; van der Mark, P.V.D.; Ayres, D.L.; Darling, A.; Höhna, S.; Larget, B.; Liu, L.; Suchard, M.A.; Huelsenbeck, J.P. MrBayes 3.2: Efficient Bayesian phylogenetic inference and model choice across a large model space. Syst. Biol. 2012, 61, 539–542. [Google Scholar] [CrossRef] [PubMed]
- Stamatakis, A. RAxML-VI-HPC: Maximum likelihood-based phylogenetic analyses with thousands of taxa and mixed models. Bioinformatics 2006, 22, 2688–2690. [Google Scholar] [CrossRef] [PubMed]
- Tracer Version 1.5. Available online: http://tree.bio.ed.ac.uk/software/tracer/ (accessed on 16 February 2018).


| Taxonomic Order | Family | Species | Number (bp) | Accession Number |
|---|---|---|---|---|
| Plecoptera | Perlidae | Acroneuria hainana | 15,804 | NC_026104 |
| Togoperla sp. | 15,723 | KM409708 | ||
| Kamimuria wangi | 16,179 | NC_024033 | ||
| Kamimuria chungnanshana | 15,943 | NC_028076 | ||
| Dinocras cephalotes | 15,666 | NC_022843 | ||
| Pteronarcyidae | Pteronarcys princeps | 16,004 | NC_006133 | |
| Pteronarcella badia | 15,585 | NC_029248 | ||
| Capniidae | Apteroperla tikumana | 15,564 | NC_027698 | |
| Capnia zijinshana | 16,310 | KX094942 | ||
| Mesocapnia arizonensis | 14,921 | KP642637 * | ||
| Mesocapnia daxingana | 15,524 | KY568983 * | ||
| Peltoperlidae | Cryptoperla stilifera | 15,633 | KC952026 * | |
| Soliperla sp. | 15,877 | MF716958 | ||
| Styloperlidae | Styloperla sp. | 15,416 | KR088971 * | |
| Styloperla spinicercia | 16,129 | KX845569 | ||
| Chloroperlidae | Sweltsa longistyla | 16,151 | KM216826 | |
| Suwallia teleckojensis | 16,146 | MF198253 | ||
| Taeniopterygidae | Taeniopteryx ugola | 15,353 | MG589786 | |
| Doddsia occidentalis | 16,020 | MG589787 | ||
| Gripopterygidae | Zelandoperla fenestrata | 16,385 | KY522907 | |
| Perlodidae | Perlodes sp. | 16,039 | MF197377 | |
| Isoperla bilineata | 15,048 | MF716959 | ||
| Ephemeroptera | Heptageniidae | Parafronurus youi | 15,481 | EU349015 |
| Isonychiidae | Isonychia ignota | 15,105 | HM143892 |
| Gene | Direction | Location | Size | Anticodon | Anticodon Positions | Start/Stop Codons | Intergenic Nucleotides |
|---|---|---|---|---|---|---|---|
| tRNAIle | Forward | 1–67 | 67 | GAT | 30–32 | ||
| tRNAGln | Reverse | 65–133 | 69 | TTG | 101–103 | −3 | |
| tRNAMet | Forward | 135–203 | 69 | CAT | 165–167 | 1 | |
| ND2 | Forward | 204–1238 | 1035 | ATG/TAA | 0 | ||
| tRNATrp | Forward | 1237–1305 | 69 | TCA | 1267–1269 | −2 | |
| tRNACys | Reverse | 1298–1364 | 67 | GCA | 1331–1333 | −8 | |
| tRNATyr | Reverse | 1367–1433 | 67 | GTA | 1398–1400 | 2 | |
| COI | Forward | 1426–2982 | 1557 | ATT/TAA | −8 | ||
| tRNALeu(UUR) | Forward | 3002–3067 | 66 | TAA | 3031–3033 | 19 | |
| COII | Forward | 3081–3768 | 688 | ATG/T- | 13 | ||
| tRNALys | Forward | 3769–3839 | 71 | CTT | 3799–3801 | 0 | |
| tRNAAsp | Forward | 3839–3907 | 69 | GTC | 3869–3871 | −1 | |
| ATP8 | Forward | 3908–4066 | 159 | ATG/TAA | 0 | ||
| ATP6 | Forward | 4060–4737 | 678 | ATG/TAA | −7 | ||
| COIII | Forward | 4737–5525 | 789 | ATG/TAA | −1 | ||
| tRNAGly | Forward | 5528–5593 | 66 | TCC | 5558–5560 | 2 | |
| ND3 | Forward | 5594–5947 | 354 | ATC/TAG | 0 | ||
| tRNAAla | Forward | 5946–6011 | 66 | TGC | 5975–5977 | −2 | |
| tRNAArg | Forward | 6013–6077 | 65 | TCG | 6042–6044 | 1 | |
| tRNAAsn | Forward | 6082–6147 | 66 | GTT | 6112–6114 | 4 | |
| tRNASer(AGN) | Forward | 6148–6214 | 67 | GCT | 6173–6175 | 0 | |
| tRNAGlu | Forward | 6215–6281 | 67 | TTC | 6246–6248 | 0 | |
| tRNAPhe | Reverse | 6287–6351 | 65 | GAA | 6320–6322 | 5 | |
| ND5 | Reverse | 6352–8086 | 1735 | GTG/T- | 0 | ||
| tRNAHis | Reverse | 8087–8154 | 68 | GTG | 8121–8123 | 0 | |
| ND4 | Reverse | 8159–9499 | 1341 | ATG/TAA | 4 | ||
| ND4L | Reverse | 9493–9789 | 297 | ATG/TAA | −7 | ||
| tRNAThr | Forward | 9792–9859 | 68 | TGT | 9822–9824 | 2 | |
| tRNAPro | Reverse | 9861–9928 | 68 | TGG | 9896–9898 | 1 | |
| ND6 | Forward | 9930–10,454 | 525 | ATC/TAA | 1 | ||
| CytB | Forward | 10,454–11,590 | 1137 | ATG/TAA | −1 | ||
| tRNASer(UCN) | Forward | 11,590–11,659 | 70 | TGA | 11,621–11,623 | −1 | |
| ND1 | Reverse | 11,680–12,630 | 951 | TTG/TAG | 20 | ||
| tRNALeu(CUN) | Reverse | 12,632–12,697 | 66 | TAG | 12,666–12,668 | 1 | |
| lrRNA | Reverse | 12,698–14,026 | 1329 | 0 | |||
| tRNAVal | Reverse | 14,027–14,097 | 71 | TAC | 14,062–14,064 | 0 | |
| srRNA | Reverse | 14,098–14,897 | 800 | 0 | |||
| CR | 14,898–16,146 | 1249 | 0 |
| Feature | Proportion of Nucleotides | No. of Nucleotides | ||||||
|---|---|---|---|---|---|---|---|---|
| %T | %C | %A | %G | %A + T | AT Skew | GC Skew | ||
| Whole genome | 30.2 | 21.7 | 36.5 | 11.6 | 66.7 | 0.09 | −0.303 | 16,146 |
| PCGs | 37.6 | 18.9 | 26.5 | 17.0 | 64.1 | −0.17 | −0.052 | 11,244 |
| First codon position | 40.6 | 20.7 | 21.9 | 16.9 | 62.4 | −0.30 | −0.102 | 3743 |
| Second codon position | 37.5 | 18.1 | 28.5 | 15.9 | 66.0 | −0.14 | −0.063 | 3743 |
| Third codon position | 34.8 | 17.8 | 29.1 | 18.2 | 64.0 | −0.09 | 0.011 | 3743 |
| PCG-J | 32.9 | 24.5 | 28.9 | 13.7 | 61.8 | −0.07 | −0.281 | 6921 |
| First codon position | 36.4 | 23.1 | 24.5 | 16.0 | 60.9 | −0.20 | −0.182 | 2307 |
| Second codon position | 32.0 | 27.2 | 30.4 | 10.3 | 62.4 | −0.03 | −0.450 | 2307 |
| Third codon position | 30.4 | 23.0 | 31.8 | 14.8 | 62.1 | 0.02 | −0.217 | 2307 |
| PCG-N | 45.1 | 9.9 | 22.7 | 22.2 | 67.8 | −0.33 | 0.383 | 4323 |
| First codon position | 41.9 | 9.5 | 25.0 | 23.6 | 66.9 | −0.25 | 0.427 | 1441 |
| Second codon position | 47.1 | 16.9 | 17.8 | 18.3 | 64.9 | −0.45 | 0.040 | 1441 |
| Third codon position | 46.4 | 3.4 | 25.4 | 24.8 | 71.8 | −0.29 | 0.759 | 1441 |
| tRNA genes | 34.6 | 13.9 | 34.6 | 16.9 | 69.2 | 0.00 | 0.100 | 1487 |
| tRNA-J | 33.8 | 15.1 | 36.2 | 14.9 | 70.0 | 0.03 | −0.007 | 946 |
| tRNA-N | 36.0 | 11.6 | 31.8 | 20.5 | 67.8 | −0.06 | 0.276 | 541 |
| rRNA genes | 39.9 | 9.4 | 31.6 | 19.1 | 71.5 | −0.12 | 0.338 | 2129 |
| lrRNA | 40.3 | 8.3 | 32.9 | 18.5 | 73.2 | −0.10 | 0.382 | 1329 |
| srRNA | 39.1 | 11.4 | 29.5 | 20.0 | 68.6 | −0.14 | 0.275 | 800 |
| CR | 35.5 | 13.3 | 43.6 | 7.6 | 79.1 | 0.10 | −0.272 | 1249 |
| Amino Acid | Codon | N | RSCU | N+ | RSCU | N− | RSCU |
|---|---|---|---|---|---|---|---|
| Phe (F) | UUU | 208 | 1.36 | 85 | 0.98 | 123 | 1.86 |
| UUC | 98 | 0.64 | 89 | 1.02 | 9 | 0.14 | |
| Leu (L) | UUA | 280 | 2.6 | 131 | 2.13 | 149 | 3.23 |
| UUG | 108 | 1 | 12 | 0.2 | 96 | 2.08 | |
| CUU | 67 | 0.62 | 53 | 0.86 | 14 | 0.3 | |
| CUC | 67 | 0.62 | 66 | 1.07 | 1 | 0.02 | |
| CUA | 112 | 1.04 | 97 | 1.58 | 15 | 0.32 | |
| CUG | 12 | 0.11 | 10 | 0.16 | 2 | 0.04 | |
| Ile (I) | AUU | 213 | 1.46 | 133 | 1.29 | 80 | 1.86 |
| AUC | 79 | 0.54 | 73 | 0.71 | 6 | 0.14 | |
| Met (M) | AUA | 141 | 1.45 | 100 | 1.72 | 41 | 1.04 |
| AUG | 54 | 0.55 | 16 | 0.28 | 38 | 0.96 | |
| Val (V) | GUU | 82 | 1.38 | 29 | 0.88 | 53 | 2.02 |
| GUC | 44 | 0.74 | 37 | 1.12 | 7 | 0.27 | |
| GUA | 70 | 1.18 | 55 | 1.67 | 15 | 0.57 | |
| GUG | 41 | 0.69 | 11 | 0.33 | 30 | 1.14 | |
| Ser (S) | UCU | 94 | 2.32 | 39 | 1.72 | 55 | 3.08 |
| UCC | 30 | 0.74 | 29 | 1.28 | 1 | 0.06 | |
| UCA | 63 | 1.56 | 48 | 2.12 | 15 | 0.84 | |
| UCG | 15 | 0.37 | 7 | 0.31 | 8 | 0.45 | |
| Pro (P) | CCU | 59 | 1.55 | 34 | 1.21 | 25 | 2.5 |
| CCC | 48 | 1.26 | 45 | 1.61 | 3 | 0.3 | |
| CCA | 36 | 0.95 | 29 | 1.04 | 7 | 0.7 | |
| CCG | 9 | 0.24 | 4 | 0.14 | 5 | 0.5 | |
| Thr (T) | ACU | 66 | 1.25 | 43 | 1.07 | 23 | 1.8 |
| ACC | 59 | 1.11 | 58 | 1.44 | 1 | 0.08 | |
| ACA | 73 | 1.38 | 56 | 1.39 | 17 | 1.33 | |
| ACG | 14 | 0.26 | 4 | 0.1 | 10 | 0.78 | |
| Ala (A) | GCU | 84 | 1.51 | 48 | 1.29 | 36 | 1.97 |
| GCC | 76 | 1.37 | 72 | 1.93 | 4 | 0.22 | |
| GCA | 37 | 0.67 | 27 | 0.72 | 10 | 0.55 | |
| GCG | 25 | 0.45 | 2 | 0.05 | 23 | 1.26 | |
| Tyr (Y) | UAU | 106 | 1.39 | 32 | 0.84 | 74 | 1.95 |
| UAC | 46 | 0.61 | 44 | 1.16 | 2 | 0.05 | |
| Stop (*) | UAA | 9 | 1.64 | 7 | 1.75 | 2 | 1.33 |
| UAG | 2 | 0.36 | 1 | 0.25 | 1 | 0.67 | |
| His (H) | CAU | 46 | 1.12 | 30 | 0.91 | 16 | 2 |
| CAC | 36 | 0.88 | 36 | 1.09 | 0 | 0 | |
| Gln (Q) | CAA | 70 | 1.71 | 57 | 1.97 | 13 | 1.08 |
| CAG | 12 | 0.29 | 1 | 0.03 | 11 | 0.92 | |
| Asn (N) | AAU | 110 | 1.44 | 63 | 1.19 | 47 | 2 |
| AAC | 43 | 0.56 | 43 | 0.81 | 0 | 0 | |
| Lys (K) | AAA | 35 | 1.03 | 29 | 1.66 | 6 | 0.36 |
| AAG | 33 | 0.97 | 6 | 0.34 | 27 | 1.64 | |
| Asp (D) | GAU | 51 | 1.4 | 31 | 1.19 | 20 | 1.9 |
| GAC | 22 | 0.6 | 21 | 0.81 | 1 | 0.1 | |
| Glu (E) | GAA | 55 | 1.34 | 43 | 1.87 | 12 | 0.67 |
| GAG | 27 | 0.66 | 3 | 0.13 | 24 | 1.33 | |
| Cys (C) | UGU | 38 | 1.69 | 7 | 1 | 31 | 2 |
| UGC | 7 | 0.31 | 7 | 1 | 0 | 0 | |
| Trp (W) | UGA | 82 | 1.56 | 63 | 1.85 | 19 | 1.03 |
| UGG | 23 | 0.44 | 5 | 0.15 | 18 | 0.97 | |
| Arg (R) | CGU | 13 | 0.81 | 4 | 0.41 | 9 | 1.44 |
| CGC | 2 | 0.13 | 2 | 0.21 | 0 | 0 | |
| CGA | 33 | 2.06 | 29 | 2.97 | 4 | 0.64 | |
| CGG | 16 | 1 | 4 | 0.41 | 12 | 1.92 | |
| Ser (S) | AGU | 49 | 1.21 | 22 | 0.97 | 27 | 1.51 |
| AGC | 18 | 0.44 | 12 | 0.53 | 6 | 0.34 | |
| AGA | 52 | 1.28 | 24 | 1.06 | 28 | 1.57 | |
| AGG | 3 | 0.07 | 0 | 0 | 3 | 0.17 | |
| Gly (G) | GGU | 56 | 0.91 | 21 | 0.6 | 35 | 1.32 |
| GGC | 22 | 0.36 | 14 | 0.4 | 8 | 0.3 | |
| GGA | 92 | 1.5 | 79 | 2.27 | 13 | 0.49 | |
| GGG | 75 | 1.22 | 25 | 0.72 | 50 | 1.89 |
| Gene | Best Model |
|---|---|
| ATP6 | GTR + I + G |
| ATP8 | GTR + G |
| COI | GTR + G |
| COII | GTR + G |
| COIII | GTR + I + G |
| CytB | GTR + G |
| ND1 | GTR + I + G |
| ND2 | GTR + I + G |
| ND3 | GTR + I + G |
| ND4 | GTR + I + G |
| ND4L | GTR + I + G |
| ND5 | GTR + I + G |
| ND6 | GTR + I + G |
| srRNA | GTR + I + G |
| lrRNA | GTR + G |
© 2018 by the authors. Licensee MDPI, Basel, Switzerland. This article is an open access article distributed under the terms and conditions of the Creative Commons Attribution (CC BY) license (http://creativecommons.org/licenses/by/4.0/).
Share and Cite
Wang, Y.; Cao, J.-J.; Li, W.-H. Complete Mitochondrial Genome of Suwallia teleckojensis (Plecoptera: Chloroperlidae) and Implications for the Higher Phylogeny of Stoneflies. Int. J. Mol. Sci. 2018, 19, 680. https://doi.org/10.3390/ijms19030680
Wang Y, Cao J-J, Li W-H. Complete Mitochondrial Genome of Suwallia teleckojensis (Plecoptera: Chloroperlidae) and Implications for the Higher Phylogeny of Stoneflies. International Journal of Molecular Sciences. 2018; 19(3):680. https://doi.org/10.3390/ijms19030680
Chicago/Turabian StyleWang, Ying, Jin-Jun Cao, and Wei-Hai Li. 2018. "Complete Mitochondrial Genome of Suwallia teleckojensis (Plecoptera: Chloroperlidae) and Implications for the Higher Phylogeny of Stoneflies" International Journal of Molecular Sciences 19, no. 3: 680. https://doi.org/10.3390/ijms19030680