Article

The Regulatory Role of MeAIB in Protein Metabolism and the mTOR Signaling Pathway in Porcine Enterocytes

1
Laboratory of Animal Nutritional Physiology and Metabolic Process, Key Laboratory of Agro-ecological Processes in Subtropical Region, National Engineering Laboratory for Pollution Control and Waste Utilization in Livestock and Poultry Production, Institute of Subtropical Agriculture, Chinese Academy of Sciences, Changsha 410125, China
2
Hunan Co-Innovation Center of Animal Production Safety (CICAPS), Changsha 410128, China
3
Department of Nutrition, University of California, Davis, CA 95616, USA
*
Authors to whom correspondence should be addressed.
Int. J. Mol. Sci. 2018, 19(3), 714; https://doi.org/10.3390/ijms19030714
Submission received: 3 January 2018 / Revised: 20 February 2018 / Accepted: 28 February 2018 / Published: 2 March 2018
(This article belongs to the Special Issue Amino Acids Transport and Metabolism)

Abstract

:
Amino acid transporters play an important role in cell growth and metabolism. MeAIB, a transporter-selective substrate, often represses the adaptive regulation of sodium-coupled neutral amino acid transporter 2 (SNAT2), which may act as a receptor and regulate cellular amino acid contents, therefore modulating cellular downstream signaling. The aim of this study was to investigate the effects of MeAIB to SNAT2 on cell proliferation, protein turnover, and the mammalian target of rapamycin (mTOR) signaling pathway in porcine enterocytes. Intestinal porcine epithelial cells (IPEC)-J2 cells were cultured in a high-glucose Dulbecco’s modified Eagle’s (DMEM-H) medium with 0 or 5 mmoL/L System A amino acid analogue (MeAIB) for 48 h. Cells were collected for analysis of proliferation, cell cycle, protein synthesis and degradation, intracellular free amino acids, and the expression of key genes involved in the mTOR signaling pathway. The results showed that SNAT2 inhibition by MeAIB depleted intracellular concentrations of not only SNAT2 amino acid substrates but also of indispensable amino acids (methionine and leucine), and suppressed cell proliferation and impaired protein synthesis. MeAIB inhibited mTOR phosphorylation, which might be involved in three translation regulators, EIF4EBP1, IGFBP3, and DDIT4 from PCR array analysis of the 84 genes related to the mTOR signaling pathway. These results suggest that SNAT2 inhibition treated with MeAIB plays an important role in regulating protein synthesis and mTOR signaling, and provide some information to further clarify its roles in the absorption of amino acids and signal transduction in the porcine small intestine.

Graphical Abstract

1. Introduction

Amino acid transporters are membrane transport proteins; their major role is transporting amino acids and modulating gene expression and the signal transduction pathway by sensing amino acid levels [1]. The SLC38 family of transporters represents a main branch of solute carrier families in mammals, and the transporters can be subdivided into two groups, namely system A and system N [2,3]. Sodium-coupled neutral amino acid transporter 2 (SNAT2) has a very broad tissue distribution profile and is characterized as a system A transporter, which plays various roles in different tissues and has dual transport/receptor functions [4,5]. α-Methylaminoisobutyric acid (MeAIB), a system A substrate, suppresses the expression of SNAT2 in cells and has been used as a means of inhibiting the uptake of natural system A substrates [2].
SNAT2 is well documented in human cancer cells and skeletal muscle myoblast cells. Currently it has been demonstrated to sense intracellular anabolic amino acid levels and then regulate the amino acid signaling pathways influencing protein turnover and cell growth [4,5,6,7,8]. Several studies showed that SNAT2 has a low level of expression in complete media, but its activity could be enhanced by withdrawing amino acids, which provide evidence of SNAT2’s ability to regulate amino acid homeostasis as a transporter [9,10]. Potential regulatory mechanisms of SNAT2 in amino acid nutrition has demonstrated it is involved in eukaryotic initiation factor 2 phosphorylation, increased gene transcription, and internal ribosome entry site-mediated translation [9,10]. The intestinal porcine epithelium comprises a large surface area lined by a single layer of columnar intestinal epithelial cells with the expression of a variety of transporters in apical and basolateral membranes; these transporter proteins play complex and interactive roles in controlling the absorption and metabolism of amino acids [11,12]. We have previously cloned and described the SNAT2 gene in the small intestine of piglets, which is highly evolutionarily conserved in humans [4]. This study was conducted to investigate the role of the SNAT2 transporter after the addition of MeAIB in cell growth, protein turnover, and its related mTOR signaling in the intestinal porcine epithelial IPEC-J2 cells.

2. Results

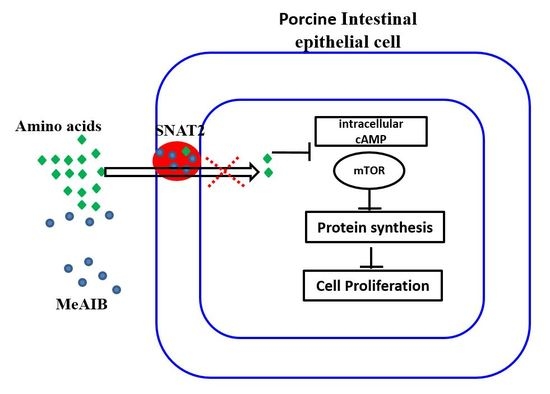
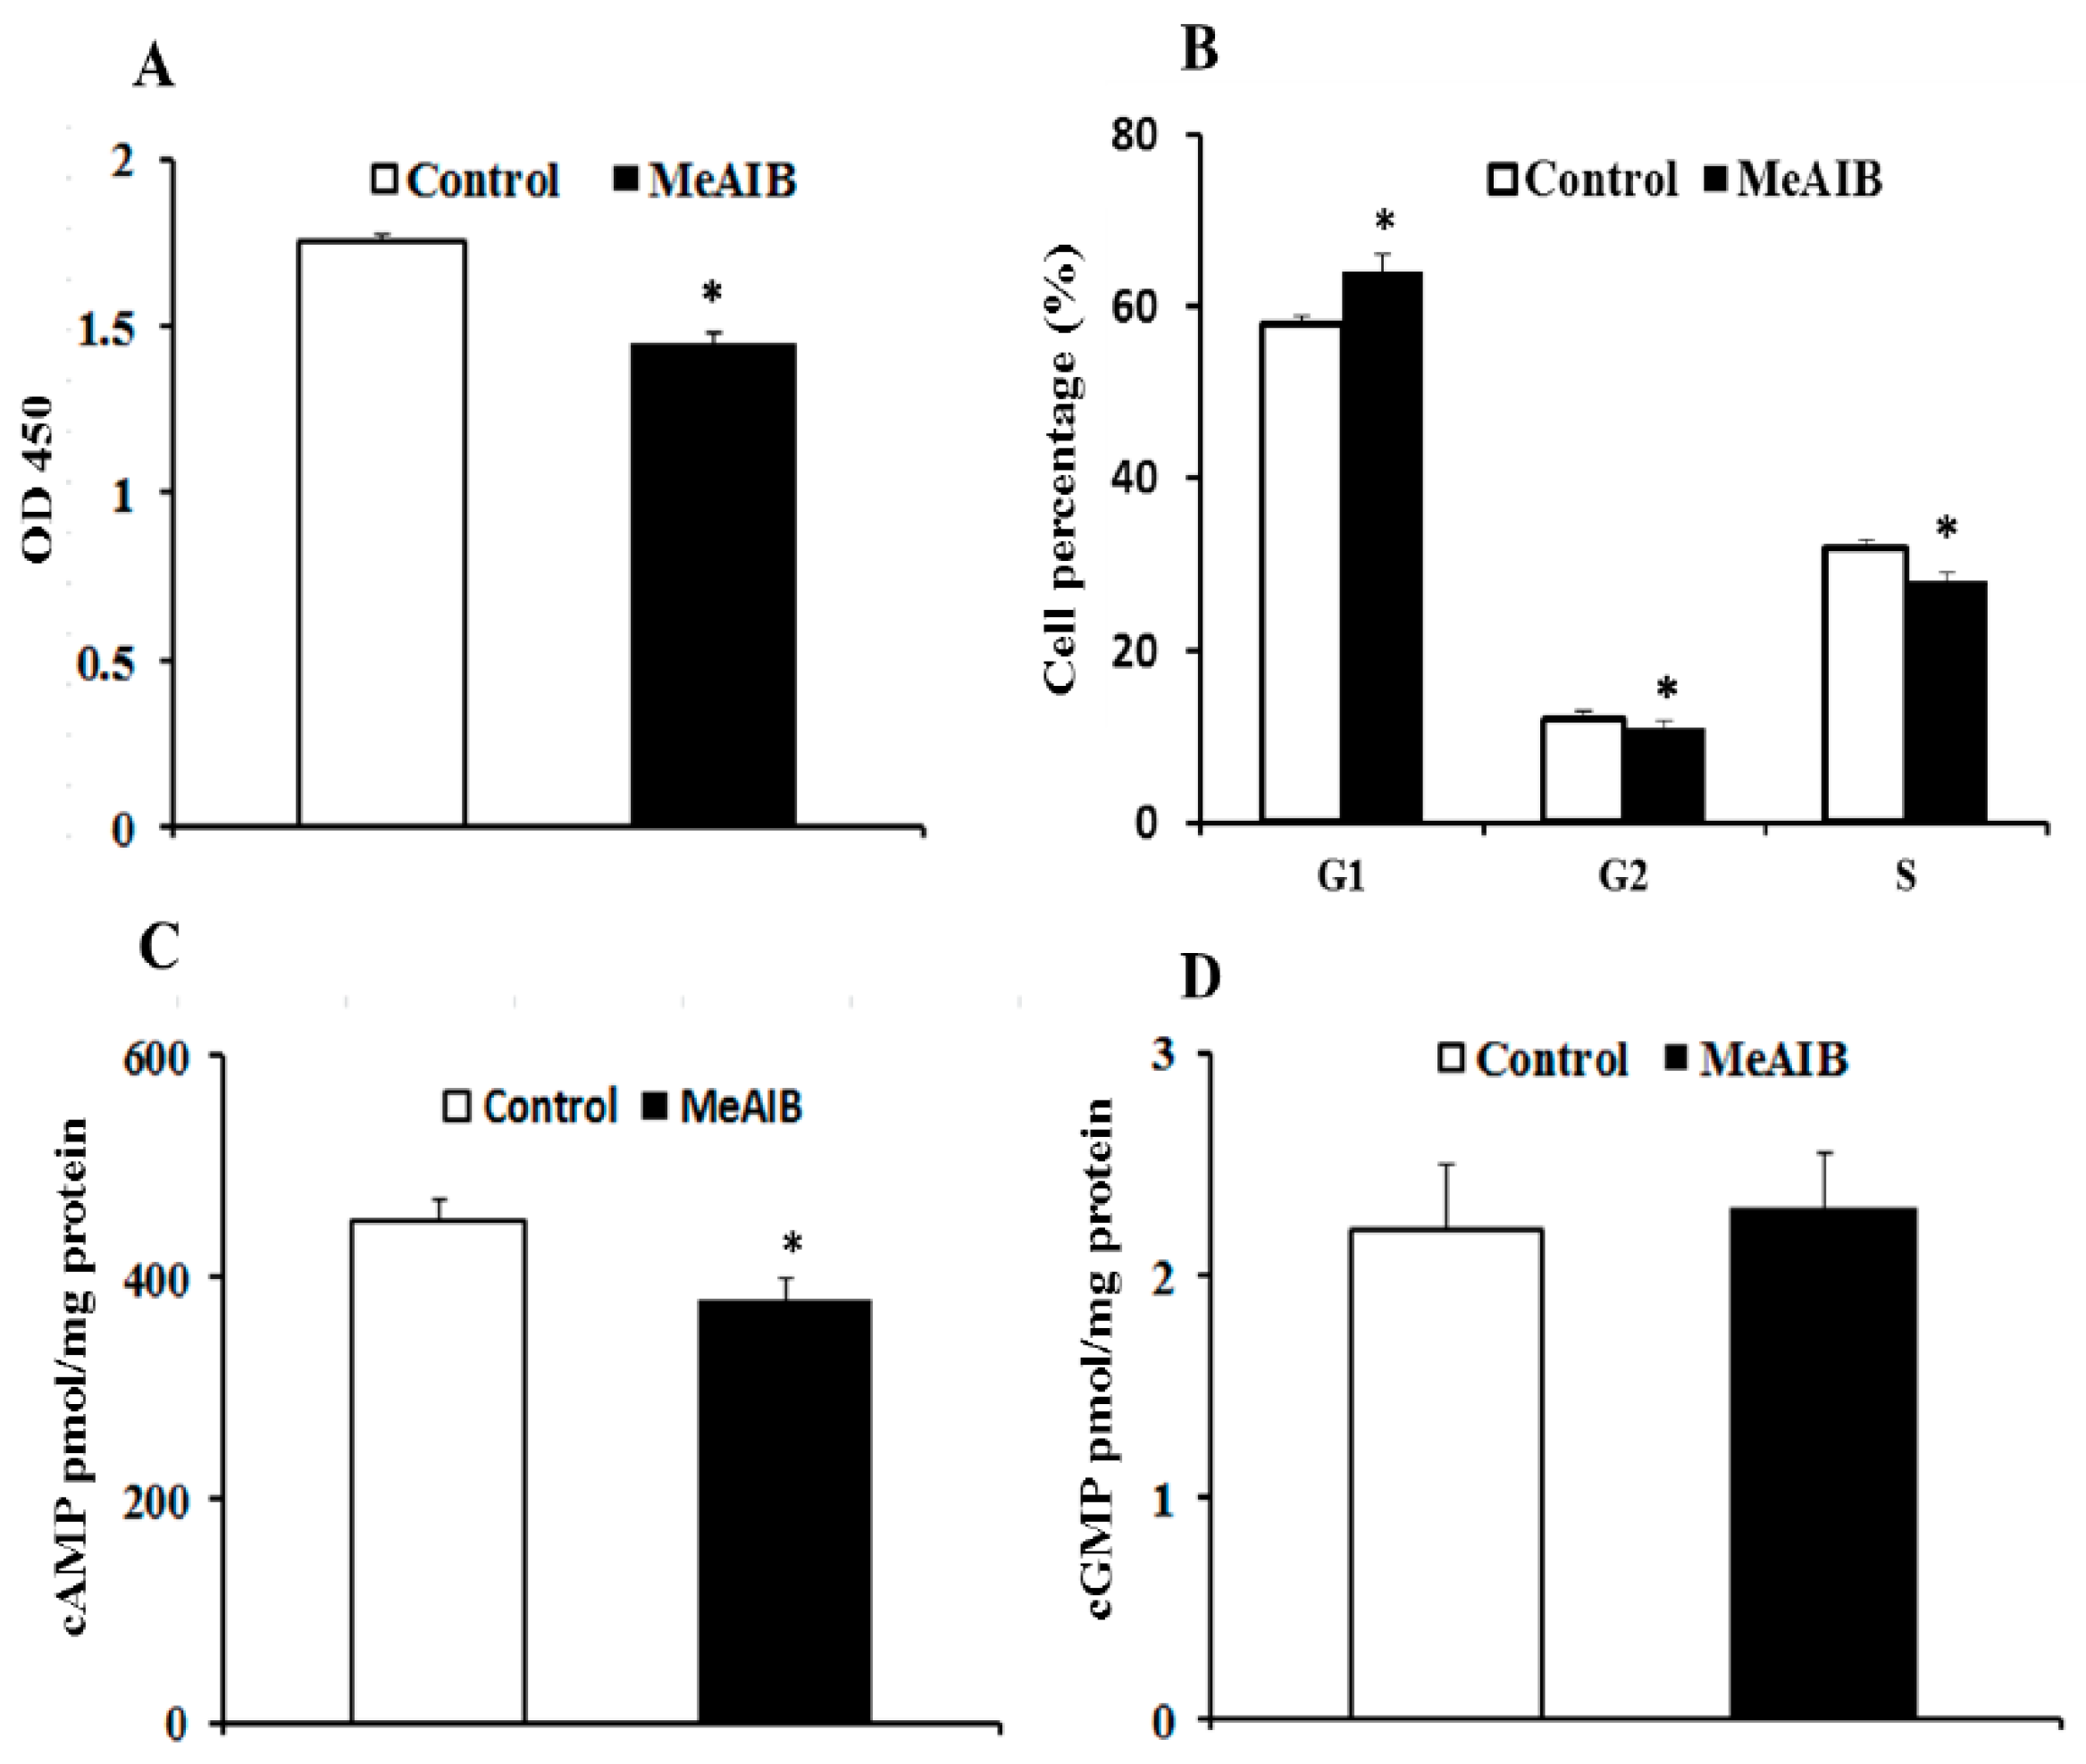
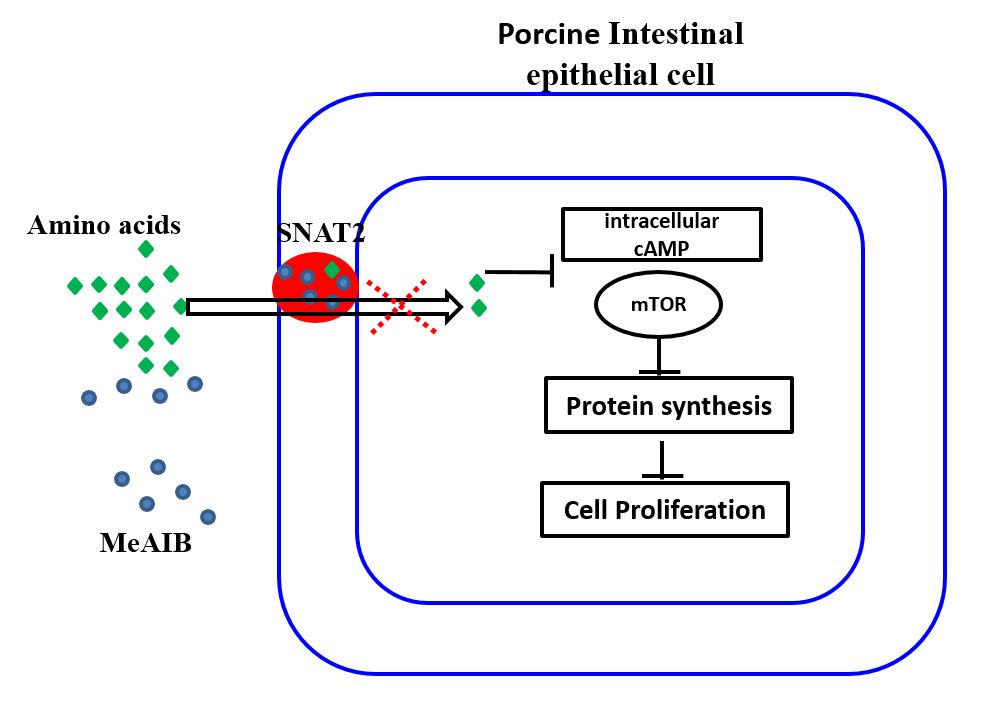
2.1. SNAT2 Inhibition Decreased Cell Growth and Intracellular cAMP Concentration in IPEC-J2 Cells

Immunoblotting of IPEC-J2 treated with MeAIB caused a significant decrease in SNAT2 expression (p < 0.05). mTOR phosphorylation was more strongly inhibited compared with the control group (p < 0.05) (Figure 1). There was no change in total mTOR abundance.
MeAIB significantly reduced IPEC-J2 cell growth, reaching statistical significance at two days post-MeAIB addition (p < 0.05) (Figure 2A). IPEC-J2 cells were subjected to cell cycle analysis using flow cytometry after treating with MeAIB for 48 h, and Figure 2B showed that the number of cells in the G1 phases increased and the proportion of cells in the G2 and S phases substantially decreased (p < 0.05).
The intracellular cGMP level of IPEC-J2 treated with MeAIB did not show a significant effect (p > 0.05); by contrast, the cells displayed a significantly lower concentration of cAMP when cultured in the presence of MeAIB, compared with the control group (Figure 2C,D).

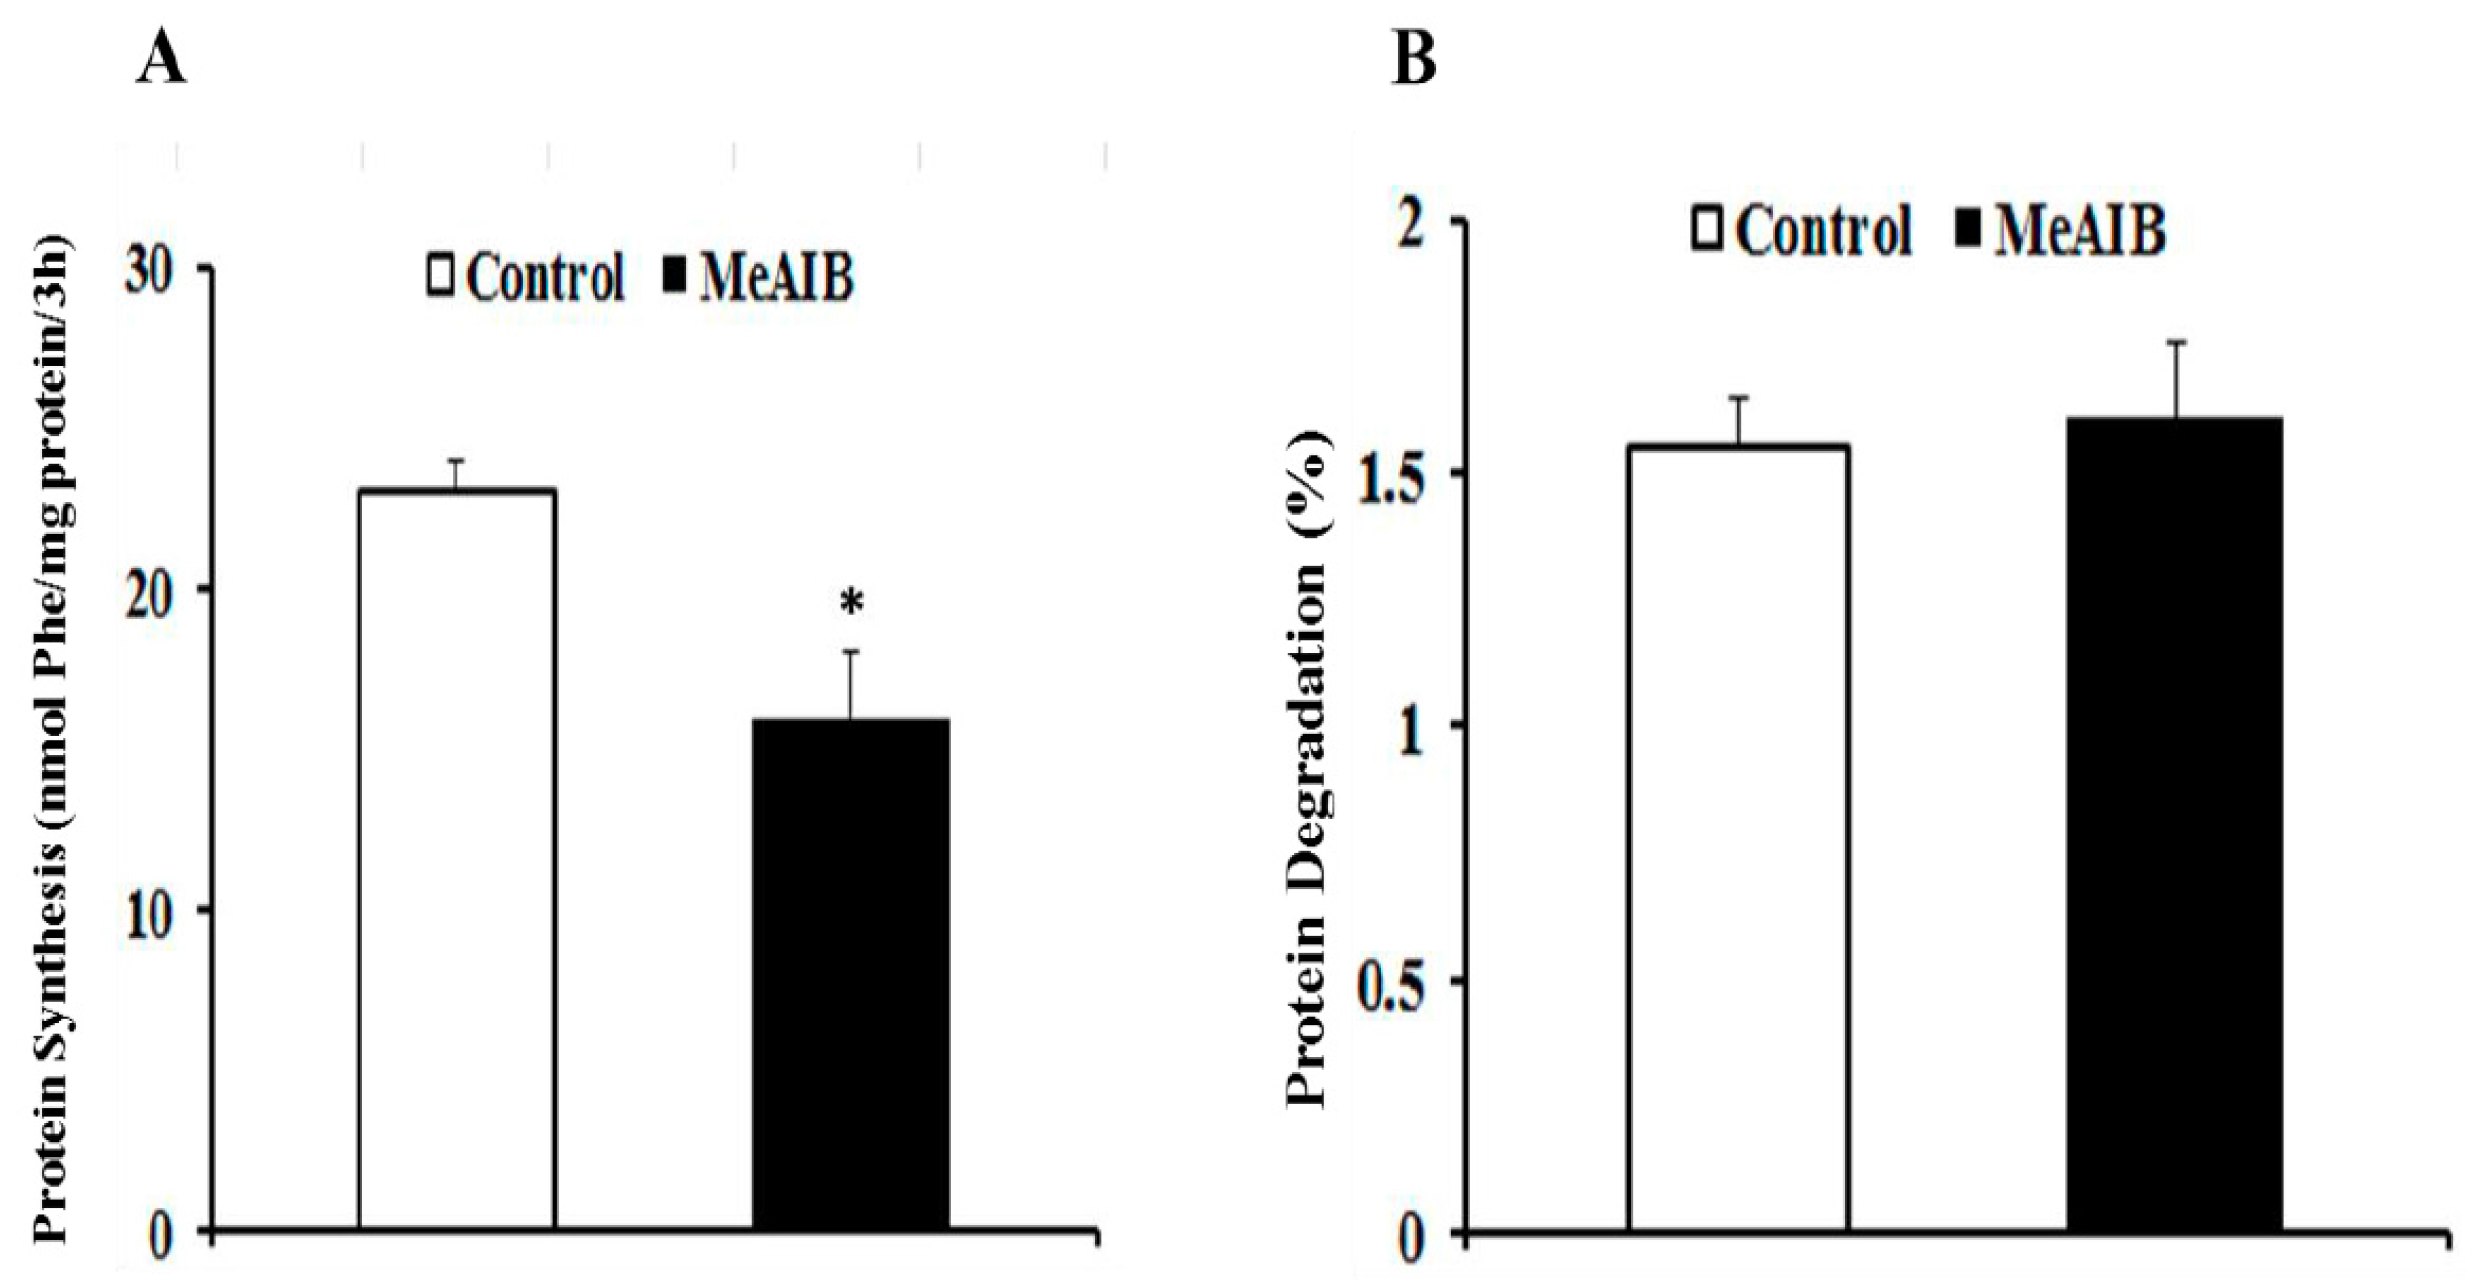
2.2. MeAIB Affects Protein Synthesis, but Not Degradation in IPEC-J2 Cells

Addition of MeAIB to the culture medium resulted in a decrease of (3H)-phenylalanine incorporation in proteins, which reduced the isotope uptake by approximately 30% (Figure 3A) (p < 0.05) compared with the control group, while there was no significant effect on protein degradation (p > 0.05) (Figure 3B).

2.3. Involvement of MeAIB in Decreasing Amino Acid Transport

The inhibition of total expression of the SNAT2 protein (approximately 50%) by MeAIB led to a significant reduction of some intracellular amino acids, including l-Glu 5.7-fold, l-Pro 2.67-Fold, l-Met 2.65-fold, l-Ser 2.31-fold, l-His 2.45-fold, l-Gly 2.30-fold, l-Asp 1.88-fold and l-Leu 1.22-fold (p < 0.05). There were no effects on other amino acids (Table 1).

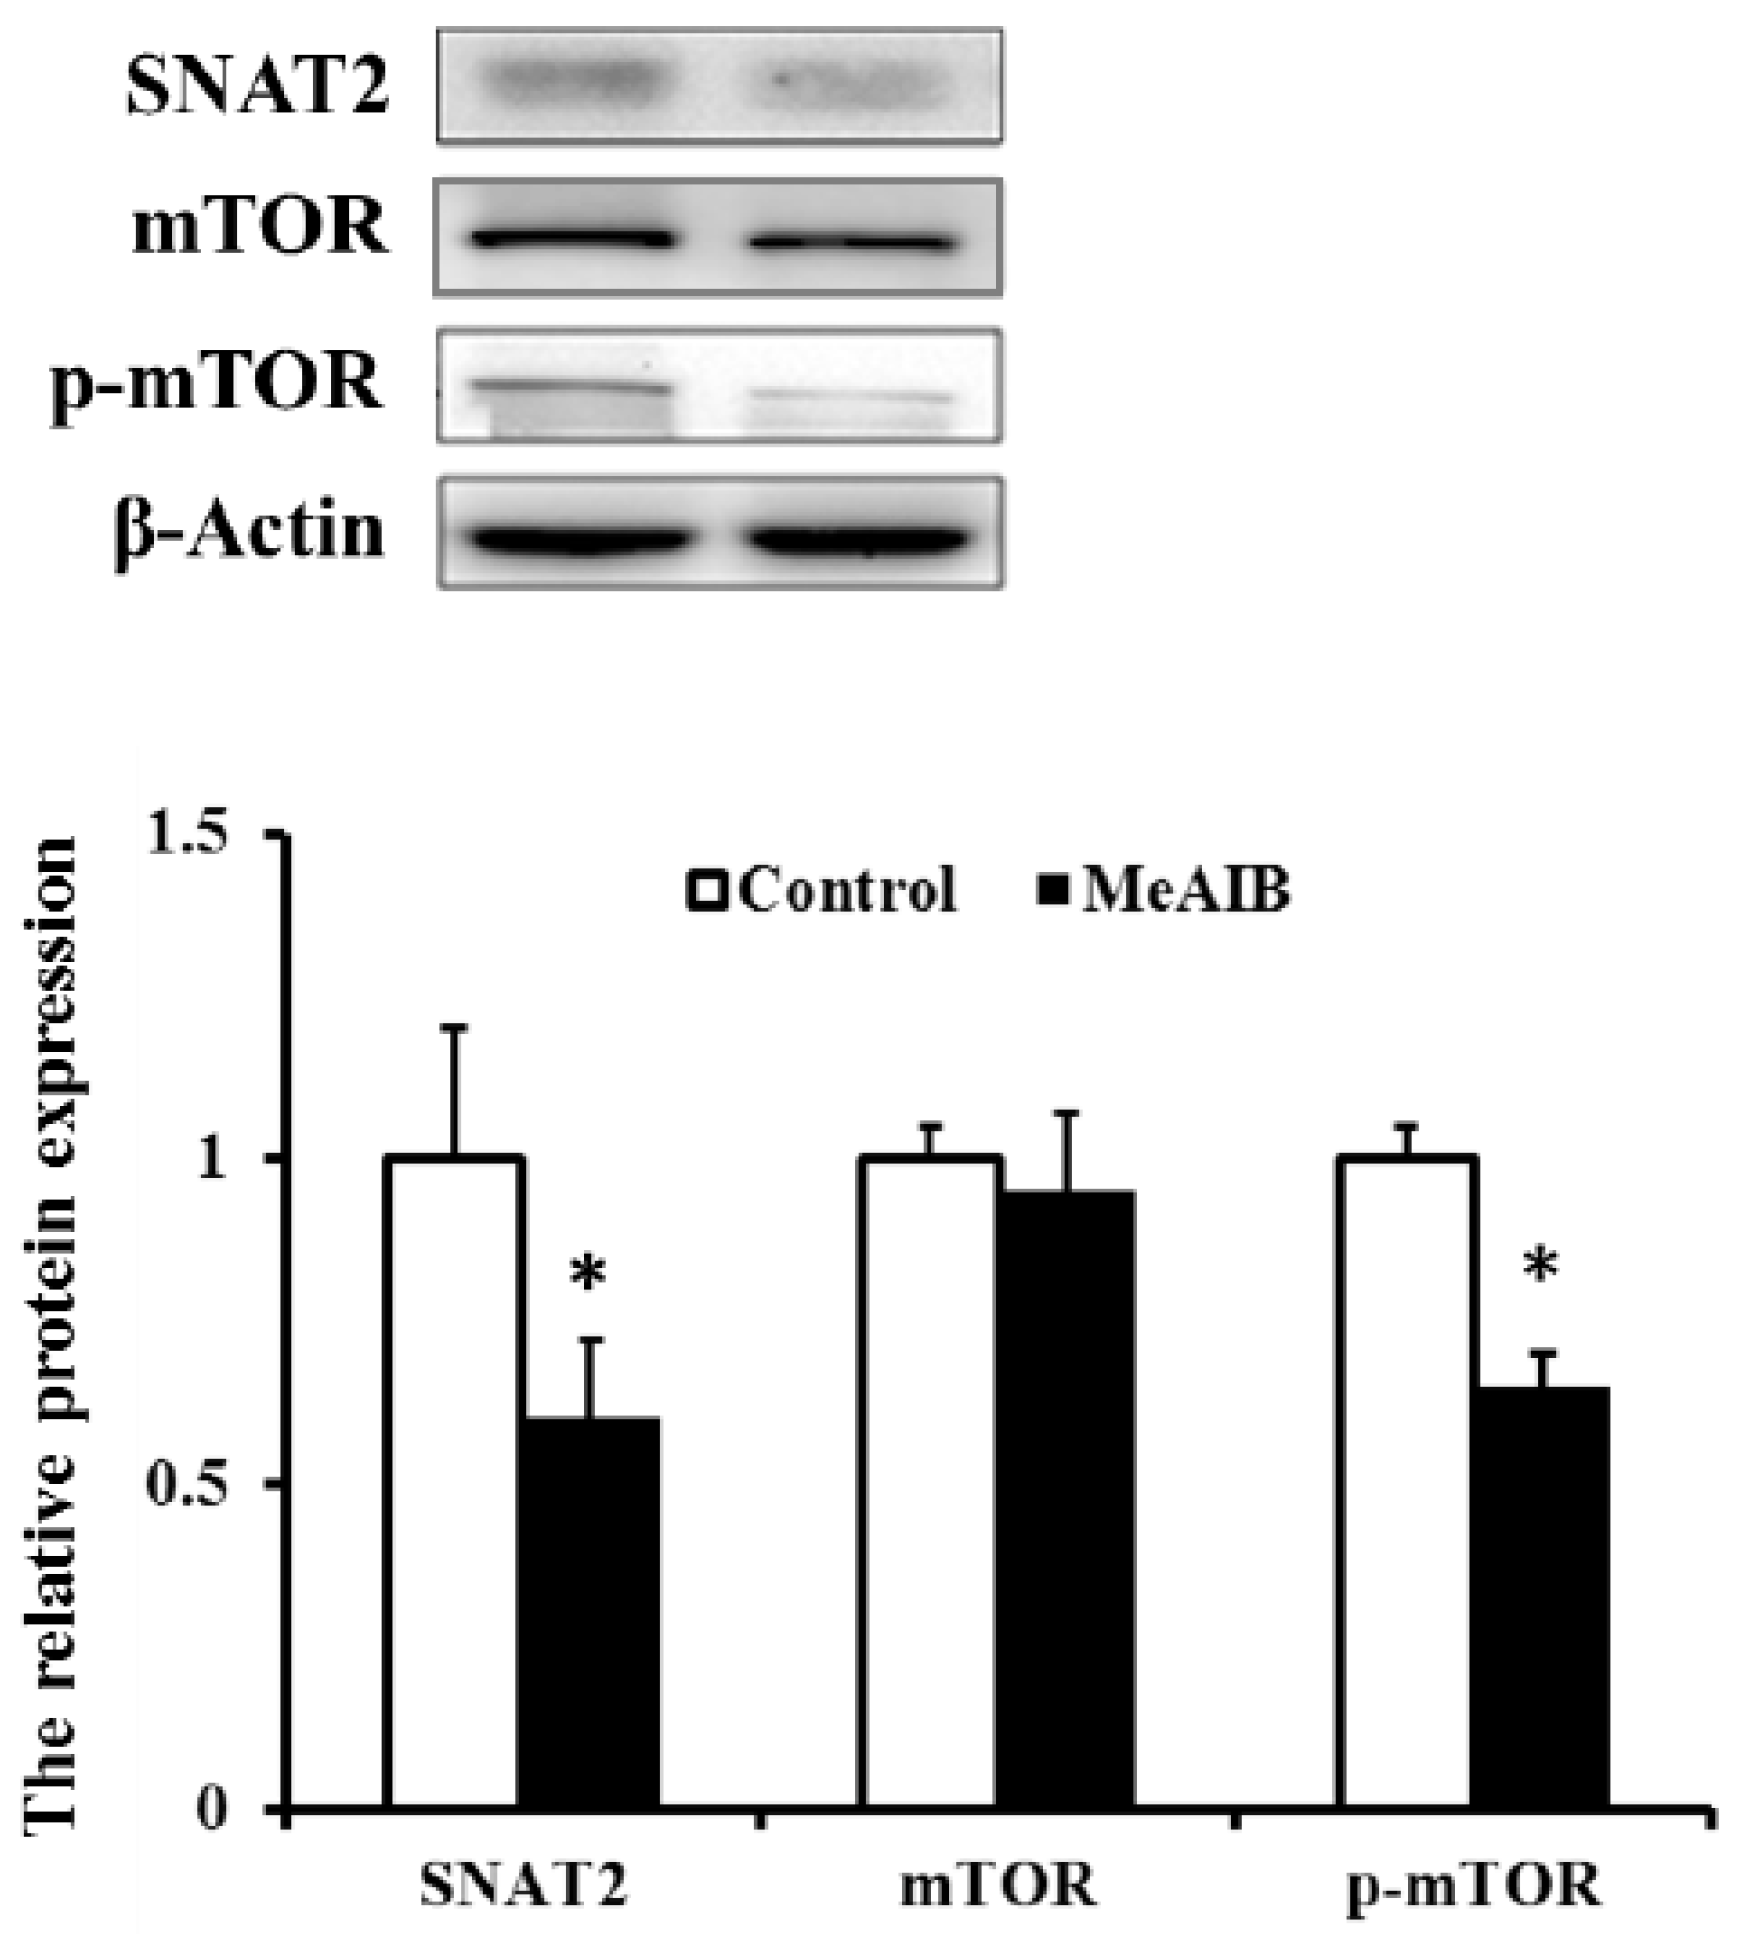
2.4. Evaluation of Transcriptional Expression of Genes Related to mTOR Signaling Pathway in IPEC-J2 Cells

Among the 84 simultaneously detected genes related to the mTOR signaling pathway, 21 exhibited significant changes in expression (Table 2). The level of expression of 11 genes, including AKT1, RPS6KA4, DDIT4, EIF4EBP1, IGFBP3, INS, PIK3CG, PRKCB, RPS6KA1, RPTOR, and ULK1, was upregulated, with most of them belonging to the mTOR upstream regulator and having the role of both positive and negative regulation. In contrast, 10 genes, CAB39, DDIT4L, IRS1, KRAS, PIK3R2, RPS6KA5, VEGFB, RRAGA, VEGFC, and YWHAQ, were significantly downregulated in IPEC-J2. Four of them are not translation regulators for mTOR, and for the other six regulated genes (CAB39, IRS1, VEGFB, RRAGA, VEGFC, and YWHAQ), three of them (IRS1, RRAGA, and YWHAQ) existed mTOR upstream and three were located on the mTOR downstream.

3. Discussion

Amino acids not only serve as precursors for the synthesis of many biologically important proteins, but have also been known to have powerful regulatory effects on cellular function [13,14], while amino acid transporters are primarily responsible for the translocation of amino acids by sensing the concentration of both extracellular and intracellular fluid. MeAIB has been used to elucidate the function of SNAT2 in human cells and significantly inhibits SNAT2 expression in IPEC-J2 cells that had 92% homology with human cells [4]. In the present study, we found that the addition of a 5 mM dose of MeAIB could better inhibit the SNAT2 that has more than 50% inhibition efficiency, while it has minimized the non-specificity that SNAT analogs and PAT1 show less than 20% inhibition efficiency compared with control group in this porcine cell line. The results suggest that suppression of SNAT2 in IPEC-J2 cells reduced cell proliferation, which was also supported by G1 arrest and the decrease in protein synthesis. Furthermore, we demonstrated that the cyclic AMP [15], an intracellular secondary messenger molecule involved in many signal transduction cascades, experienced a significant decrease in IPEC-J2 treated with MeAIB. In order to further explore the underlying reason, competitive inhibition of SNAT2 by MeAIB treatment led to a substantial reduction in the intracellular concentrations of neutral amino acids including key intermediary metabolites (glutamine, serine, and proline) as well as the indispensable amino acids methionine and leucine, which is consistent with previous reports that SNAT2—and not just SNAT2 substrates—also exerts an indirect effect in humans [2]. For l-alanine, the preferred naturally occurring substrate for SNAT2, there are no significant differences compared with MeAIB group. The reason is probably due to the lack of l-Ala in the culture medium. On the whole, the control group showing slightly higher levels might be due to the effect of 10% serum. We concluded that SNAT2 inhibition by the addition of MeAIB strongly impaired intracellular amino acid profiles and led to the inhibition of protein synthesis and cell growth.
The role of amino acid transporters in the regulation of the signaling pathway is now a well-established model in mammalian cells. The data in Figure 1 suggest that the level of SNAT2 inhibition had significant effects on mTOR phosphorylation. Such situations are likely attributable to the reduction of intracellular amino acids that could regulate the mTOR pathway by protein complexes composed of Rags, Ragulator, v-ATPase, GATOR, and folliculin [16,17,18]. Analysis of the genes related to the mTOR signaling pathway by an RT2 Profiler PCR Array system indicated that all 84 genes, including 21 differential genes, experienced just a slight change, 2.9-fold maximum, in the mRNA level. These results could suggest that total mRNA expression level may not play an important role in mTOR regulation in amino acid transporters because mTOR coordinated eukaryotic cell growth and metabolism with environmental inputs, including amino acid and growth factors, as primarily reflected by the state of phosphorylation, such as RAG GTPases for amino acids [19] and Tuberous Sclerosis Complex 1/2(TSC1/2) for growth factors [20]. When we further researched some of the differential genes with transcription factor function, we found that three mTOR-related genes with a negative effect, including EIF4EBP1 [21], a translation repression protein, IGFBP3 [22], which binds insulin-like growth factors with high affinity, and DDIT4 [23], which is activated by certain stresses, have been upregulated, consistent with the inhibition of mTOR phosphorylation and cell growth.
Although MeAIB was often used for a system A substrate to suppress the expression of SNAT2 in cells and study its function, there are some limitations on specificity, such as that MeAIB has been reported to inhibit other SNAT analogs and PAT1 [24,25]. The real-time PCR analysis of other transporters has provided a suitable concentration to research SNAT2, but it cannot totally clarify the SNAT2 function. Currently, we are trying to establish the SNAT2 knockout cell line and hope it will help us to further elucidate SNAT2 function.

4. Materials and Methods

4.1. Antibodies and Reagents

Methylaminoisobutyrate (MeAIB) was purchased from Sigma. (3H)-Phenylalanine was provided by American Radiolabeled Chemical, Inc. (St. Louis, MO, USA); Rabbit anti-SNAT2, β-actin, p-mTOR, and mTOR were obtained from Cell Signaling Technology (Danvers, MA, USA).

4.2. Cell Culture and Treatment

IPEC-J2 were grown in a high-glucose Dulbecco’s modified Eagle medium (DMEM) (Hyclone, South Logan, UT, USA) containing 10% fetal bovine serum (Gibico, Gaithersburg, MD, USA) and 1% antibiotic solution (P/S) Sigma-Aldrich(St Louis, MO, USA) at 37 °C in a 5% CO2 incubator. After an overnight incubation, cells were incubated in a medium containing 0 or 5 mmoL/L System A amino acid analogue (MeAIB) for 48 h.

4.3. Cell Proliferation and Cycle Assays

Proliferation of IPEC-J2 was evaluated using a CCK-8 assay (Dojindo Laboratories, Kumamoto, Japan), based on the cleavage of the tetrazolium salt WST-8 by chondrial dehydrogenase in viable cells. After culture in 0 or 5 mmoL/L MeAIB medium for 2 h, 10 μL CCK-8 (5 mg/mL) was added to 96-well plates. After 2 h incubation at 37 °C, the absorbance at 450 nm of each well was measured using a Thermomax microplate reader.
For cycle assay, IPEC-J2 cells in a six-well plate were harvested after MeAIB treatment, washed with cold PBS, and fixed with ice-cold 70% ethanol for least 24 h. The cells were washed twice with PBS by centrifuging at 1500 rpm for 10 min, and then treated with 5 μg/mL RNase A (Sigma) for 1 h at 37 °C, stained with 25 µg/mL of propidium iodide (PI), and analyzed in a flow cytometer.

4.4. Determination of Protein Synthesis and Degradation

Protein synthesis was assayed by measuring the incorporation of (3H)-Phenylalanine into cell proteins as described previously [12]. IPEC-J2 cells in 10-cm dishes were incubated for 45 h in DMEM with MeAIB (0 or 5 mmoL/L), and then replaced with DMEM with (3H)-Phenylalanine (0.8 µCi per well, sp. act. 120–190 Ci/mmoL) for 3 h. Cells were washed with PBS three times and proteins were precipitated by the addition of ice-cold 2% (v/v) trichloroacetic acid for 10 min, followed by washing and incubation with methanol for 10 min. The cellular material was then solubilized in 1 M NaOH and incorporation of (3H)-Phenylalanine was quantified using liquid scintillation spectrometry.
For determining protein degradation, IPEC-J2 cells were cultured for 48 h in DMEM containing 0.1 mM l-phenylalanine plus (3H)-phenylalanine (0.8 µCi/well). After the 24-h culture to label cellular proteins, cells were washed three times with DMEM containing 1 mM l-phenylalanine and to deplete intracellular free (3H)-phenylalanine. The IPEC-J2 was then cultured for 3 h in 2 mL DMEM with 1 mM l-phenylalanine and MeAIB (0 or 5 mmoL/L). At the end of a 3-h culture period, both medium and cells were collected and determined as performed above. The percentage of protein-bound (3H)-phenylalanine released into culture medium ((3H)-phenylalanine in medium / (3H)-phenylalanine in cell proteins × 100) was calculated to indicate protein degradation in IPEC-1 cells.

4.5. Analysis of Intracellular Free Amino Acids, cAMP, and cGMP

IPEC-J2 cells were cultured in DMEM with MeAIB (0 or 5 mmoL/L) in 6-well platesfor 48 h. The cells were rapidly chilled on ice, rinsed three times with ice-cold 0.9% (w/v) NaCl, and collected by scraping. Amino acids were determined on an Agilent 1100 high-performance liquid chromatography system with Zorbax Eclipse AAA column (4.6 × 75 mm, 3.5 µm) at 40 °C with o-phthalaldehyde/3-mercaptopropionate/9-fluorenylmethyl chloroformate precolumn derivatization and ultraviolet and fluorimetric post column detection.
The Intracellular cAMP and cGMP were detected by immunoassay (Catalog #K371-100, Catalog #K372-100, BioVision, Milpitas, CA, USA) in accordance with the instructions.

4.6. Protein Extraction, SDS-PAGE, and Immunoblotting

IPEC-J2 cells were treated with MeAIB in six-well plates for 48 h. All samples were lysed for 10 min in ice-cold lysis buffer with a complete protease inhibitor cocktail. Immunoblotting assays were performed as described previously [26].

4.7. RT2 Profiler PCR Array Tests

A custom RT2 Profiler PCR Array (Qiagen, Hilden, Germany, Cat. no. 330231) was used to simultaneously detect numerous genes related to the mTOR signaling pathway. Total RNA was isolated from IPEC-J2 cells treated with MeAIB using TRIzol Reagent (Life Technologies, Carlsbad, CA, USA) and quantified with Nanodrop 2000 (Thermo Fisher Scientific, Waltham, MA USA). Total RNA (2 μg) was reverse-transcribed in a final volume of 20 µL with an RT2 First Strand Kit. The RT2 Profiler PCR Array tests were performed following the instructions of the manufacturer. The exported Ct values were input to a template Excel file provided by SABiosciences (Qiagen) and uploaded for online analysis. After data review, qualified data from 35 CMT and 5 NMGT samples were analyzed by applying the 2 −ΔΔCt method.

4.8. Statistical Analysis

All data were expressed as mean ± standard deviation from at least three independent experiments. A one-way ANOVA with Tukey’s post hoc test was performed for analysis of the fold changes of genes in the RT2 Profiler PCR Array test results. A significant difference was expressed as * p < 0.05, while a highly significant difference was expressed as ** p < 0.01.

5. Conclusions

The major function of small-intestinal epithelium acts as digestion and absorption of nutrients, while amino acid transporters have a role in as sensors, as well as carriers, of tissue nutrient supplies. Understanding the relationship between intestinal nutrient absorption and intestinal amino acid transporters could help us to improve digestive systemfunction. Our work indicated that the role of SNAT2 in porcine intestinal epithelial cells was in translocating amino acids and supporting efficient proliferation and development in the mTOR pathway by regulating some transcription factors, which provide insight to nutritional regulation and therapy.

Acknowledgments

This study was jointly supported by the National Natural Science Foundation of China (No. 31330075, 31372326, 31672433, and 31560640), the Natural Science Foundation of Hunan Province (2016JJ4087), Key Programs of Frontier Scientific Research of the Chinese Academy of Sciences (QYZDY-SSW-SMC008), and a Youth Innovation Team Project of ISA, CAS (2017QNCXTD_TBE).

Author Contributions

Bie Tan and Yulong Yin conceived and designed the experiments; Guangran Li performed the experiments; Yulong Tang and Bie Tan analyzed the data; Jianjun Li and Peng Ji contributed reagents/materials/analysis tools; Yulong Tang wrote the paper. Peng Ji and Yulong Yin revised the manuscript. All authors reviewed the manuscript.

Conflicts of Interest

The authors declare no conflict of interest.

Abbreviations

SNAT2Sodium-coupled neutral amino acid transporter 2
mTORMammalian target of rapamycin
IPECIntestinal porcine epithelial cells
MeAIBSystem A amino acid analogue
DMEM-HHigh-glucose Dulbecco’s modified Eagle’s
cAMPCyclic adenosine monophosphate
cGMPCyclic guanosine monophosphate

References

  1. Hyde, R.; Taylor, P.M.; Hundal, H.S. Amino acid transporters: Roles in amino acid sensing and signalling in animal cells. Biochem. J. 2003, 373, 1–18. [Google Scholar]
  2. Pinilla, J.; Aledo, J.C.; Cwiklinski, E.; Hyde, R.; Taylor, P.M.; Hundal, H.S. SNAT2 transceptor signalling via mTOR: A role in cell growth and proliferation? Front. Biosci. 2011, 3, 1289–1299. [Google Scholar]
  3. Evans, K.; Nasim, Z.; Brown, J.; Butler, H.; Kauser, S.; Varoqui, H.; Erickson, J.D.; Herbert, T.P.; Bevington, A. Acidosis-sensing glutamine pump SNAT2 determines amino acid levels and mammalian target of rapamycin signalling to protein synthesis in L6 muscle cells. J. Am. Soc. Nephrol. 2007, 18, 1426–1436. [Google Scholar] [CrossRef]
  4. Li, G.; Li, J.; Tan, B.; Wang, J.; Kong, X.; Guan, G.; Li, F.; Yin, Y. Characterization and regulation of the amino acid transporter SNAT2 in the small intestine of piglets. PLoS ONE 2015, 10, e0128207. [Google Scholar] [CrossRef]
  5. Zhang, Z.; Zander, C.B.; Grewer, C. The C-terminal domain of the neutral amino acid transporter SNAT2 regulates transport activity through voltage-dependent processes. Biochem. J. 2011, 434, 287–296. [Google Scholar] [CrossRef]
  6. Evans, K.; Nasim, Z.; Brown, J.; Clapp, E.; Amin, A.; Yang, B.; Herbert, T.P.; Bevington, A. Inhibition of SNAT2 by metabolic acidosis enhances proteolysis in skeletal muscle. J. Am. Soc. Nephrol. 2008, 19, 2119–2129. [Google Scholar] [CrossRef]
  7. Tan, B.S.; Lonic, A.; Morris, M.B.; Rathjen, P.D.; Rathjen, J. The amino acid transporter SNAT2 mediates l-proline-induced differentiation of ES cells. Am. J. Physiol. Cell Physiol. 2011, 300, C1270–C1279. [Google Scholar] [CrossRef]
  8. Velazquez-Villegas, L.A.; Ortiz, V.; Ström, A.; Torres, N.; Engler, D.A.; Matsunami, R.; Ordaz-Rosado, D.; García-Becerra, R.; López-Barradas, A.M.; Larrea, F.; et al. Transcriptional regulation of the sodium-coupled neutral amino acid transporter (SNAT2) by 17beta-estradiol. Proc. Natl. Acad. Sci. USA 2014, 111, 11443–11448. [Google Scholar] [CrossRef]
  9. Gaccioli, F.; Huang, C.C.; Wang, C.; Bevilacqua, E.; Franchi-Gazzola, R.; Gazzola, G.C.; Bussolati, O.; Snider, M.D.; Hatzoglou, M. Amino acid starvation induces the SNAT2 neutral amino acid transporter by a mechanism that involves eukaryotic initiation factor 2α phosphorylation and cap-independent translation. J. Biol. Chem. 2006, 30, 17929–17940. [Google Scholar] [CrossRef]
  10. Palii, S.S.; Kays, C.E.; Deval, C.; Bruhat, A.; Fafournoux, P.; Kilberg, M.S. Specificity of amino acid regulated gene expression: Analysis of genes subjected to either complete or single amino acid deprivation. Amino Acids 2009, 37, 79–88. [Google Scholar] [CrossRef]
  11. Tang, Y.; Li, J.; Li, F.; Hu, C.A.; Liao, P.; Tan, K.; Tan, B.; Xiong, X.; Liu, G.; Li, T.; et al. Autophagy protects intestinal epithelial cells against deoxynivalenol toxicity by alleviating oxidative stress via IKK signaling pathway. Free Radic. Biol. Med. 2015, 89, 944–951. [Google Scholar] [CrossRef]
  12. Broer, S.; Palacin, M. The role of amino acid transporters in inherited and acquired diseases. Biochem. J. 2011, 436, 193–211. [Google Scholar] [CrossRef]
  13. Tan, B.; Li, X.G.; Kong, X.; Huang, R.; Ruan, Z.; Yao, K.; Deng, Z.; Xie, M.; Shinzato, I.; Yin, Y.; et al. Dietary l-arginine supplementation enhances the immune status in early-weaned piglets. Amino Acids 2009, 37, 323–331. [Google Scholar] [CrossRef]
  14. Tan, B.; Yin, Y.; Kong, X.; Li, P.; Li, X.; Gao, H.; Li, X.; Huang, R.; Wu, G. l-Arginine stimulates proliferation and prevents endotoxin-induced death of intestinal cells. Amino Acids 2010, 38, 1227–1235. [Google Scholar] [CrossRef]
  15. Garcia-Morales, V.; Luaces-Regueira, M.; Campos-Toimil, M. The cAMP effectors PKA and Epac activate endothelial NO synthase through PI3K/Akt pathway in human endothelial cells. Biochem. Pharmacol. 2017, 145, 94–101. [Google Scholar] [CrossRef]
  16. Saxton, R.A.; Sabatini, D.M. mTOR Signaling in Growth, Metabolism, and Disease. Cell 2017, 169, 361–371. [Google Scholar] [CrossRef]
  17. Efeyan, A.; Comb, W.C.; Sabatini, D.M. Nutrient-sensing mechanisms and pathways. Nature 2015, 517, 302–310. [Google Scholar] [CrossRef]
  18. Bar-Peled, L.; Sabatini, D.M. Regulation of mTORC1 by amino acids. Trends Cell Boil. 2014, 24, 400–406. [Google Scholar] [CrossRef]
  19. Sancak, Y.; Peterson, T.R.; Shaul, Y.D.; Lindquist, R.A.; Thoreen, C.C.; Bar-Peled, L.; Sabatini, D.M. The Rag GTPases bind raptor and mediate amino acid signaling to mTORC1. Science 2008, 320, 1496–1501. [Google Scholar] [CrossRef]
  20. Jewell, J.L.; Russell, R.C.; Guan, K.L. Amino acid signalling upstream of mTOR. Nat. Rev. Mol. Cell Biol. 2013, 14, 133–139. [Google Scholar] [CrossRef]
  21. Severance, A.L.; Latham, K.E. PLK1 regulates spindle association of phosphorylated eukaryotic translation initiation factor 4E binding protein, and spindle function in mouse oocytes. Am. J. Physiol. Cell Physiol. 2017. [Google Scholar] [CrossRef]
  22. Canel, M.; Byron, A.; Sims, A.H.; Cartier, J.; Patel, H.; Frame, M.C.; Brunton, V.G.; Serrels, B.; Serrels, A. Nuclear FAK and Runx1 Cooperate to Regulate IGFBP3, Cell-Cycle Progression, and Tumor Growth. Cancer Res. 2017, 77, 5301–5312. [Google Scholar] [CrossRef]
  23. Chen, R.; Wang, B.; Chen, L.; Cai, D.; Li, B.; Chen, C.; Huang, E.; Liu, C.; Lin, Z.; Xie, W.B.; et al. DNA damage-inducible transcript 4 (DDIT4) mediates methamphetamine-induced autophagy and apoptosis through mTOR signaling pathway in cardiomyocytes. Toxicol. Appl. Pharmacol. 2016, 295, 1–11. [Google Scholar] [CrossRef]
  24. Thwaites, D.T.; Anderson, C.M. The SLC36 family of proton-coupled amino acid transporters and their potential role in drug transport. Br. J. Pharmacol. 2011, 164, 1802–1816. [Google Scholar] [CrossRef]
  25. Bröer, S. The SLC38 family of sodium-amino acid co-transporters. Pflugers Arch. 2014, 466, 155–172. [Google Scholar] [CrossRef]
  26. Tang, Y.; Li, F.; Tan, B.; Liu, G.; Kong, X.; Hardwidge, P.R.; Yin, Y. Enterotoxigenic Escherichia coli infection induces intestinal epithelial cell autophagy. Vet. Microbiol. 2014, 171, 160–164. [Google Scholar] [CrossRef]
Figure 1. MeAIB induces the inhibition of SNAT2 and mTOR phosphorylation in IPEC-J2 cells. Data are expressed as mean ± Standard Deviation (SD), n = 4 independent experiments. * p < 0.05 versus control treatment.
Ijms 19 00714 g001
Figure 2. Effects of MeAIB on cell proliferation (A), cell cycle (B), intracellular cAMP (C), and cGMP (D) concentrations in IPEC-J2 cells. Cell proliferation was determined using the Cell Counting Kit-8 (CCK-8, Dojindo Molecular Technologies, Inc., Rockville, MD, USA) at 450 nm. Cell cycles were analyzed using propidium iodide DNA staining and Flow Cytometry. Intracellular cAMP and cGMP were determined by immunoassay. Data are expressed as mean ± SD, n = 4 independent experiments. * p < 0.05 versus control treatment.
Ijms 19 00714 g002
Figure 3. Effect of IPEC-J2 cells’ incubation with MeAIB on protein synthesis (A) and degradation (B). Protein synthesis (nmol Phe/mg) and protein degradation (%) measured using (3H) labeled phenylalanine. Data are expressed as mean ± S, n = 4 independent experiments. * p < 0.05 versus control treatment.
Ijms 19 00714 g003
Table 1. Intracellular free amino acid profile of IPEC-J2.
AA (μmol/mg Protein)ControlMeAIBp-Value
Alanine0.956 ± 0.0110.932 ± 0.0110.169
Arginine1.139 ± 0.0351.049 ± 0.0350.121
Asparagine0.064 ± 0.0040.034 ± 0.0050.003
Glutamine0.599 ± 0.0330.105 ± 0.002<0.001
Glutamate1.704 ± 0.0331.785 ± 0.0760.365
Glycine3.621 ± 0.0981.571 ± 0.057<0.001
Histidine0.302 ± 0.0070.123 ± 0.011<0.001
Isoleucine0.131 ± 0.0150.343 ± 0.0170.221
Leucine0.946 ± 0.0500.774 ± 0.0360.031
Lysine1.616 ± 0.0231.686 ± 0.0470.235
Methionine0.061 ± 0.0010.023 ± 0.003<0.001
Phenylalanine0.262 ± 0.0180.260 ± 0.0140.108
Proline0.679 ± 0.0400.254 ± 0.020<0.001
Serine2.693 ± 0.0451.162 ± 0.048<0.001
Threonine0.859 ± 0.0130.905 ± 0.0330.244
Tryptophan0.071 ± 0.0030.078 ± 0.0040.215
Tyrosine0.025 ± 0.0020.026 ± 0.0030.719
Valine0.135 ± 0.0100.130 ± 0.0110.74
Taurine0.293 ± 0.0230.301 ± 0.0040.758
Table 2. Transcriptional expression profiles of mTOR signaling-related genes in IPEC-J2.
GenesFold Changep-ValueThe Role of RegulationDescription
RPS6KA41.6510.042mTOR Upstream Regulators for mTORC1 Positive RegulationRibosomal protein S6 kinase α-4-like
DDIT41.6250.002mTOR Upstream Regulators for mTORC1 Negative RegulationDNA-damage-inducible transcript 4
EIF4EBP11.5090.044mTOR Downstream Effectors for mTORC1 Negative RegulationEukaryotic translation initiation factor 4E binding protein 1
IGFBP31.9680.014mTOR Upstream Regulators for mTORC1 Negative RegulationInsulin-like growth factor binding protein 3
INS1.8750.034mTOR Upstream Regulators for mTORC1 Positive RegulationInsulin
PIK3CG2.1940.062mTOR Upstream Regulators for mTORC1 and mTORC2 Positive RegulationPhosphoinositide-3-kinase, catalytic, gamma polypeptide
PRKCB2.1790.01mTOR Downstream Effectors for mTORC2 Positive RegulationProtein kinase C, β
RPS6KA12.9150.012mTOR Upstream Regulators for mTORC1 and mTORC2 Positive RegulationRibosomal protein S6 kinase, 90 kDa, polypeptide 1
RPTOR1.5330.001 mTORC1 Complex
ULK11.580.002mTOR Downstream Effectors for mTORC1 Negative RegulationUnc-51-like kinase 1 (C. elegans)
CAB39−1.950.001mTOR Upstream Regulators for mTORC1 Negative RegulationCalcium binding protein 39
DDIT4L−1.9050.02mTOR UpstreamDNA damage-inducible transcript 4-like protein-like
IRS1−2.561<0.001mTOR Upstream Regulators for mTORC1 Positive RegulationInsulin receptor substrate 1
KRAS−1.6020.034mTOR UpstreamGTPase KRas-like
PIK3R2−1.5980.011mTOR UpstreamPhosphoinositide-3-kinase, regulatory subunit 2 (β)
RPS6KA5−2.1290.001mTOR UpstreamRibosomal protein S6 kinase, 90 kDa, polypeptide 5
VEGFB−1.9410.001mTOR Downstream Effectors formTORC1 Positive RegulationVascular endothelial growth factor B-like
RRAGA−1.7900.002mTOR Upstream Effectors for mTORC1 Positive RegulationRas-related GTP binding A
VEGFC−1.6280.012mTOR Downstream Effectors for mTORC1 Positive RegulationVascular endothelial growth factor C-like
YWHAQ−1.770.003mTOR Upstream Regulators for mTORC1 Negative RegulationTyrosine 3-monooxygenase/tryptophan 5-monooxygenase activation protein, theta polypeptide

