Quantitative Proteomic Approach Targeted to Fibrinogen β Chain in Tissue Gastric Carcinoma

 , , , and
Abstract
: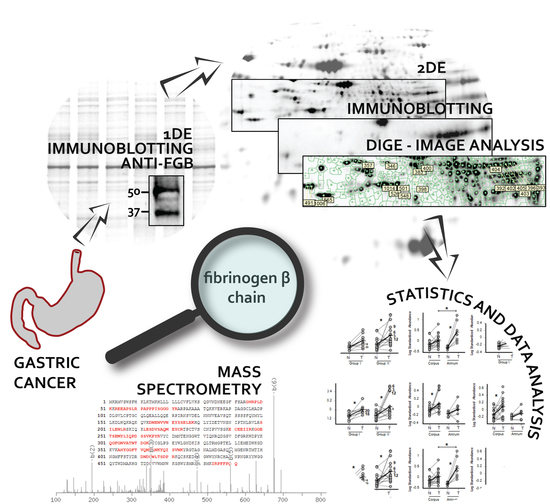
1. Introduction
2. Results
2.1. Patients and Disease Characteristics
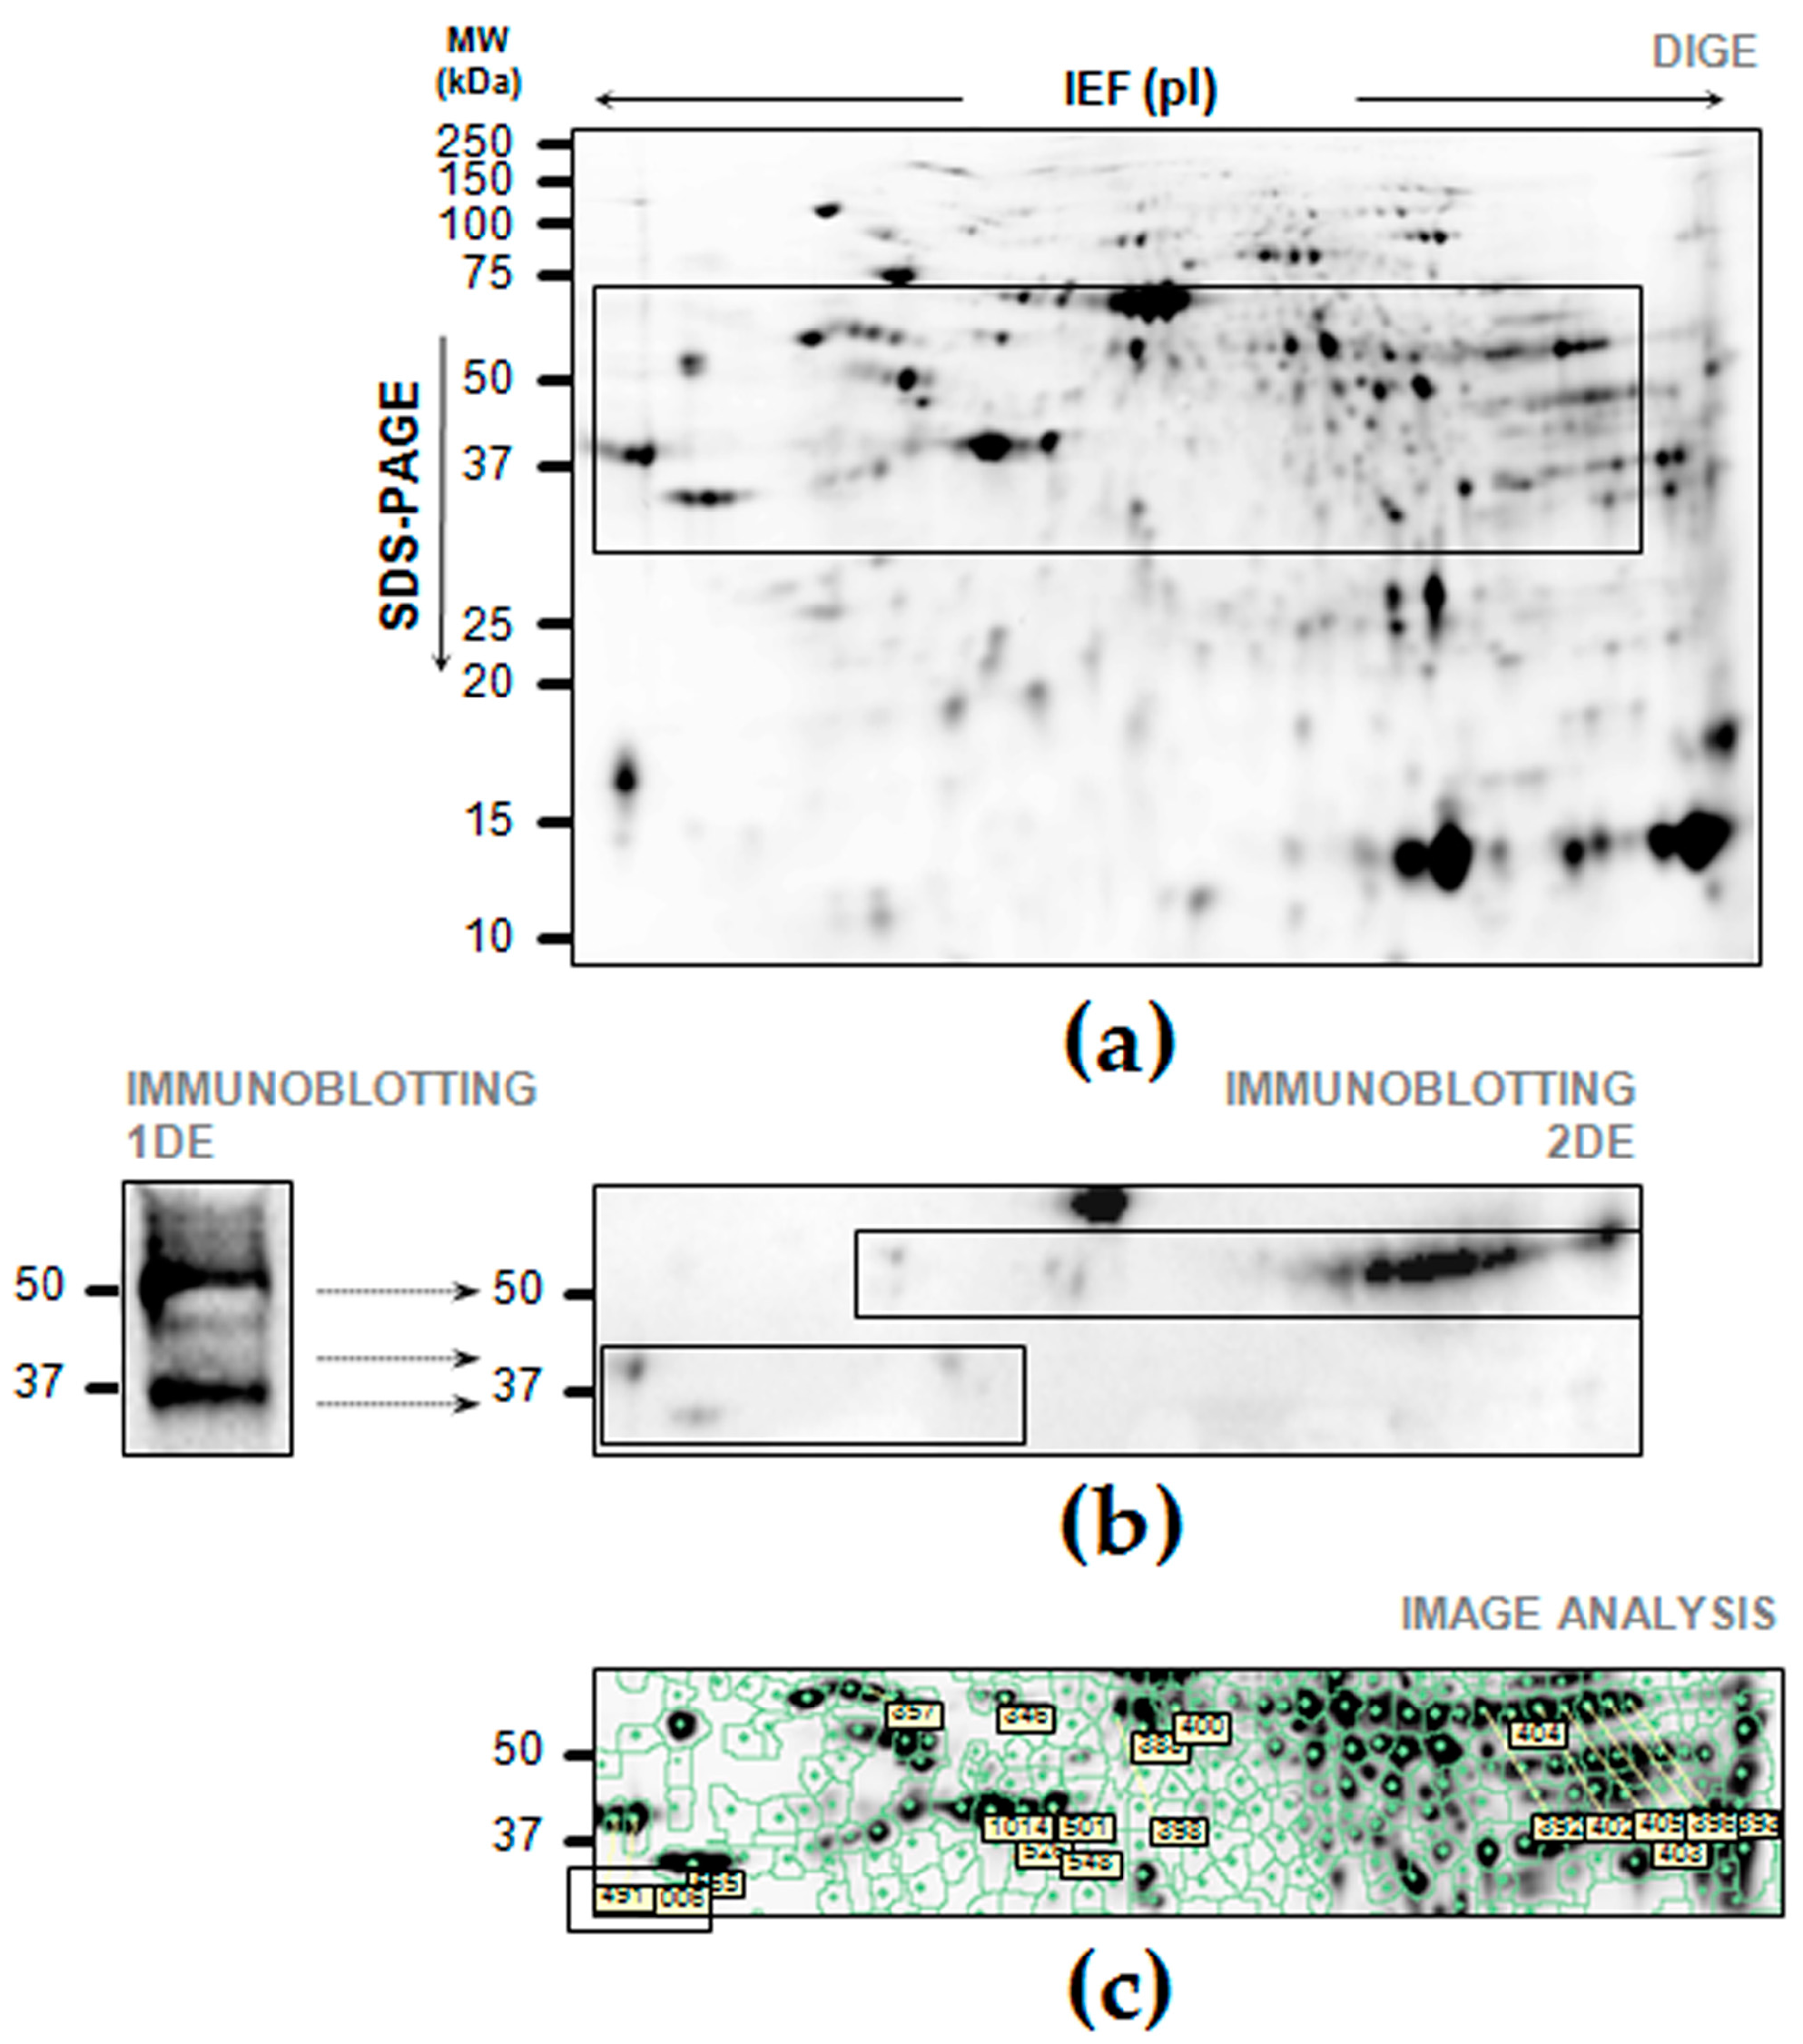
2.2. One-Dimension Immunoblotting
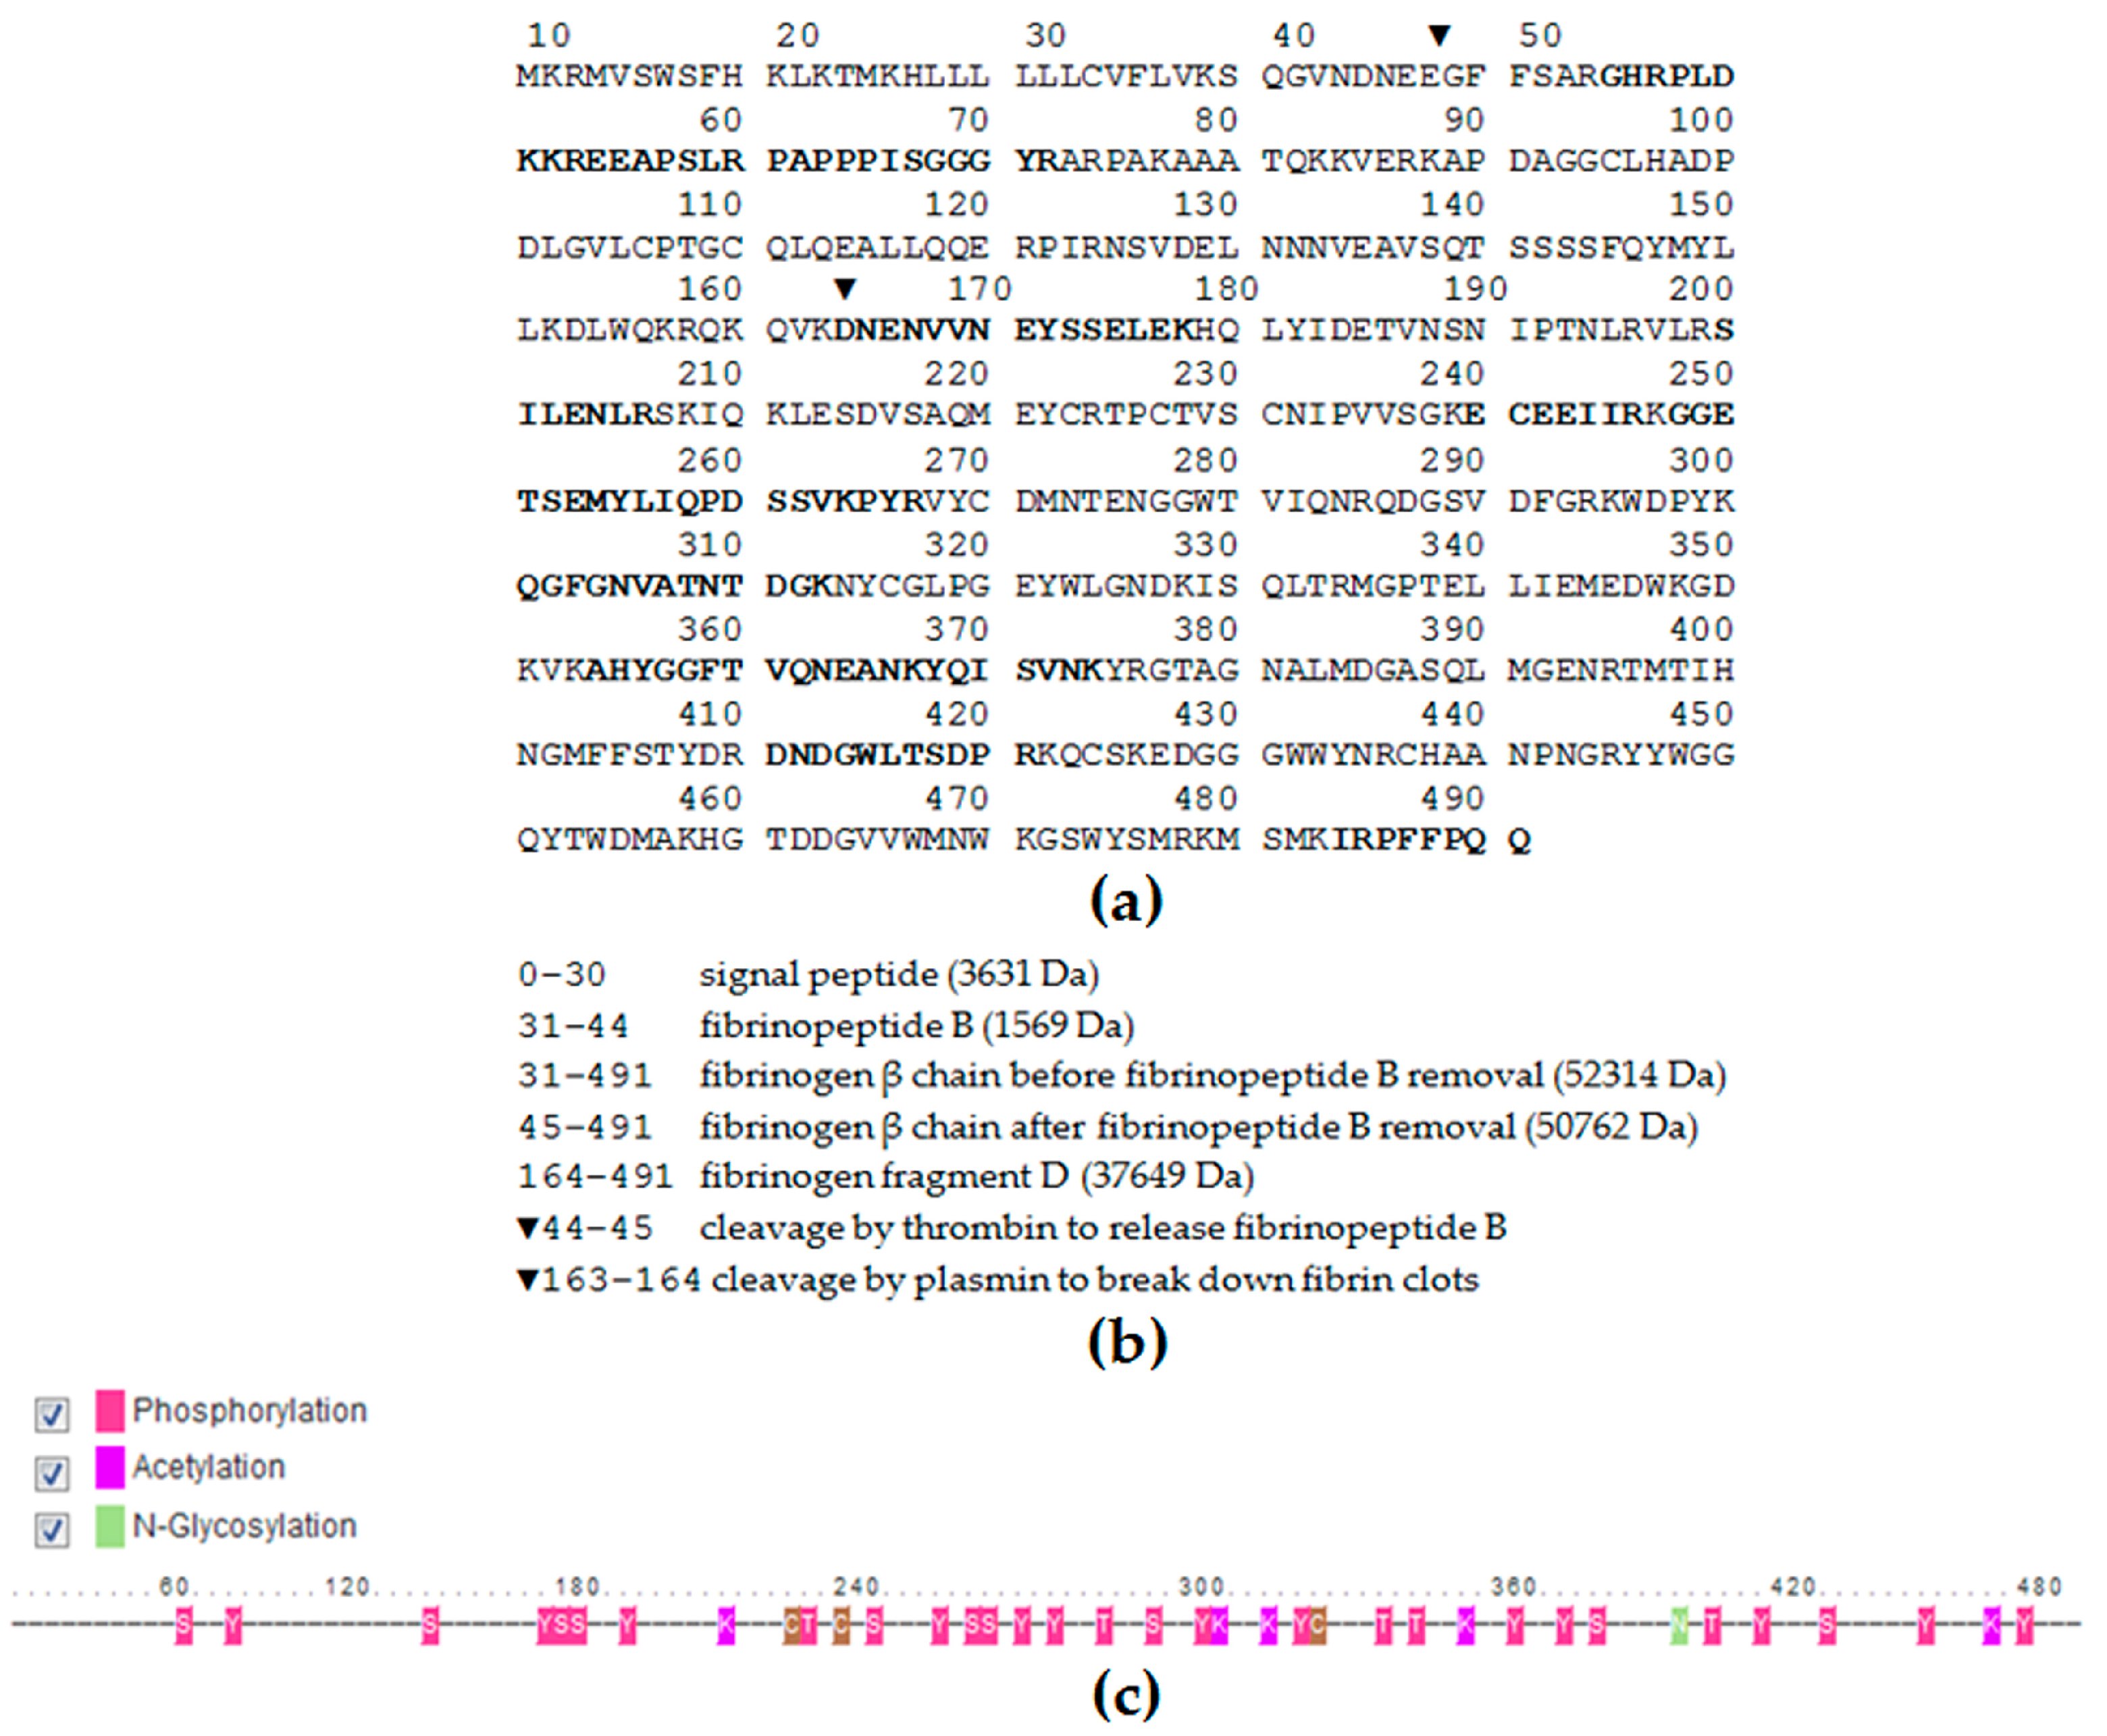
2.3. Validation of Fibrinogen β Chain (FGB) by Mass Spectrometry
2.4. Cross-Reaction of FGB on Two-Dimensional Electrophoresis (2DE) Maps of Gastric Tissue
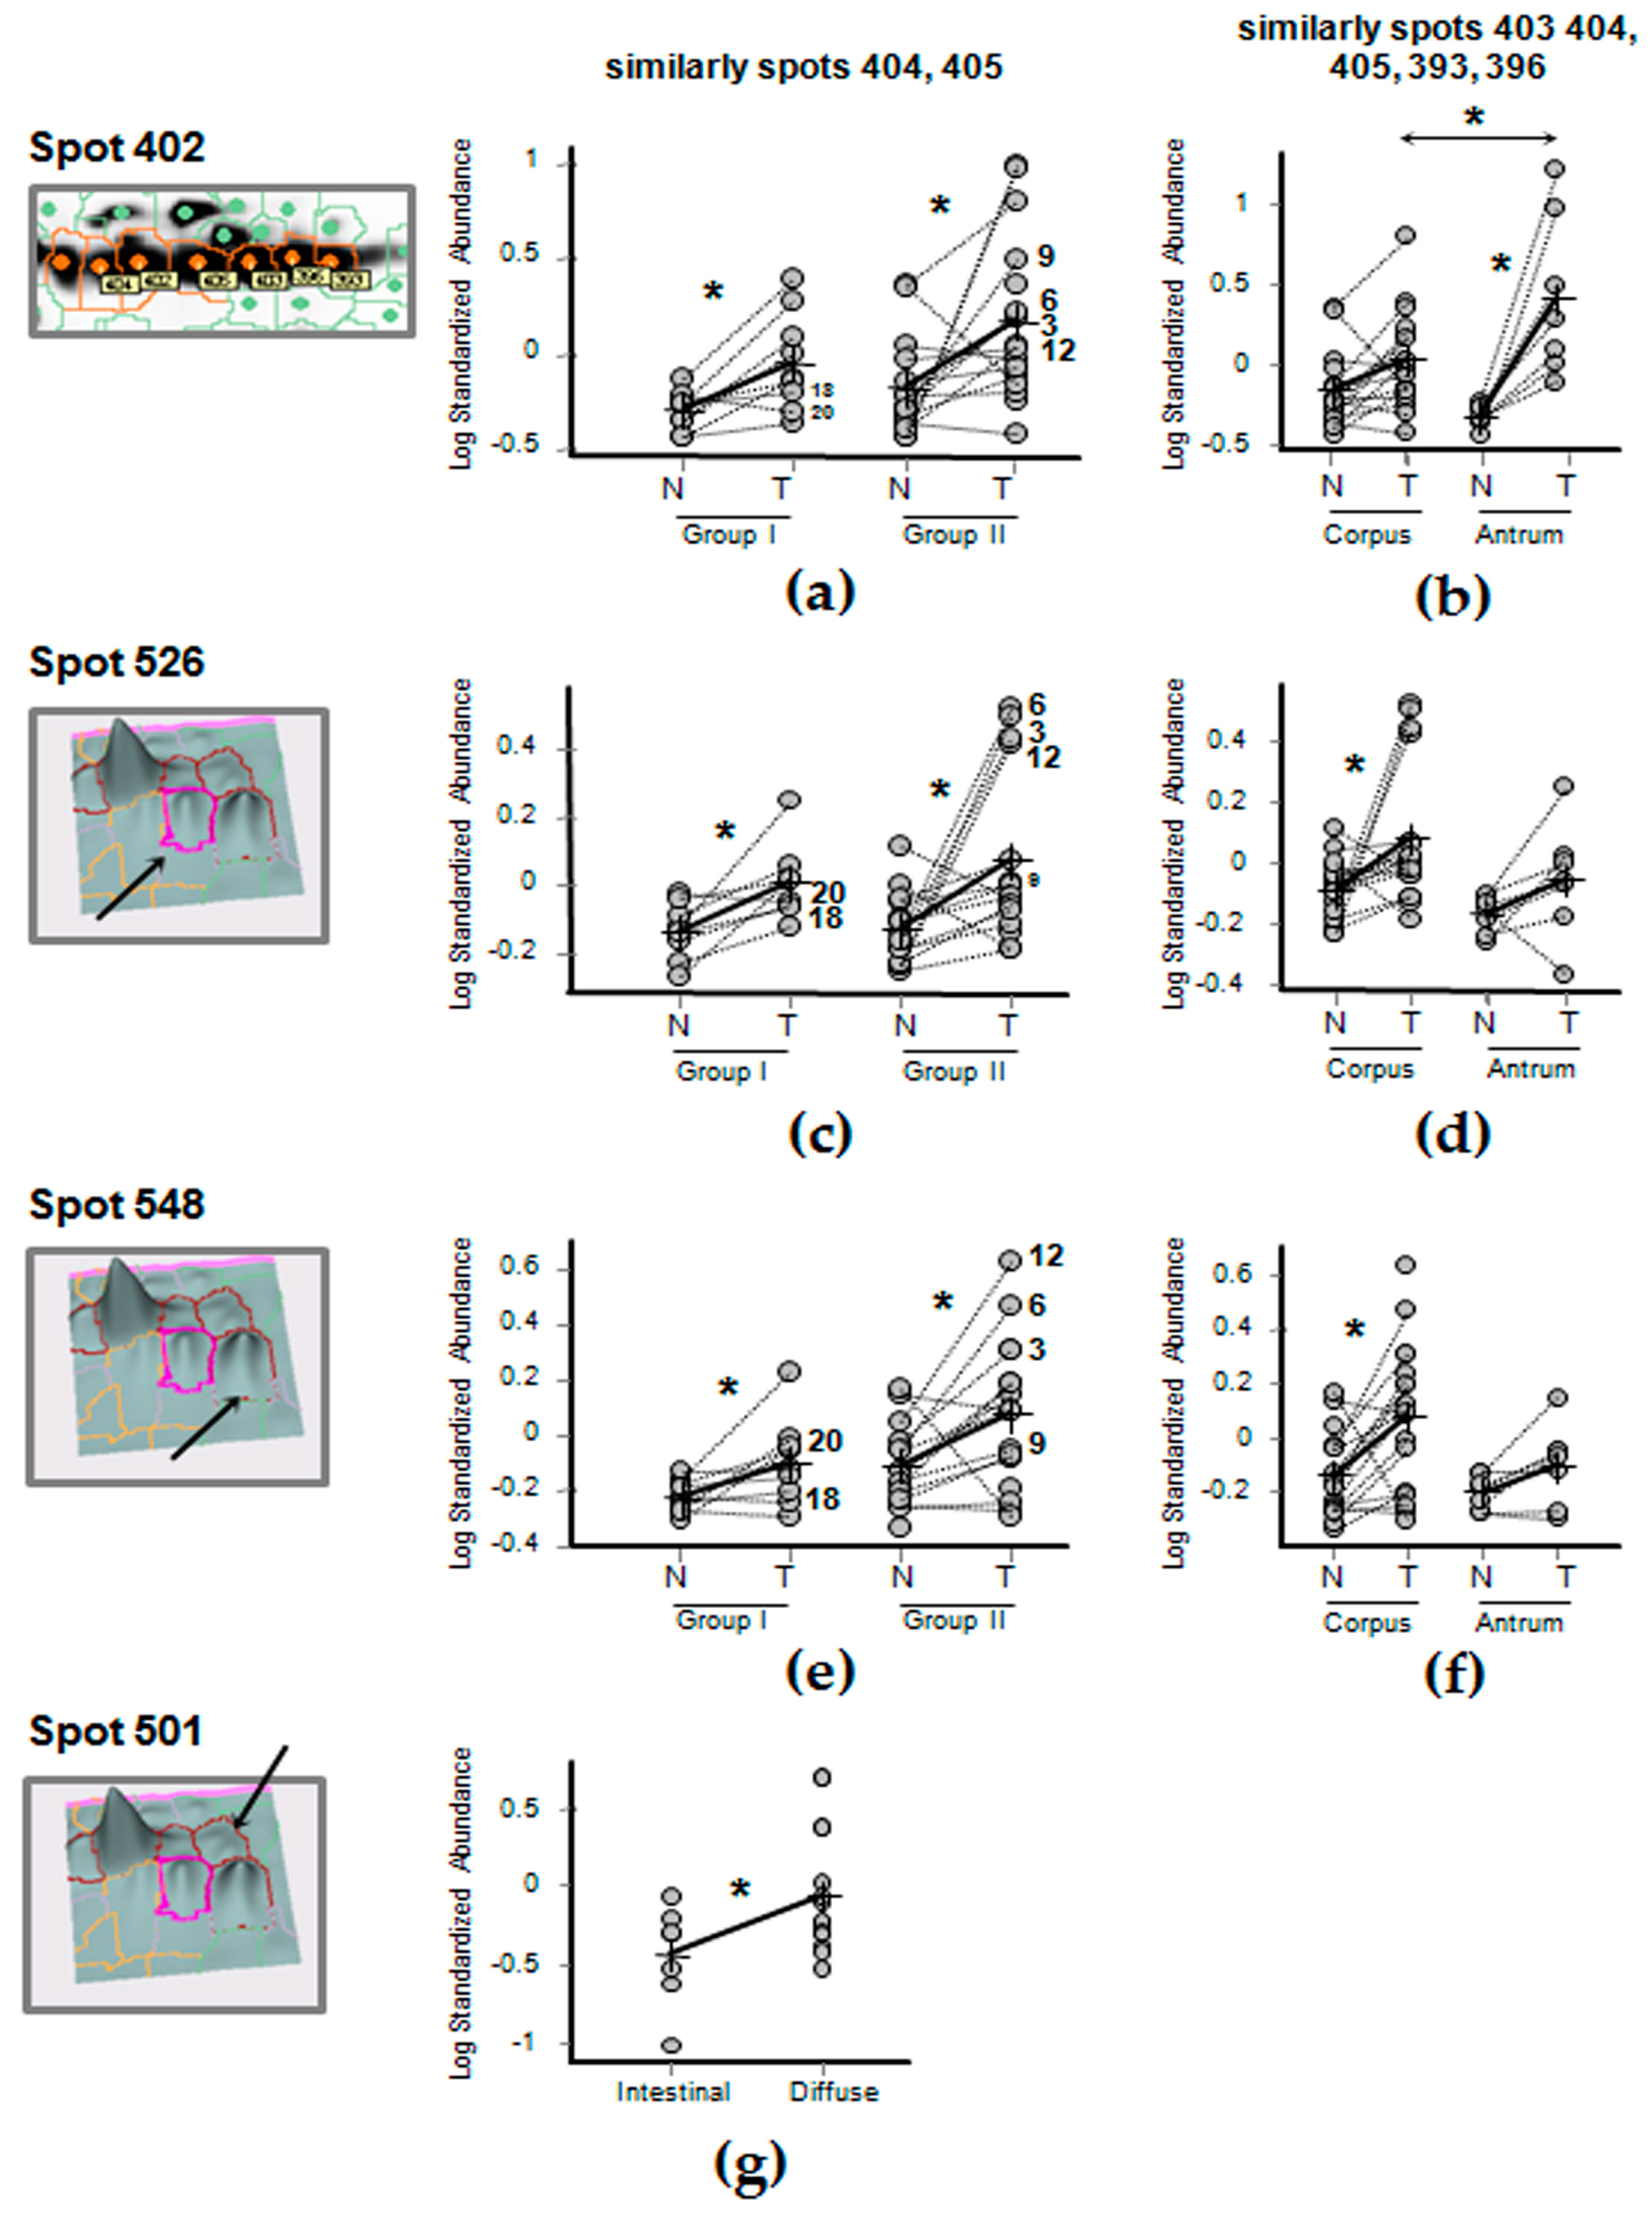
2.5. Differential Expression of FGB in Gastric Cancer Tissues
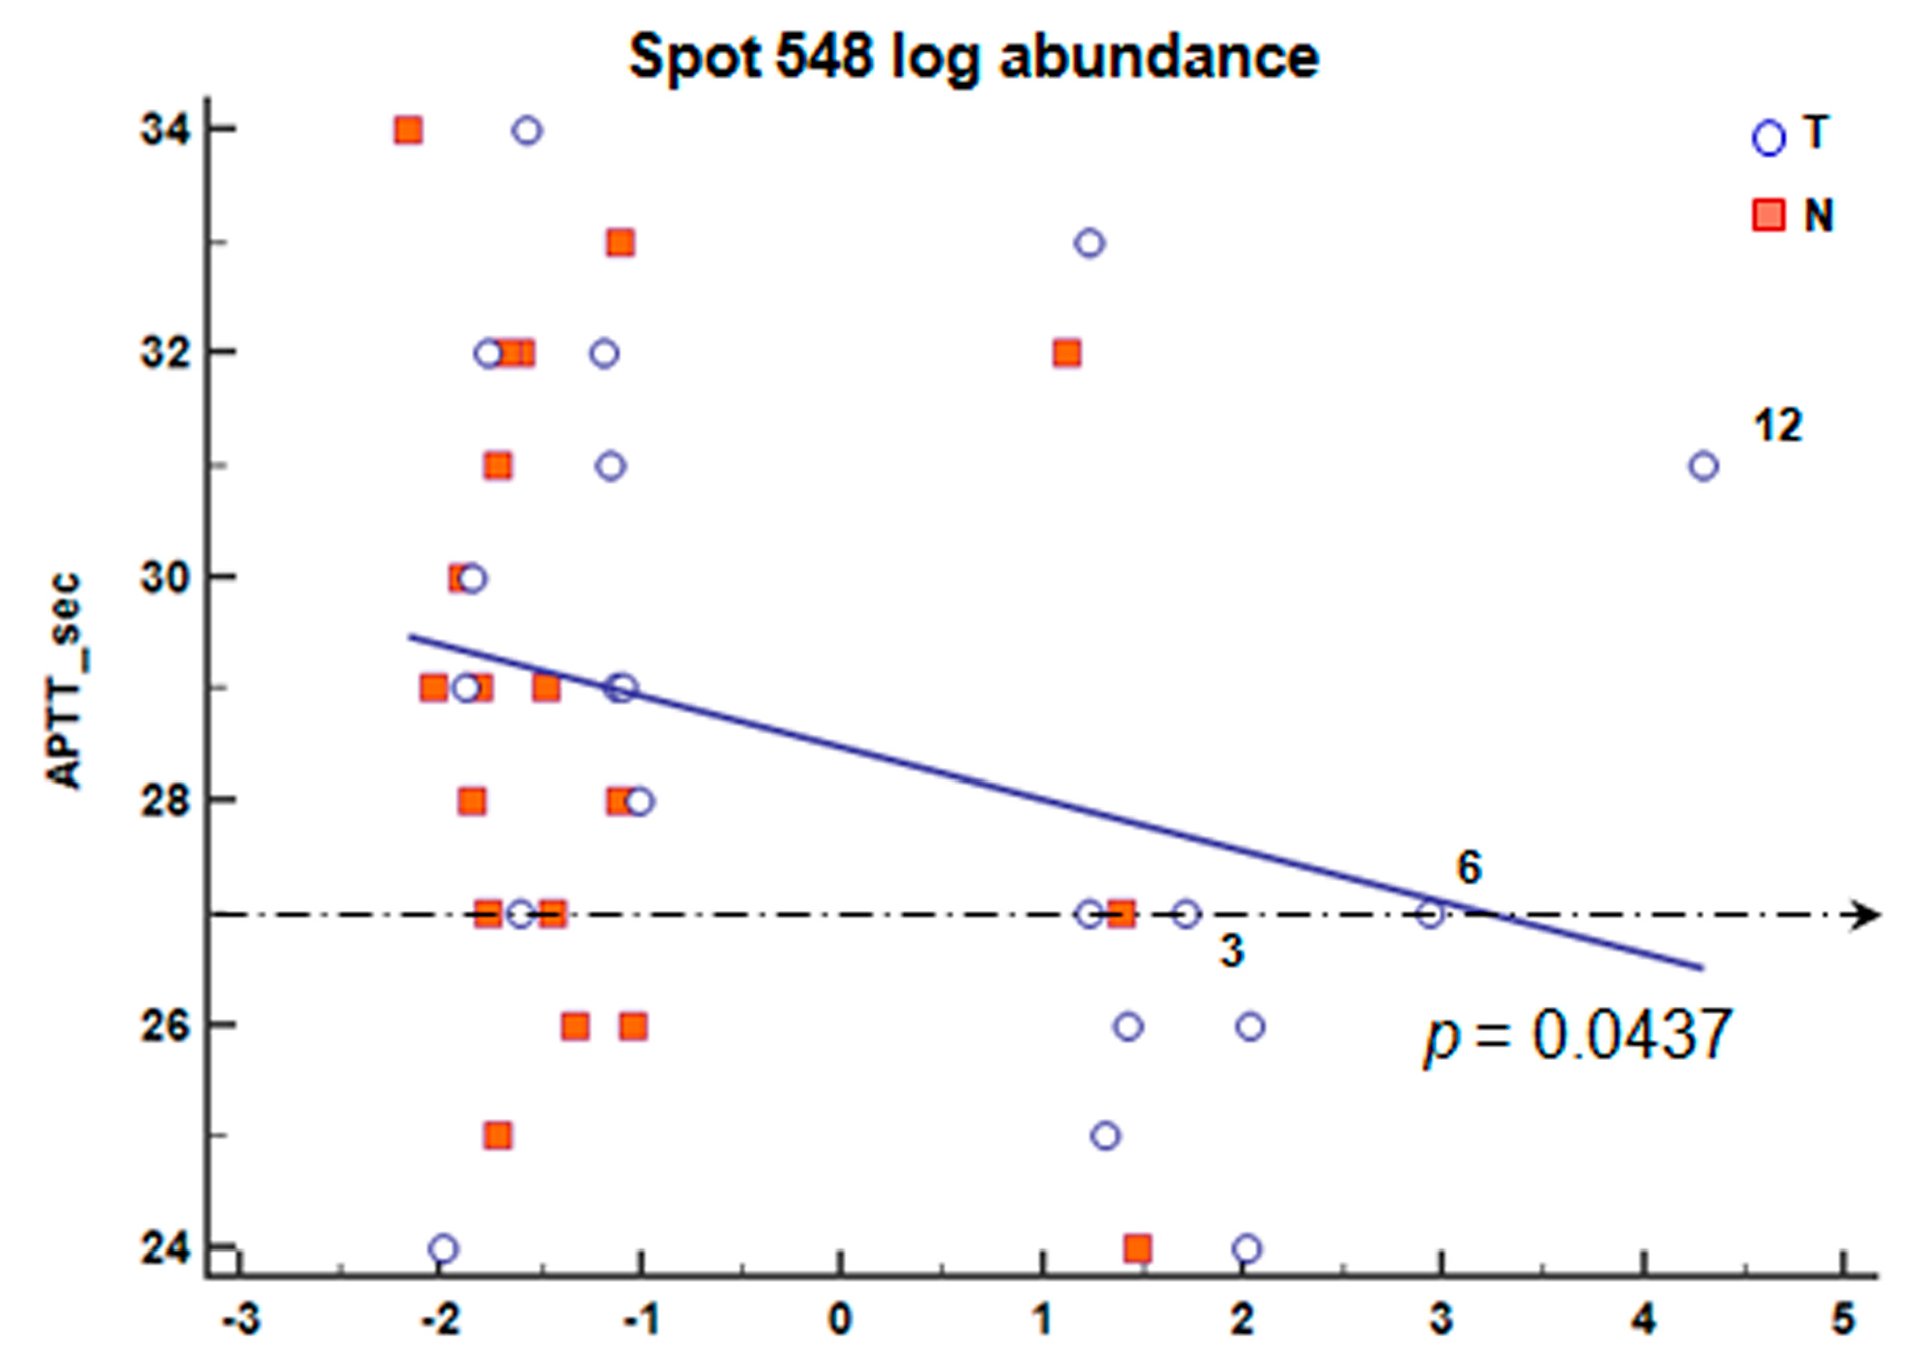
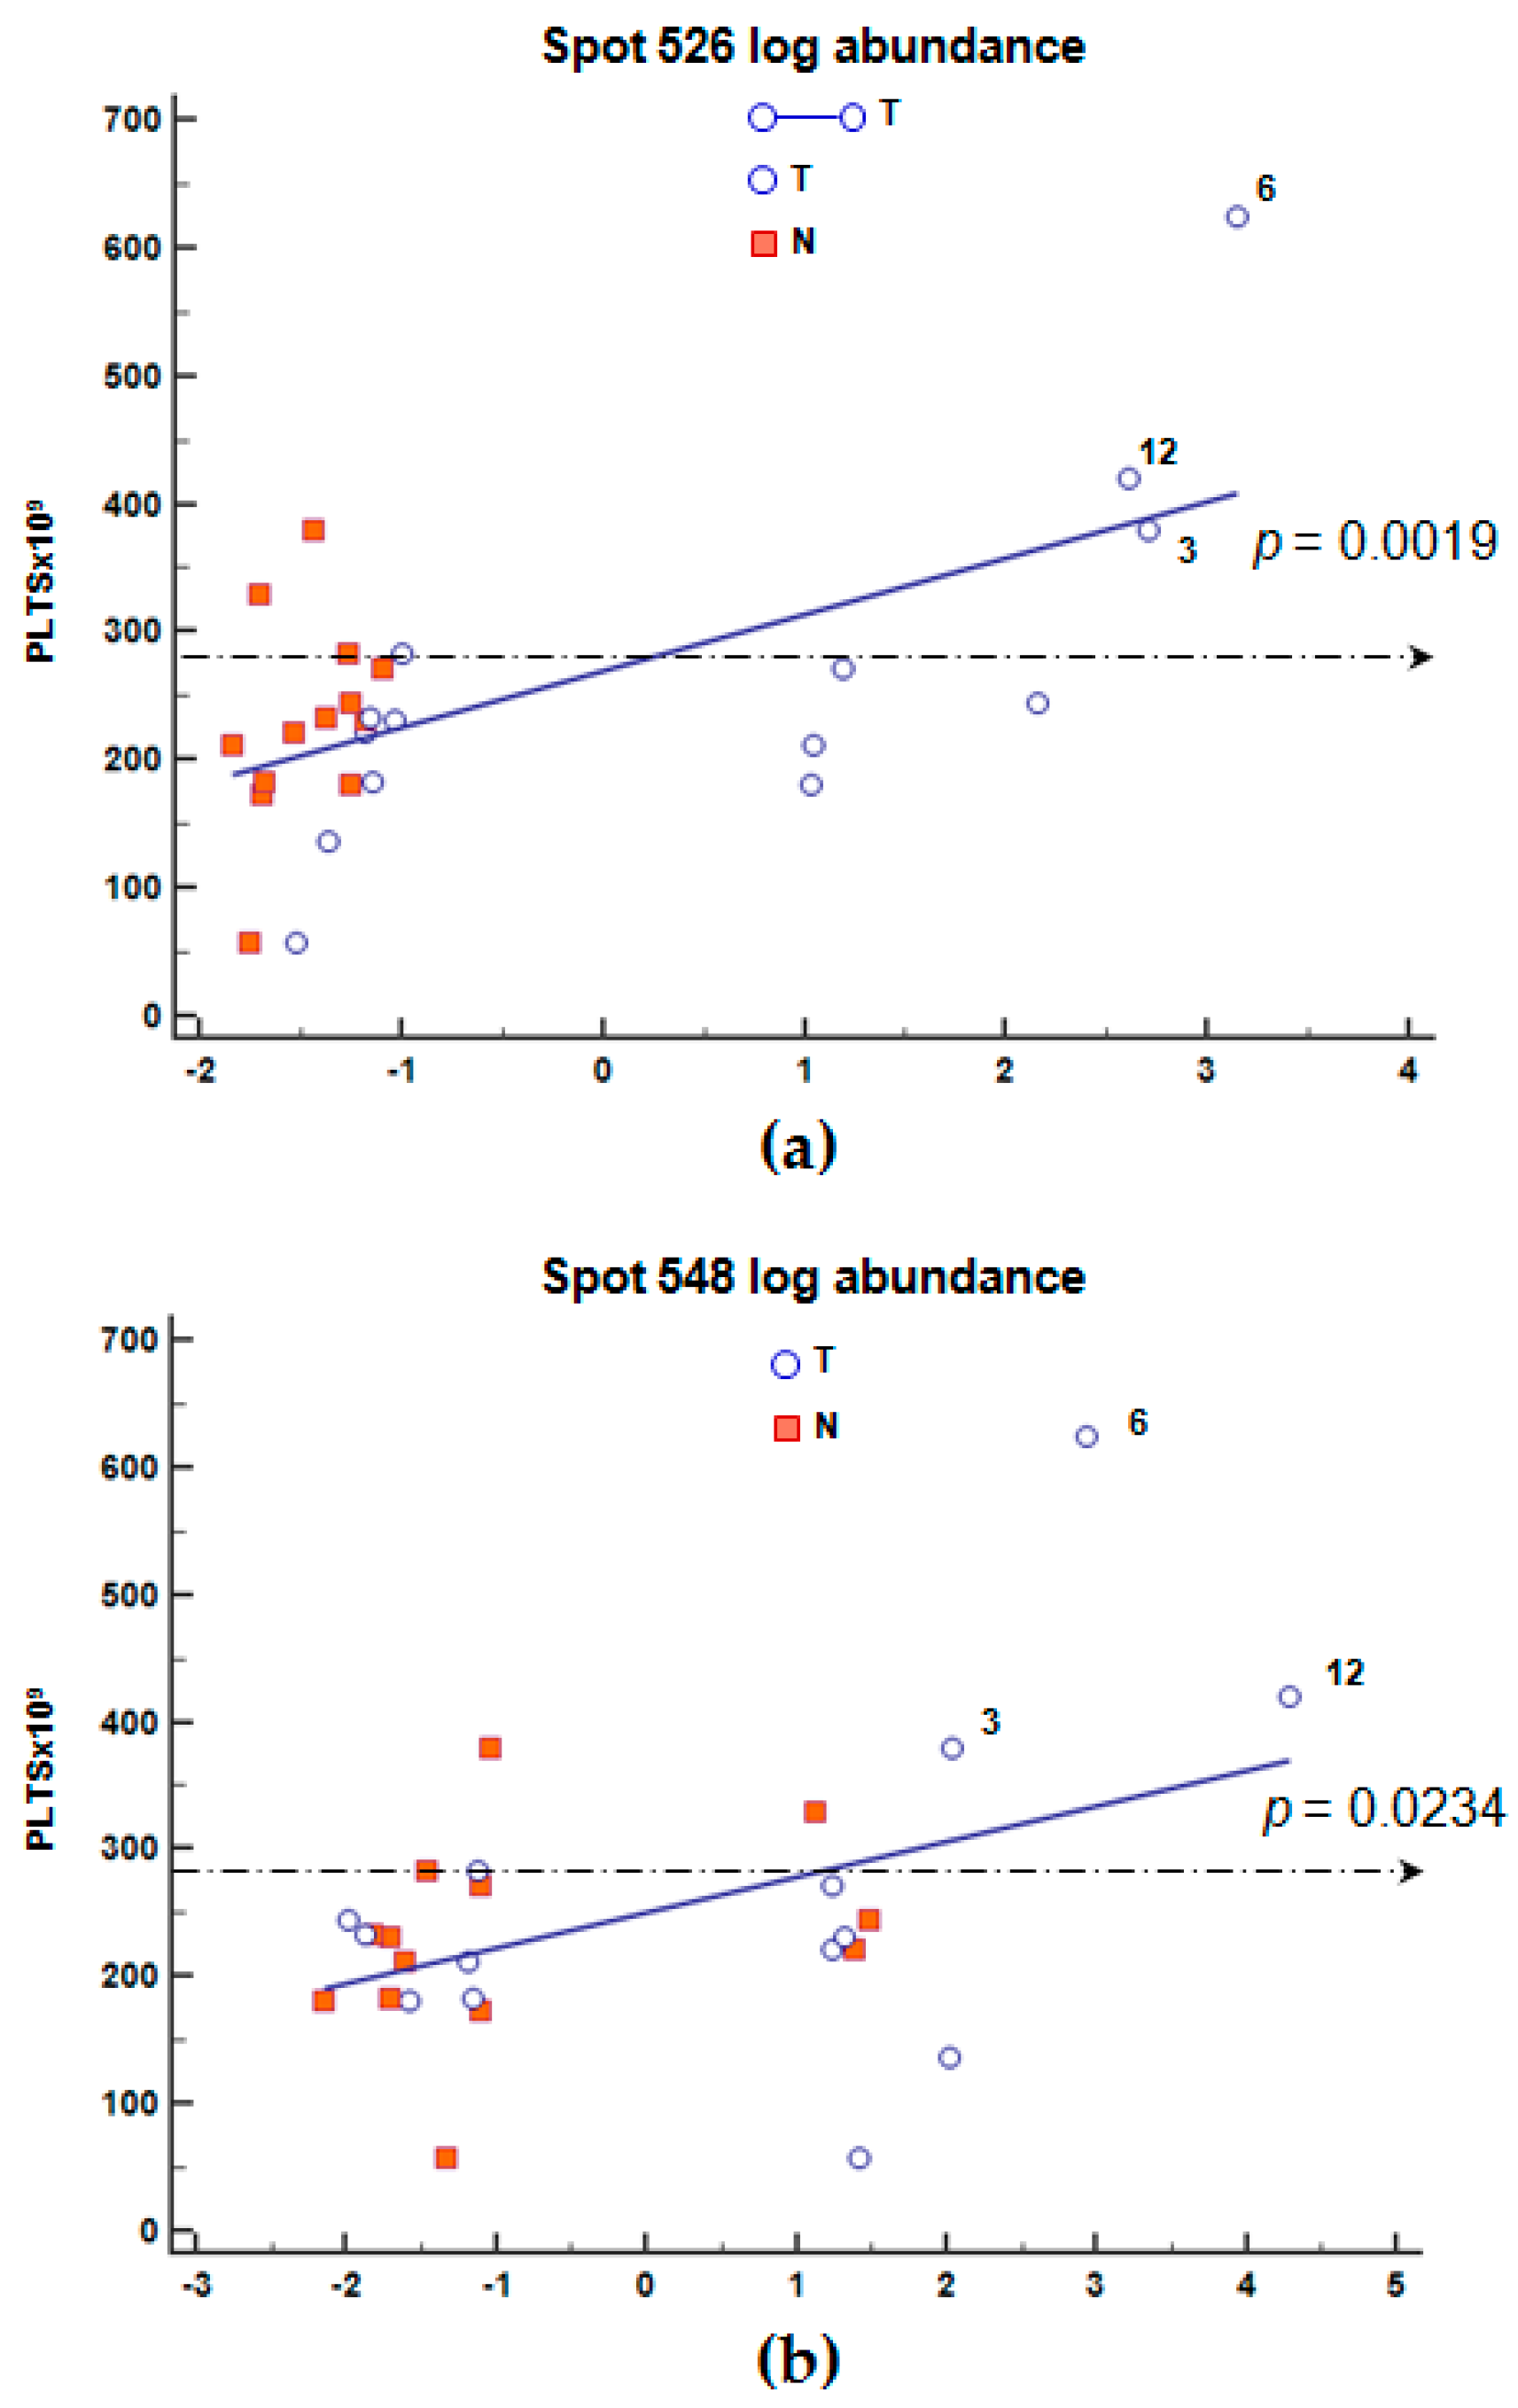
2.6. Correlation of Blood Count Parameters and FGB Abundance
3. Discussion
4. Materials and Methods
4.1. Patients and Tissues
4.2. Blood Sample Analysis
4.3. Sample Preparation and Grouping
4.4. One-Dimensional Electrophoresis (1DE) and Immunoblotting Anti-Fibrinogen β Chain
4.5. Validation of the 1DE Bands Cross-Reacting with Fibrinogen β Chain
4.6. Two-Dimensional Difference in Gel Electrophoresis (2D-DIGE) and Immunoblotting Anti-Fibrinogen β Chain
4.7. Database Searches for Fibrinogen β Chain Sequence and Post-Translational Modifications
4.8. Image Analysis and Statistics
4.9. Correlation Analysis of Blood Parameters
5. Conclusions
Acknowledgments
Author Contributions
Conflicts of Interest
Abbreviations
| 1DE | one-dimensional electrophoresis |
| 2DE | two-dimensional electrophoresis |
| ALC | absolute lymphocyte count |
| ANC | absolute neutrophil count |
| APTT | activated partial thromboplastin time |
| APTT RATIO | ratio of APPT |
| BVA | biological variation analysis |
| DIA | decyder differential in-gel analysis |
| DIGE | difference gel electrophoresis |
| FGB | fibrinogen β chain |
| FIB | fibrinogen level |
| GC | gastric cancer |
| IEF | isoelectrofocusing |
| N/R | ANC/ALC ratio |
| PLT | platelet count |
| PT | prothrombin time |
| WBC | white blood cells |
Appendix A


| Patient nr. | Age | Male/Female a | uT | uN b | Histological Classification b | Anatomical Subsites | Tissue c | Cye Dye | Gel nr. |
|---|---|---|---|---|---|---|---|---|---|
| 1 | 54 | M | 3 | N+ | diffuse | corpus | N | cy3 | 1 |
| T | cy5 | ||||||||
| 2 | 50 | F | 3 | N+ | diffuse | antrum | N | cy3 | 2 |
| T | cy5 | ||||||||
| 3 | 44 | F | 3 | N+ | diffuse | corpus | N | cy3 | 3 |
| T | cy5 | ||||||||
| 4 | 39 | F | 3 | N+ | diffuse | corpus | N | cy3 | 4 |
| T | cy5 | ||||||||
| 5 | 68 | M | 3 | N0 | diffuse | corpus | N | cy3 | 5 |
| 6 | 52 | M | 3 | N+ | n.a. | corpus | T | cy5 | |
| 7 | 55 | M | 3 | N+ | diffuse | corpus | N | cy5 | 6 |
| T | cy3 | ||||||||
| 8 | 81 | F | 3 | N+ | intestinal | antrum | N | cy5 | 7 |
| T | cy3 | ||||||||
| 9 | 74 | M | 3 | N+ | diffuse | antrum | N | cy5 | 8 |
| T | cy3 | ||||||||
| 10 | 65 | M | 4 | N+ | diffuse | corpus | N | cy5 | 9 |
| T | cy3 | ||||||||
| 11 | 71 | F | 3 | N0 | diffuse | antrum | N | cy5 | 10 |
| 12 | 69 | M | 3 | N+ | intestinal | corpus | T | cy3 | |
| 13 | 60 | F | 4 | n.a. | other | corpus | N | cy5 | 11 |
| T | cy3 | ||||||||
| 14 | 68 | F | 4 | N0 | intestinal | corpus | N | cy5 | 12 |
| T | cy3 | ||||||||
| 15 | 54 | M | 3 | N+ | diffuse | cardia | N | cy5 | 13 |
| T | cy3 | ||||||||
| 16 | 70 | F | 2 | n.a. | intestinal | antrum | N | cy5 | 14 |
| T | cy3 | ||||||||
| 17 | 76 | F | 1 | N0 | intestinal | antrum | N | cy3 | 15 |
| T | cy5 | ||||||||
| 18 | 59 | M | 1 | N0 | other | cardia | N | cy3 | 16 |
| T | cy5 | ||||||||
| 19 | 66 | F | 1 | N0 | diffuse | corpus | N | cy5 | 17 |
| T | cy3 | ||||||||
| 20 | 48 | M | 2 | N0 | intestinal | corpus | N | cy5 | 18 |
| T | cy3 | ||||||||
| 21 | 36 | F | 1 | N0 | intestinal | corpus | N | cy5 | 19 |
| T | cy3 | ||||||||
| 22 | 59 | M | 1 | N+ | diffuse | corpus | N | cy5 | 19 |
| T | cy3 | ||||||||
| 23 | 69 | F | 3 | N0 | n.a. | corpus | N | cy3 | 20 |
| T | cy5 | ||||||||
| 24 | 58 | M | 3 | N+ | diffuse | corpus | N | cy3 | 21 |
| T | cy5 | ||||||||
| 25 | 45 | F | 3 | N+ | diffuse | corpus | N | cy5 | 22 |
| T | cy3 | ||||||||
| 26 | 68 | M | 1 | N0 | diffuse | antrum | N | cy5 | 23 |
| T | cy3 | ||||||||
| 27 | 50 | F | 1 | N0 | diffuse | antrum | N | cy5 | 24 |
| T | cy3 | ||||||||
| 28 | 55 | F | 3 | N+ | diffuse | corpus | N | cy5 | 25 |
| T | cy3 |
| Patient nr. a | WBC × 109/L | PLT × 109/L | ANC × 109/L | ALC × 109/L | N/R | PT-INR | FIB g/L b | APTTs | APTT RATIO |
|---|---|---|---|---|---|---|---|---|---|
| 1 | 4.65 | 221 | 3 | 1.3 | 2.31 | 0.93 | 2.91 | 27 | 0.83 |
| 2 | 1.19 | 57 | 0.7 | 0.4 | 1.75 | 0.93 | 2.76 | 26 | 0.86 |
| 3 * | 5.23 | 379 | 4.5 | 0.7 | 6.43 | 1.13 | 2.76 | 26 | 0.88 |
| 4 | 7.9 | 272 | 4.2 | 2.6 | 1.62 | 1 | 3.54 | 33 | 1.1 |
| 5 | 7.61 | 174 | 4.1 | 2.9 | 1.41 | 0.99 | 2.20 | 28 | 0.93 |
| 6 * | 8.95 | 624 | 5.3 | 2.7 | 1.96 | 0.95 | n.a. | 27 | 0.89 |
| 7 | 6.29 | 182 | 3.4 | 2 | 1.70 | 0.99 | 2.95 | 34 | 1.14 |
| 8 | 4.74 | 184 | 2.6 | 1.8 | 1.44 | 1 | 2.76 | 31 | 1.03 |
| 9 * | 7.19 | 283 | 4.3 | 2 | 2.15 | 0.96 | 3.34 | 29 | 0.95 |
| 10 | 9.61 | 137 | 7.8 | 1.1 | 7.09 | 1.03 | 3.01 | 24 | 0.79 |
| 11 | 7.92 | 330 | 5.3 | 2 | 2.65 | 0.99 | n.a. | 32 | 1.04 |
| 12 * | 7.57 | 421 | 3.9 | 3.1 | 1.26 | 0.95 | 2.96 | 31 | 1.03 |
| 13 | 8.12 | 231 | 6.1 | 1.2 | 5.08 | 1.02 | 3.37 | 25 | 0.83 |
| 14 | 5.11 | 245 | 2.7 | 1.9 | 1.42 | 0.92 | 3.57 | 24 | 0.79 |
| 15 | 6.74 | 212 | 5.1 | 1.1 | 4.64 | 1.04 | 3.68 | 32 | 1.06 |
| 16 | 4.8 | 234 | 2.4 | 2 | 1.20 | 1.06 | 3.03 | 29 | 0.95 |
| 17 | 4,1 | 215 | 2.4 | 1.3 | 1.85 | 1.03 | 3.45 | 30 | 1.01 |
| 18 * | 7.72 | 283 | 4.1 | 2.8 | 1.46 | 1.03 | 3.37 | 32 | 1.07 |
| 19 | 7.63 | 233 | 5.5 | 1.6 | 3.44 | 0.97 | 2.16 | 27 | 0.89 |
| 20 * | 6.71 | 345 | 3.3 | 2.7 | 1.22 | 1.02 | 2.56 | 29 | 0.97 |
| 21 | 5.05 | 235 | 3.2 | 1.6 | 2.00 | 0.95 | 2.56 | 27 | 0.91 |
| 22 | 4.51 | 177 | 2.6 | 1.5 | 1.73 | 1.01 | 2.26 | 28 | 0.95 |
| Gel Portion nr.a | Database | Accession | Description | Score/Seq. Coverage % | Start-End | Peptide | Matches/Sequences |
|---|---|---|---|---|---|---|---|
| 4 | NCBInr | gi|119625336 | Fibrinogen β chain, isoform CRA_b | 239/29 | 42–48 50–69 161–175 197–203 220–226 228–244 | R.GHRPLDK.K K.REEAPSLRPAPPPISGGGYR.A K.DNENVVNEYSSELEK.H R.SILENLR.S K.ECEEIIR.K K.GGETSEMYLIQPDSSVK.D | 11/7 |
| 5 | SwissProt | FIBB_HUMAN | Fibrinogen β chain | 376/28 | 45–51 53–72 164–178 200–206 212–224 240–246 248–267 301–313 354–367 368–374 411–421 484–491 | R.GHRPLDK.K K.REEAPSLRPAPPPISGGGYR.A K.DNENVVNEYSSELEK.H R.SILENLR.S K.LESDVSAQMEYCR.T K.ECEEIIR.K K.GGETSEMYLIQPDSSVKPYR.V K.QGFGNVATNTDGK.N K.AHYGGFTVQNEANK.Y K.YQISVNK.Y R.DNDGWLTSDPR.K K.IRPFFPQQ.- | 19/12 |
| 7 * | SwissProt | FIBB_HUMAN | Fibrinogen β chain | 269/15 | 164–178 212–224 225–239 301–313 354–367 484–491 | K.DNENVVNEYSSELEK.H K.LESDVSAQMEYCR.T R.TPCTVSCNIPVVSGK.E K.QGFGNVATNTDGK.N K.AHYGGFTVQNEANK.Y K.IRPFFPQQ.- | 6/5 |
| 8 * | SwissProt | FIBB_HUMAN | Fibrinogen β chain | 340/19 | 164–178 212–224 225–239 240–246 248–267 301–313 354–367 | K.DNENVVNEYSSELEK.H K.LESDVSAQMEYCR.T R.TPCTVSCNIPVVSGK.E K.ECEEIIR.K K.GGETSEMYLIQPDSSVKPYR.V K.QGFGNVATNTDGK.N K.AHYGGFTVQNEANK.Y | 8/7 |
| 9 * | SwissProt | FIBB_HUMAN | Fibrinogen β chain | 477/21 | 164–178 212–224 225–239 240–246 248–267 301–313 354–367 484–491 | K.DNENVVNEYSSELEK.H K.LESDVSAQMEYCR.T R.TPCTVSCNIPVVSGK.E K.ECEEIIR.K K.GGETSEMYLIQPDSSVKPYR.V K.QGFGNVATNTDGK.N K.AHYGGFTVQNEANK.Y K.IRPFFPQQ.- | 13/11 |
References
- Ferlay, J.; Soerjomataram, I.; Dikshit, R.; Eser, S.; Mathers, C.; Rebelo, M.; Parkin, D.M.; Forman, D.; Bray, F. Cancer incidence and mortality worldwide: Sources, methods and major patterns in GLOBOCAN 2012. Int. J. Cancer 2015, 136, E359–E386. [Google Scholar] [CrossRef] [PubMed]
- Fakhri, B.; Lim, K.H. Molecular landscape and sub-classification of gastrointestinal cancers: A review of literature. J. Gastrointest. Oncol. 2017, 8, 379–386. [Google Scholar] [CrossRef] [PubMed]
- Gigek, C.O.; Calcagno, D.Q.; Rasmussen, L.T.; Santos, L.C.; Leal, M.F.; Wisnieski, F.; Burbano, R.R.; Lourenço, L.G.; Lopes-Filho, G.J.; Smith, M.A.C. Genetic variants in gastric cancer: Risks and clinical implications. Exp. Mol. Pathol. 2017, 103, 101–111. [Google Scholar] [CrossRef] [PubMed]
- Nishikawa, J.; Iizasa, H.; Yoshiyama, H.; Nakamura, M.; Saito, M.; Sasaki, S.; Shimokuri, K.; Yanagihara, M.; Sakai, K.; Suehiro, Y.; et al. The role of epigenetic regulation in Epstein-Barr virus-Associated gastric cancer. Int. J. Mol. Sci. 2017, 18, E1606. [Google Scholar] [CrossRef] [PubMed]
- Patel, T.N.; Roy, S.; Ravi, R. Gastric cancer and related epigenetic alterations. Ecancermedicalscience 2017, 11, 714. [Google Scholar] [CrossRef] [PubMed]
- Kang, C.; Lee, Y.; Lee, J.E. Recent advances in mass spectrometry-based proteomics of gastric cancer. World J. Gastroenterol. 2016, 22, 8283–8293. [Google Scholar] [CrossRef] [PubMed]
- Leal, M.F.; Wisnieski, F.; de Oliveira Gigek, C.; do Santos, L.C.; Calcagno, D.Q.; Burbano, R.R.; Smith, M.C. What gastric cancer proteomic studies show about gastric carcinogenesis? Tumour Biol. 2016, 37, 9991–10010. [Google Scholar] [CrossRef] [PubMed]
- Mohri, Y.; Toiyama, Y.; Kusunoki, M. Progress and prospects for the discovery of biomarkers for gastric cancer: A focus on proteomics. Expert Rev. Proteom. 2016, 13, 1131–1139. [Google Scholar] [CrossRef] [PubMed]
- Sheikh, I.A.; Mirza, Z.; Ali, A.; Aliev, G.; Ashraf, G.M. A proteomics based approach for the identification of gastric cancer related markers. Curr. Pharm. Des. 2016, 22, 804–811. [Google Scholar] [CrossRef] [PubMed]
- Repetto, O.; De Re, V. Coagulation and fibrinolysis in gastric cancer. Ann. N. Y. Acad. Sci. 2017, 1404, 27–48. [Google Scholar] [CrossRef] [PubMed]
- Lee, K.W.; Bang, S.M.; Kim, S.; Lee, H.J.; Shin, D.Y.; Koh, Y.; Lee, Y.G.; Cha, Y.; Kim, Y.J.; Kim, J.H.; et al. The incidence, risk factors and prognostic implications of venous thromboembolism in patients with gastric cancer. J. Thromb. Haemost. 2010, 8, 540–547. [Google Scholar] [CrossRef] [PubMed]
- Kovacova, E.; Kinova, S.; Duris, I.; Remkova, A. Local changes in hemostasis in patients with gastric cancer. Bratisl. Lek. Listy 2009, 110, 280–284. [Google Scholar] [PubMed]
- Kovacova, E.; Kinova, S.; Duris, I.; Remkova, D.A. General changes in hemostasis in gastric cancer. Bratisl. Lek. Listy 2009, 110, 215–221. [Google Scholar] [PubMed]
- Di Micco, P.; Romano, M.; Niglio, A.; Nozzolillo, P.; Federico, A.; Petronella, P.; Nunziata, L.; Di Micco, B.; Torella, R. Alteration of haemostasis in non-metastatic gastric cancer. Dig. Liver Dis. 2001, 33, 546–550. [Google Scholar] [CrossRef]
- Larsen, A.C.; Frøkjær, J.B.; Fisker, R.V.; Iyer, V.; Mortensen, P.B.; Yilmaz, M.K.; Møller, B.; Kristensen, S.R.; Thorlacius-Ussing, O. Treatment-related frequency of venous thrombosis in lower esophageal, gastro-esophageal and gastric cancer—A clinical prospective study of outcome and prognostic factors. Thromb. Res. 2015, 135, 802–808. [Google Scholar] [CrossRef] [PubMed]
- Lee, S.E.; Lee, J.H.; Ryu, K.W.; Nam, B.H.; Cho, S.J.; Lee, J.Y.; Kim, C.G.; Choi, I.J.; Kook, M.C.; Park, S.R.; et al. Preoperative plasma fibrinogen level is a useful predictor of adjacent organ involvement in patients with advanced gastric cancer. J. Gastric Cancer 2012, 12, 81–87. [Google Scholar] [CrossRef] [PubMed]
- Khorana, A.A.; Streiff, M.B.; Farge, D.; Mandala, M.; Debourdeau, P.; Cajfinger, F.; Marty, M.; Falanga, A.; Lyman, G.H. Venous thromboembolism prophylaxis and treatment in cancer: A consensus statement of major guidelines panels and call to action. J. Clin. Oncol. 2009, 27, 4919–4926. [Google Scholar] [CrossRef] [PubMed]
- Repetto, O.; De Re, V.; De Paoli, A.; Belluco, C.; Alessandrini, L.; Canzonieri, V.; Cannizzaro, R. Identification of protein clusters predictive of tumor response in rectal cancer patients receiving neoadjuvant chemo-radiotherapy. Oncotarget 2017, 8, 28328–28341. [Google Scholar] [CrossRef] [PubMed]
- Weisel, J.W.; Litvinov, R.I. Fibrin Formation, Structure and Properties. Subcell. Biochem. 2017, 82, 405–456. [Google Scholar] [CrossRef] [PubMed]
- Mosesson, M.W. Fibrinogen and fibrin structure and functions. J. Thromb. Haemost. 2005, 3, 1894–1904. [Google Scholar] [CrossRef] [PubMed]
- Feng, Z.; Wen, R.; Bi, R.; Duan, Y.; Yang, W.; Wu, X. Thrombocytosis and hyperfibrinogenemia are predictive factors of clinical outcomes in high-grade serous ovarian cancer patients. BMC Cancer 2016, 16, 43. [Google Scholar] [CrossRef] [PubMed]
- Li, H.; Zhao, T.; Ji, X.; Liang, S.; Wang, Z.; Yang, Y.; Yin, J.; Wang, R. Hyperfibrinogenemia predicts poor prognosis in patients with advanced biliary tract cancer. Tumour Biol. 2016, 37, 3535–3542. [Google Scholar] [CrossRef] [PubMed]
- Zhang, S.S.; Lei, Y.Y.; Cai, X.L.; Yang, H.; Xia, X.; Luo, K.J.; Su, C.H.; Zou, J.Y.; Zeng, B.; Hu, Y.; et al. Preoperative serum fibrinogen is an independent prognostic factor in operable esophageal cancer. Oncotarget 2016, 7, 25461–25469. [Google Scholar] [CrossRef] [PubMed]
- Wang, H.; Gao, J.; Bai, M.; Liu, R.; Li, H.; Deng, T.; Zhou, L.; Han, R.; Ge, S.; Huang, D.; et al. The pretreatment platelet and plasma fibrinogen level correlate with tumor progression and metastasis in patients with pancreatic cancer. Platelets 2014, 25, 382–387. [Google Scholar] [CrossRef] [PubMed]
- Wang, K.J.; Wang, R.T.; Zhang, J.Z. Identification of tumor markers using two-dimensional electrophoresis in gastric carcinoma. World J. Gastroenterol. 2004, 10, 2179–2183. [Google Scholar] [CrossRef] [PubMed]
- Dai, P.; Wang, Q.; Wang, W.; Jing, R.; Wang, W.; Wang, F.; Azadzoi, K.M.; Yang, J.H.; Yan, Z. Unraveling Molecular differences of gastric cancer by label-free quantitative proteomics analysis. Int. J. Mol. Sci. 2016, 17, E69. [Google Scholar] [CrossRef] [PubMed]
- Smith, M.; Morton, D. The Digestive System, 2nd ed.; Churchill Livingstone: London, UK, 2010; eBook ISBN 9780702048418; Paperback ISBN 9780702033674. [Google Scholar]
- Zhang, X.Y.; Zhang, P.Y.; Aboul-Soud, M.A. From inflammation to gastric cancer: Role of Helicobacter pylori. Oncol. Lett. 2017, 13, 543–548. [Google Scholar] [CrossRef] [PubMed]
- Dvorak, H.F.; Harvey, V.S.; Estrella, P.; Brown, L.F.; McDonagh, J.; Dvorak, A.M. Fibrin containing gels induce angiogenesis. Implications for tumor stroma generation and wound healing. Lab. Investig. 1987, 57, 673–686. [Google Scholar] [PubMed]
- Lawrence, S.O.; Simpson-Haidaris, P.J. Regulated de novo biosynthesis of fibrinogen in extrahepatic epithelial cells in response to inflammation. Thromb. Haemost. 2004, 92, 234–243. [Google Scholar] [CrossRef] [PubMed]
- Haidaris, P.J. Induction of fibrinogen biosynthesis and secretion from cultured pulmonary epithelial cells. Blood 1997, 89, 873–882. [Google Scholar] [PubMed]
- Molmenti, E.P.; Ziambaras, T.; Perlmutter, D.H. Evidence for an acute phase response in human intestinal epithelial cells. J. Biol. Chem. 1993, 268, 14116–14124. [Google Scholar] [PubMed]
- Stewart, D.A.; Cooper, C.R.; Sikes, R.A. Changes in extracellular matrix (ECM) and ECM-associated proteins in the metastatic progression of prostate cancer. Reprod. Biol. Endocrinol. 2004, 2, 2. [Google Scholar] [CrossRef] [PubMed] [Green Version]
- Simpson-Haidaris, P.J.; Rybarczyk, B. Tumors and fibrinogen. The role of fibrinogen as an extracellular matrix protein. Ann. N. Y. Acad. Sci. 2001, 936, 406–425. [Google Scholar] [CrossRef] [PubMed]
- Palumbo, J.S.; Kombrinck, K.W.; Drew, A.F.; Grimes, T.S.; Kiser, J.H.; Degen, J.L.; Bugge, T.H. Fibrinogen is an important determinant of the metastatic potential of circulating tumor cells. Blood 2000, 96, 3302–3309. [Google Scholar] [PubMed]
- Biggerstaff, J.P.; Seth, N.; Amirkhosravi, A.; Amaya, M.; Fogarty, S.; Meyer, T.V.; Siddiqui, F.; Francis, J.L. Soluble fibrin augments platelet/tumor cell adherence in vitro and in vivo, and enhances experimental metastasis. Clin. Exp. Metastasis 1999, 17, 723–730. [Google Scholar] [CrossRef] [PubMed]
- Sahni, A.; Odrljin, T.; Francis, C.W. Binding of basic fibroblast growth factor to fibrinogen and fibrin. J. Biol. Chem. 1998, 273, 7554–7559. [Google Scholar] [CrossRef] [PubMed]
- Wojtukiewicz, M.Z.; Sierko, E.; Zacharski, L.R.; Zimnoch, L.; Kudryk, B.; Kisiel, W. Tissue factor-dependent coagulation activation and impaired fibrinolysis in situ in gastric cancer. Semin. Thromb. Hemost. 2003, 29, 291–300. [Google Scholar] [CrossRef] [PubMed]
- Lou, X.; Sun, J.; Gong, S.; Yu, X.; Gong, R.; Den, H. Interaction between circulating cancer cells and platelets: Clinical implication. Chin. J. Cancer Res. 2015, 27, 450–460. [Google Scholar] [CrossRef] [PubMed]
- Jurasz, P.; Alonso-Escolano, D.; Radomski, M.W. Platelet-cancer interactions: Mechanisms and pharmacology of tumour cell-induced platelet aggregation. Br. J. Pharmacol. 2004, 143, 819–826. [Google Scholar] [CrossRef] [PubMed]
- Perisanidis, C.; Psyrri, A.; Cohen, E.E.; Engelmann, J.; Heinze, G.; Perisanidis, B.; Stift, A.; Filipits, M.; Kornek, G.; Nkenke, E. Prognostic role of pretreatment plasma fibrinogen in patients with solid tumors: A systematic review and meta-analysis. Cancer Treat. Rev. 2015, 41, 960–970. [Google Scholar] [CrossRef] [PubMed]
- Arigami, T.; Uenosono, Y.; Ishigami, S.; Okubo, K.; Kijima, T.; Yanagita, S.; Okumura, H.; Uchikado, Y.; Kijima, Y.; Nakajo, A.; et al. A novel scoring system based on fibrinogen and the neutrophil-lymphocyte ratio as a predictor of chemotherapy response and prognosis in patients with advanced gastric cancer. Oncology 2016, 90, 186–192. [Google Scholar] [CrossRef] [PubMed]
- Arigami, T.; Uenosono, Y.; Matsushita, D.; Yanagita, S.; Uchikado, Y.; Kita, Y.; Mori, S.; Kijima, Y.; Okumura, H.; Maemura, K.; et al. Combined fibrinogen concentration and neutrophil-lymphocyte ratio as a prognostic marker of gastric cancer. Oncol. Lett. 2016, 11, 1537–1544. [Google Scholar] [CrossRef] [PubMed]
- Palaj, J.; Kečkéš, Š.; Marek, V.; Dyttert, D.; Waczulíková, I.; Durdík, Š. Fibrinogen levels are associated with lymph node involvement and overall survival in gastric cancer patients. Anticancer Res. 2018, 38, 1097–1104. [Google Scholar] [CrossRef] [PubMed]
- Suzuki, T.; Shimada, H.; Nanami, T.; Oshima, Y.; Yajima, S.; Ito, M.; Washizawa, N.; Kaneko, H. Hyperfibrinogenemia is associated with inflammatory mediators and poor prognosis in patients with gastric cancer. Surg. Today 2016, 46, 1394–1401. [Google Scholar] [CrossRef] [PubMed]
- Wu, C.; Luo, Z.; Tang, D.; Liu, L.; Yao, D.; Zhu, L.; Wang, Z. Identification of carboxyl terminal peptide of fibrinogen as a potential serum biomarker for gastric cancer. Tumour Biol. 2016, 37, 6963–6970. [Google Scholar] [CrossRef] [PubMed]
- Yamashita, H.; Kitayama, J.; Kanno, N.; Yatomi, Y.; Nagawa, H. Hyperfibrinogenemia is associated with lymphatic as well as hematogenous metastasis and worse clinical outcome in T2 gastric cancer. BMC Cancer 2006, 6, 147. [Google Scholar] [CrossRef] [PubMed]
- Yu, W.; Wang, Y.; Shen, B. An elevated preoperative plasma fibrinogen level is associated with poor overall survival in Chinese gastric cancer patients. Cancer Epidemiol. 2016, 42, 39–45. [Google Scholar] [CrossRef] [PubMed]
- Yu, X.; Hu, F.; Yao, Q.; Li, C.; Zhang, H.; Xue, Y. Serum fibrinogen levels are positively correlated with advanced tumor stage and poor survival in patients with gastric cancer undergoing gastrectomy: A large cohort retrospective study. BMC Cancer 2016, 16, 480. [Google Scholar] [CrossRef] [PubMed]
- Yamashita, H.; Kitayam, J.; Nagawa, H. Hyperfibrinogenemia is a useful predictor for lymphatic metastasis in human gastric cancer. Jpn. J. Clin. Oncol. 2005, 35, 595–600. [Google Scholar] [CrossRef] [PubMed]
- Caine, G.J.; Stonelake, P.S.; Lip, G.Y.; Kehoe, S.T. The hypercoagulable state of malignancy: Pathogenesis and current debate. Neoplasia 2002, 4, 465–473. [Google Scholar] [CrossRef] [PubMed]
- Altiay, G.; Ciftci, A.; Demir, M.; Kocak, Z.; Sut, N.; Tabakoglu, E.; Hatipoglu, O.N.; Caglar, T. High plasma D-dimer level is associated with decreased survival in patients with lung cancer. Clin. Oncol. 2007, 19, 494–498. [Google Scholar] [CrossRef] [PubMed]
- Buller, H.R.; van Doormaal, F.F.; van Sluis, G.L.; Kamphuisen, P.W. Cancer and thrombosis: From molecular mechanisms to clinical presentations. J. Thromb. Haemost. 2007, 5, 246–254. [Google Scholar] [CrossRef] [PubMed]
- Buccheri, G.; Torchio, P.; Ferrigno, D. Plasma levels of D-dimer in lung carcinoma: Clinical and prognostic significance. Cancer 2003, 97, 3044–3052. [Google Scholar] [CrossRef] [PubMed]
- Dupuy, E.; Hainaud, P.; Villemain, A.; Bodevin-Phèdre, E.; Brouland, J.P.; Briand, P.; Tobelem, G.J. Tumoral angiogenesis and tissue factor expression during hepatocellular carcinoma progression in a transgenic mouse model. J. Hepatol. 2003, 38, 793–802. [Google Scholar] [CrossRef]
- Coussens, L.M.; Werb, Z. Inflammation and cancer. Nature 2002, 420, 860–867. [Google Scholar] [CrossRef] [PubMed]
- Menter, D.G.; Kopetz, S.; Hawk, E.; Sood, A.K.; Loree, J.M.; Gresele, P.; Honn, K.V. Platelet “first responders” in wound response, cancer, and metastasis. Cancer Metastasis Rev. 2017, 36, 199–213. [Google Scholar] [CrossRef] [PubMed]
- Kanda, M.; Tanaka, C.; Kobayashi, D.; Mizuno, A.; Tanaka, Y.; Takami, H.; Iwata, N.; Hayashi, M.; Niwa, Y.; Yamada, S.; et al. Proposal of the Coagulation Score as a Predictor for Short-Term and Long-Term Outcomes of Patients with Resectable Gastric Cancer. Ann. Surg. Oncol. 2017, 24, 502–509. [Google Scholar] [CrossRef] [PubMed]
- Tas, F.; Ciftci, R.; Kilic, L.; Serilmez, M.; Karabulut, S.; Duranyildiz, D. Clinical and prognostic significance of coagulation assays in gastric cancer. J. Gastrointest. Cancer 2013, 44, 285–292. [Google Scholar] [CrossRef] [PubMed]
- Brierley, D.; Gospodarowicz, M.K.; Wittekind, C. Classification of Malignant Tumours, 8th ed.; Wiley Blackwell: Hoboken, NJ, USA, 2016; pp. 63–66. ISBN 978-1-119-26357-9. [Google Scholar]
- Repetto, O.; Zanussi, S.; Casarotto, M.; Canzonieri, V.; De Paoli, P.; Cannizzaro, R.; De Re, V. Differential proteomics of Helicobacter pylori associated with autoimmune atrophic gastritis. Mol. Med. 2014, 20, 57–71. [Google Scholar] [CrossRef] [PubMed]
- Zhao, L.M.; Zheng, Z.X.; Zhao, X.; Shi, J.; Bi, J.J.; Pei, W.; Feng, Q. Optimization of reference genes for normalization of the quantitative polymerase chain reaction in tissue samples of gastric cancer. Asian Pac. J. Cancer Prev. 2014, 15, 5815–5818. [Google Scholar] [CrossRef] [PubMed]
- Huang, H.; Arighi, C.N.; Ross, K.E.; Ren, J.; Li, G.; Chen, S.C.; Wang, Q.; Cowart, J.; Vijay-Shanker, K.; Wu, C.H. iPTMnet: An integrated resource for protein post-translational modification network discovery. Nucleic Acids Res. 2017, 56, D542–D550. [Google Scholar] [CrossRef] [PubMed]


| Characteristic | uT1–T2 | uT3–T4 | p-Value |
|---|---|---|---|
| Gender | n.s. | ||
| Male | 4 | 9 | |
| Female | 5 | 10 | |
| Age, years | n.s. | ||
| <50 | 3 | 4 | |
| >50 | 6 | 15 | |
| Histological type | n.s. | ||
| Intestinal | 4 | 4 | |
| Diffuse | 4 | 13 | |
| Other | 1 | 2 | |
| Location | n.s. | ||
| Corpus | 4 | 14 | |
| Antrum | 4 | 4 | |
| Cardias | 1 | 1 |
| Parameter | Mean (±SD) |
|---|---|
| WBC (×109/L) | 6.33 ± 1.96 |
| ANC(×109/L) | 3.93 ± 1.54 |
| ALC (×109/L) | 1.83 ± 0.74 |
| N/R | 2.54 ± 1.71 |
| PLT (×109/L) | 258 ± 114.90 |
| PT-INR | 1.00 ± 0.05 |
| FIB g/L | 2.97 ± 46 |
| APTTs | 29 ± 3 |
| Comparison Groups | Spots | |||||||||||||
|---|---|---|---|---|---|---|---|---|---|---|---|---|---|---|
| 383 | 397 | 398 | 400 | 393 | 396 | 402 | 403 | 404 | 405 | 501 | 526 | 548 | ||
| • | N “Group II” versus N “Group I” | 1 | −1.6 | −1.3 | −1.0 | 1.1 | 1.1 | 1.5 | 1.2 | −1.0 | 1.1 | 1.1 | 1.0 | 1.4 |
| • | T “Group I” versus N “Group I” | −1.3 | −1.5 | −1.5 | −1.1 | 1.5 | 1.5 | 2.0 | 1.3 | 1.8 | 1.6 | 1.6 | 1.5 | 1.6 |
| • | T “Group II” versus N “Group II” | −1.3 | −1.2 | −1.2 | −1.3 | 1.5 | 1.2 | 3.2 | 1.1 | 2.8 | 1.8 | 1.22 | 1.82 | 1.75 |
| Groups | Spots | |||||||||||||
|---|---|---|---|---|---|---|---|---|---|---|---|---|---|---|
| 383 | 397 | 398 | 400 | 393 | 396 | 402 | 403 | 404 | 405 | 501 | 526 | 548 | ||
| • | “Tumor staging” Group II (nr = 19) versus Group I (nr = 9) | −1.3 | 1.0 | −1.2 | −1.3 | 1.4 | 1.2 | 3.2 | 1.1 | 2.8 | 1.8 | 1.2 | 1.8 | 1.8 |
| • | “Anatomical subsites” Antrum (nr = 8) versus. corpus (nr = 18) | −1.0 | −1.9 | −2.0 | 1.4 | 1.7 | 1.7 | 3.4 | 1.9 | 2.8 | 2.3 | 1.9 | −1.5 | −1.7 |
| • | “Histological subtypes” Diffuse (nr = 18) versus intestinal (nr = 7) | −1.1 | 1.0 | −1.3 | −1.3 | −1.3 | −1.1 | −2.1 | 1.0 | −2 | −1.7 | 3.0 | 1.3 | −1.1 |
| • | “Age” >50 years (nr = 19) versus <50 years (nr = 7) | 1.1 | 1.4 | 1.2 | 1.1 | 1.1 | −1.1 | 3.6 | −1.0 | 1.8 | 2.0 | −1.1 | 1.1 | 1.2 |
| • | “Sex” Female (nr = 15) versus male (nr = 13) | 1.3 | 2.0 | 1.8 | 1.3 | −1.0 | 1.0 | −1.0 | −1.1 | 1.2 | 1.1 | −2 | −1.3 | 1.0 |
© 2018 by the authors. Licensee MDPI, Basel, Switzerland. This article is an open access article distributed under the terms and conditions of the Creative Commons Attribution (CC BY) license (http://creativecommons.org/licenses/by/4.0/).
Share and Cite
Repetto, O.; Maiero, S.; Magris, R.; Miolo, G.; Cozzi, M.R.; Steffan, A.; Canzonieri, V.; Cannizzaro, R.; De Re, V. Quantitative Proteomic Approach Targeted to Fibrinogen β Chain in Tissue Gastric Carcinoma. Int. J. Mol. Sci. 2018, 19, 759. https://doi.org/10.3390/ijms19030759
Repetto O, Maiero S, Magris R, Miolo G, Cozzi MR, Steffan A, Canzonieri V, Cannizzaro R, De Re V. Quantitative Proteomic Approach Targeted to Fibrinogen β Chain in Tissue Gastric Carcinoma. International Journal of Molecular Sciences. 2018; 19(3):759. https://doi.org/10.3390/ijms19030759
Chicago/Turabian StyleRepetto, Ombretta, Stefania Maiero, Raffaella Magris, Gianmaria Miolo, Maria Rita Cozzi, Agostino Steffan, Vincenzo Canzonieri, Renato Cannizzaro, and Valli De Re. 2018. "Quantitative Proteomic Approach Targeted to Fibrinogen β Chain in Tissue Gastric Carcinoma" International Journal of Molecular Sciences 19, no. 3: 759. https://doi.org/10.3390/ijms19030759