Article

Different Natural Selection Pressures on the atpF Gene in Evergreen Sclerophyllous and Deciduous Oak Species: Evidence from Comparative Analysis of the Complete Chloroplast Genome of Quercus aquifolioides with Other Oak Species

College of Forestry, Beijing Forestry University, Beijing 100083, China
*
Author to whom correspondence should be addressed.
Int. J. Mol. Sci. 2018, 19(4), 1042; https://doi.org/10.3390/ijms19041042
Submission received: 23 February 2018 / Revised: 26 March 2018 / Accepted: 27 March 2018 / Published: 30 March 2018
(This article belongs to the Special Issue Chloroplast)

Abstract

:
Quercus is an economically important and phylogenetically complex genus in the family Fagaceae. Due to extensive hybridization and introgression, it is considered to be one of the most challenging plant taxa, both taxonomically and phylogenetically. Quercus aquifolioides is an evergreen sclerophyllous oak species that is endemic to, but widely distributed across, the Hengduanshan Biodiversity Hotspot in the Eastern Himalayas. Here, we compared the fully assembled chloroplast (cp) genome of Q. aquifolioides with those of three closely related species. The analysis revealed a cp genome ranging in size from 160,415 to 161,304 bp and with a typical quadripartite structure, composed of two inverted repeats (IRs) separated by a small single copy (SSC) and a large single copy (LSC) region. The genome organization, gene number, gene order, and GC content of these four Quercus cp genomes are similar to those of many angiosperm cp genomes. We also analyzed the Q. aquifolioides repeats and microsatellites. Investigating the effects of selection events on shared protein-coding genes using the Ka/Ks ratio showed that significant positive selection had acted on the atpF gene of Q. aquifolioides compared to two deciduous oak species, and that there had been significant purifying selection on the atpF gene in the chloroplast of evergreen sclerophyllous oak trees. In addition, site-specific selection analysis identified positively selected sites in 12 genes. Phylogenetic analysis based on shared protein-coding genes from 14 species defined Q. aquifolioides as belonging to sect. Heterobalanus and being closely related to Q. rubra and Q. aliena. Our findings provide valuable genetic information for use in accurately identifying species, resolving taxonomy, and reconstructing the phylogeny of the genus Quercus.

1. Introduction

The chloroplast (cp) is an organelle which plays an important role in photosynthesis and carbon fixation in plant cells. In angiosperms, the cp is a uniparentally inherited organelle, and it has its own circular, haploid, evolutionarily conserved genome. The cp genome is therefore considered to be a useful and informative genetic resource for studies on evolutionary relationships in the plant kingdom at various taxonomic levels [1]. In most cases, the cp genome is between 120 and 160 kb in size and has a structure composed of two copies of a large inverted repeat (IR) region, a large single copy (LSC) region, and a small single copy (SSC) region [2].
Oaks (Quercus L.), which comprise approximately 500 shrub and tree species, form a phylogenetically complex and economically important genus of the beech family, Fagaceae [3]. Distributed throughout much of the Northern Hemisphere, oaks are located in the northern temperate region, and they also occur in the Andes of South America and subtropical and tropical Asia [4]. Oaks are dominant in various habitats, such as temperate deciduous forest, oak-pine forest and temperate and subtropical evergreen forest [5]. They are intimately associated with many other organisms, including fungi, ferns, birds, mammals, and insects [4]. For this reason, their interactions have been the subject of a large number of ecological studies. Human beings have a close connection with oak, as throughout history it has been a common symbol of strength and courage and has been chosen as the national tree in many countries. Moreover, oaks are of great economic value, being used in, for example, the construction of fine furniture and the wine industry.
Oak species are notoriously difficult to classify taxonomically, due to morphological variation caused in part by hybridization [6,7,8,9,10,11,12,13,14]. Some studies stated that Quercus contained two subgenera, Cyclobalanopsis and Quercus, the latter including three sections: Quercus (white oaks), Lobatae (red oaks), and Protobalanus (golden cup or intermediate oaks) [3,15]. Because previous classifications of oaks have been based solely on morphological characters which are often homoplastic in oaks, these classifications have always been subject to debate [3,15]. With advances in molecular phylogenetics and techniques based on pollen morphology, views on oak classification are changing [15,16,17,18,19]. Recently, Denk et al. proposed an updated classification for Quercus with two subgenera: subgenus Quercus, the ‘New World clade’ or ‘high-latitude clade’, and subgenus Cerris, the exclusively Eurasian ‘Old World clade’ or ‘mid-latitude clade’ [19]. There are five sections (Protobalanus, Ponticae, Virentes, Quercus, and Lobatae) in subgenus Quercus and three sections (Cyclobalanopsis, Ilex and Cerris) in subgenus Cerris.
China, which is a center of Quercus diversity, has 35–51 species [20]. Based on morphological characters, including 25 qualitative and 18 quantitative characters, oaks in China were divided into five sections, namely Aegilops, Quercus, Brachylepides, Engleriana, and Echinolepides. Recently, we studied the phylogeography of Quercus aquifolioides, which is endemic to the Hengduanshan Biodiversity Hotspot, based on 58 populations distributed throughout the species range, using four chloroplast DNA fragments and 11 nuclear microsatellite loci [21]. Up till now, to our knowledge, very few studies have focused on the phylogenetic relationships and population genetics of oaks in China [22], in part due to the challenges arising from introgressive hybridization, lineage sorting, and molecular markers failing to give sufficient phylogenetic signals.
In this study, we produced the first cp genome sequence for Q. aquifolioides using next-generation sequencing technology. This complete cp genome, combined with previously reported cp genome sequences for other members of the genus, will enhance our understanding of the systematic evolution of Quercus. We analyzed the completely assembled cp genome of Q. aquifolioides and compared it to those of three other oak species to investigate common structural patterns and hotspot regions of sequence divergence in these four Quercus cp genomes, examined whether selection pressure had acted on protein coding genes, and reconstructed the phylogenetic relationships of the four Quercus species. Our findings will not only enrich the complete cp genome resources available for the genus Quercus but also provide abundant genetic information for use in subsequent taxonomic and phylogenetic identification of members of the genus, and assist geneticists and breeders in improving commercially-grown oak trees.

2. Results and Discussion

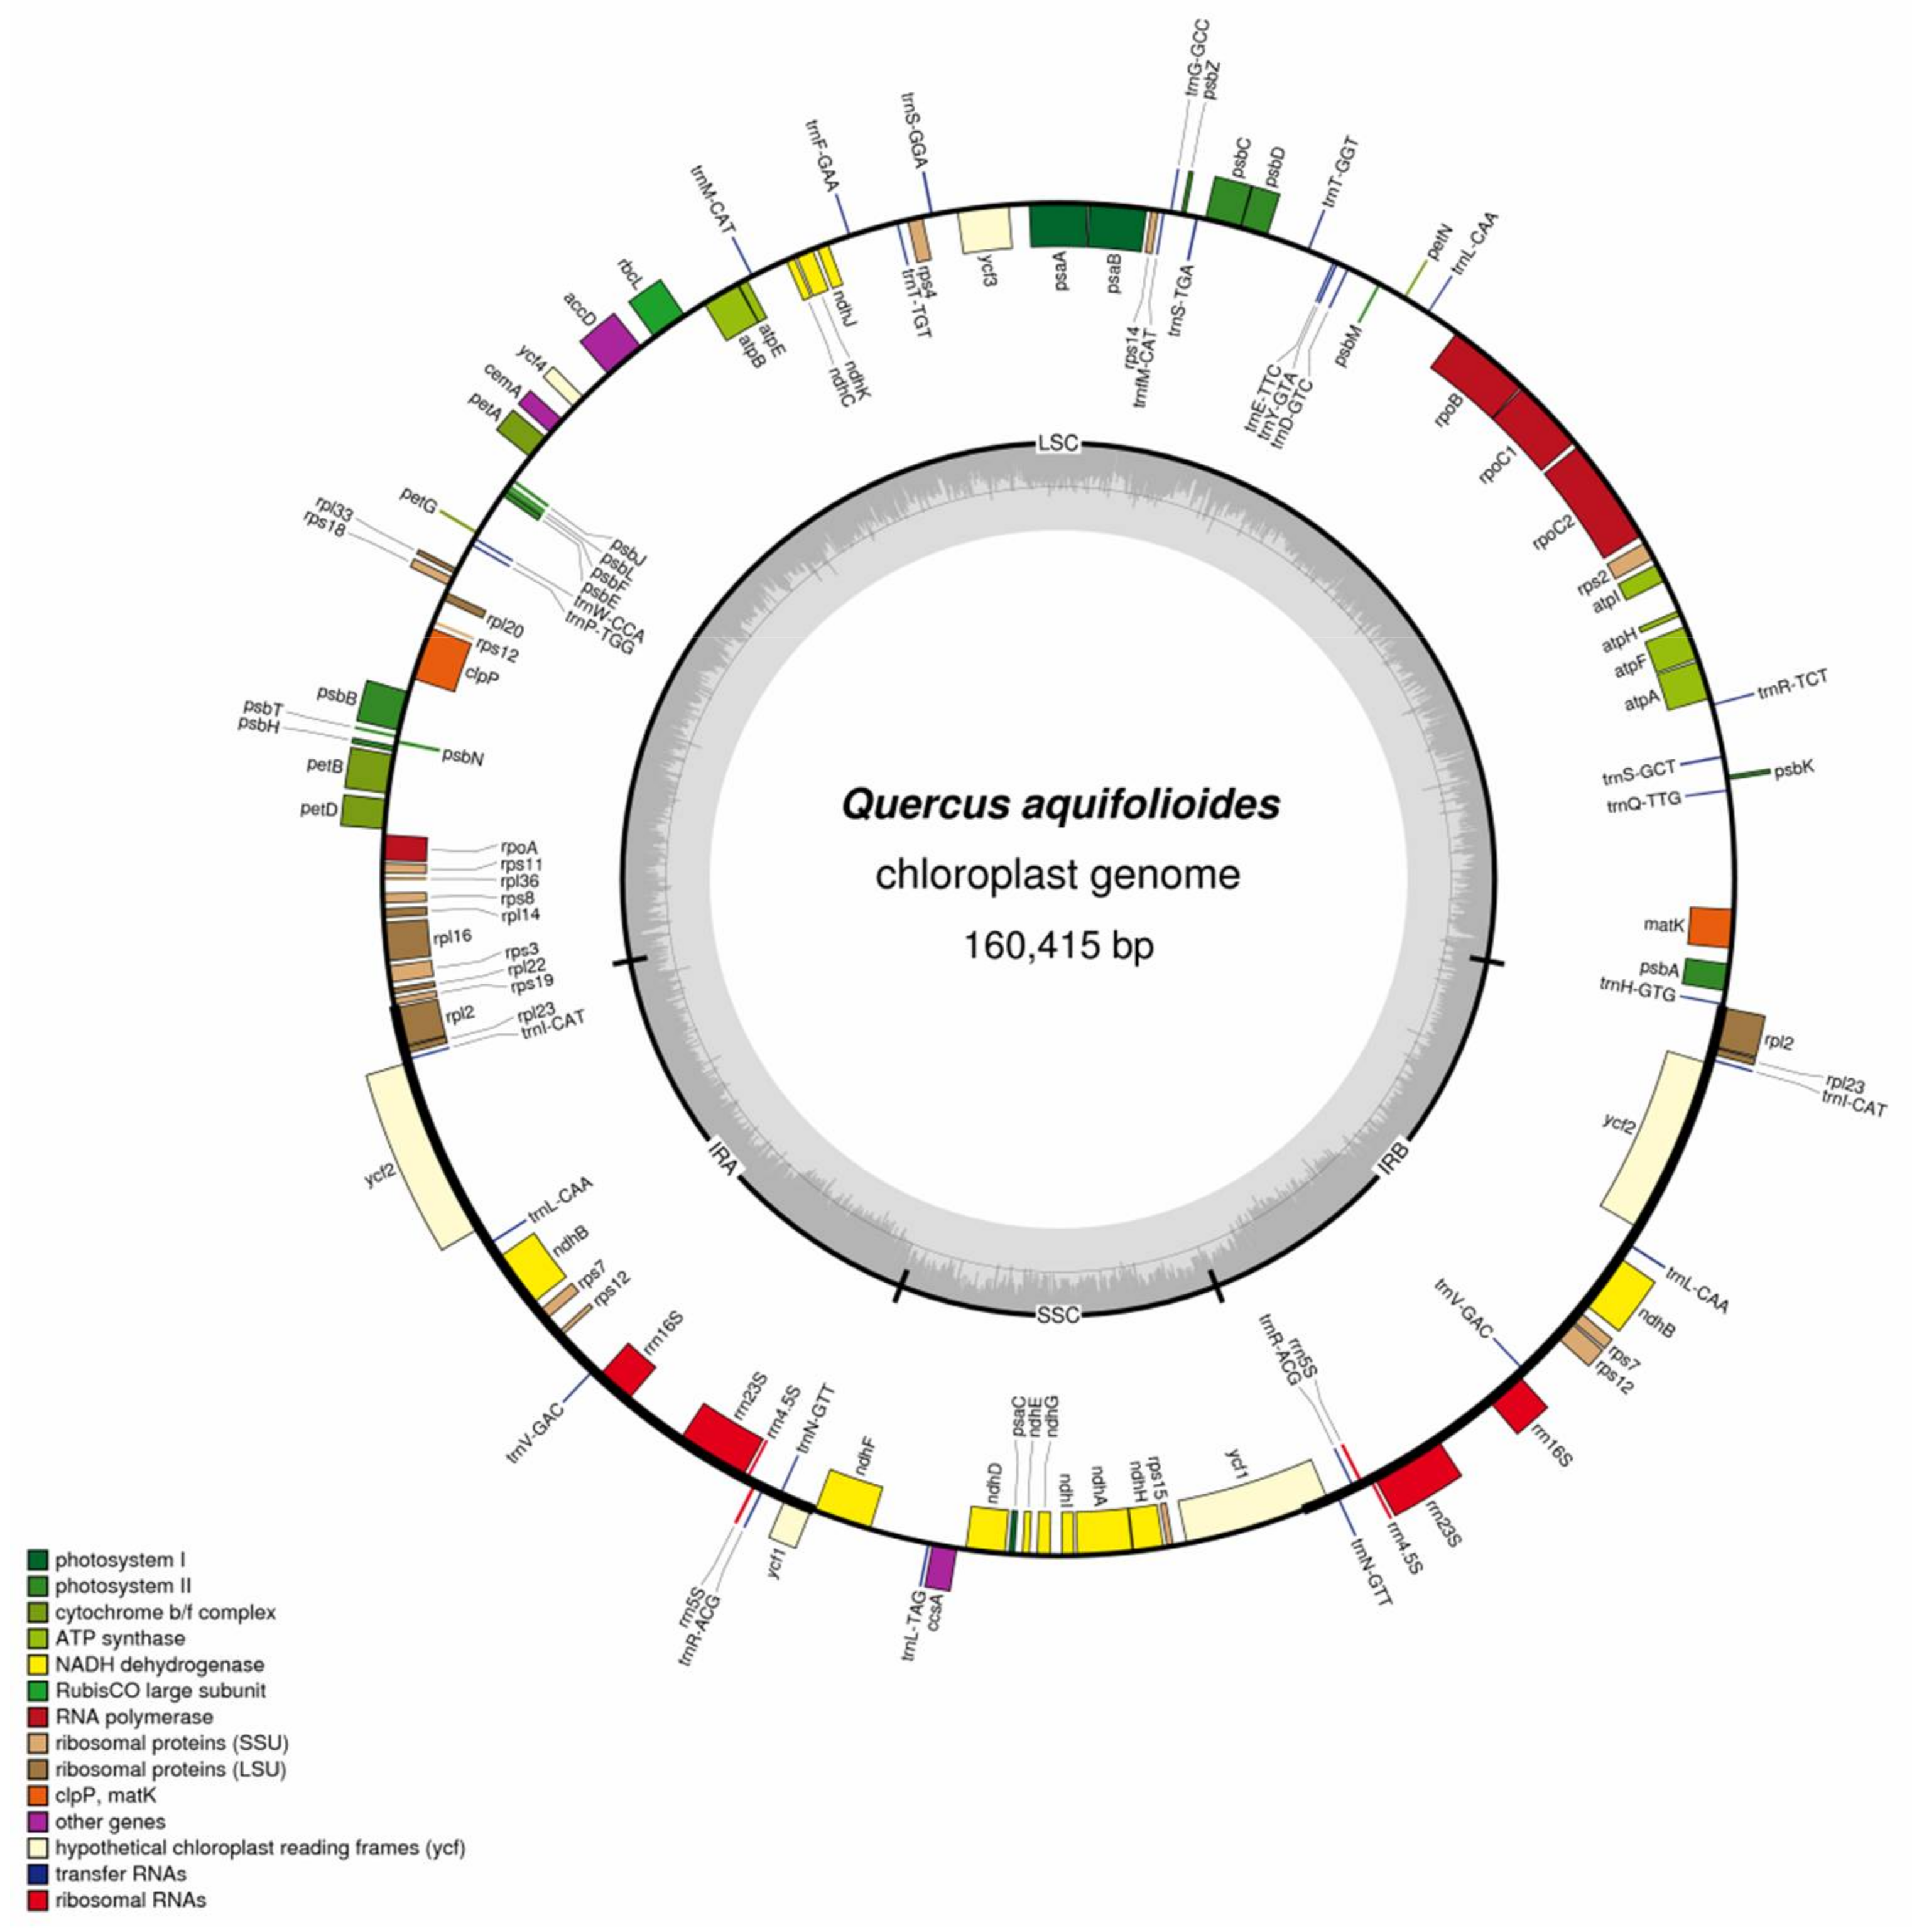
2.1. Chloroplast Genome Organization in Q. aquifolioides

The Q. aquifolioides cp genome is a typical circular double-stranded DNA molecule with a length of 160,415 bp, which falls within the normal angiosperm length range [23,24]. The cp genome has the usual quadripartite structure, featuring a LSC region (large single copy region, 89,493 bp), a SSC region (small single copy region, 16,594 bp), and a pair of IRs (inverted repeats, 25,857 bp) (Figure 1; GenBank accession No. KP340971). The GC contents of the LSC, SSC, and IR regions individually, and of the cp genome as a whole, are 34.8%, 31.2%, 42.7%, and 36.9%, respectively. These GC contents are within the range previously reported for other plant species. Approximately 48.0% of the cp genome encodes proteins, 5.6% encodes rRNAs and 1.3% encodes tRNAs. Noncoding regions (intergenic regions, introns and pseudogenes) constitute the remaining 45.1% of the genome. The Q. aquifolioides cp genome encodes 127 genes: 80 protein-coding genes, eight ribosomal RNA genes, and 39 tRNA genes. ycf2 is the largest gene, having a length of 6834 bp. We found that 18 genes have one intron (10 protein coding genes and 8 tRNA genes) and two genes (clpP and ycf3) have two introns each. Two identical rRNA gene clusters (16S-23S-4.5S-5S) were found in the IR regions. There are two tRNA genes, trnI and trnA, in the 16S~23S spacer region of each cluster. The sequence of the rRNA coding region is highly conserved: sequence identities of four rRNA genes with those of Arabidopsis thaliana (L.) Heynh were over 98%.

2.2. Repeat Sequence Analysis and Simple Sequence Repeats (SSR)

Repeat sequences have been used extensively for phylogeny, population genetics, genetic mapping, and forensic studies [25]. In the cp genome of Q. aquifolioides, 38 pairs of repeats longer than 30 bp were detected; they consisted of 24 palindromic repeats and 14 forward repeats (Figure 2). Among these repeats, 36 are 30–40 bp long, one is 44 bp long, and one is 64 bp long (Figure 2). A large proportion of the repeats (73.7%) are present in non-coding regions, but some repeats are embedded in coding regions, such as the trnS-GCU, trnS-GGA, psaB, psaA, ycf1, ycf2, and accD genes (Table S1). As previous studies reported, many repeats were found in the ycf2 gene [26,27,28,29]. Apart from the IR region, the longest repeats, which were 64 bp in length, were present in the ndhD/psaC intergenic region.
SSR, also known as microsatellites, are highly polymorphic and thus widely used as molecular markers. A total of 78 perfect microsatellites were identified in the Q. aquifolioides cp genome. Among them, 70.51% were present in the LSC regions, whereas 10.26% and 19.23% were identified in the IR and SSC regions respectively (Figure 3A). This result is consistent with previous reports that SSRs are not evenly distributed in cp genomes [30]. Twelve of the SSRs were present in protein-coding regions, six were in introns, and 60 were located in intergenic spacers of the Q. aquifolioides cp genome (Figure 3B). Of the motifs forming these SSRs, 58 are mononucleotides, six are dinucleotides, five are trinucleotides, six are tetranucleotides, and three are pentanucleotides (Figure 3C). Most of the mononucleotides (98.28%) and dinucleotides (100%) are composed of A and T. (Figure 3C). These results are consistent with previous reports that SSRs in cp genomes generally consist of short polyA or polyT repeats [31]. The high AT content of cp SSRs contributes to the AT richness of the Q. aquifolioides cp genome, which is similar in this respect to other cp genomes [31].

2.3. Comparison of the cp Genomes of Q. aquifolioides and Three Related Quercus Species

Three complete cp genomes, those of Q. aliena (GenBank accession number: KP301144), Q. rubra (GenBank accession number: JX970937), and Q. spinosa (GenBank accession number: KM841421), belonging to three different sections within the Quercus genus, were selected for comparison with Q. aquifolioides (Table 1). Q. rubra has the largest cp genome; this is mostly attributable to variations in the lengths of the LSC and SSC regions. The GC content of these four cp genomes is very similar, at ~37%. Q. aquifolioides has the same number of protein coding genes and rRNA genes as the other three Quercus species. Although Q. spinosa has one tRNA fewer than the other three Quercus species, the total length of its tRNA genes is greater than that in any of the other three species. We found that Q. aquifolioides shared 80 protein-coding genes with the cp genomes of all three of the other Quercus species.
We compared the other three complete cp genomes with that of Q. aquifolioides (Figure 4). The sequence identity between these four Quercus cp genomes was analyzed. Our results revealed perfect conservation of gene order along the cp genomes of the four species and very high similarity between them.
Although the overall quadripartite structure, including the gene number and order, is usually well conserved, the IR region often undergoes expansion or contraction, a phenomenon called ebb and flow in cp genomes [32]. Generally, the expansion or contraction involves no more than a few hundred nucleotides. Kim and Lee proposed that length variation in angiosperm cp genomes was primarily caused by expansion and contraction of the IR region and the single-copy (SC) boundary regions [33]. The IR/SC boundary regions of these four complete Quercus cp genomes were compared, and found to exhibit clear differences in junction positions (Figure 5). The inverted repeat b (IRb)/SSC borders are located in the coding region of the ycf1 gene with a region of 4590–4611 bp located in the SSC regions. The shortened ycf1 gene crossed the inverted repeat a (IRa)/SSC borders, with 25–28 bp falling within the SSC regions, and the ndhF gene was located in the SSC region with its distance to the IRa/SSC borders ranging from 8 to 22 bp. At the LSC/IRa junction, the distances between rps19 and the border ranged from 12 to 35 bp, while the distances between rpl2 and the border were from 39 to 63 bp. At the LSC/IRb junction, the distances between rpl2 and the border ranged from 54 to 226 bp and the distances between trnH and the border were the same, at 16 bp. Thus, variations at the IR/SC borders in these four cp genomes contribute to the differences in length of the cp genome sequence as a whole.
The whole-genome alignment revealed high sequence similarity across these four cp genomes, suggesting that Quercus cp genomes are well conserved (Figure 6). As observed in other angiosperms [34,35,36], we also found that among these four cp genomes the SC regions are more divergent than the IR regions, possibly due to error correction occurring via gene conversion between IRs [37]. Our results also showed that coding regions are more conserved than non-coding regions, as seen in other plants [38,39]. The most divergent coding region in these four Quercus cp genomes was rpl22. Non-coding regions showed various degrees of sequence divergence among these four Quercus cp genomes, with the trnH-GUG/psbA regions having the highest level of divergence. These hotspot regions furnish valuable information as a basis for developing molecular markers for phylogenetic studies and identification of Quercus species.

2.4. Genome Sequence Divergence among Quercus Species

To investigate the extent of sequence divergence among these four Quercus cp genomes, the nucleotide variability (Pi) values within 600 bp windows (200 bp stepwise moving) in the LSC, SSC, and IR regions of the genomes were calculated (Figure 7). In the LSC region, the values varied from 0 to 0.02389 with a mean of 0.00603, while the SSC regions were from 0 to 0.02 with a mean of 0.00863, and the IR regions were from 0 to 0.00417, with a mean of 0.00098. These results suggest that the differences between these genomic regions are very small. However, we also found certain highly variable regions in the LSC, SSC, and IRs. In the LSC, the highly variable regions were trnH/psbA and petA/psbJ, with Pi > 0.02. In the SSC, highly variable regions included ndhF/rpl32, ndhA/ndhH and ycf1 (Pi > 0.015). In the IRs, two regions, trnR/trnN and ndhB, with Pi > 0.004 were identified (Figure 8). Four of these regions, trnH/psbA, petA/psbJ, ndhF/rpl32, and ycf1, have also been identified as highly variable in other plants [33,40,41,42]. On the basis of our results, five of these variable regions (trnH/psbA, petA/psbJ, ndhF/rpl32, ndhA/ndhH, and ycf1) show great potential as sources of useful phylogenetic markers for Quercus.

2.5. Selection Events in Protein Coding Genes

The non-synonymous (Ka) to synonymous (Ks) nucleotide substitution rate ratio (denoted by Ka/Ks) is a very important tool used in studying in protein coding gene evolution. The Ka/Ks ratio is used to evaluate the rate of gene divergence and determine whether positive, purifying or neutral selection has been in operation. A Ka/Ks ratio of >1 indicates positive selection, while Ka/Ks < 1 (especially if it is less than 0.5) indicates purifying selection. A value of close to 1 indicates neutral selection [43].
In this study, we compared Ka/Ks ratios for 73 shared unique protein coding genes in the Q. aquifolioides cp genome and the cp genomes of three other related Quercus species: Q. rubra, Q. spinosa, and Q. aliena (Table S2). The results are shown in Figure 8. Interestingly, we found that the Ka/Ks ratios were both region specific and gene specific. The average Ka/Ks ratio of the 73 protein coding genes analyzed across the four cp genomes was 0.1653. The most conserved genes with average Ka/Ks values of 0, suggesting very strong purifying selective pressure, were rpl23, rps7, psaC, rps12, psbA, psbK, psbI, atpH, atpI, rps2, petN, psbM, psbD, rps14, ycf3, ndhJ, ndhK, ndhC, psbJ, psbL, psbF, psbE, petL, rpl33, clpP, psbT, psbN, psbH, rpl36, rps8, rpl14, rpl16, and rps19 (Table S2). The averaging Ka/Ks method showed no gene with Ka/Ks > 1, which suggests that no gene had been under positive selection in the Q. aquifolioides cp genome. Average Ka/Ks value within the range 0.5 to 1, indicating relaxed selection, were observed for accD, petA, rpl20, rpl22, ycf2, ndhF, ccsA, matK, atpF, and rpoC2. The remaining genes showed average Ka/Ks values of between 0 and 0.49, which suggested that most genes in the Q. aquifolioides cp genome were under purifying selection.
Although no genes were observed with average Ka/Ks > 1, there were four genes (ycf2, matK, atpF, and rpl20) with Ka/Ks > 1 in at least one pairwise comparison (Figure 8). Of these, only atpF had Ka/Ks > 1 in two pairwise comparisons. More interestingly, the Ka/Ks ratio for the atpF gene was more than 1 in the comparisons with the two deciduous Quercus species. In contrast, the Ka/Ks ratio for this gene was 0 in the comparison between Q. aquifolioides and Q. spinosa, which are both evergreen sclerophyllous oak trees. Deciduous oak trees completely lose their foliage during the winter or the dry season, usually as an adaptation to cold and/or drought, whereas evergreen sclerophyllous oak trees retain their leaves throughout of the year. For leaves to tolerate cold and drought stresses requires energy. The atpF gene encodes one of the subunits of the H+-ATP synthase, which is essential for electron transport and photophosphorylation during photosynthesis [44]. This finding suggests that differential selection acting on the atpF gene may indicate that it has played a role in deciduous-evergreen oak tree divergence.
Alongside the Ka/Ks analysis, we also investigated site-specific selection events. We found a total of 12 genes exhibiting site-specific selection (Table 2). Of these, rpoC2 was found to have 26 sites under positive selection. This gene encodes one of the four subunits of RNA polymerase type I (plastid-encoded polymerase, PEP), which is a key enzyme required for transcription of photosynthesis-related genes in the chloroplast [45]. Our identification of the positively-selected sites in this analysis could lead to a better understanding of the evolution of Quercus species.

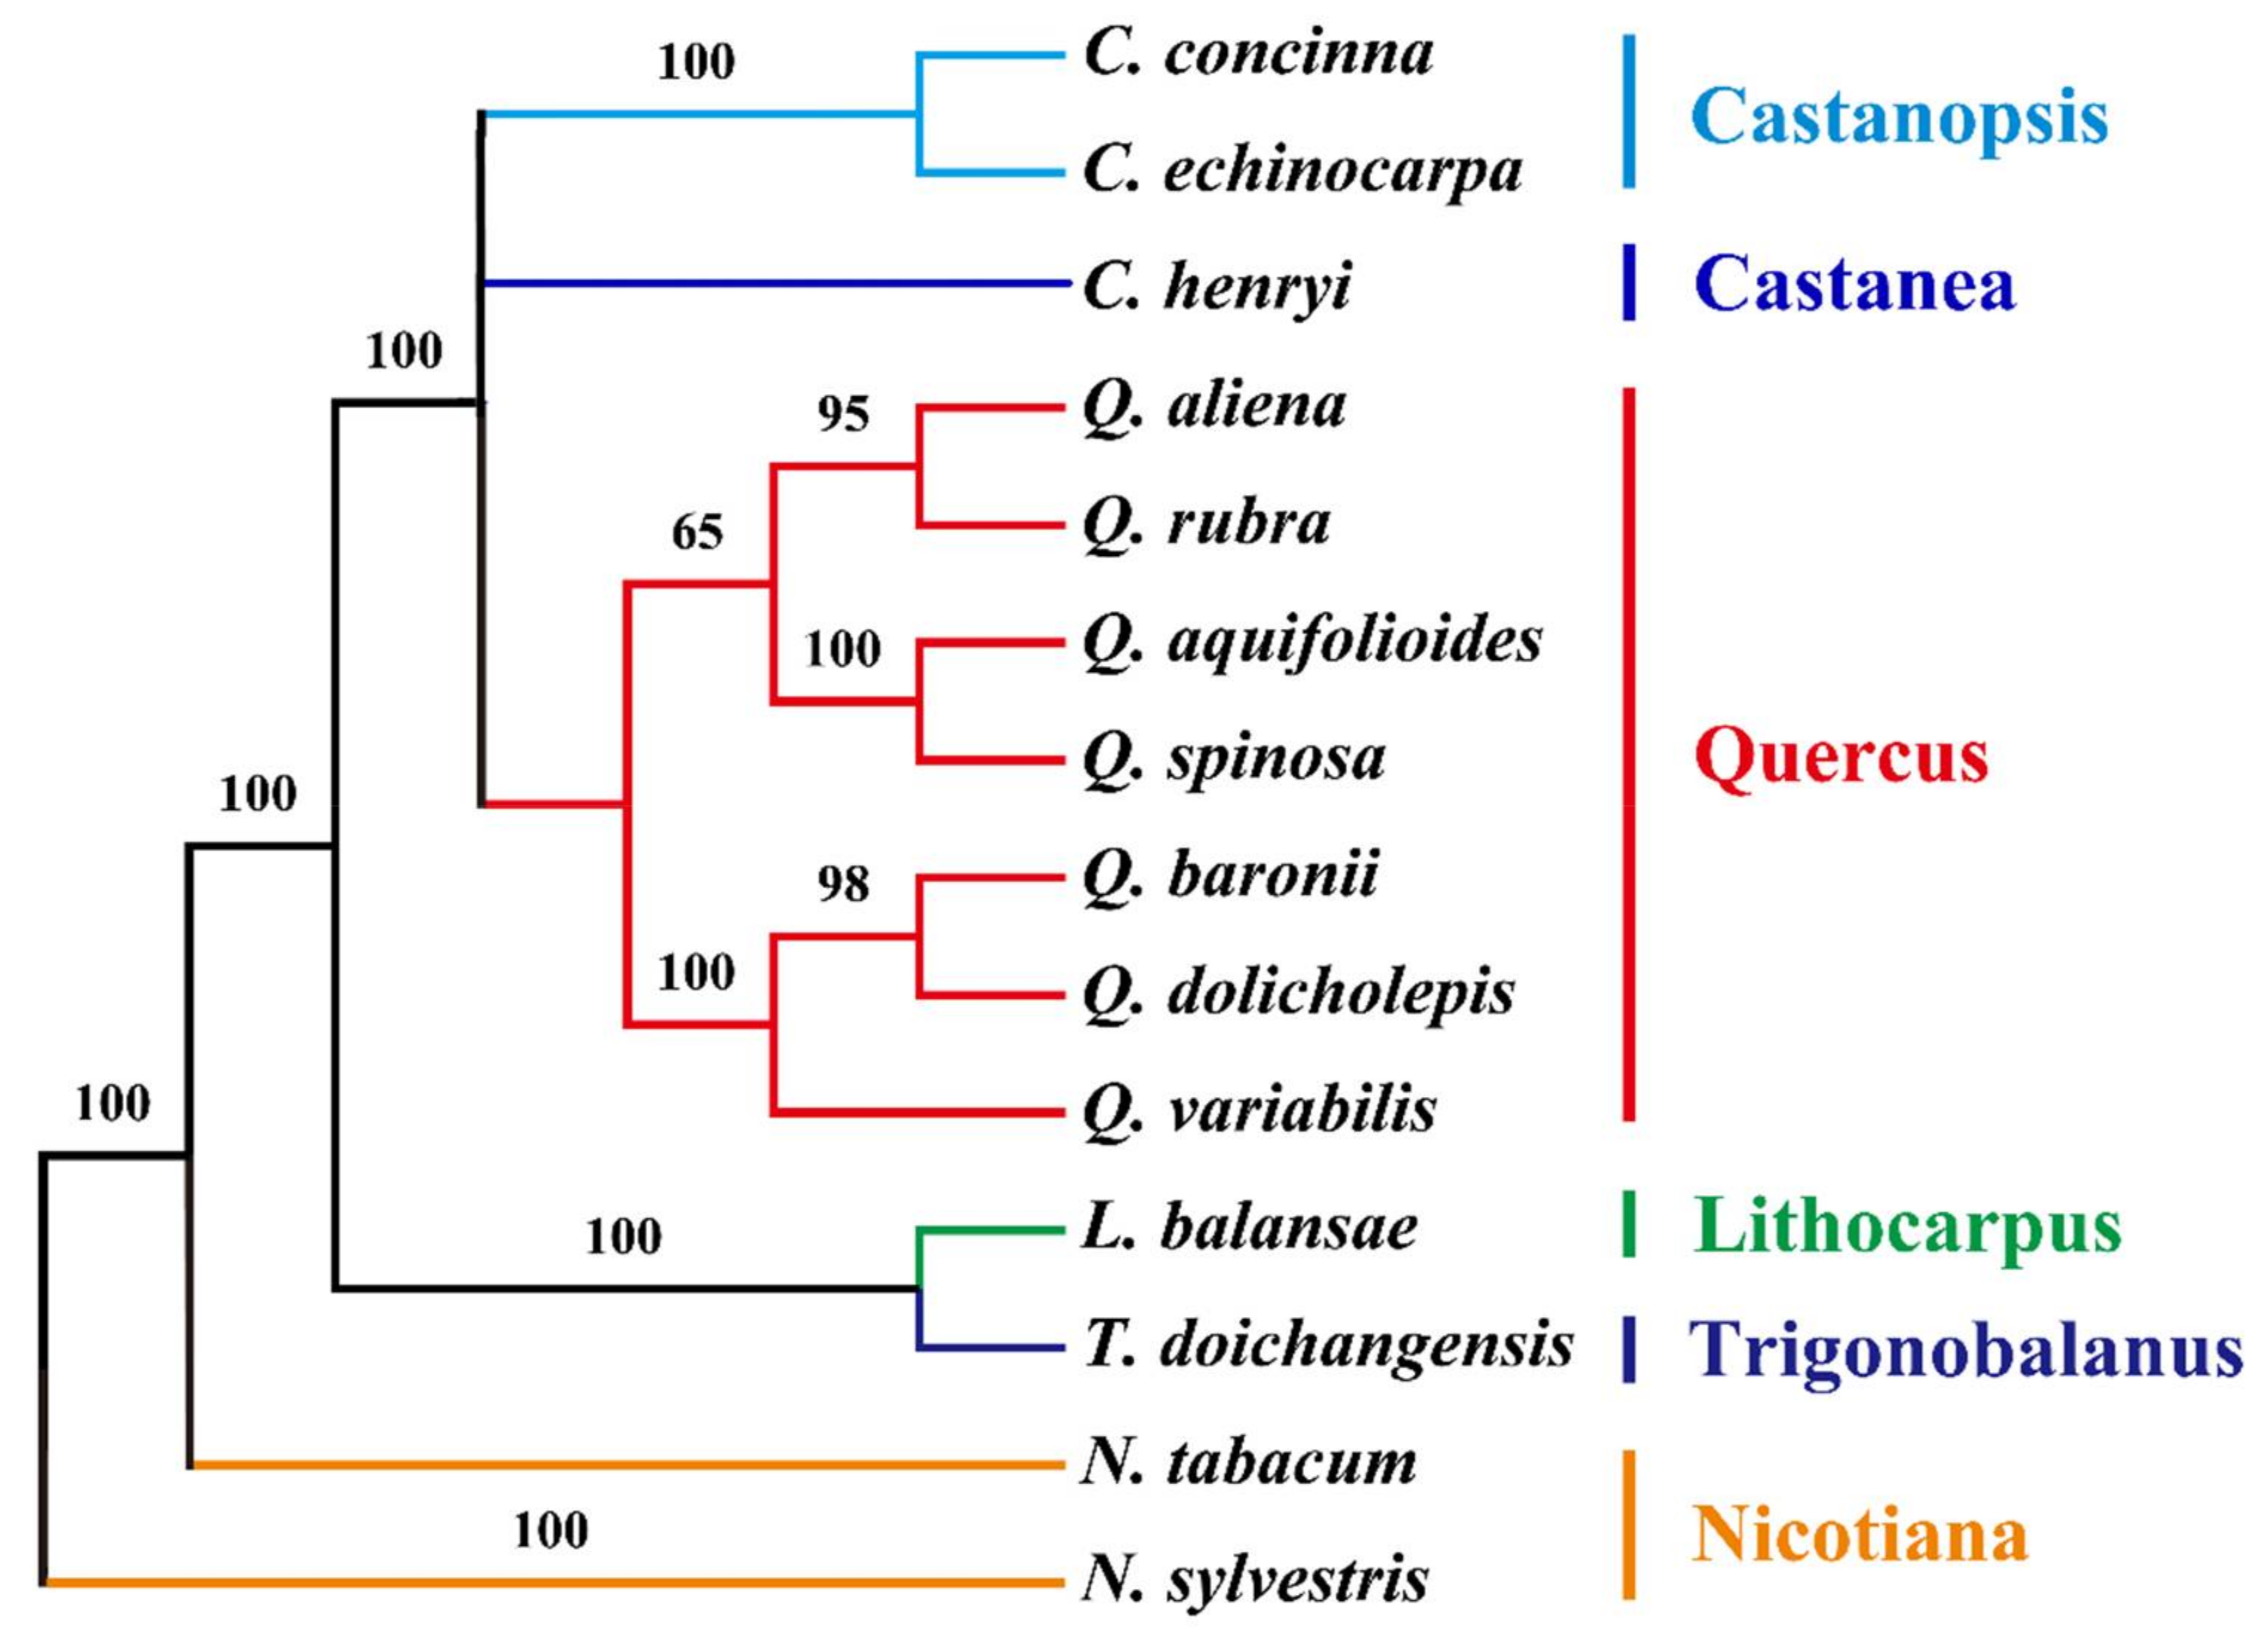
2.6. Phylogenetic Analysis of the cp Genomes of Q. aquifolioides and Related Quercus Species

The phylogeny of oak trees is complex due to extensive introgression, hybridization, incomplete lineage sorting, and convergent evolution [46]. However, phylogenetic issues in many angiosperms have been addressed successfully with the help of cp genome sequences [47,48,49]. Maximum parsimony (MP) analysis with 73 protein-coding genes from 12 Fragaceae with two tobacco species as outgroup revealed 10 out of 11 nodes with bootstrap values ≥ 95%, which is very high for an MP tree (Figure 9). The MP phylogenetic tree was even more strongly supported by eight 100% bootstrap values, showing that Q. aquifolioides was grouped with Q. spinosa within Quercus. Both of these are members of sect. Heterobalanus. The MP tree also revealed that Q. rubra and Q. aliena were the closest relatives of Q. aquifolioides and Q. spinosa (Figure 9). However, this phylogenetic tree is solely based on cp DNA. To fully understand their phylogenetic relationships, nuclear DNA is required to be investigated to assess the effect of introgression and hybridization on phylogeny.

3. Materials and Methods

3.1. Plant Material

We collected a Q. aquifolioides tree less than 3 years old from Lijiang Alpine Botanic Garden, China and transplanted it to Beijing Forestry University. Q. aquifolioides is a common, non-endangered tree species in China. No specific protective policy was implemented in this area. The plants were grown in a growth chamber under 150 mmol·m−2·s−1 light, with 16 h light/8 h dark cycles, at 24 °C with a constant humidity of 65%. Voucher specimens were deposited in the herbarium of Beijing Forestry University, Beijing, China.

3.2. Chloroplast Isolation, DNA Extraction, and Sequencing

A 0.3–0.5 g sample of the fresh young leaves was collected after the plant had grown in the dark for 24–36 h to promote starch degradation in chloroplasts (Nobel 1974). The chloroplast DNA (cpDNA) extraction and enrichment method followed the protocol developed by our group [50]. After amplifying the cpDNA by rolling circle amplification (RCA), we purified the RCA product and used 5 μg for library preparation. A 101-bp paired-end run was performed on an Illumina-HiSeq 1500 (Illumina, San Diego, CA, USA) at the gene sequencing platform of the School of Life Sciences, Tsinghua University, China. Briefly, library preparation was carried out following the manufacturer’s instructions with an insert size of up to 500 bp. Base calling was performed with RTA v.1.6 (Illumina, San Diego, CA, USA).

3.3. Chloroplast Genome Assembly

We assembled the Q. aquifolioides chloroplast genome using a pipeline developed in our lab [21]. Briefly, we used an in-house Perl script to eliminate low quality (probability of error > 1%) nucleotides in each read. SOAPdenovo 2 [51] was used for de novo assembly with default parameters, except that an insert size of 500 bp was set. Next, the primary contigs were assembled using the Quercus rubra chloroplast genome (GenBank accession number: JX970937) as the reference sequence. Gaps between two neighbor contigs were filled with N. These gaps were resolved as previously described [50].

3.4. Genome Annotation

We used CpGAVAS [52] for chloroplast genome annotation then manually corrected the output. This program uses a chloroplast genome sequence in FASTA format to identify protein-coding genes by performing BLASTX searches against a custom database of known chloroplast genomes. The program also produces a circular map of the chloroplast genome, displaying the protein-coding genes, transfer RNAs (tRNAs), and ribosomal RNAs (rRNAs) based on the annotations.

3.5. Repeat Analysis

Simple sequence repeats (SSRs) in the cp genomes were detected using the Perl script MISA [53]. The thresholds set for the SSRs were 10, 6, 4, 3, 3, and 3 for mono-, di-, tri-, tetra-, penta-, and hexa-nucleotides, respectively. Tandem repeat sequences (>10 bp in length) were detected using the online program Tandem Repeats Finder [54]. The minimum alignment score and maximum period size were 90 and 500 respectively. The online REPuter software tool (Available online: https://bibiserv.cebitec.uni-bielefeld.de/reputer/) was used to identify forward, palindrome, reverse, and complement sequences with a minimum repeat size of 30 bp, and sequence identity greater than 90% (Hamming distance equal to 3) [55].

3.6. CCT Map

Comparative genome maps of Q. aquifolioides and the other three Quercus cp genomes were constructed by BLAST using CCT software [56] and the results were displayed as a circular map. Additional features such as the Clusters of Orthologous Groups of proteins (COG) and GC Skew in the reference genome were also included.

3.7. Sequence Divergence Analysis

The alignments of the cp genomes of Q. aquifolioides and the other three Quercus cp genome were visualized using mVISTA [57] (Available online: http://genome.lbl.gov/vista/mvista/submit.shtml) in Shuffle-LAGAN mode [34] in order to show interspecific variation. The sequence divergences of four Quercus protein coding genes were evaluated using MEGA 7 [58]. A sliding window analysis was conducted to generate nucleotide diversity (Pi) values for the three data sets (the aligned LSC, SSC, and IR regions of the four complete Quercus cp genomes) using DnaSP 5 [59]. The step size was set to 200 bp, with a 600 bp window length. The Tamura 3-parameter (T92) model was selected to calculate pairwise sequence divergences [60].

3.8. Selection Pressure Analysis

To estimate selection pressures, non-synonymous (Ka) and synonymous (Ks) substitution rates of 73 protein coding genes between the cp genomes of Q. aquifolioides and the other three Quercus species were calculated using DnaSP 5. For identification of site-specific selection, protein coding gene alignments were analyzed using Selecton [61], with Q. aquifolioides as a reference sequence. Two models, M8 (allows for positive selection operating on the protein) and M8a (does not allow for positive selection), were used and likelihood scores estimated by models were evaluated using a log-likelihood ratio test (LRT) with degree of freedom (df) = 1. Only sites with posterior probabilities > 0.8 were selected.

3.9. Phylogenetic Analysis

The sequences were aligned using MAFFT 7 [62]. Maximum parsimony (MP) analysis was executed using PAUP 4 [63]. A total of 73 protein-coding genes shared by all cp genomes were used for this phylogenetic analysis, which included 12 Fagaceae species (Q. aquifolioides KP340971; Q. aliena KP301144; Q. rubra JX970937; Q. spinosa KM841421; Q. variabilis KU240009; Q. dolicholepis KU240010; Q. baronii KT963087; Castanopsis concinna KT793041; C. echinocarpa KJ001129; Castanea henryi KX954615; Lithocarpus balansae KP299291; Trigonobalanus doichangensis KF990556), with two Nicotiana species (N. sylvestris AB237912; N. tabacum Z00044) as outgroups.

Supplementary Materials

Supplementary materials can be found at https://www.mdpi.com/1422-0067/19/4/1042/s1.

Acknowledgments

This research was supported by the National Key Research and Development Plan “Research on protection and restoration of typical small populations of wild plants” (Grant No. 2016YFC0503106), Fundamental Research Funds for the Central Universities (No. 2015ZCQ-LX-03), the National Science Foundation of China (grant 41671039) and the Beijing Nova Program (grant Z151100000315056) to FKD.

Author Contributions

Fang K. Du and Kangquan Yin designed the research; Fang K. Du and Kangquan Yin collected the samples; Yue Zhang, Yuejuan Li and Kangquan Yin performed the experiments and analysis; Fang K. Du and Kangquan Yin wrote the manuscript; all authors revised the manuscript.

Conflicts of Interest

The authors declare no conflict of interest.

References

  1. McCauley, D.E.; Stevens, J.E.; Peroni, P.A.; Raveill, J.A. The spatial distribution of chloroplast DNA and allozyme polymorphisms within a population of Silene alba (Caryophyllaceae). Am. J. Bot. 1996, 83, 727–731. [Google Scholar] [CrossRef]
  2. Yurina, N.P.; Odintsova, M.S. Comparative structural organization of plant chloroplast and mitochondrial genomes. Genetika 1998, 34, 5–22. [Google Scholar]
  3. Nixon, K.C. The genus Quercus in Mexico. In Biological Diversity of Mexico: Origins and Distribution; Oxford University Press: New York, NY, USA, 1993; pp. 447–458. ISBN 019506674X. [Google Scholar]
  4. Keator, G.; Bazel, S. The Life of an Oak: An Intimate Portrait; Heyday Books: Berkeley, CA, USA; California Oak Foundation: Oakland, CA, USA, 1998; p. 256. ISBN 9780930588984. [Google Scholar]
  5. Nixon, K.C. Global and neotropical distribution and diversity of oak (genus Quercus) and oak forests. In Ecology and Conservation of Neotropical Montane Oak Forests; Springer: Berlin/Heidelberg, Germany, 2006; pp. 3–13. ISBN 364206695X. [Google Scholar]
  6. Trelease, W. The American oaks. Mem. Natl. Acad. Sci. 1924, 20, 1–255. [Google Scholar]
  7. Palmer, E.J. Hybrid oaks of North America. J. Arnold Arbor. 1948, 29, 1–48. [Google Scholar]
  8. Muller, C.H. Ecological control of hybridization in Quercus: A factor in the mechanism of evolution. Evolution 1952, 6, 147–161. [Google Scholar]
  9. Tucker, J.M. Studies in the Quercus undulata complex. I. A preliminary statement. Am. J. Bot. 1961, 48, 202–208. [Google Scholar] [CrossRef]
  10. Hardin, J.W. Hybridization and introgression in Quercus alba. J. Arnold Arbor. 1975, 56, 336–363. [Google Scholar]
  11. Rushton, B.S. Natural hybridization within the genus Quercus. Ann. For. Sci. 1993, 50, 73s–90s. [Google Scholar] [CrossRef]
  12. Spellenberg, R. On the hybrid nature of Quercus basaseachicensis (Fagaceae, sect. Quercus). SIDA Contrib. Bot. 1995, 16, 427–437. [Google Scholar]
  13. Bacilieri, R.; Ducousso, A.; Petit, R.J.; Kremer, A. Mating system and asymmetric hybridization in a mixed stand of European oaks. Evolution 1996, 50, 900–908. [Google Scholar] [CrossRef] [PubMed]
  14. Howard, D.J.; Preszler, R.W.; Williams, J.; Fenchel, S.; Boecklen, W.J. How discrete are oak species? Insights from a hybrid zone between Quercus grisea and Quercus gambelii. Evolution 1997, 51, 747–755. [Google Scholar] [CrossRef] [PubMed]
  15. Manos, P.S.; Doyle, J.J.; Nixon, K.C. Phylogeny, biogeography, and processes of molecular differentiation in Quercus subgenus Quercus (Fagaceae). Mol. Phylogenet. Evol. 1999, 12, 333–349. [Google Scholar] [CrossRef] [PubMed]
  16. Manos, P.S.; Stanford, A.M. The historical biogeography of Fagaceae: Tracking the tertiary history of temperate and subtropical forests of the Northern Hemisphere. Int. J. Plant Sci. 2001, 162, S77–S93. [Google Scholar] [CrossRef]
  17. Grímsson, F.; Zetter, R.; Grimm, G.W.; Pedersen, G.K.; Pedersen, A.K.; Denk, T. Fagaceae pollen from the early Cenozoic of West Greenland: Revisiting Engler’s and Chaney’s Arcto-Tertiary hypotheses. Plant Syst. Evol. 2015, 301, 809–832. [Google Scholar] [CrossRef] [PubMed]
  18. Simeone, M.C.; Grimm, G.W.; Papini, A.; Vessella, F.; Cardoni, S.; Tordoni, E.; Piredda, R.; Franc, A.; Denk, T. Plastome data reveal multiple geographic origins of Quercus Group Ilex. PeerJ 2016, 4, e1897. [Google Scholar] [CrossRef] [PubMed] [Green Version]
  19. Denk, T.; Grimm, G.W.; Manos, P.S.; Deng, M.; Hipp, A.L. An updated infrageneric classification of the oaks: Review of previous taxonomic schemes and synthesis of evolutionary patterns. In Oaks Physiological Ecology. Exploring the Functional Diversity of Genus Quercus L.; Gil-Pelegrín, E., Peguero-Pina, J., Sancho-Knapik, D., Eds.; Springer: Cham, Switzerland, 2017; pp. 13–38. ISBN 978-3-319-69098-8. [Google Scholar]
  20. Huang, C.J.; Zhang, Y.T.; Bartholomew, B. Fagaeeae. In Flora of China; Wu, Z.Y., Raven, P.H., Eds.; Science Press: Beijing, China, 1999; pp. 370–380. ISBN 0915279703. [Google Scholar]
  21. Du, F.K.; Hou, M.; Wang, W.; Mao, K.S.; Hampe, A. Phylogeography of Quercus aquifolioides provides novel insights into the Neogene history of a major global hotspot of plant diversity in southwest China. J. Biogeogr. 2017, 44, 294–307. [Google Scholar] [CrossRef]
  22. Yang, Y.; Zhou, T.; Duan, D.; Yang, J.; Feng, L.; Zhao, G. Comparative analysis of the complete chloroplast genomes of five Quercus species. Front. Plant Sci. 2016, 7, 959. [Google Scholar] [CrossRef] [PubMed]
  23. Jansen, R.K.; Raubeson, L.A.; Boore, J.L.; dePamphilis, C.W.; Chumley, T.W.; Haberle, R.C.; Wyman, S.K.; Alverson, A.J.; Peery, R.; Herman, S.J.; et al. Methods for obtaining and analyzing whole chloroplast genome sequences. Method Enzymol. 2005, 395, 348–384. [Google Scholar]
  24. Chumley, T.W.; Palmer, J.D.; Mower, J.P.; Fourcade, H.M.; Calie, P.J.; Boore, J.L.; Jansen, R.K. The complete chloroplast genome sequence of Pelargonium × hortorum: Organization and evolution of the largest and most highly rearranged chloroplast genome of land plants. Mol. Biol. Evol. 2006, 23, 2175–2190. [Google Scholar] [CrossRef] [PubMed]
  25. Bull, L.N.; Pabón-Peña, C.R.; Freimer, N.B. Compound microsatellite repeats: Practical and theoretical features. Genome Res. 1999, 9, 830–838. [Google Scholar] [CrossRef] [PubMed]
  26. Jansen, R.K.; Kaittanis, C.; Saski, C.; Lee, S.B.; Tomkins, J.; Alverson, A.J.; Daniell, H. Phylogenetic analyses of Vitis (Vitaceae) based on complete chloroplast genome sequences: Effects of taxon sampling and phylogenetic methods on resolving relationships among rosids. BMC Evol. Biol. 2006, 6, 32. [Google Scholar] [CrossRef] [PubMed]
  27. Ruhlman, T.; Lee, S.B.; Jansen, R.K.; Hostetler, J.B.; Tallon, L.J.; Town, C.D.; Daniell, H. Complete plastid genome sequence of Daucus carota: Implications for biotechnology and phylogeny of angiosperms. BMC Genom. 2006, 7, 222. [Google Scholar] [CrossRef] [PubMed]
  28. Silva, S.R.; Diaz, Y.C.; Penha, H.A.; Pinheiro, D.G.; Fernandes, C.C.; Miranda, V.F.; Todd, P.; Michael, T.P.; Varani, A.M. The Chloroplast Genome of Utricularia reniformis Sheds Light on the Evolution of the ndh Gene Complex of Terrestrial Carnivorous Plants from the Lentibulariaceae Family. PLoS ONE 2016, 11, e0165176. [Google Scholar] [CrossRef] [PubMed]
  29. Liu, L.X.; Li, R.; Worth, J.R.; Li, X.; Li, P.; Cameron, K.M.; Fu, C.X. The Complete Chloroplast Genome of Chinese Bayberry (Morella rubra, Myricaceae): Implications for Understanding the Evolution of Fagales. Front. Plant Sci. 2017, 8, 968. [Google Scholar] [CrossRef] [PubMed]
  30. Qian, J.; Song, J.; Gao, H.; Zhu, Y.; Xu, J.; Pang, X.; Yao, H.; Sun, C.; Li, X.; Li, C.; et al. The complete chloroplast genome sequence of the medicinal plant Salvia miltiorrhiza. PLoS ONE 2013, 8, e57607. [Google Scholar] [CrossRef] [PubMed]
  31. Kuang, D.Y.; Wu, H.; Wang, Y.L.; Gao, L.M.; Zhang, S.Z.; Lu, L. Complete chloroplast genome sequence of Magnolia kwangsiensis (Magnoliaceae): Implication for DNA barcoding and population genetics. Genome 2011, 54, 663–673. [Google Scholar] [CrossRef] [PubMed]
  32. Goulding, S.E.; Wolfe, K.H.; Olmstead, R.G.; Morden, C.W. Ebb and flow of the chloroplast inverted repeat. Mol. Gen. Genet. 1996, 252, 195–206. [Google Scholar] [CrossRef] [PubMed]
  33. Kim, K.J.; Lee, H.L. Complete chloroplast genome sequences from Korean ginseng (Panax schinseng Nees) and comparative analysis of sequence evolution among 17 vascular plants. DNA Res. 2004, 11, 247–261. [Google Scholar] [CrossRef] [PubMed]
  34. Dong, W.; Xu, C.; Cheng, T.; Zhou, S. Complete chloroplast genome of Sedum sarmentosum and chloroplast genome evolution in Saxifragales. PLoS ONE 2013, 8, e77965. [Google Scholar] [CrossRef] [PubMed]
  35. Lu, R.; Li, P.; Qiu, Y. The complete chloroplast genomes of three Cardiocrinum (Liliaceae) species: Comparative genomic and phylogenetic analyses. Front. Plant Sci. 2016, 7, 2054. [Google Scholar] [CrossRef] [PubMed]
  36. Zhang, Y.; Du, L.; Liu, A.; Chen, J.; Wu, L.; Hu, W.; Zhang, W.; Kim, K.; Lee, S.C.; Tae-Jin Yang, T.J.; et al. The Complete Chloroplast Genome Sequences of Five Epimedium Species: Lights into Phylogenetic and Taxonomic Analyses. Front. Plant Sci. 2016, 7, 306. [Google Scholar] [CrossRef] [PubMed]
  37. Khakhlova, O.; Bock, R. Elimination of deleterious mutations in plastid genomes by gene conversion. Plant J. 2006, 46, 85–94. [Google Scholar] [CrossRef] [PubMed]
  38. Liu, Y.; Huo, N.; Dong, L.; Wang, Y.; Zhang, S.; Young, H.A.; Feng, X.; Gu, Y.Q. Complete Chloroplast Genome Sequences of Mongolia Medicine Artemisia frigida and Phylogenetic Relationships with Other Plants. PLoS ONE 2013, 8, e57533. [Google Scholar] [CrossRef] [PubMed]
  39. Nazareno, A.G.; Carlsen, M.; Lohmann, L.G. Complete Chloroplast Genome of Tanaecium tetragonolobum: The First Bignoniaceae Plastome. PLoS ONE 2015, 10, e0129930. [Google Scholar] [CrossRef] [PubMed]
  40. Dong, W.; Liu, J.; Yu, J.; Wang, L.; Zhou, S. Highly variable chloroplast markers for evaluating plant phylogeny at low taxonomic levels and for DNA barcoding. PLoS ONE 2012, 7, e35071. [Google Scholar] [CrossRef] [PubMed]
  41. Awad, M.; Fahmy, R.M.; Mosa, K.A.; Helmy, M.; El-Feky, F.A. Identification of effective DNA barcodes for Triticum plants through chloroplast genome-wide analysis. Comput. Biol. Chem. 2017, 71, 20–31. [Google Scholar] [CrossRef] [PubMed]
  42. Shaw, J.; Lickey, E.B.; Schilling, E.E.; Small, R.L. Comparison of whole chloroplast genome sequences to choose noncoding regions for phylogenetic studies in angiosperms: The tortoise and the hare III. Am. J. Bot. 2007, 94, 275–288. [Google Scholar] [CrossRef] [PubMed]
  43. Kimura, M. The neutral theory of molecular evolution and the world view of the neutralists. Genome 1983, 31, 24–31. [Google Scholar] [CrossRef]
  44. Hudson, G.S.; Mason, J.G. The chloroplast genes encoding subunits of the H+-ATP synthase. In Molecular Biology of Photosynthesis; Govindjee, Ed.; Springer: Dordrecht, The Netherlands, 1988; pp. 565–582. ISBN 978-94-010-7517-6. [Google Scholar]
  45. Cummings, M.P.; King, L.M.; Kellogg, E.A. Slipped-strand mispairing in a plastid gene: RpoC2 in grasses (Poaceae). Mol. Biol. Evol. 1994, 11, 1–8. [Google Scholar] [PubMed]
  46. Aldrich, P.R.; Cavender-Bares, J. Quercus. In Wild Crop Relatives: Genomic and Breeding Resources; Kole, C., Ed.; Springer: Berlin/Heidelberg, Germany, 2011; pp. 89–129. ISBN 978-3-642-21249-9. [Google Scholar]
  47. Jansen, R.K.; Cai, Z.; Raubeson, L.A.; Daniell, H.; dePamphilis, C.W.; Leebens-Mack, J.; Müller, K.F.; Guisinger-Bellian, M.; Haberle, R.C.; Hansen, A.K.; et al. Analysis of 81 genes from 64 plastid genomes resolves relationships in angiosperms and identifies genome-scale evolutionary patterns. Proc. Natl. Acad. Sci. USA 2007, 104, 19369–19374. [Google Scholar] [CrossRef] [PubMed]
  48. Moore, M.J.; Bell, C.D.; Soltis, P.S.; Soltis, D.E. Using plastid genome-scale data to resolve enigmatic relationships among basal angiosperms. Proc. Natl. Acad. Sci. USA 2007, 104, 19363–19368. [Google Scholar] [CrossRef] [PubMed]
  49. Yang, J.B.; Li, D.Z.; Li, H.T. Highly effective sequencing whole chloroplast genomes of angiosperms by nine novel universal primer pairs. Mol. Ecol. Res. 2014, 14, 1024–1031. [Google Scholar] [CrossRef] [PubMed]
  50. Du, F.K.; Lang, T.; Lu, S.; Wang, Y.; Li, J.; Yin, K. An improved method for chloroplast genome sequencing in non-model forest tree species. Tree Genet. Genomes 2015, 11, 114. [Google Scholar] [CrossRef]
  51. Luo, R.; Liu, B.; Xie, Y.; Li, Z.; Huang, W.; Yuan, J.; He, G.; Chen, Y.; Pan, Q.; Liu, Y.; et al. SOAPdenovo2: An empirically improved memory-efficient short-read de novo assembler. Gigascience 2012, 1, 18. [Google Scholar] [CrossRef] [PubMed]
  52. Liu, C.; Shi, L.; Zhu, Y.; Chen, H.; Zhang, J.; Lin, X.; Guan, X. CpGAVAS, an integrated web server for the annotation, visualization, analysis, and GenBank submission of completely sequenced chloroplast genome sequences. BMC Genom. 2012, 13, 715. [Google Scholar] [CrossRef] [PubMed]
  53. Thiel, T.; Michalek, W.; Varshney, R.; Graner, A. Exploiting EST databases for the development and characterization of gene-derived SSR-markers in barley (Hordeum vulgare L.). Theor. Appl. Genet. 2003, 106, 411–422. [Google Scholar] [CrossRef] [PubMed]
  54. Benson, G. Tandem repeats finder: A program to analyze DNA sequences. Nucleic Acids Res. 1999, 27, 573. [Google Scholar] [CrossRef] [PubMed]
  55. Kurtz, S.; Schleiermacher, C. REPuter: Fast computation of maximal repeats in complete genomes. Bioinformatics 1999, 15, 426–427. [Google Scholar] [CrossRef] [PubMed]
  56. Grant, J.R.; Stothard, P. The CGView Server: A comparative genomics tool for circular genomes. Nucleic Acids Res. 2008, 36, W181–W184. [Google Scholar] [CrossRef] [PubMed]
  57. Frazer, K.A.; Pachter, L.; Poliakov, A.; Rubin, E.M.; Dubchak, I. VISTA: Computational tools for comparative genomics. Nucleic Acids Res. 2004, 32, W273–W279. [Google Scholar] [CrossRef] [PubMed]
  58. Kumar, S.; Stecher, G.; Tamura, K. MEGA7: Molecular evolutionary genetics analysis version 7.0 for bigger datasets. Mol. Biol. Evol. 2016, 33, 1870–1874. [Google Scholar] [CrossRef] [PubMed]
  59. Librado, P.; Rozas, J. DnaSP v5: A software for comprehensive analysis of DNA polymorphism data. Bioinformatics 2009, 25, 1451–1452. [Google Scholar] [CrossRef] [PubMed]
  60. Tamura, K. Estimation of the number of nucleotide substitutions when there are strong transition-transversion and G+C-content biases. Mol. Biol. Evol. 1992, 9, 678–687. [Google Scholar] [PubMed]
  61. Stern, A.; Doron-Faigenboim, A.; Erez, E.; Martz, E.; Bacharach, E.; Pupko, T. Selecton 2007: Advanced models for detecting positive and purifying selection using a Bayesian inference approach. Nucleic Acids Res. 2007, 35, W506–W511. [Google Scholar] [CrossRef] [PubMed]
  62. Katoh, K.; Standley, D.M. MAFFT multiple sequence alignment software version 7: Improvements in performance and usability. Mol. Biol. Evol. 2013, 30, 772–780. [Google Scholar] [CrossRef] [PubMed]
  63. Swofford, D.L. PAUP*. Phylogenetic Analysis Using Parsimony (and Other Methods). Version 4; Sinauer Associates: Sunderland, MA, USA, 2003. [Google Scholar]
Figure 1. Gene map of the Q. aquifolioides chloroplast genome. The annotated chloroplast (cp) genome of Q. aquifolioides is represented as concentric circles. Genes shown outside the outer circle are transcribed counter-clockwise and genes indicated inside the outer circle are transcribed clockwise. Two inverted repeats (IRs), the large single copy (LSC) and the small single copy (SSC) are shown in the inner circle.
Ijms 19 01042 g001
Figure 2. Analysis of repeated sequences in Q. aquifolioides.
Ijms 19 01042 g002
Figure 3. Analysis of simple sequence repeats (SSRs) in the Q. aquifolioides cp genome. (A) Frequency of SSRs identified in the LSC, SSC, and IR regions; (B) Frequency of SSRs identified in the coding regions, intergenic spacers and introns of the LSC, SSC and IR regions; (C) Frequency distribution of different classes of polymer in the cp genome of Q. aquifolioides.
Ijms 19 01042 g003
Figure 4. Comparison of four Quercus cp genome sequences. The outer four rings show the coding sequences, tRNA genes, rRNA genes, and other genes in the forward and reverse strands. The next three rings show the blast results between the cp genomes of Q. aquifolioides and three other Quercus species based on BlastN (blast 1–3 results: Q. aquifolioides Vs Q. aliena, Q. rubra, and Q. spinosa, respectively). The following black ring is the GC content curve for the Q. aquifolioides cp genome. The innermost ring is a GC skew curve for the Q. aquifolioides cp genome. GC skew+ (green) indicates G > C, GC skew− (purple) indicates G < C.
Ijms 19 01042 g004
Figure 5. Comparisons of borders between neighboring genes and junctions of the LSC, SSC, and IR regions among the four Quercus cp genomes. Boxes above or below the main line indicate genes adjacent to borders. The figure is not to scale with regard to sequence length and shows only relative changes at or near (inverted repeats/single copy) IR/SC borders.
Ijms 19 01042 g005
Figure 6. Alignment of four Quercus cp genome sequences. Sequence identity plot for four Quercus species, with Q. aquifolioides as a reference. The X-axis corresponds to coordinates within the cp genome. The Y-axis shows the percentage identity in the range 50% to 100%.
Ijms 19 01042 g006
Figure 7. Comparative analysis of nucleotide variability (Pi) values among the four Quercus cp genome sequences. (A) Analysis of the LSC regions; (B) Analysis of the SSC regions; (C) Analysis of the IR regions. (Window length: 600 bp, step size: 200 bp). X-axis: position of the midpoint of a window, Y-axis: nucleotide diversity of each window.
Ijms 19 01042 g007
Figure 8. Ka/Ks ratios for protein-coding genes from Q. rubra, Q. spinosa, and Q. aliena chloroplast genome in comparison with Q. aquifolioides.
Ijms 19 01042 g008
Figure 9. Phylogenetic relationship between Q. aquifolioides and related species, inferred from 73 protein-coding genes shared by all cp genomes. The phylogenetic tree was constructed by the maximum parsimony method, with two Nicotiana species as outgroups.
Ijms 19 01042 g009
Table 1. Summary of the features of four complete Quercus plastomes.
Genome FeaturesSect. HeterobalanusSect. LobataeSect. Quercus
Q. aquifolioidesQ. spinosaQ. rubraQ. aliena
Genome size/GC content160,415/37.0160,825/36.9161,304/36.8160,921/36.9
Coding genes: number/size80(7)/80,27080(7)/80,81280(7)/80,94680(7)/80,052
tRNA: number/size 39/10,62538/11,40239/10,75639/10,753
rRNA: number/size 8/90488/90508/90508/9048
LSC: size/percent/GC content 89,807/56/34.890,371/56.2/34.790,541/56.1/34.790,258/56.1/34.7
SSC: size/percent/GC content 18,894/11.8/31.218,732/11.6/31.219,023/56.1/30.918,972/11.8/31.0
IR: size/percent/GC content 51,754/32.2/42.751,722/32.2/47.252,740/32.7/42.751,682/32.1/42.7
Introns: size/percent 20,473/12.819,757/12.320,217/12.520,014/12.4
Intergenic spacer: size/percent49,548/31.050,207/31.247,473/29.447,304/29.3
Numbers in brackets denote the numbers of genes duplicated in the IR regions.
Table 2. Positive selection sites identified by Selecton.
Gene NULL (M8a) POSITIVE (M8) Putative Sites under Positive Selection
rpl2−1177.05−1174.541 (131 S)
ycf2−9154.8−9154.875 (96 K, 932 W, 1174 P, 1291 W, 2007 R)
rps7−615.83−615.6161 (130 E)
ndhD−2145.31−2141.848 (170 T, 188 G, 200 L, 206 A, 362 R, 375 P, 413 Q, 504 F)
ycf1−8057.78−8051.128 (426 F, 529 L, 757 L, 761 L, 1007 I, 1490 Q, 1491 G, 1492 F)
rpoC2−5814.68−5814.826 (33 H, 131 P, 280 L, 364 I, 505 H, 542 E, 587 E, 595 P, 598 V, 626 N, 643 K, 691 G, 697 T, 815 Y, 849 G, 856 H, 898 D, 947 S, 1013 K, 1074 I, 1081 A, 1132 E, 1176 I, 1273 C, 1374 D, 1394 N)
rpoC1−2857.37−2855.151 (145 Y)
psaB−2999.97−2998.623 (145 L, 238 E, 239 K)
ndhJ−633.793−633.5691 (107 A)
ndhC−828.789−828.7612 (68 V, 86 F)
rpl36−145.376−145.1351 (20 R)
Likelihood ratio test (LRT) analysis of models comparison M8 vs. M8a. M8 represents a model with positive selection; M8a represents null model without positive selection. Degree of freedom (df) = 1.

