Comparative Plastid Genomes of Primula Species: Sequence Divergence and Phylogenetic Relationships


1
Key Laboratory of Resource Biology and Biotechnology in Western China (Ministry of Education), College of Life Sciences, Northwest University, Xi’an 710069, China
2
School of Pharmacy, Xi’an Jiaotong University, Xi’an 710061, China
*
Author to whom correspondence should be addressed.
Int. J. Mol. Sci. 2018, 19(4), 1050; https://doi.org/10.3390/ijms19041050
Submission received: 13 March 2018
/
Revised: 29 March 2018
/
Accepted: 29 March 2018
/
Published: 1 April 2018
(This article belongs to the Special Issue Chloroplast)
Abstract
:Compared to traditional DNA markers, genome-scale datasets can provide mass information to effectively address historically difficult phylogenies. Primula is the largest genus in the family Primulaceae, with members distributed mainly throughout temperate and arctic areas of the Northern Hemisphere. The phylogenetic relationships among Primula taxa still maintain unresolved, mainly due to intra- and interspecific morphological variation, which was caused by frequent hybridization and introgression. In this study, we sequenced and assembled four complete plastid genomes (Primula handeliana, Primula woodwardii, Primula knuthiana, and Androsace laxa) by Illumina paired-end sequencing. A total of 10 Primula species (including 7 published plastid genomes) were analyzed to investigate the plastid genome sequence divergence and their inferences for the phylogeny of Primula. The 10 Primula plastid genomes were similar in terms of their gene content and order, GC content, and codon usage, but slightly different in the number of the repeat. Moderate sequence divergence was observed among Primula plastid genomes. Phylogenetic analysis strongly supported that Primula was monophyletic and more closely related to Androsace in the Primulaceae family. The phylogenetic relationships among the 10 Primula species showed that the placement of P. knuthiana–P. veris clade was uncertain in the phylogenetic tree. This study indicated that plastid genome data were highly effective to investigate the phylogeny.

1. Introduction
Primula is the largest genus in the family Primulaceae with approximately 500 species [1,2], where they are especially rich in the temperate and arctic areas of the Northern Hemisphere, with only a few outliers found in the Southern Hemisphere. China is the center of Primula diversity and speciation with over 300 species [1,3]. Many Primula species are grown widely as ornamental and landscape plants because of their attractive flowers and long flowering period. Therefore, Primula is reputed to be one of the great garden plant genera throughout the world [2,3].
As a typical cross-pollinated plant with heterostyly, Primula has been a particular focus of many botanists, and various studies are involved in hybridization [4], pollination biology [5,6], and distyly [7,8]. According to morphological traits, the taxonomic study of Primula has been revised for several times. Smith and Fletcher (1947) firstly proposed an infrageneric system with a total of 31 sections [9]. Considering some putative reticulate evolutionary relationships, Wendelbo (1961) posed a revised system with seven subgenera [10]. Richards (1993) later amended Wendelbo’s version and classified six subgenera [11]. Hu and Kelso (1996) delimited the Chinese Primula species into 24 sections [1]. Recently, numerous molecular phylogenetic works of the genus Primula have also been conducted by using plastid and/or nuclear gene fragments [12,13,14]. These studies have greatly advanced our understanding of the evolutionary history of Primula species. However, the phylogenetic relationships within the genus Primula are still uncertain, mainly due to intra- and interspecific morphological variation, which was caused by frequent hybridization and introgression [1,2,14]. Further research has been hindered by the insufficient information of the traditional DNA markers, such as one or few chloroplast gene fragments, and by the complex evolutionary relationships in Primula. Therefore, more sequence resources and genome data are required in order to obtain a better understanding of the phylogeny of the genus Primula.
In general, the plastid genome in angiosperms is a typical quadripartite structure, where the size ranges from 115 to 165 kb, with two copies of inverted repeat (IR) regions separated by a large single copy (LSC) region and a small single copy (SSC) region [15]. Approximately 110–130 distinct genes are located along the plastid genome [16]. Most of these are protein-coding genes, the remainder being transfer RNA (tRNA) or ribosomal RNA (rRNA) genes [16]. Due to its particular advantages—such as small size, uniparental inheritance, low substitution rates, and high conservation in terms of the gene content and genome structure [17,18]—the plastid genome is considered a very promising tool for phylogenetic studies [19,20]. Significant advances in next-generation sequencing technology made it fairly inexpensive and convenient to obtain plastid genome sequences [21,22]. As a result, phylogenomic analyses have also been greatly facilitated. For example, the plastid phylogenomic analyses supported Tofieldiaceae as the most basal lineage within Alismatales [23]. The relationships between wild and domestic Citrus species could also be resolved with 34 plastid genomes [24]. Similarly, 142 plastid genomes were used to successfully infer deep phylogenetic relationships and the diversification history of Rosaceae [25]. These studies strongly indicate that plastid phylogenomics is helpful in determining the phylogenetic positions of various questionable lineages of angiosperms.
In the present study, we analyzed the complete plastid genomes of 10 Primula species including 7 published plastid genomes and 3 new data (Primula handeliana, Primula woodwardii, and Primula knuthiana) by using Illumina sequencing technology. Our primary aims were to: (1) compare the complete plastid genomes of 10 Primula species; (2) document that the extent of sequence divergence among the Primula plastid genomes; and (3) increase more sequence resources and genome information for investigating the phylogeny in genus Primula. The complete plastid genome of Androsace laxa from a closely related genus was used as the outgroup in the phylogenomic analysis of genus Primula. This study will not only contribute to further studies on the phylogeny, taxonomy, and evolutionary history of the genus Primula, but also provide insight into the plastid genome evolution of Primula.
2. Results
2.1. Genome Features
The sizes of the plastid genomes of the 10 Primula species ranged from 150,856 bp to 153,757 bp, where they had a typical quadripartite structure, including a LSC region (82,048–84,479 bp) and a SSC region (17,568–17,896 bp) separated by a pair of IR regions (25,182–25,855 bp) (Table 1). In the 10 Primula plastid genomes, gene content was similar and gene order was identical. The Primula plastid genomes contained about 130–132 genes, including 85–86 protein-coding genes, 37 tRNA genes, and 8 rRNA genes (Tables 1 and S4). The accD gene was a pseudogene in P. sinensis, whereas it was missing in P. persimilis and P. kwangtungensis. The P. poissonii plastid genome contained a pseudogene (infA). Among these genes, 15 genes harbored a single intron (trnA-UGC, trnG-UCC, trnI-GAU, trnK-UUU, trnL-UAA, trnV-UAC, atpF, ndhA, ndhB, petB, petD, rpoC1, rpl2, rpl16, and rps16) and three genes (pafI, clpP, and rps12) harbored two introns. Seven tRNA genes, seven protein-coding genes, and all four rRNA genes were completely duplicated in the IR regions (Table 1). trnk-UUU had the largest intron (2487–2568 bp) containing the matK gene. The GC contents of the LSC, SSC, and IR regions, as well as those of the whole plastid genomes, were nearly identical in the 10 Primula plastid genomes (Table 1). The complete plastid genome of A. laxa was 151,942 bp in length and contained 132 genes (Table 1). The overall GC content of the A. laxa plastid genome was 37.3%, and the corresponding values for the LSC, SSC, and IR regions were 35.2, 30.9, and 42.7%, respectively (Table 1).
2.2. Codon Usage Analysis
Codon usage plays a crucial role in evolution of plastid genome. Here, we first analyzed codons of the protein-coding genes in the 10 Primula plastid genomes. The number of encoded codons ranged from 25,781 (P. sinensis) to 26,505 (P. knuthiana) (Table S5). Detailed codon analysis showed that the 10 Primula species had similar codon usage and relative synonymous codon usage (RSCU) values (Table S5). Leucine and Cysteine were the highest (2743–2823 codons) and lowest (280–298 codons) frequent amino acids in these species, respectively (Table S5). RSCU > 1 denotes that the codon is biased and used more frequently, RSCU = 1 shows that the codon has no bias, and RSCU < 1 indicates that the codon is used less frequently. All 10 Primula plastid genomes had 30 biased codons with RSCU > 1 (Table S5). The biased codons had higher representation rates for A or T at the third codon position in a similar manner to the majority of angiosperm plastid genomes. Except for TTG, all of the types of biased codons (RSCU > 1) ended with A or T. The GC% was quite different at the three codon positions (Table S6). The average values of GC% for the first, second, and third codon positions of 10 Primula species were 45.3, 37.9, and 29.2%, respectively (Table S6). The observation of GC% level also indicated that plastid genome in Primula was a strong bias toward A or T at the third codon position.
2.3. Analysis of Repeat Elements
Three categories of repeats (dispersed, palindromic, and tandem repeats) were identified in the 10 Primula plastid genomes. We detected 326 repeats in total comprising 144 dispersed, 123 palindromic, and 59 tandem repeats (Figure 1A and Table S7). Among them, repeats of P. sinensis (45) were the greatest and that of P. woodwardii (26) were the lowest (Figure 1A and Table S7). The majority of the repeats (95.4%) ranged in size from 14 to 62 bp (Figure 1B and Table S7). Repeats located in intergenic spacer (IGS) and intron regions comprised 44.2% (144 repeats) of the total repeats and 47.8% (156 repeats) were located in ycf2 gene, whereas only a minority were located in other coding DNA sequence (CDS) regions, such as psaB, trnS-GCU, ycf1, rpoB, ndhF, etc. (Table S7).
A total of 496 simple sequence repeats (SSRs) measuring at least 10 bp in length were also analyzed (Figure 2A and Table S8). Among these SSRs, the mononucleotide, dinucleotide, trinucleotide, tetranucleotide, pentanucleotide, and hexanucleotide SSRs were all detected. The mononucleotide SSR were the richest with a proportion of 76.6%, followed by dinucleotide SSR (11.7%), tetranucleotide SSR (7.7%), and trinucleotide SSR (2.8%) (Figure 2A and Table S8). We only detected six pentanucleotide and hexanucleotide SSRs in the 10 Primula cp genomes (Figure 2A and Table S8). Unsurprisingly, the mononucleotide A/T SSR occupied the highest portion (368; 74.2%) (Table S8). The number of mononucleotide A/T SSR was significantly higher than that of the mononucleotide G/C SSR (Figure 2B and Table S8). Furthermore, most of the SSRs were found in IGS regions (56.9%), followed by CDS regions (25%), and intron regions (17.9%) (Table S8). SSRs located in the CDS region were mainly found in the ycf1 gene.
2.4. IR/SC Boundary and Genome Rearrangement
The IR/SC boundary contents of 10 Primula plastid genomes were compared (Figure 3). The gene content and gene order were conserved at the IR/SC boundary, but the Primula plastid genomes exhibited more obvious differences. In the P. kwangtungensis plastid genome, the rps19 gene was located entirely in the LSC, whereas IRb extended in a variable manner 7–175 bp into the rps19 gene in all the other species. In the P. chrysochlora plastid genome, IRb even crossed completely into the rps19 gene. IRb extended 7–74 bp in a variable manner into the ndhF genes, except in the P. handeliana and P. poissonii plastid genomes. In all of the Primula plastid genomes, IRa extended into the ycf1 genes, where the smallest and largest extensions occurred in the P. handeliana (888 bp) and P. kwangtungensis (1048 bp) plastid genomes. The whole-genome alignment of the 10 Primula plastid genomes showed no rearrangement events in Primula (Figure S1).
2.5. Sequence Divergence
To investigate the levels of sequence divergence, the 10 Primula plastid genomes were plotted using mVISTA with P. poissonii as the reference (Figure 4). The Primula plastid genomes exhibited moderate sequence divergence (Figure 4). As expected, coding and IR regions exhibited more sequence conservation than non-coding and SC regions, respectively (Figure 4). We then calculated the percentage of variable characters for each coding region and non-coding regions with an alignment length of more than 200 bp (Table S9). The average percentage of variation in non-coding regions is 0.38, which was significantly higher than that in the coding regions (0.088 on average; Table S9). The accD gene contained various indels and it was a pseudogene in P. sinensis and missing in P. persimilis and P. kwangtungensis, which may have caused the most divergent coding region. In addition, 15 genes had a percentage of variation greater than 0.10 (Table S9), i.e., ycf1 (0.23), matK (0.18), ycf15 (0.17), ndhF (0.17), rpl33 (0.16), rpl22 (0.16), rps16 (0.15), rps8 (0.12), ccsA (0.12), rps15 (0.12), rpoC2 (0.11), psbH (0.11), ndhD (0.11), rpoA (0.10), and ndhA (0.10). Among the 16 genes with higher percentages of variation, 15 genes were found in SC regions and only one gene in IR regions (Table S9). The average percentages of variations in the LSC, SSC, and IR regions were 0.42, 0.43 and 0.15 in the non-coding regions, while the corresponding values in the coding regions were 0.09, 0.11, and 0.04, respectively (Table S9). All of the results demonstrated that the IR regions were more conserved than the SC regions. The overall sequence divergence based on the p-distance among the 10 Primula species was 0.028143 (Table S10). The pairwise p-distance between the 10 species ranged from 0.005857 to 0.041629 (Table S10). These results suggested that moderate sequence divergence has occurred within the genus Primula.
2.6. Phylogenomic Analysis
To investigate the phylogenetic position of Primula, three datasets (76 shared protein-coding genes, codon positions 1 + 2, and codon position 3) were used to conduct the BI and ML analyses (Figure 5 and Figure S2). The selected models of each dataset were shown in Table 2. Support values were generally high for almost all relationships inferred from 76 shared protein-coding genes (the support values had a range of 78/0.91–100/1) (Figure 5). All phylogenetic trees clearly identified that Primula was monophyletic and more closely related to Androsace with high support values (Figure 5 and Figure S2).
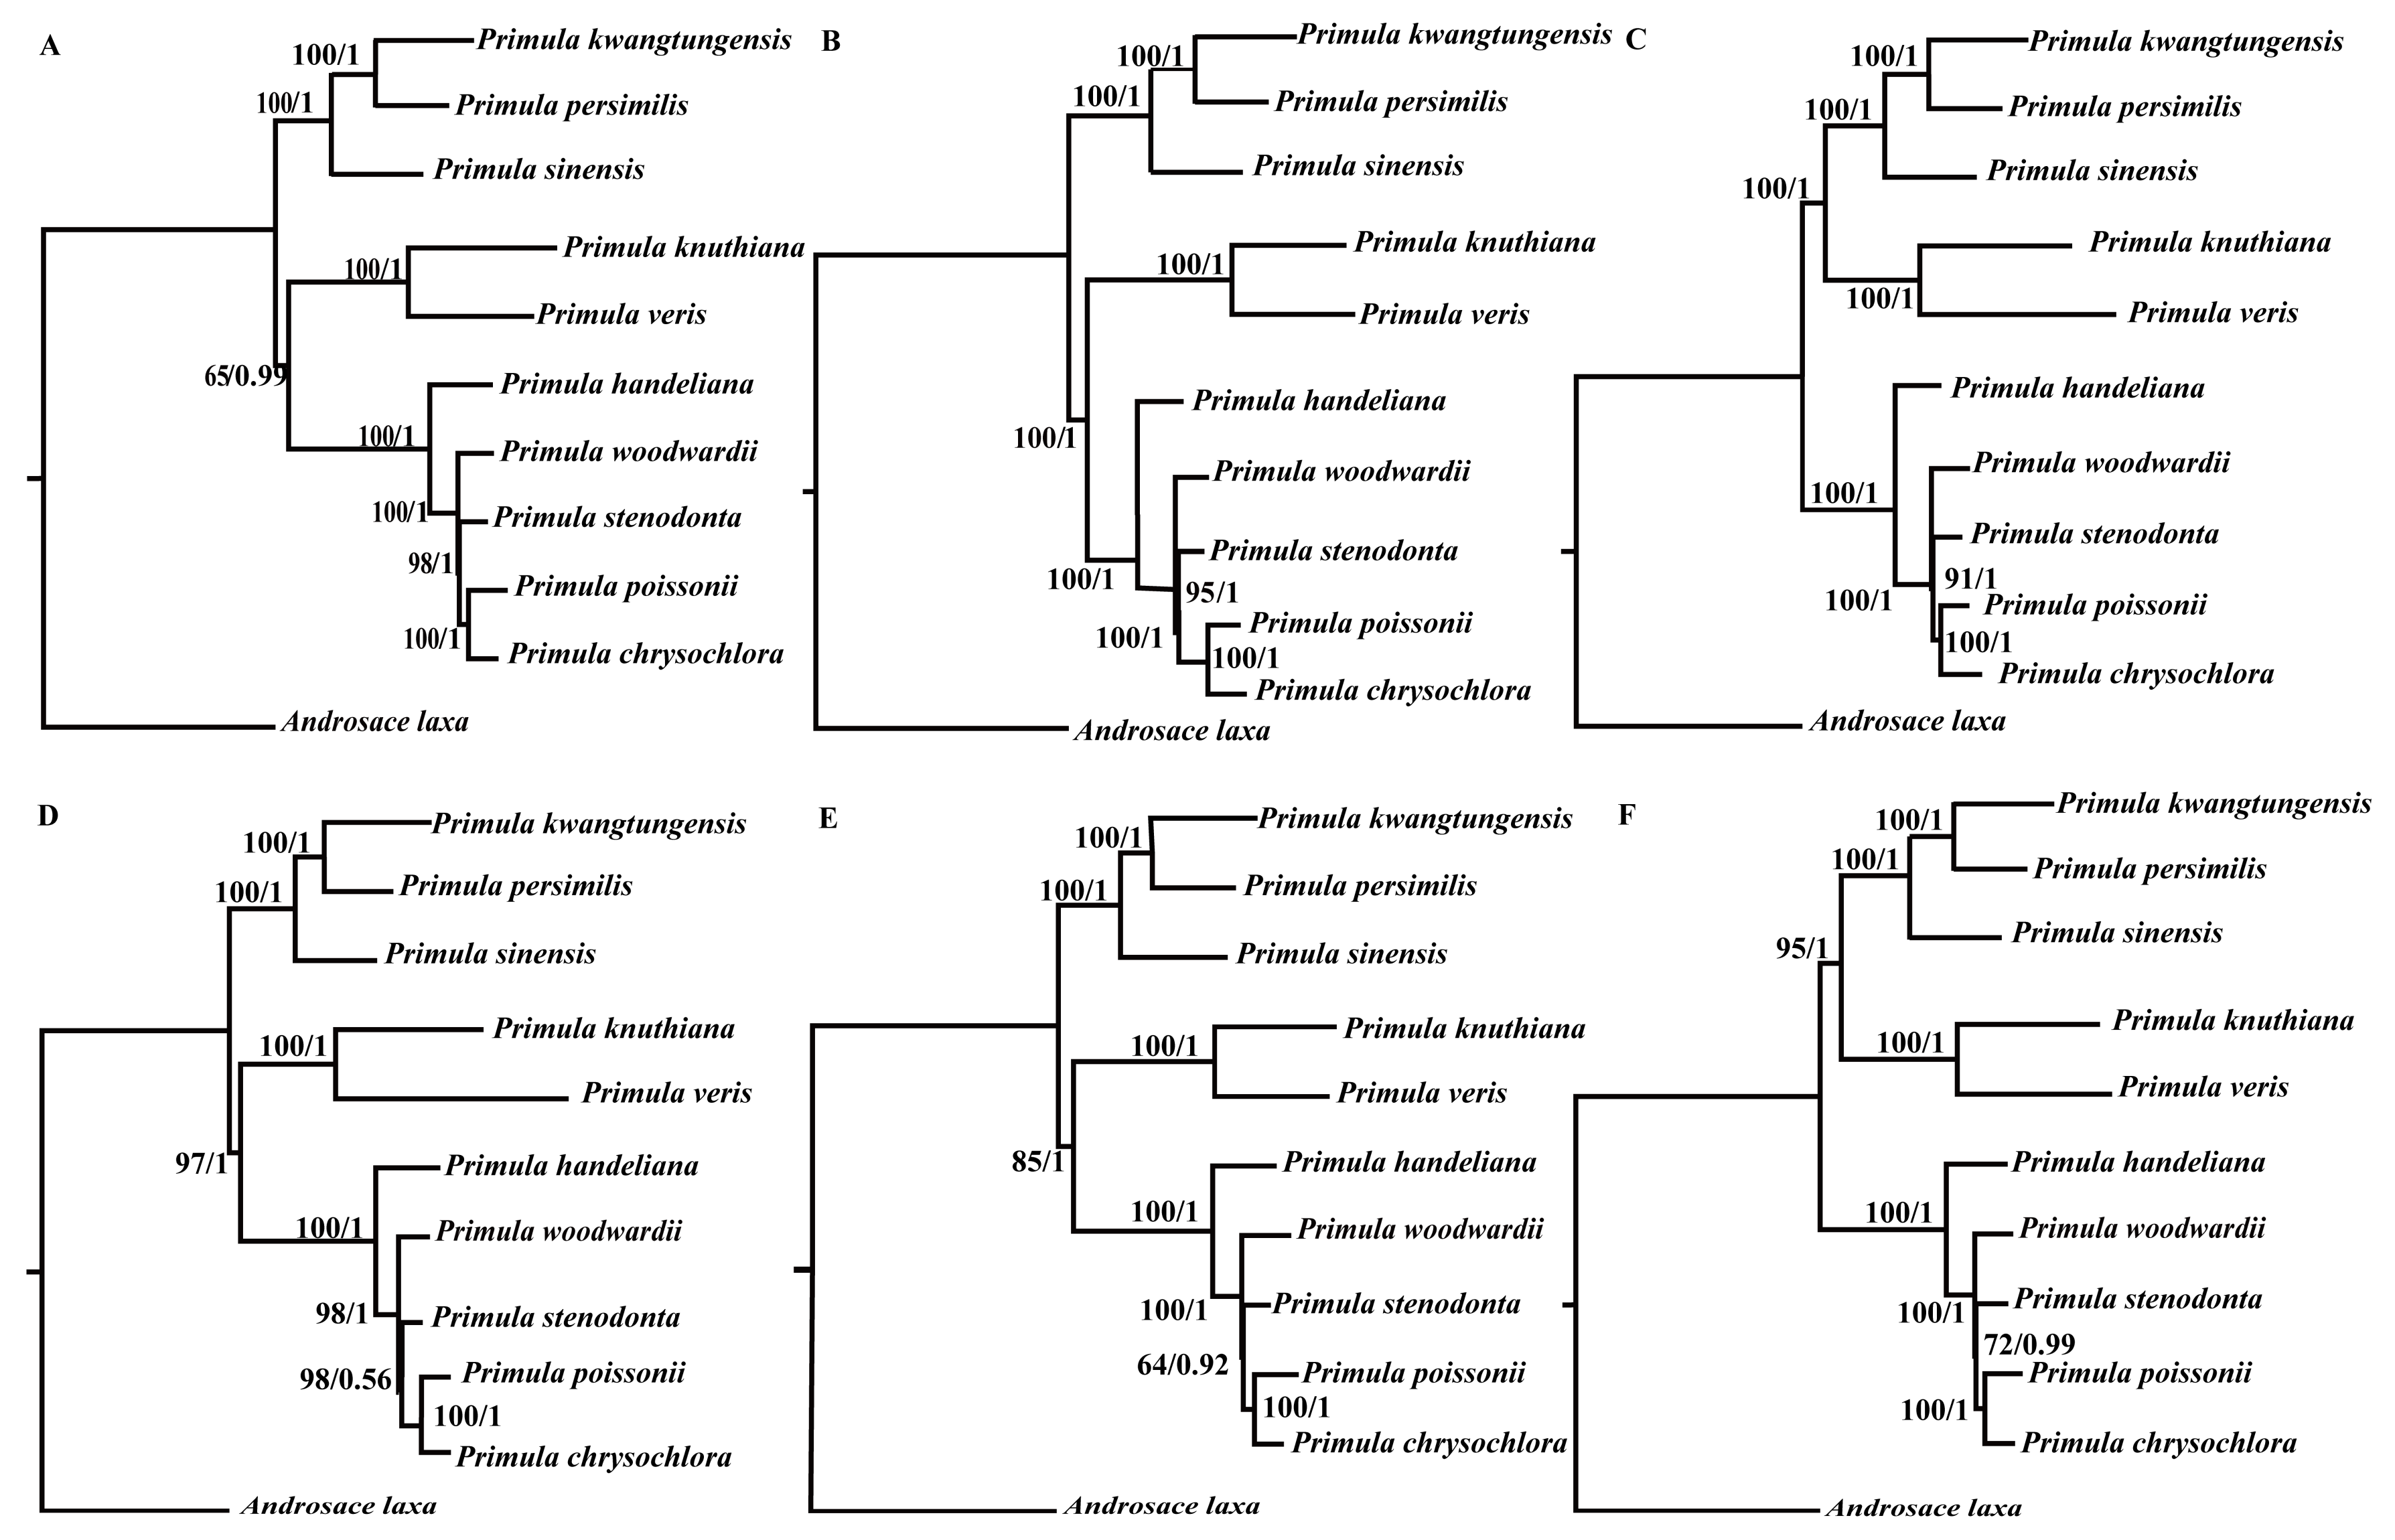
We then constructed six datasets (whole plastid genome, protein-coding regions, LSC, SSC, IRs, and introns & intergenic spacers) to analyze the phylogenetic relationships among the members of the genus Primula. The plastid genome of A. laxa was used as the outgroup. The selected models for each dataset used in BI and ML analyses were displayed in Table 2. The different datasets generally produced congruent phylogenetic trees (two topological structures) with moderate to high support values (Figure 6). All of the phylogenetic trees showed that P. stenodonta, P. poissonii, and P. chrysochlora formed a monophyletic group, where they belong to Sect. Proliferae. Although P. woodwardii and P. handeliana belong to Sect. Crystallophlomis, they were not monophyletic. P. kwangtungensis, P. persimilis, and P. sinensis belong to different sections, but they clustered together in the phylogenetic trees. In addition, P. knuthiana was more closely related to P. veris than other Primula species, but their placements varied in topological structure.
3. Discussion
3.1. Evolution of the Plastid Genome
Most angiosperm plastid genomes are highly conserved in terms of their gene content and order, but gene loss (deletion or production of pseudogenes) has occurred in several angiosperm lineages [26,27]. In our study, the accD gene was found in seven Primula plastid genomes, while it was a pseudogene in P. sinensis and was missing in P. persimilis and P. kwangtungensis. The accD gene encodes the acetyl-CoA carboxylase subunit D, which has been lost either partially or completely from some members of the Poales and Acoraceae [28]. The infA gene was a pseudogene in P. poissonii plastid genome, but it has been entirely lost from the other Primula plastid genome. The infA gene encodes translation initiation factor 1, which assists with the assembly of the translation initiation complex [18]. Similar events have also occurred in other angiosperm plastid genomes, such as those of Hagenia abyssinica [29] and Morella rubra [30], although the plastid genome of A. laxa contains the infA gene. The photosystem assembly factors (ycf3 and ycf4) that act on photosystem I complex [31,32] should be renamed as pafI and pafII (respectively) according to recent studies [18]. Here, we use the new names of the two genes in both Primula and A. laxa plastid genomes.
IRs are the most conserved regions in the plastid genomes, where the contraction and expansion of the IR regions have occurred frequently. Our results indicated more obvious differences at the IR/SC boundaries. Particularly, in the P. kwangtungensis plastid genome, the rps19 gene was located entirely in the LSC. By contrast, IRb extended into the rps19 gene and it even completely crossed the rps19 gene in the P. chrysochlora plastid genome. In addition, IRa extended into the ycf1 genes where the smallest and largest extensions occurred in P. handeliana (888 bp) and P. kwangtungensis (1048 bp). The expansions of IRs into the rps19 gene and ycf1 gene have been also observed in Cardiocrinum [33] and Amana [34]. IR regions contraction and expansion events are relatively common evolutionary phenomena in plants [35]. Moreover, IR region loss was observed in some species [36,37].
Large and complex repeat sequences may play important roles in the arrangement and recombination of the plastid genome [38,39]. In all, 326 repeats were detected in the 10 Primula plastid genomes. Compared with other angiosperm species [40], this number is relatively small. Most of repeats ranged in size from 14 to 62 bp and almost all were not large repeats (>100 bp), which were in a similar manner to those reported in other plants [41,42,43]. Pelargonium, Trifolium, and Trachelium, the most highly rearranged plastid genomes contain a high frequency of large repeats (>100 bp) [44]. Our study revealed that no rearrangement events occurred in Primula, we thus deduced that may be mainly ascribed to no large repeats in these 10 Primula plastid genomes. Repeats located in ycf2 gene occupied 47.8% of the total repeats. The ycf2 gene is the largest gene in the Primula plastid genomes with over 6000 bp in length, and is completely duplicated in the IR regions. This phenomenon has also been reported in Cardiocrinum [33]. SSRs are highly polymorphic, and thus they are employed as molecular markers for population genetics and phylogenetic investigations [45,46]. Notably, the majority of the SSRs in the 10 Primula plastid genomes were the mononucleotide A/T SSRs (74.2%), which supports previous reports that SSRs in the plastid genome generally comprise short polyadenine (polyA) or polythymine (polyT) repeats [47,48]. Most of the SSRs were found in IGS regions (56.9%), followed by CDS regions (25%) and introns (17.9%). The CDS region with the highest number of SSRs was ycf1, as found in other species, such as Cardiocrinum [33] and Vigna radiata [49]. In the 10 Primula plastid genomes, the ycf1 gene usually spanned the small single copy (SSC) and the inverted repeat a (IRa) region. It is very interesting that all but two of the SSRs in the ycf1 gene are distributed in the SSC region. It is possible because the section of ycf1 gene in the IRa region is shorter (less than one kilobase long) than these in SSC region (more than four kilobase long) [50]. The cpSSRs reported here would be potential molecular markers for future studies of Primula species.
According to the results obtained using mVISTA, the Primula plastid genomes exhibited moderate sequence divergence, especially in the non-coding regions. Our study showed that the coding regions were more conserved than the non-coding regions, as found in many plants [41,42,43]. Besides, the IR regions were more conserved than the SC regions as previous studies [51]. This fact that the two IR regions were less variable was attributed to the conservation of the ribosomal RNA genes, which comprised about one-third of the IR region in the plastid genomes [17]. The p-distance results also confirmed that moderate sequence divergence exists within the genus Primula. Compared with related herbaceous plants, trees, and shrubs generally have relatively long generation times and low rates of molecular evolution [52]. Herbs have shorter generation times and show much higher rates of molecular change and variance in rates [52]. The genetic diversity of heterotypic flower plants is higher than that of self-pollinated plants, indicating that genetic variation is easy to occur in interspecific and intraspecific species of heterotypic flower plants [53]. Therefore, the moderate sequence divergence probably be related to biology characteristics of these Primula species, such as perennial herbs, shorter generation times, cross-pollination, distyly, etc.
3.2. Phylogenetic Relationships
Plastid genomes have been successfully used to resolve the phylogenetic relationships in plant groups [23,25,54]. In this study, we used two methods (ML and BI) to construct the phylogenetic trees. We used three datasets to investigate the phylogenetic position of Primula. All of the phylogenetic trees indicated that Primula was monophyletic and more closely related to Androsace in Primulaceae family. Besides, in the genus Primula, all of the phylogenetic trees showed that Sect. Proliferae (P. chrysochlora, P. poissonii, and P. stenodonta) formed a monophyletic group and P. chrysochlora was closely related to P. poissonii [55]. Both P. woodwardii and P. handeliana belong to Sect. Crystallophlomis, but they did not have the closest relationship. The phylogenetic trees indicated that P. woodwardii and Sect. Proliferae were sister groups, then they clustered with P. handeliana in the same clade. Section Crystallophlomis and Proliferae were clustered into one clade in this study, which was also supported by karyotype study [56], but was inconsistent with the morphological work [9]. The placement of P. knuthiana-P. veris clade was uncertain in the phylogenetic tree. This was partly due to the rapid evolution of genus Primula [14,57]. The lack of samples might also affect the results of the phylogenetic analysis. In fact, for this large genus, our study could not fully clarify the relationships among Primula species due to the limited taxa sampled. Hence, more species and comprehensive analyses should be included in the future phylogenetic studies of Primula species. All in all, our analysis based on plastid genomes provides a valuable resource that should facilitate future phylogeny, taxonomy, and evolutionary history studies of this genus.
4. Materials and Methods
4.1. Plant Materials and DNA Extraction
The four plant materials (Primula handeliana, Primula woodwardii, Primula knuthiana, and Androsace laxa) used in this study were sampled from Taibai Mountain (Shaanxi, China; 107.77 °E, 33.95 °N). Total genomic DNA was extracted from silica-dried leaves with a modified CTAB method [58] by Biomarker Technologies Inc., Beijing, China. Voucher specimens were deposited in the Key Laboratory of Resource Biology and Biotechnology, Northwest University. All of the newly generated complete plastid genome sequences were deposited in GenBank (https://www.ncbi.nlm.nih.gov) (Table 1). The complete plastid genomes of Primula poissonii (NC_024543) [59], Primula sinensis (NC_030609) [57], Primula veris (NC_031428) [60], Primula kwangtungensis (NC_034371) [61], Primula chrysochlora (KX668178) [55], Primula stenodonta (KX668176) [62], and Primula persimilis (KX641757) [63] were recovered in order to conduct follow-up analysis (Table S1).
4.2. Illumina Sequencing, Assembly, and Annotation
Whole-genome sequencing was performed using the 150 bp pair-end sequencing method with the Illumina Hiseq 2500 Platform by Biomarker Technologies Inc. (Beijing, China). First, the raw Illumina reads were quality trimmed using the NGSQC Toolkit_v2.3.3 [64] with the default cutoff values. The clean reads were then subjected to reference-guided assembly with the MIRA v4.0.2 program [65] (parameters: job = genome, mapping, accurate; technology = solexa; segment_placement = FR). We used Primula poissonii (NC_024543) and Androsace bulleyana (KU513438) as reference genomes to assemble the Primula species and A. laxa, respectively. The resultant contigs were further assembled using a baiting and iteration method based on MITObim v1.8 [66] with default parameters. In addition, we also used the SPAdes v3.6.2 [67] (k = 33, 55, 77) to assemble the resultant clean reads of four species. We performed de novo assembly in order to verify the validity and accuracy of assembly results. Finally, a few gaps containing some ambiguous bases “N” and low-coverage regions in the assembled plastid genomes were confirmed by PCR-based Sanger sequencing. The primer pairs were designed online with the Primer3 program [68] and listed in the Supplementary Table S2. All of the genes were annotated using Dual Organellar Genome Annotator (DOGMA) software [69] with the default parameters. We then corrected the annotations with the GENEIOUS R8.0.2 program (Biomatters Ltd., Auckland, New Zealand) based on comparisons with related species. Codon usage and relative synonymous codon usage (RSCU) [70] value were estimated for all exons in the protein-coding genes with the CodonW v1.4.2 program [71].
4.3. Identification of Repeat Sequences
We used the online REPuter program [72] to identify dispersed and palindromic repeats with a minimum repeat size of 30 bp and two repeats comprising not less than 90% (Hamming distance = 3). Tandem repeats were detected using the Tandem Repeat Finder program [73] by setting two, seven, and seven as the alignment parameters for match, mismatch, and indels, respectively. The minimum alignment score and maximum period size were 80 and 500, respectively. Simple sequence repeats (SSRs) were detected using the Perl script MISA (http://pgrc.ipk-gatersleben.de/misa/) by setting the minimum number of repeats to 10, 5, 4, 3, 3, and 3 for mono-, di-, tri-, tetra-, penta-, and hexanucleotide SSRs, respectively.
4.4. Whole Plastid Genomes Comparison
Whole genome alignment with 10 Primula plastid genomes was run in MAUVE [74] under default settings to test rearrangement events across genomes.
4.5. Sequence Divergence Analysis
The mVISTA program [75] was used to compare the 10 Primula plastid genomes with P. poissonii as the reference. The percentages of variable characters in each coding region and non-coding region with an aligned length of more than 200 bp were calculated as described in a previous study of Poaceae species [76]. The average genetic divergences of these Primula plastid genomes were estimated using p-distance with MEGA6 [77]. Substitution included transition and transversion. Gaps and missing data were completely deleted.
4.6. Phylogenomic Analysis
To investigate the phylogenetic position of Primula, we used 31 complete plastid genomes (Table S3). Among them, 29 were from Ericales, and two Hydrangea species (Hydrangea serrata and Hydrangea petiolaris) were used as the outgroups. 76 shared protein-coding genes, codon positions 1 + 2, and codon position 3, were used to conduct the phylogenetic analysis.
Then, six datasets, including the whole plastid genomes, protein-coding regions, LSC, SSC, IRs, and introns & intergenic spacers were used to conduct the phylogenetic analysis among genus Primula with A. laxa as the outgroup.
All of the datasets were aligned with MAFFT [78] using the default settings. In order to examine the phylogenetic utility of different datasets, phylogenetic analyses were conducted using maximum likelihood (ML) and Bayesian inference (BI) methods. The ML analysis was conducted using RAxMLv7.2.8 [79] with 1000 bootstrap replicates. The GTRGAMMA model was used in all of the ML analyses, as suggested in the RAxML manual. For the BI analysis, the best substitution model was determined according to Akaike’s information criterion (AIC) with Modeltest v3.7 [80]. The BI analysis was performed using MrBayes v3.1.2 [81]. The Markov chain Monte Carlo (MCMC) algorithm was run for two million generations and the trees were sampled very 100 generations. Convergence was determined by examining the average standard deviation of the split frequencies (<0.01). The first 25% of the trees were discarded as a burn-in and the remaining trees were used to generate the consensus tree.
Supplementary Materials
Supplementary materials can be found at https://www.mdpi.com/1422-0067/19/4/1050/s1.
Acknowledgments
This work was financially supported by the National Natural Science Foundation of China (31670219, 31370353).
Author Contributions
Zhan-Lin Liu conceived and designed the work. Ting Ren, Yanci Yang, and Tao Zhou performed the experiments and analyzed the data. Ting Ren wrote the manuscript. Yanci Yang and Zhan-Lin Liu revised the manuscript. All authors gave final approval of the paper.
Conflicts of Interest
The authors declare no conflict of interest.
References
- Hu, C.M.; Kelso, S. Flora of China; Science Press: Beijing, China, 1996; Volume 15, pp. 99–185. [Google Scholar]
- Richards, A.J. Primula, 2nd ed.; B. T. Batsford Ltd.: London, UK, 2002. [Google Scholar]
- Yan, H.F.; He, C.H.; Peng, C.I.; Hu, C.M.; Hao, G. Circumscription of Primula subgenus Auganthus (Primulaceae) based on chloroplast DNA sequences. J. Syst. Evol. 2010, 48, 123–132. [Google Scholar] [CrossRef]
- Woodell, S. Natural hybridization between the cowsip (Primula veris L.) and the primrose (P. vulgaris Huds.) in Britain. Watsonia 1965, 6, 190–202. [Google Scholar]
- Ornduff, R. Pollen flow in a population of Primula vulgaris Huds. Bot. J. Linn. Soc. 1979, 78, 1–10. [Google Scholar] [CrossRef]
- Shen, L.L. Research advances on the pollination biology of Primula. J. Anhui. Agric. Sci. 2010, 38, 5574–5585. [Google Scholar]
- Li, J.H.; Webster, M.A.; Smith, M.C.; Gilmartin, P.M. Floral heteromorphy in Primula vulgaris: Progress towards isolation and characterization of the S. locus. Ann. Bot. 2011, 108, 715–726. [Google Scholar] [CrossRef] [PubMed]
- Nowak, M.D.; Russo, G.; Schlapbach, R.; Huu, C.N.; Lenhard, M.; Conti, E. The draft genome of Primula veris yields insights into the molecular basis of heterostyly. Genome Biol. 2015, 16, 12. [Google Scholar] [CrossRef] [PubMed] [Green Version]
- Smith, W.W.; Fletcher, H.R. XVII.–The genus Primula: Sections Obconica, Sinenses, Reinii, Pinnatae, Malacoides, Bullatae, Carolinella, Grandis and Denticulata. Trans. R. Soc. Edinb. 1947, 61, 415–478. [Google Scholar] [CrossRef]
- Wendelbo, P. Studies in Primulaceae. II. An account of Primula subgenus Sphondylia (Syn. Sect. Floribundae) with a review of the subdivisions of the genus. Matematisk-Naturvitenskapelig Ser. 1961, 11, 1–46. [Google Scholar]
- Richards, A.J. Primula; B. T. Batsford Ltd.: London, UK, 1993. [Google Scholar]
- Conti, E.; Suring, E.; Boyd, D.; Jorgensen, J.; Grant, J.; Kelso, S. Phylogenetic relationships and character evolution in Primula L.: The usefulness of ITS sequence data. Plant Biosyst. 2000, 134, 385–392. [Google Scholar] [CrossRef]
- Mast, A.R.; Kelso, S.; Richards, A.J.; Lang, D.J.; Feller, D.M.; Conti, E. Phylogenetic relationships in Primula L. and related genera (Primulaceae) based on noncoding chloroplast DNA. Int. J. Plant Sci. 2001, 162, 1381–1400. [Google Scholar] [CrossRef]
- Yan, H.F.; Liu, Y.J.; Xie, X.F.; Zhang, C.Y.; Hu, C.M.; Hao, G.; Ge, X.J. DNA barcoding evaluation and its taxonomic implications in the species-rich genus Primula L. in China. PLoS ONE 2015, 10, e0122903. [Google Scholar] [CrossRef] [PubMed]
- Ravi, V.; Khurana, J.P.; Tyagi, A.K.; Khurana, P. An update on chloroplast genomes. Plant Syst. Evol. 2008, 271, 101–122. [Google Scholar] [CrossRef]
- Jansen, R.K.; Raubeson, L.A.; Boore, J.L.; Chumley, T.W.; Haberle, R.C.; Wyman, S.K. Methods for obtaining and analyzing whole chloroplast genome sequences. Methods Enzymol. 2005, 395, 348–384. [Google Scholar] [PubMed]
- Palmer, J.D. Comparative organization of chloroplast genomes. Annu. Rev. Genet. 1985, 19, 325–354. [Google Scholar] [CrossRef] [PubMed]
- Wicke, S.; Schneeweiss, G.M.; dePamphilis, C.W.; Müller, K.F.; Quandt, D. The evolution of the plastid chromosome in land plants: Gene content, gene order, gene function. Plant Mol. Biol. 2011, 76, 273–297. [Google Scholar] [CrossRef] [PubMed]
- Jansen, R.K.; Cai, Z.Q.; Raubeson, L.A.; Daniell, H.; dePamphilis, C.W.; Leebens-Mack, J.; Müller, K.F.; Guisinger-Bellian, M.; Haberle, C.R.; Hansen, A.K.; et al. Analysis of 81 genes from 64 plastid genomes resolves relationships in angiosperms and identifies genome-scale evolutionary patterns. Proc. Natl. Acad. Sci. USA 2007, 104, 19369–19374. [Google Scholar] [CrossRef] [PubMed]
- Moore, M.J.; Bell, C.D.; Soltis, P.S.; Soltis, D.E. Using plastid genome-scale data to resolve enigmatic relationships among basal angiosperms. Proc. Natl. Acad. Sci. USA 2007, 104, 19363–19368. [Google Scholar] [CrossRef] [PubMed]
- Cronn, R.; Liston, A.; Parks, M.; Gernandt, D.S.; Shen, R.; Mockler, T. Multiplex sequencing of plant chloroplast genomes using Solexa sequencing-by-synthesis technology. Nucleic Acids Res. 2008, 36, e122. [Google Scholar] [CrossRef] [PubMed]
- Mardis, E.R. The impact of next-generation sequencing technology on genetics. Trends Genet. 2008, 24, 133–141. [Google Scholar] [CrossRef] [PubMed]
- Luo, Y.; Ma, P.F.; Li, H.T.; Yang, J.B.; Wang, H.; Li, D.Z. Plastid phylogenomic analyses resolve Tofieldiaceae as the root of the early diverging monocot order Alismatales. Genome Biol. Evol. 2016, 8, 932–945. [Google Scholar] [CrossRef] [PubMed]
- Carbonell-Caballero, J.; Alonso, R.; Ibañez, V.; Terol, J.; Talon, M.; Dopazo, J. A phylogenetic analysis of 34 chloroplast genomes elucidates the relationships between wild and domestic species within the genus Citrus. Mol. Biol. Evol. 2015, 32, 2015–2035. [Google Scholar] [CrossRef] [PubMed]
- Zhang, S.D.; Jin, J.J.; Chen, S.Y.; Chase, M.W.; Soltis, D.E.; Li, H.T.; Yang, J.B.; Li, D.Z.; Yi, T.S. Diversification of Rosaceae since the Late Cretaceous based on plastid phylogenomics. New Phytol. 2017, 214, 1355–1367. [Google Scholar] [CrossRef] [PubMed]
- Braukmann, T.; Kuzmina, M.; Stefanović, S. Plastid genome evolution across the genus Cuscuta (Convolvulaceae): Two clades within subgenus Grammica exhibit extensive gene loss. J. Exp. Bot. 2013, 64, 977–989. [Google Scholar] [CrossRef] [PubMed]
- Logacheva, M.D.; Schelkunov, M.I.; Nuraliev, M.S.; Samigullin, T.H.; Penin, A.A. The plastid genome of mycoheterotrophic monocot Petrosavia stellaris exhibits both gene losses and multiple rearrangements. Genome Biol. Evol. 2014, 6, 238–246. [Google Scholar] [CrossRef] [PubMed]
- Katayama, H.; Ogihara, Y. Phylogenetic affinities of the grasses to other monocots as revealed by molecular analysis of chloroplast DNA. Curr. Genet. 1996, 29, 572–581. [Google Scholar] [CrossRef] [PubMed]
- Gichira, A.W.; Li, Z.Z.; Saina, J.K.; Long, Z.C.; Hu, G.W.; Gituru, R.W.; Wang, Q.F.; Chen, J.M. The complete chloroplast genome sequence of an endemic monotypic genus Hagenia (Rosaceae): Structural comparative analysis, gene content and microsatellite detection. PeerJ 2017, 5, e2846. [Google Scholar] [CrossRef] [PubMed]
- Liu, L.X.; Li, R.; Worth, J.R.; Li, X.; Li, P.; Cameron, K.M.; Fu, C.X. The complete chloroplast genome of Chinese bayberry (Morella rubra, Myricaceae): Implications for understanding the evolution of Fagales. Front. Plant Sci. 2017, 8. [Google Scholar] [CrossRef] [PubMed]
- Naver, H.; Boudreau, E.; Rochaix, J.D. Functional studies of Ycf3: Its role in assembly of photosystem I and interactions with some of its subunits. Plant Cell 2001, 13, 2731–2745. [Google Scholar] [CrossRef] [PubMed]
- Ozawa, S.I.; Nield, J.; Terao, A.; Stauber, E.J.; Hippler, M.; Koike, H.; Rochaix, J.D.; Takahashi, Y. Biochemical and structural studies of the large Ycf4-photosystem I assembly complex of the green alga Chlamydomonas reinhardtii. Plant Cell 2009, 21, 2424–2442. [Google Scholar] [CrossRef] [PubMed]
- Lu, R.S.; Li, P.; Qiu, Y.X. The complete chloroplast genomes of three Cardiocrinum (Liliaceae) species: Comparative genomic and phylogenetic analyses. Front. Plant Sci. 2017, 7, 2054. [Google Scholar] [CrossRef] [PubMed]
- Li, P.; Lu, R.S.; Xu, W.Q.; Ohitoma, T.; Cai, M.Q.; Qiu, Y.X.; Cameron, M.K.; Fu, C.X. Comparative genomics and phylogenomics of East Asian tulips (Amana, Liliaceae). Front. Plant Sci. 2017, 8, 451. [Google Scholar] [CrossRef] [PubMed]
- Kim, K.J.; Lee, H.L. Complete chloroplast genome sequences from Korean Ginseng (Panax schinseng Nees) and comparative analysis of sequence evolution among 17 vascular plants. DNA Res. 2004, 11, 247–261. [Google Scholar] [CrossRef] [PubMed]
- Perry, A.S.; Wolfe, K.H. Nucleotide substitution rates in legume chloroplast DNA depend on the presence of the inverted repeat. J. Mol. Evol. 2002, 55, 501–508. [Google Scholar] [CrossRef] [PubMed]
- Yi, X.; Gao, L.; Wang, B.; Su, Y.J.; Wang, T. The complete chloroplast genome sequence of Cephalotaxus oliveri (Cephalotaxaceae): Evolutionary comparison of Cephalotaxus chloroplast DNAs and insights into the loss of inverted repeat copies in Gymnosperms. Genome Biol. Evol. 2013, 5, 688–698. [Google Scholar] [CrossRef] [PubMed]
- Ogihara, Y.; Terachi, T.; Sasakuma, T. Intramolecular recombination of chloroplast genome mediated by short direct-repeat sequences in wheat species. Proc. Natl. Acad. Sci. USA 1988, 85, 8573–8577. [Google Scholar] [CrossRef] [PubMed]
- Weng, M.L.; Blazier, J.C.; Govindu, M.; Jansen, R.K. Reconstruction of the ancestral plastid genome in Geraniaceae reveals a correlation between genome rearrangements, repeats and nucleotide substitution rates. Mol. Biol. Evol. 2013, 31, 645–659. [Google Scholar] [CrossRef] [PubMed]
- Zhang, X.; Zhou, T.; Kanwal, N.; Zhao, Y.M.; Bai, G.Q.; Zhao, G.F. Completion of eight Gynostemma BL. (Cucurbitaceae) chloroplast genomes: Characterization, comparative analysis, and phylogenetic relationships. Front. Plant Sci. 2017, 8, 1583. [Google Scholar] [CrossRef] [PubMed]
- Hu, Y.H.; Woeste, K.E.; Zhao, P. Completion of the chloroplast genomes of five Chinese Juglans and their contribution to chloroplast phylogeny. Front. Plant Sci. 2016, 7, 1955. [Google Scholar] [CrossRef] [PubMed]
- Yang, Y.C.; Zhou, T.; Duan, D.; Yang, J.; Feng, L.; Zhao, G.F. Comparative analysis of the complete chloroplast genomes of five Quercus species. Front. Plant Sci. 2016, 7, 959. [Google Scholar] [CrossRef] [PubMed]
- Zhou, T.; Chen, C.; Wei, Y.; Chang, Y.X.; Bai, G.Q.; Li, Z.H.; Kanwal, N.; Zhao, G.F. Comparative transcriptome and chloroplast genome analyses of two related Dipteronia species. Front. Plant Sci. 2016, 7, 1512. [Google Scholar] [CrossRef] [PubMed]
- Guisinger, M.M.; Kuehl, J.V.; Boore, J.L.; Jansen, R.K. Extreme reconfiguration of plastid genomes in the angiosperm family Geraniaceae: Rearrangements, repeats, and codon usage. Mol. Biol. Evol. 2011, 28, 583–600. [Google Scholar] [CrossRef] [PubMed]
- Powell, W.; Morgante, M.; Andre, C.; McNicol, J.W.; Machray, G.C.; Doyle, J.J. Hypervariable microsatellites provide a general source of polymorphic DNA markers for the chloroplast genome. Curr. Biol. 1995, 5, 1023–1029. [Google Scholar] [CrossRef]
- He, S.L.; Wang, Y.S.; Volis, S.; Li, D.Z.; Yi, T.S. Genetic diversity and population structure: Implications for conservation of wild soybean (Glycine soja Sieb. et Zucc) based on nuclear and chloroplast microsatellite variation. Int. J. Mol. Sci. 2012, 13, 12608–12628. [Google Scholar] [CrossRef] [PubMed]
- Kuang, D.Y.; Wu, H.; Wang, Y.L.; Gao, L.M.; Zhang, S.Z.; Lu, L. Complete chloroplast genome sequence of Magnolia kwangsiensis (Magnoliaceae): Implication for DNA barcoding and population genetics. Genome 2011, 54, 663–673. [Google Scholar] [CrossRef] [PubMed]
- Martin, G.; Baurens, F.C.; Cardi, C.; Aury, J.M.; D’Hont, A. The complete chloroplast genome of banana (Musa acuminata, Zingiberales): Insight into plastid monocotyledon evolution. PLoS ONE 2013, 8, e67350. [Google Scholar] [CrossRef] [PubMed]
- Tangphatsornruang, S.; Sangsrakru, D.; Chanprasert, J.; Uthaipaisanwong, P.; Yoocha, T.; Jomchai, N.; Tragoonrung, S. The chloroplast genome sequence of mungbean (Vigna radiata) determined by high-throughput pyrosequencing: Structural organization and phylogenetic relationships. DNA Res. 2009, 17, 11–22. [Google Scholar] [CrossRef] [PubMed]
- Dong, W.P.; Xu, C.; Li, C.H.; Sun, J.H.; Zuo, Y.J.; Shi, S.; Cheng, T.; Guo, J.J.; Zhou, S.L. ycf1, the most promising plastid DNA barcode of land plants. Sci. Rep. 2015, 5. [Google Scholar] [CrossRef] [PubMed]
- Zhu, A.D.; Guo, W.H.; Gupta, S.; Fan, W.S.; Mower, J.P. Evolutionary dynamics of the plastid inverted repeat: The effects of expansion, contraction, and loss on substitution rates. New Phytol. 2016, 209, 1747–1756. [Google Scholar] [CrossRef] [PubMed]
- Smith, S.A.; Donoghue, M.J. Rates of molecular evolution are linked to life history in flowering plants. Science 2008, 322, 86–89. [Google Scholar] [CrossRef] [PubMed]
- Weller, S.G.; Sakai, A.K.; Straub, C. Allozyme diversity and genetic identity in Schiedea and Alsinidendron (Caryophyllaceae: Alsinoideae) in the Hawaiian Islands. Evolution 1996, 50, 23–34. [Google Scholar] [CrossRef] [PubMed]
- Ma, P.F.; Zhang, Y.X.; Zeng, C.X.; Guo, Z.H.; Li, D.Z. Chloroplast phylogenomic analyses resolve deep-level relationships of an intractable bamboo tribe Arundinarieae (Poaceae). Syst. Biol. 2014, 63, 933–950. [Google Scholar] [CrossRef] [PubMed]
- Zhang, C.Y.; Liu, T.J.; Xu, Y.; Yan, H.F. Characterization of the whole chloroplast genome of a rare candelabra primrose Primula chrysochlora (Primulaceae). Conserv. Genet. Resour. 2017, 9, 361–363. [Google Scholar] [CrossRef]
- Bruun, H.G. Cytological Studies in Primula with Special Reference to the Relation between the Karyology and Taxonomy of the Genus. Ph.D. Thesis, Acta Universitatis Upsaliensis, Uppsala, Sweden, 1932. [Google Scholar]
- Liu, T.J.; Zhang, C.Y.; Yan, H.F.; Zhang, L.; Ge, X.J.; Hao, G. Complete plastid genome sequence of Primula sinensis (Primulaceae): Structure comparison, sequence variation and evidence for accD transfer to nucleus. PeerJ 2016, 4, e2101. [Google Scholar] [CrossRef] [PubMed]
- Doyle, J.J. A rapid DNA isolation procedure for small quantities of fresh leaf tissue. Phytochem. Bull. 1987, 19, 11–15. [Google Scholar]
- Yang, J.B.; Li, D.Z.; Li, H.T. Highly effective sequencing whole chloroplast genomes of angiosperms by nine novel universal primer pairs. Mol. Ecol. Resour. 2014, 14, 1024–1031. [Google Scholar] [CrossRef] [PubMed]
- Zhou, T.; Zhao, J.X.; Chen, C.; Meng, X.; Zhao, G.F. Characterization of the complete chloroplast genome sequence of Primula veris (Ericales: Primulaceae). Conserv. Genet. Resour. 2016, 8, 455–458. [Google Scholar] [CrossRef]
- Zhang, C.Y.; Liu, T.J.; Xu, Y.; Yan, H.F.; Hao, G.; Ge, X.J. Characterization of the whole chloroplast genome of an endangered species Primula kwangtungensis (Primulaceae). Conserv. Genet. Resour. 2017, 9, 87–89. [Google Scholar] [CrossRef]
- Zhang, C.Y.; Liu, T.J.; Yan, H.F.; Ge, X.J.; Hao, G. The complete chloroplast genome of a rare candelabra primrose Primula stenodonta (Primulaceae). Conserv. Genet. Resour. 2017, 9, 123–125. [Google Scholar] [CrossRef]
- Zhang, C.Y.; Liu, T.J.; Yan, H.F.; Xu, Y. The complete chloroplast genome of Primula persimilis (Primulaceae). Conserv. Genet. Resour. 2017, 9, 189–191. [Google Scholar] [CrossRef]
- Patel, R.K.; Jain, M. NGS QC Toolkit: A toolkit for quality control of next generation sequencing data. PLoS ONE 2012, 7, e30619. [Google Scholar] [CrossRef] [PubMed]
- Chevreux, B.; Pfisterer, T.; Drescher, B.; Driesel, A.J.; Müller, W.E.; Wetter, T.; Suhai, S. Using the miraEST assembler for reliable and automated mRNA transcript assembly and SNP detection in sequenced ESTs. Genome Res. 2004, 14, 1147–1159. [Google Scholar] [CrossRef] [PubMed]
- Hahn, C.; Bachmann, L.; Chevreux, B. Reconstructing mitochondrial genomes directly from genomic next-generation sequencing reads-a baiting and iterative mapping approach. Nucleic Acids Res. 2013, 41, e129. [Google Scholar] [CrossRef] [PubMed]
- Bankevich, A.; Nurk, S.; Antipov, D.; Gurevich, A.A.; Dvorkin, M.; Kulikov, A.S.; Lesin, V.M.; Nikolenko, S.I.; Pham, S.; Prjibelski, A.D.; et al. SPAdes: A new genome assembly algorithm and its applications to single-cell sequencing. J. Comput. Biol. 2012, 19, 455–477. [Google Scholar] [CrossRef] [PubMed]
- Untergrasser, A.; Cutcutache, I.; Koressaar, T.; Ye, J.; Faircloth, B.C.; Remm, M.; Rozen, S.G. Primer3-new capabilities and interfaces. Nucleic Acids Res. 2012, 40, e115. [Google Scholar] [CrossRef] [PubMed]
- Wyman, S.K.; Jansen, R.K.; Boore, J.L. Automatic annotation of organellar genomes with DOGMA. Bioinformatics 2004, 20, 3252–3255. [Google Scholar] [CrossRef] [PubMed]
- Sharp, P.M.; Li, W.H. The codon adaptation index-a measure of directional synonymous codon usage bias, and its potential applications. Nucleic Acids Res. 1987, 15, 1281–1295. [Google Scholar] [CrossRef] [PubMed]
- Peden, J.F. Analysis of codon usage. Ph.D. Thesis, University of Nottingham, University of Nottingham, UK, 1999. [Google Scholar]
- Kurtz, S.; Choudhuri, J.V.; Ohlebusch, E.; Schleiermacher, C.; Stoye, J.; Giegerich, R. REPuter: The manifold applications of repeat analysis on a genomic scale. Nucleic Acids Res. 2001, 29, 4633–4642. [Google Scholar] [CrossRef] [PubMed]
- Benson, G. Tandem repeats finder: A program to analyze DNA sequences. Nucleic Acids Res. 1999, 27, 573–580. [Google Scholar] [CrossRef] [PubMed]
- Darling, A.C.E.; Mau, B.; Blattner, F.R.; Perna, N.T. Mauve: Multiple alignment of conserved genomic sequence with rearrangements. Genome Res. 2004, 14, 1394–1403. [Google Scholar] [CrossRef] [PubMed]
- Frazer, K.A.; Pachter, L.; Poliakov, A.; Rubin, E.M.; Dubchak, I. VISTA: Computational tools for comparative genomics. Nucleic Acids Res. 2004, 32, W273–W279. [Google Scholar] [CrossRef] [PubMed]
- Zhang, Y.J.; Ma, P.F.; Li, D.Z. High-throughput sequencing of six bamboo chloroplast genomes: Phylogenetic implications for temperate woody bamboos (Poaceae: Bambusoideae). PLoS ONE 2011, 6, e20596. [Google Scholar] [CrossRef] [PubMed]
- Tamura, K.; Stecher, G.; Peterson, D.; Filipski, A.; Kumar, S. MEGA6: Molecular evolutionary genetics analysis version 6.0. Mol. Biol. Evol. 2013, 30, 2725–2729. [Google Scholar] [CrossRef] [PubMed]
- Katoh, K.; Standley, D.M. MAFFT multiple sequence alignment software version 7: Improvements in performance and usability. Mol. Biol. Evol. 2013, 30, 772–780. [Google Scholar] [CrossRef] [PubMed]
- Stamatakis, A. RAxML-VI-HPC: Maximum likelihood-based phylogenetic analysis with thousands of taxa and mixed models. Bioinformatics 2006, 22, 2688–2690. [Google Scholar] [CrossRef] [PubMed]
- Posada, D.; Crandall, K.A. Modeltest: Testing the model of DNA substitution. Bioinformatics 1998, 14, 817–818. [Google Scholar] [CrossRef] [PubMed]
- Ronquist, F.; Huelsenbeck, J.P. MrBayes 3: Bayesian phylogenetic inference under mixed models. Bioinformatics 2003, 19, 1572–1574. [Google Scholar] [CrossRef] [PubMed]
Figure 1.
The type of repeated sequences in the 10 Primula plastid genomes. (A) Number of three repeat types; (B) number of repeat sequences by length.
Figure 1.
The type of repeated sequences in the 10 Primula plastid genomes. (A) Number of three repeat types; (B) number of repeat sequences by length.
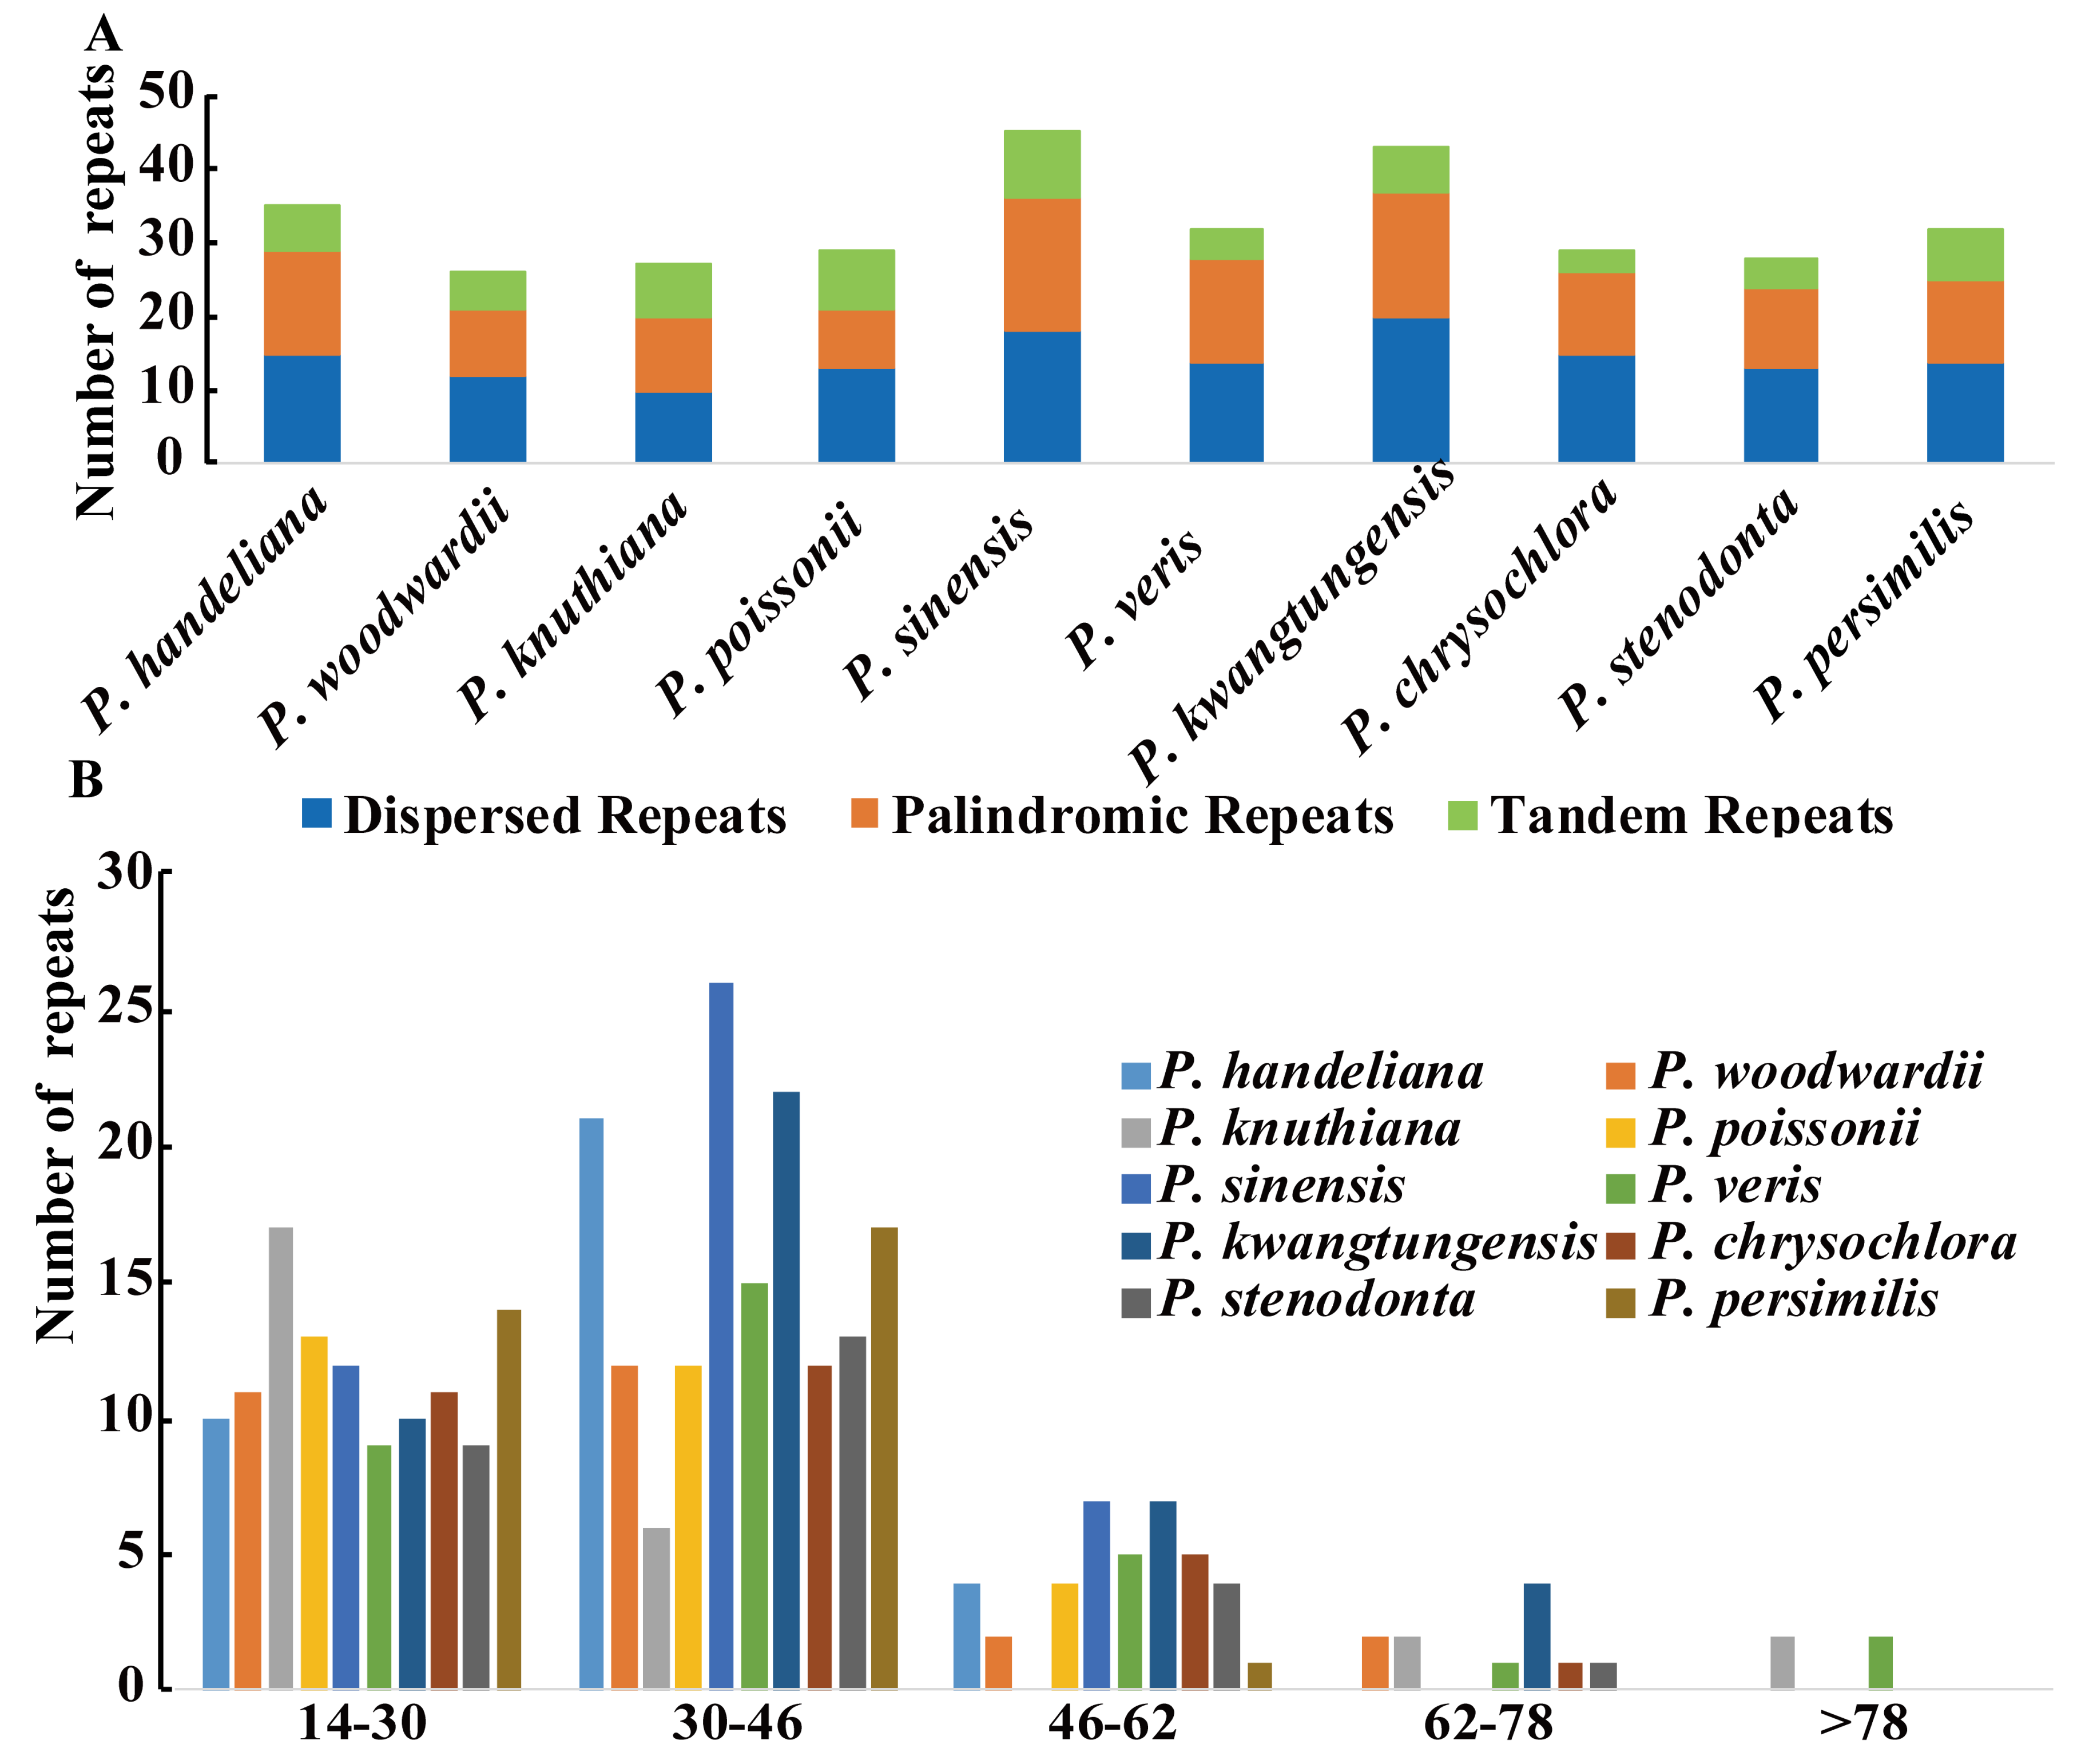
Figure 2.
Simple sequence repeats (SSRs) in the 10 Primula plastid genomes. (A) Number of SSR types; (B) number of mononucleotide A/T and G/C SSRs.
Figure 2.
Simple sequence repeats (SSRs) in the 10 Primula plastid genomes. (A) Number of SSR types; (B) number of mononucleotide A/T and G/C SSRs.
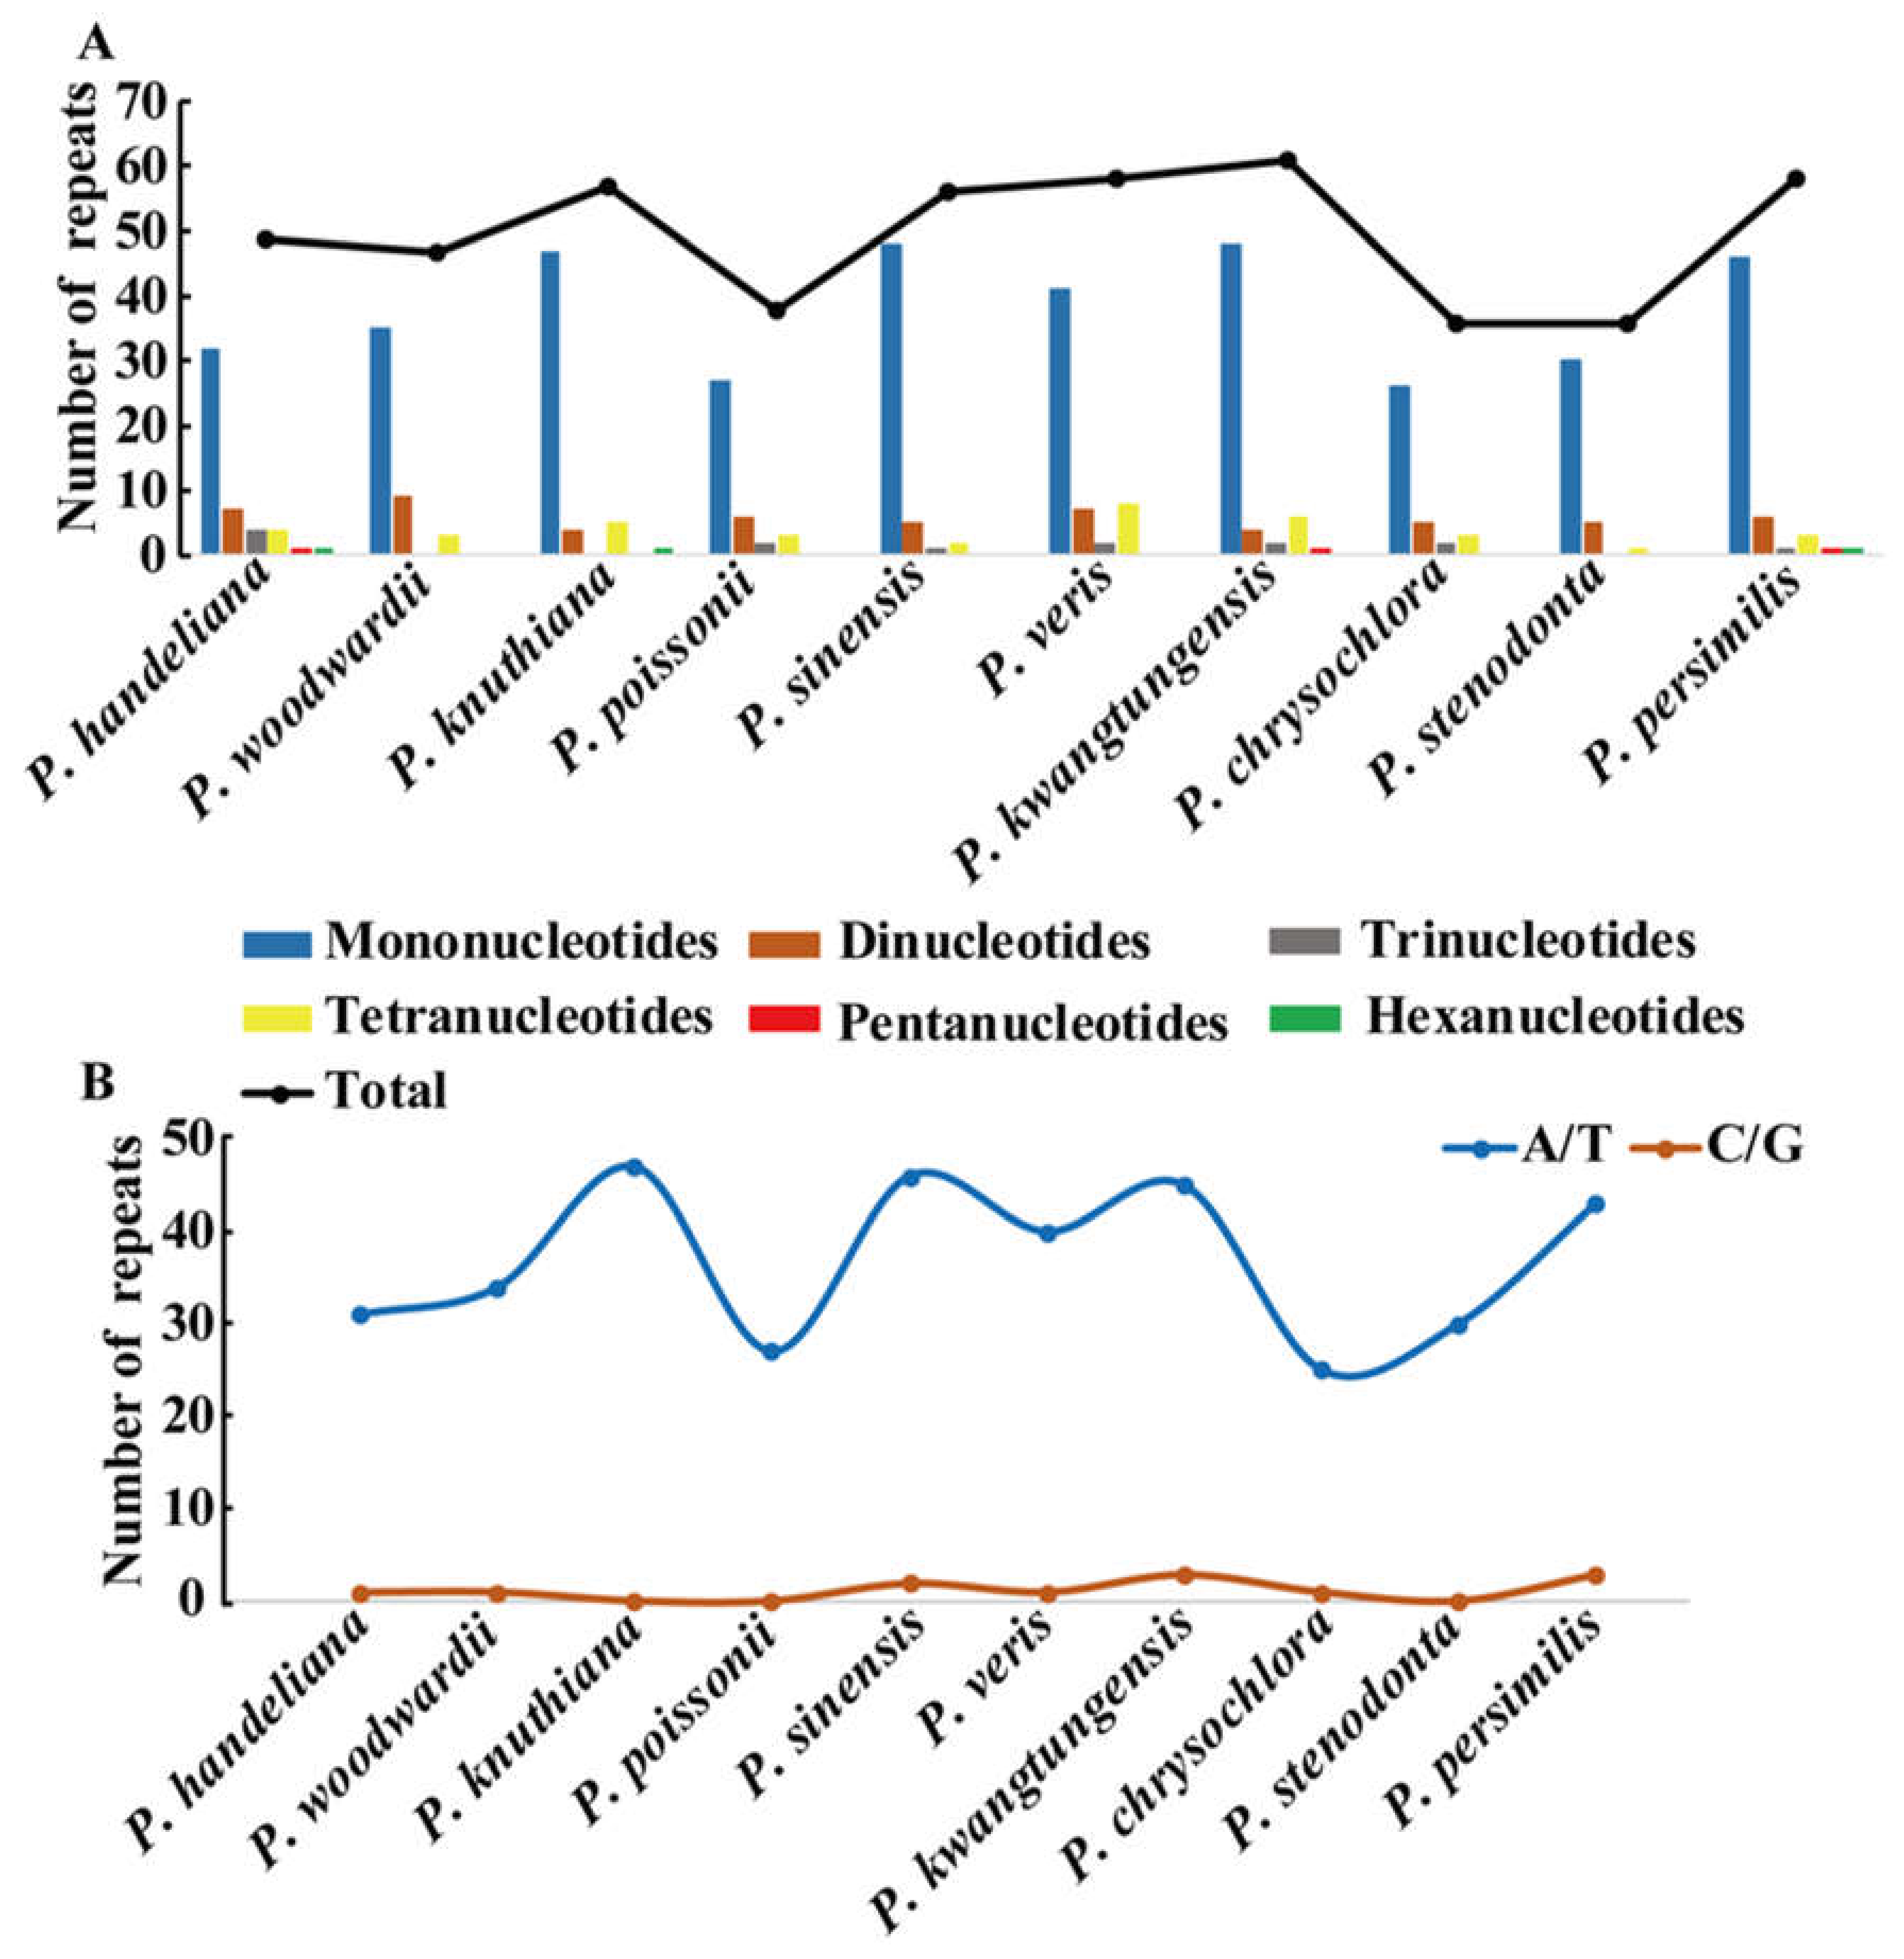
Figure 3.
Comparison of the LSC, IR, and SSC border regions among the 10 Primula plastid genomes. Number above the gene features means the distance between the ends of genes and the borders sites. These features are not to scale.
Figure 3.
Comparison of the LSC, IR, and SSC border regions among the 10 Primula plastid genomes. Number above the gene features means the distance between the ends of genes and the borders sites. These features are not to scale.
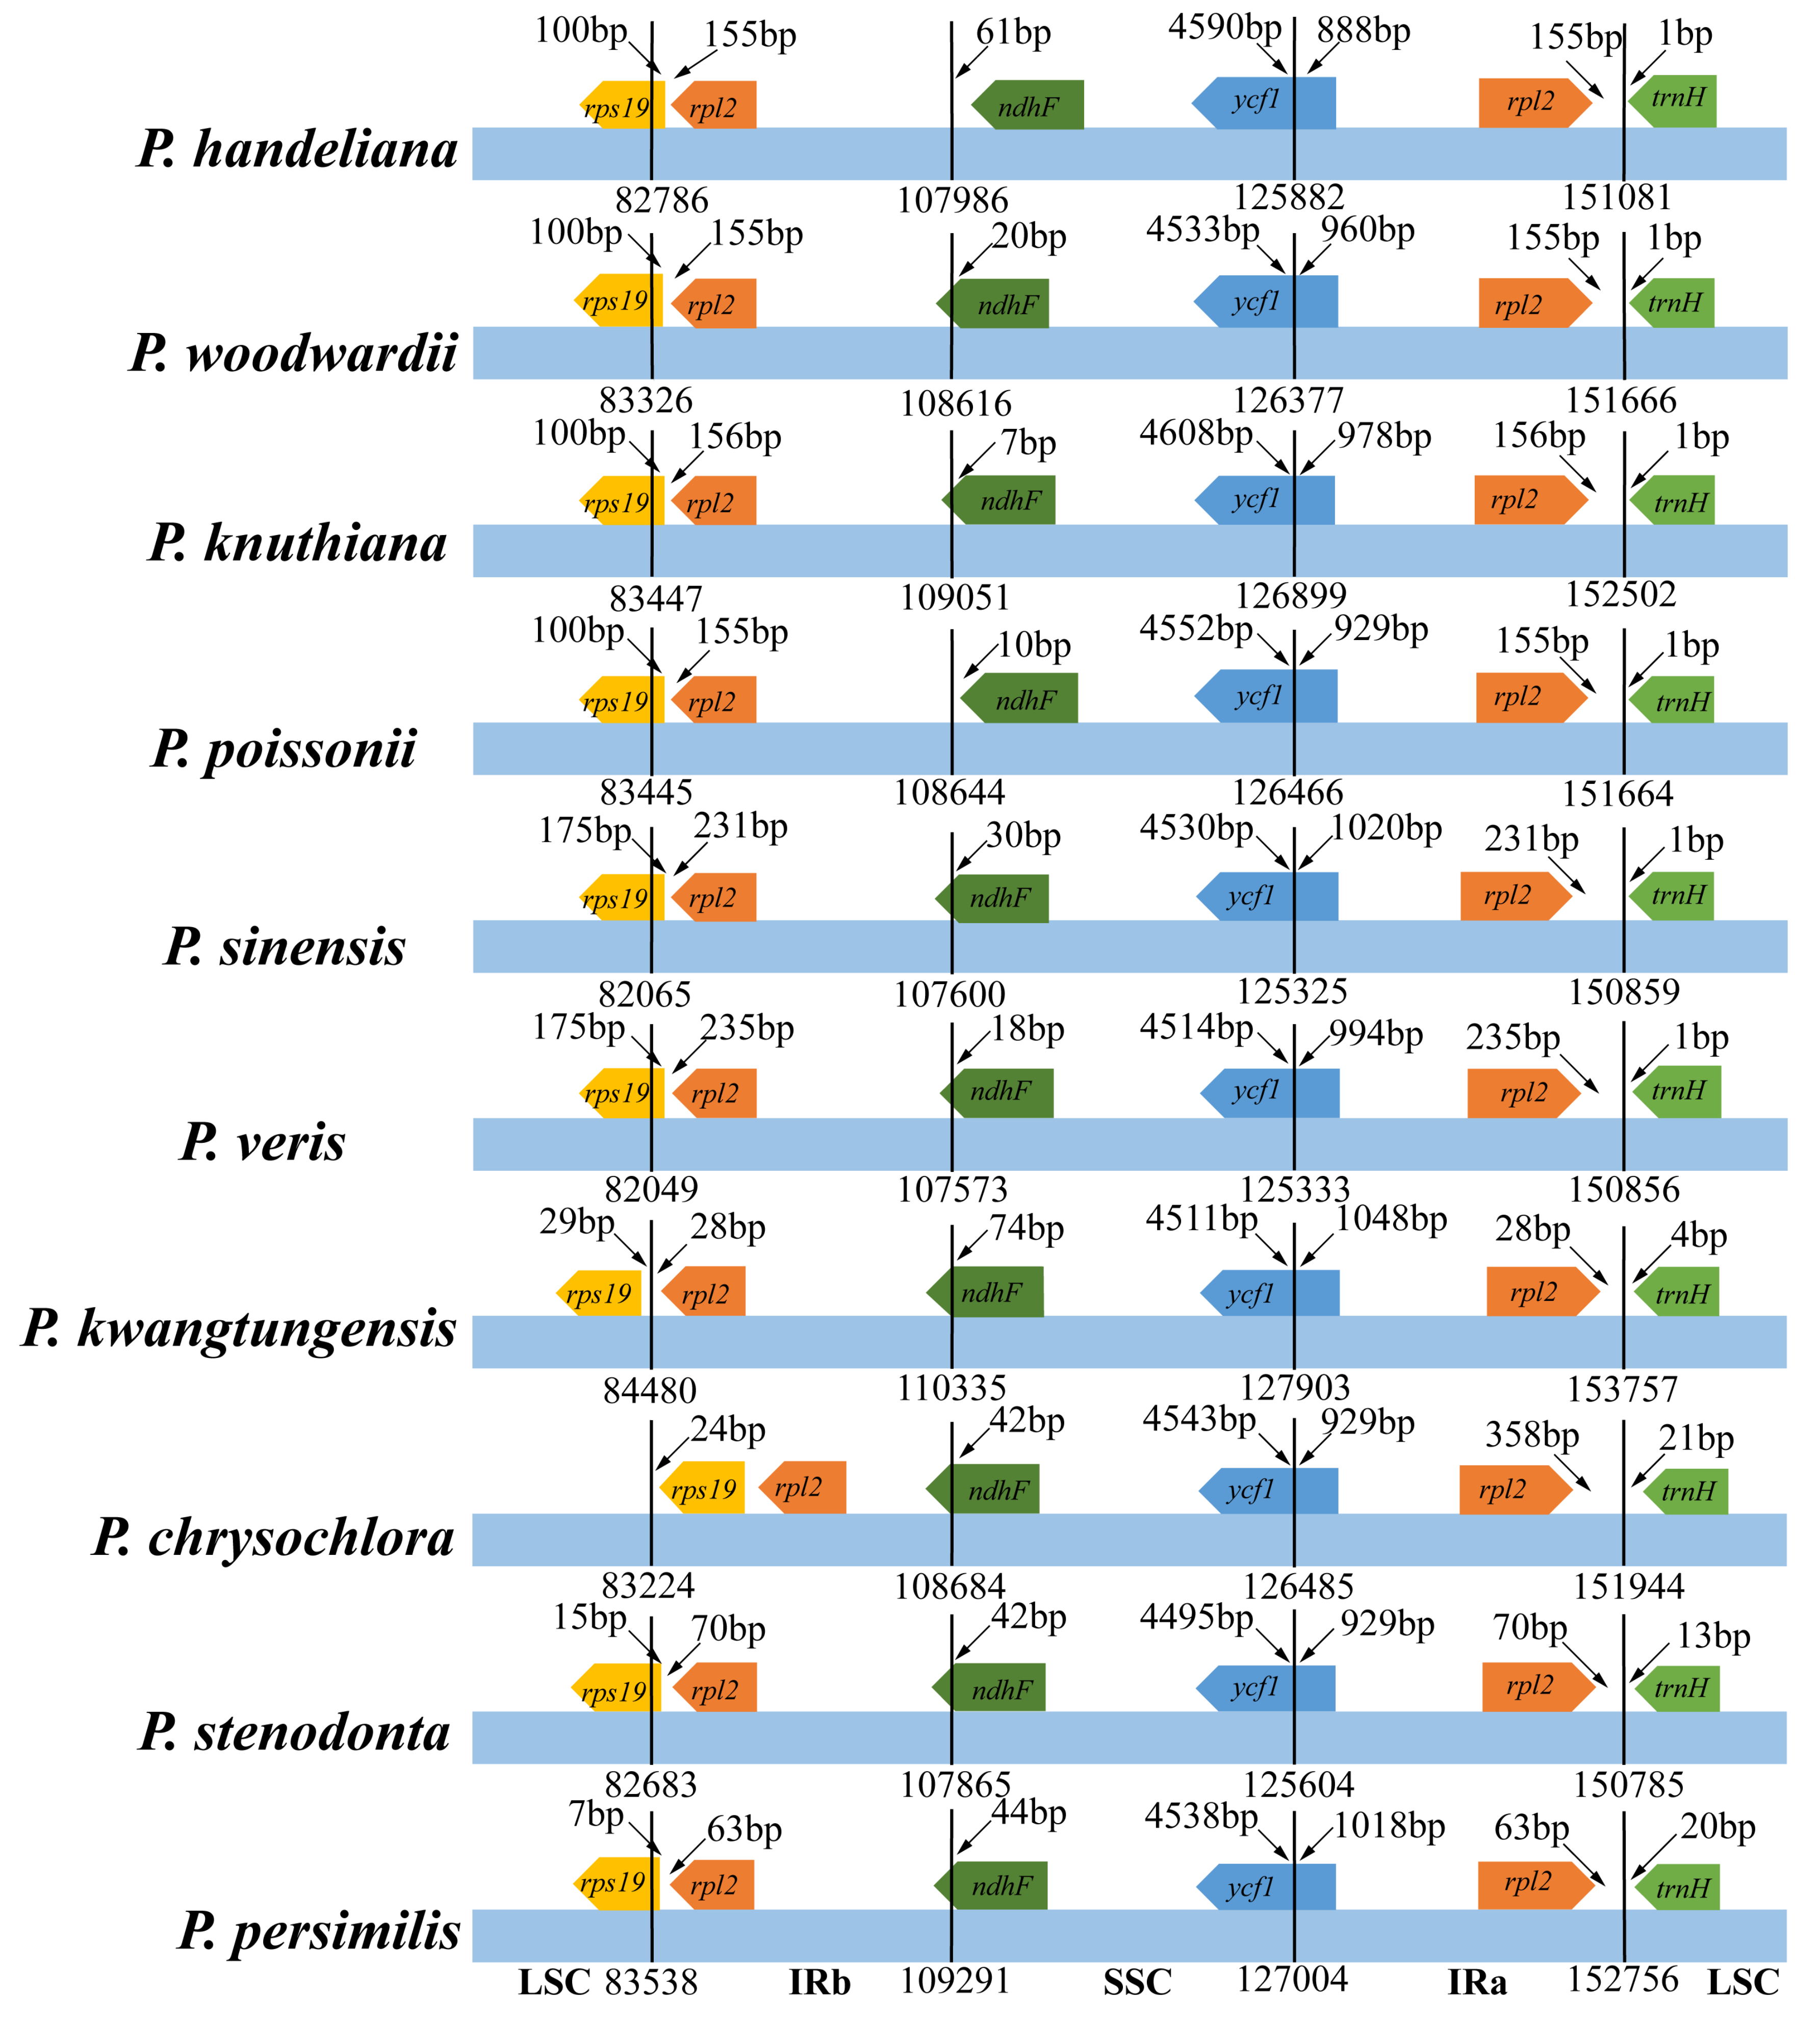
Figure 4.
Sequence identity plot of the 10 Primula plastid genomes, with Primula poissonii as a reference. The y-axis represents % identity ranging from 50% to 100%. Coding and non-coding regions are marked in purple and pink, respectively. The red, black, and gray lines show the IRs, LSC, and SSC regions, respectively.
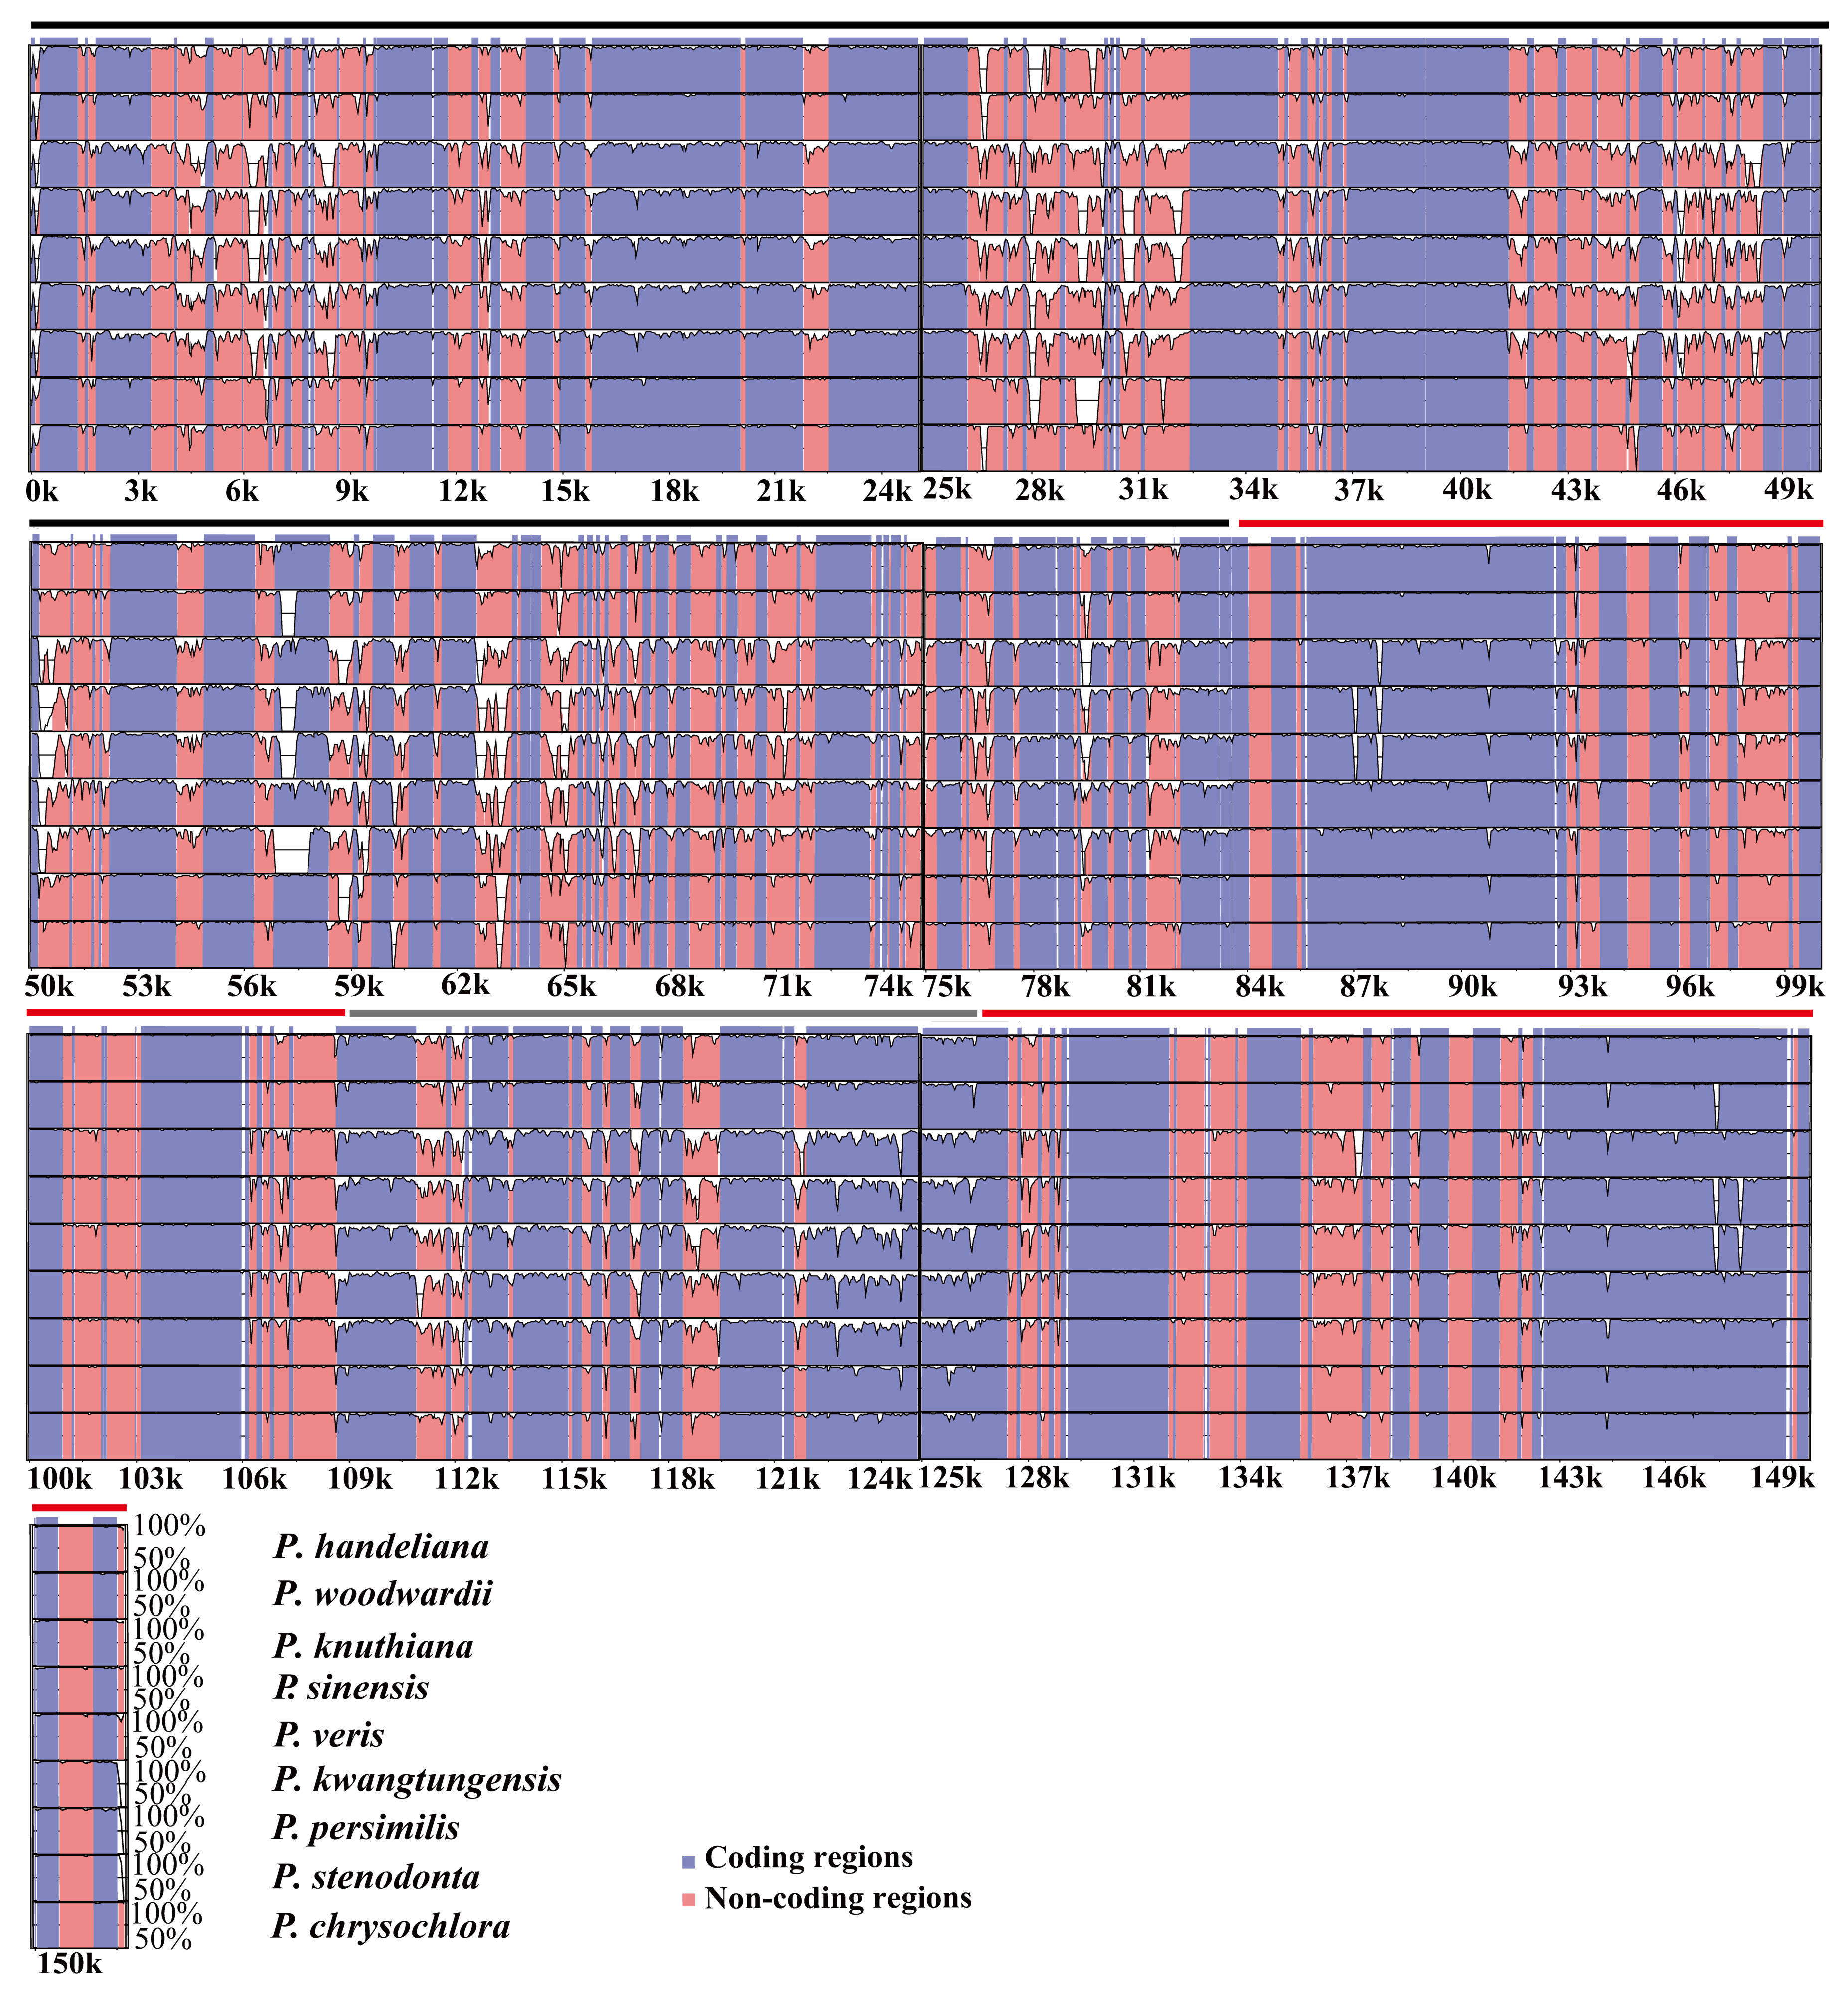
Figure 5.
Phylogenetic relationship of the 31 species inferred from ML and BI analyses based on 76 shared protein-coding genes. The numbers near each node are bootstrap support values and posterior probability. Hydrangea petiolaris and Hydrangea serrata were used as the outgroups.
Figure 5.
Phylogenetic relationship of the 31 species inferred from ML and BI analyses based on 76 shared protein-coding genes. The numbers near each node are bootstrap support values and posterior probability. Hydrangea petiolaris and Hydrangea serrata were used as the outgroups.
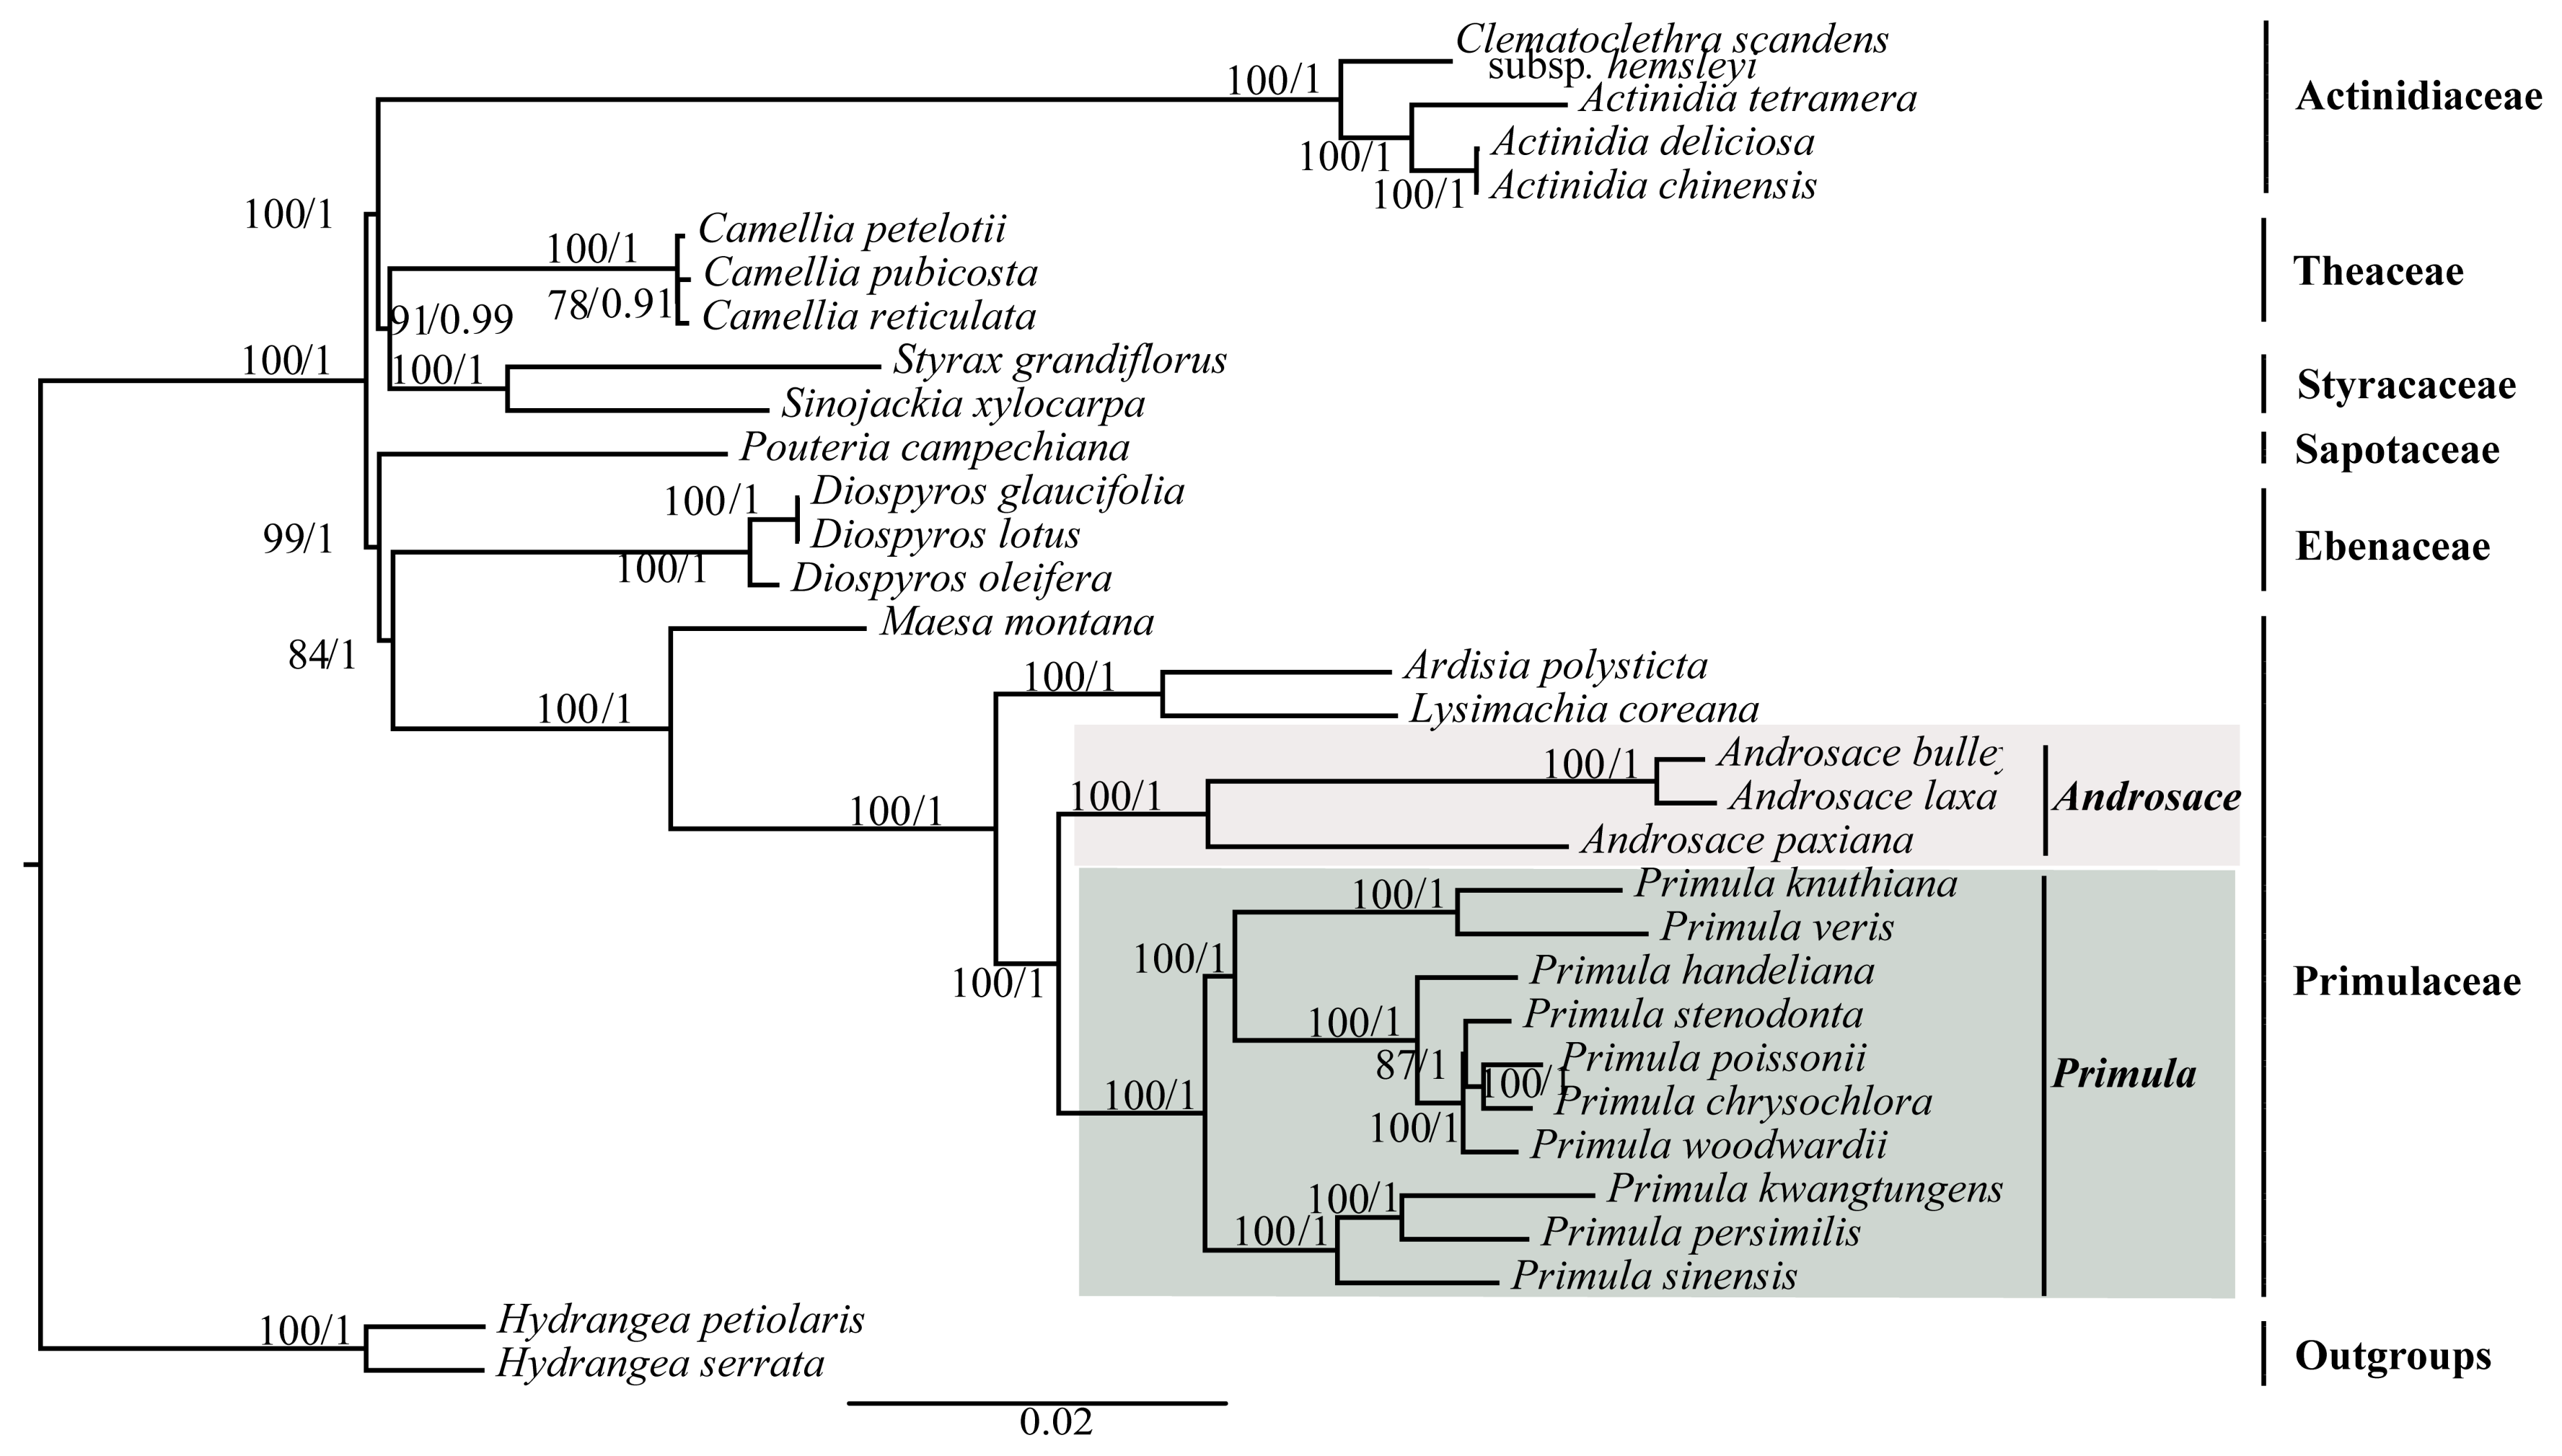
Figure 6.
Phylogenetic relationships of the 10 Primula species and A. laxa inferred from ML and BI analyses. (A) Whole plastid genomes; (B) protein-coding regions; (C) introns and intergenic spacer regions; (D) IR regions; (E) SSC regions; and (F) LSC regions. The numbers near each node are bootstrap support values and posterior probability.

Table 1.
Plastid genomic characteristics of the 10 Primula species and A. laxa.
| Taxa | A. laxa * | P. handeliana * | P. woodwardii * | P. knuthiana * | P. poissonii | P. sinensis | P. veris |
| Assembly reads | 16,137,534 | 12,884,542 | 25,149,710 | 15,928,364 | / | / | / |
| Mean coverage | 293.4× | 482.4× | 508.3× | 405.3× | / | / | / |
| GenBank numbers | MG181220 | MG181221 | MG181222 | MG181223 | NC_024543 | NC_030609 | NC_031428 |
| Total genome size (bp) | 151,942 | 151,081 | 151,666 | 152,502 | 151,664 | 150,859 | 150,856 |
| LSC (bp) | 83,078 | 82,785 | 83,325 | 83,446 | 83,444 | 82,064 | 82,048 |
| IRs (bp) | 25,970 | 25,200 | 25,290 | 25,604 | 25,199 | 25,535 | 25,524 |
| SSC (bp) | 16,924 | 17,896 | 17,761 | 17,848 | 17,822 | 17,725 | 17,760 |
| Total GC content (%) | 37.3 | 37 | 37 | 37 | 37 | 37.2 | 37.1 |
| LSC (%) | 35.2 | 34.9 | 34.9 | 34.9 | 34.9 | 35.2 | 35.1 |
| IRs (%) | 42.7 | 42.9 | 42.8 | 42.7 | 42.9 | 42.8 | 42.7 |
| SSC (%) | 30.9 | 30.2 | 30.2 | 30.3 | 30.1 | 30.5 | 30.2 |
| Total number of genes | 132 | 131 | 131 | 131 | 132 | 131 | 131 |
| Protein-coding | 87 (7) | 86 (7) | 86 (7) | 86 (7) | 86 (7) | 85 (7) | 86 (7) |
| tRNA | 37 (7) | 37 (7) | 37 (7) | 37 (7) | 37 (7) | 37 (7) | 37 (7) |
| rRNA | 8 (4) | 8 (4) | 8 (4) | 8 (4) | 8 (4) | 8 (4) | 8 (4) |
| Pseudogenes | / | / | / | / | infA | accD | / |
| Taxa | P. kwangtungensis | P. chrysochlora | P. stenodonta | P. persimilis | |||
| Raw Base (G) | / | / | / | / | |||
| Mean coverage | / | / | / | / | |||
| GenBank numbers | NC_034371 | KX668178 | KX668176 | KX641757 | |||
| Total genome size (bp) | 153,757 | 151,944 | 150,785 | 152,756 | |||
| LSC (bp) | 84,479 | 83,953 | 82,682 | 83,537 | |||
| IRs (bp) | 25,855 | 25,460 | 25,182 | 25,753 | |||
| SSC (bp) | 17,568 | 17,801 | 17,739 | 17,713 | |||
| Total GC content (%) | 37.1 | 37 | 37.1 | 37.2 | |||
| LSC (%) | 35 | 35 | 35 | 35.2 | |||
| IRs (%) | 42.7 | 42.8 | 43 | 42.8 | |||
| SSC (%) | 30.4 | 30.2 | 30.2 | 30.6 | |||
| Total number of genes | 130 | 131 | 131 | 130 | |||
| Protein-coding | 85 (7) | 86 (7) | 86 (7) | 85 (7) | |||
| tRNA | 37 (7) | 37 (7) | 37 (7) | 37 (7) | |||
| rRNA | 8 (4) | 8 (4) | 8 (4) | 8 (4) | |||
| Pseudogenes | / | / | / | / | |||
*, The four newly generated plastid genomes. LSC, large single copy region, IR, inverted repeat regions, and SSC, small single copy region.
Table 2.
Datasets and selected model in ML and BI analysis
| Datasets | Best Fit Model | Model in ML | Model in BI |
|---|---|---|---|
| 76 shared protein-coding genes | TVM + I + G | GTR + G | TVM + I + G |
| Codon positions 1 + 2 | TVM + I + G | GTR + G | TVM + I + G |
| Codon position 3 | GTR + I + G | GTR + G | GTR + I + G |
| Whole plastid genomes | TVM + I + G | GTR + G | TVM + I + G |
| Protein-coding regions | TVM + I + G | GTR + G | TVM + I + G |
| Introns & intergenic spacers | TVM + I + G | GTR + G | TVM + I + G |
| IRs | TVM + I + G | GTR + G | TVM + I + G |
| LSC | GTR + I + G | GTR + G | GTR + I + G |
| SSC | TVM + I + G | GTR + G | TVM + I + G |
© 2018 by the authors. Licensee MDPI, Basel, Switzerland. This article is an open access article distributed under the terms and conditions of the Creative Commons Attribution (CC BY) license (http://creativecommons.org/licenses/by/4.0/).
Share and Cite
MDPI and ACS Style
Ren, T.; Yang, Y.; Zhou, T.; Liu, Z.-L. Comparative Plastid Genomes of Primula Species: Sequence Divergence and Phylogenetic Relationships. Int. J. Mol. Sci. 2018, 19, 1050. https://doi.org/10.3390/ijms19041050
AMA Style
Ren T, Yang Y, Zhou T, Liu Z-L. Comparative Plastid Genomes of Primula Species: Sequence Divergence and Phylogenetic Relationships. International Journal of Molecular Sciences. 2018; 19(4):1050. https://doi.org/10.3390/ijms19041050
Chicago/Turabian StyleRen, Ting, Yanci Yang, Tao Zhou, and Zhan-Lin Liu. 2018. "Comparative Plastid Genomes of Primula Species: Sequence Divergence and Phylogenetic Relationships" International Journal of Molecular Sciences 19, no. 4: 1050. https://doi.org/10.3390/ijms19041050
Note that from the first issue of 2016, this journal uses article numbers instead of page numbers. See further details here.