Novel (1E,3E,5E)-1,6-bis(Substituted phenyl)hexa-1,3,5-triene Analogs Inhibit Melanogenesis in B16F10 Cells and Zebrafish


Abstract
: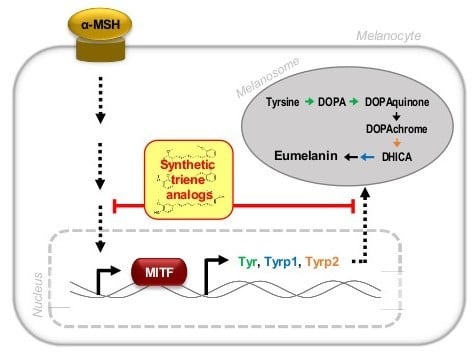
1. Introduction
2. Results
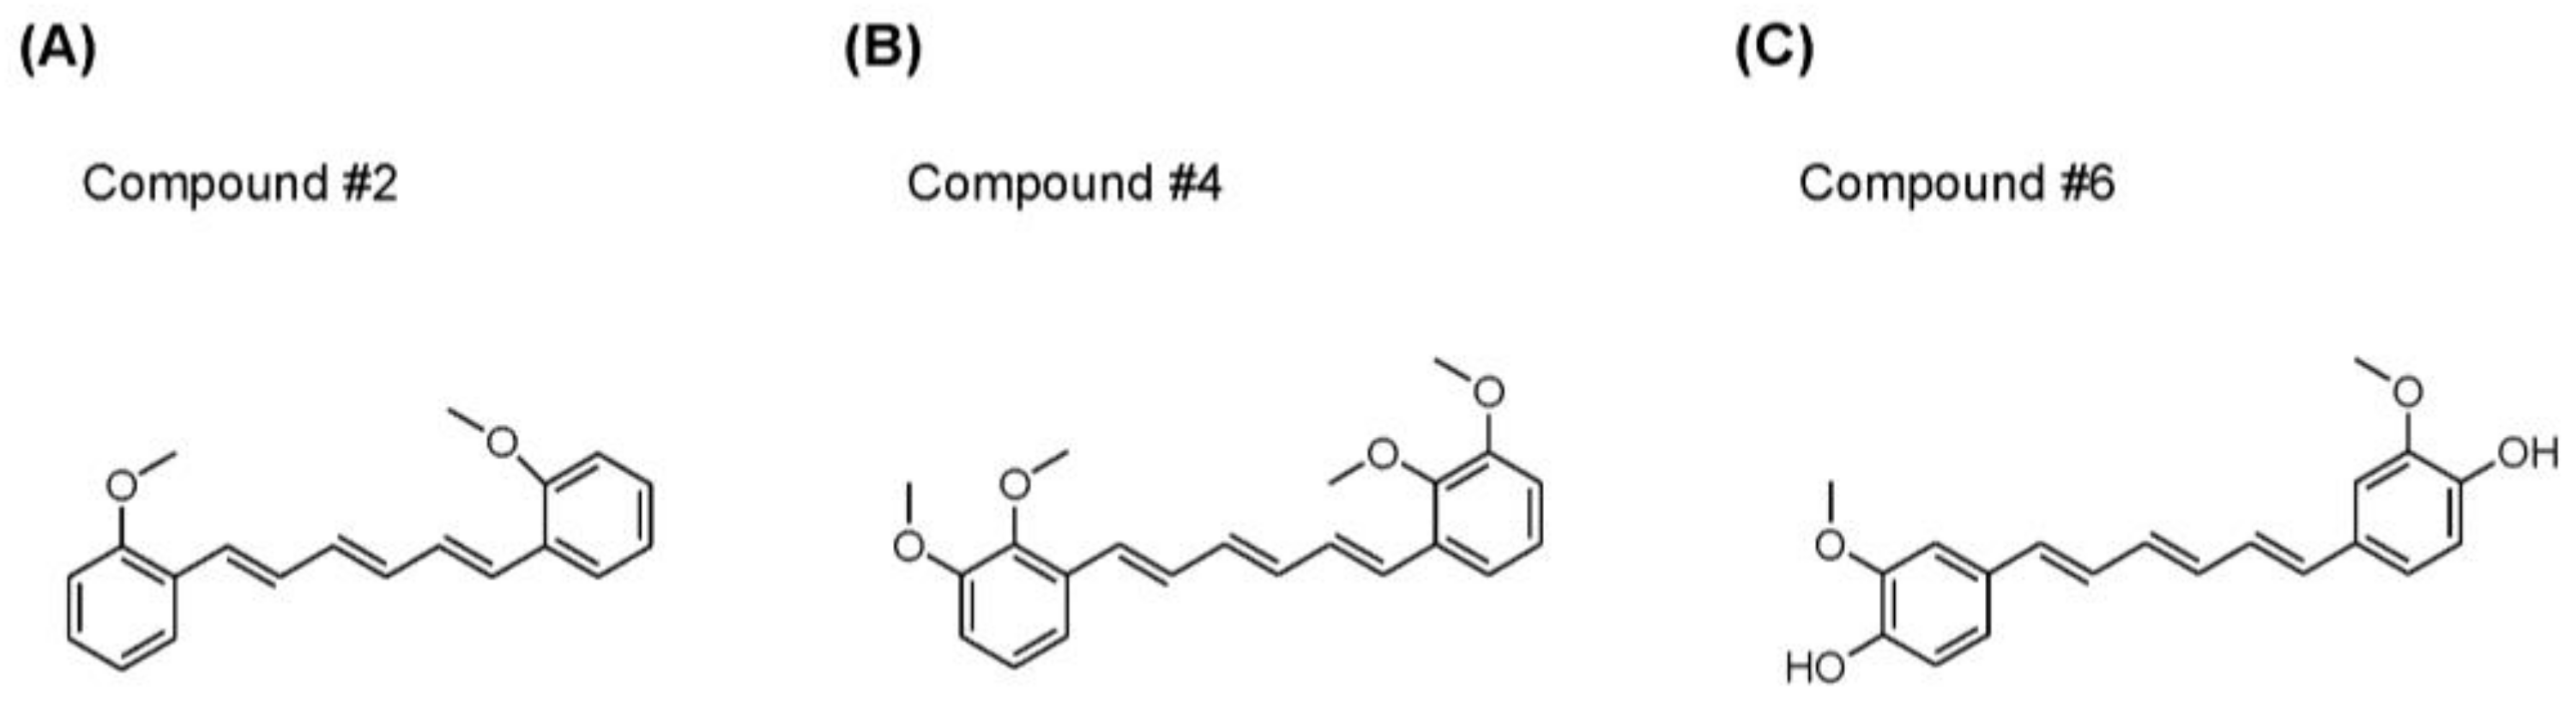
2.1. Synthesis of Novel Compounds
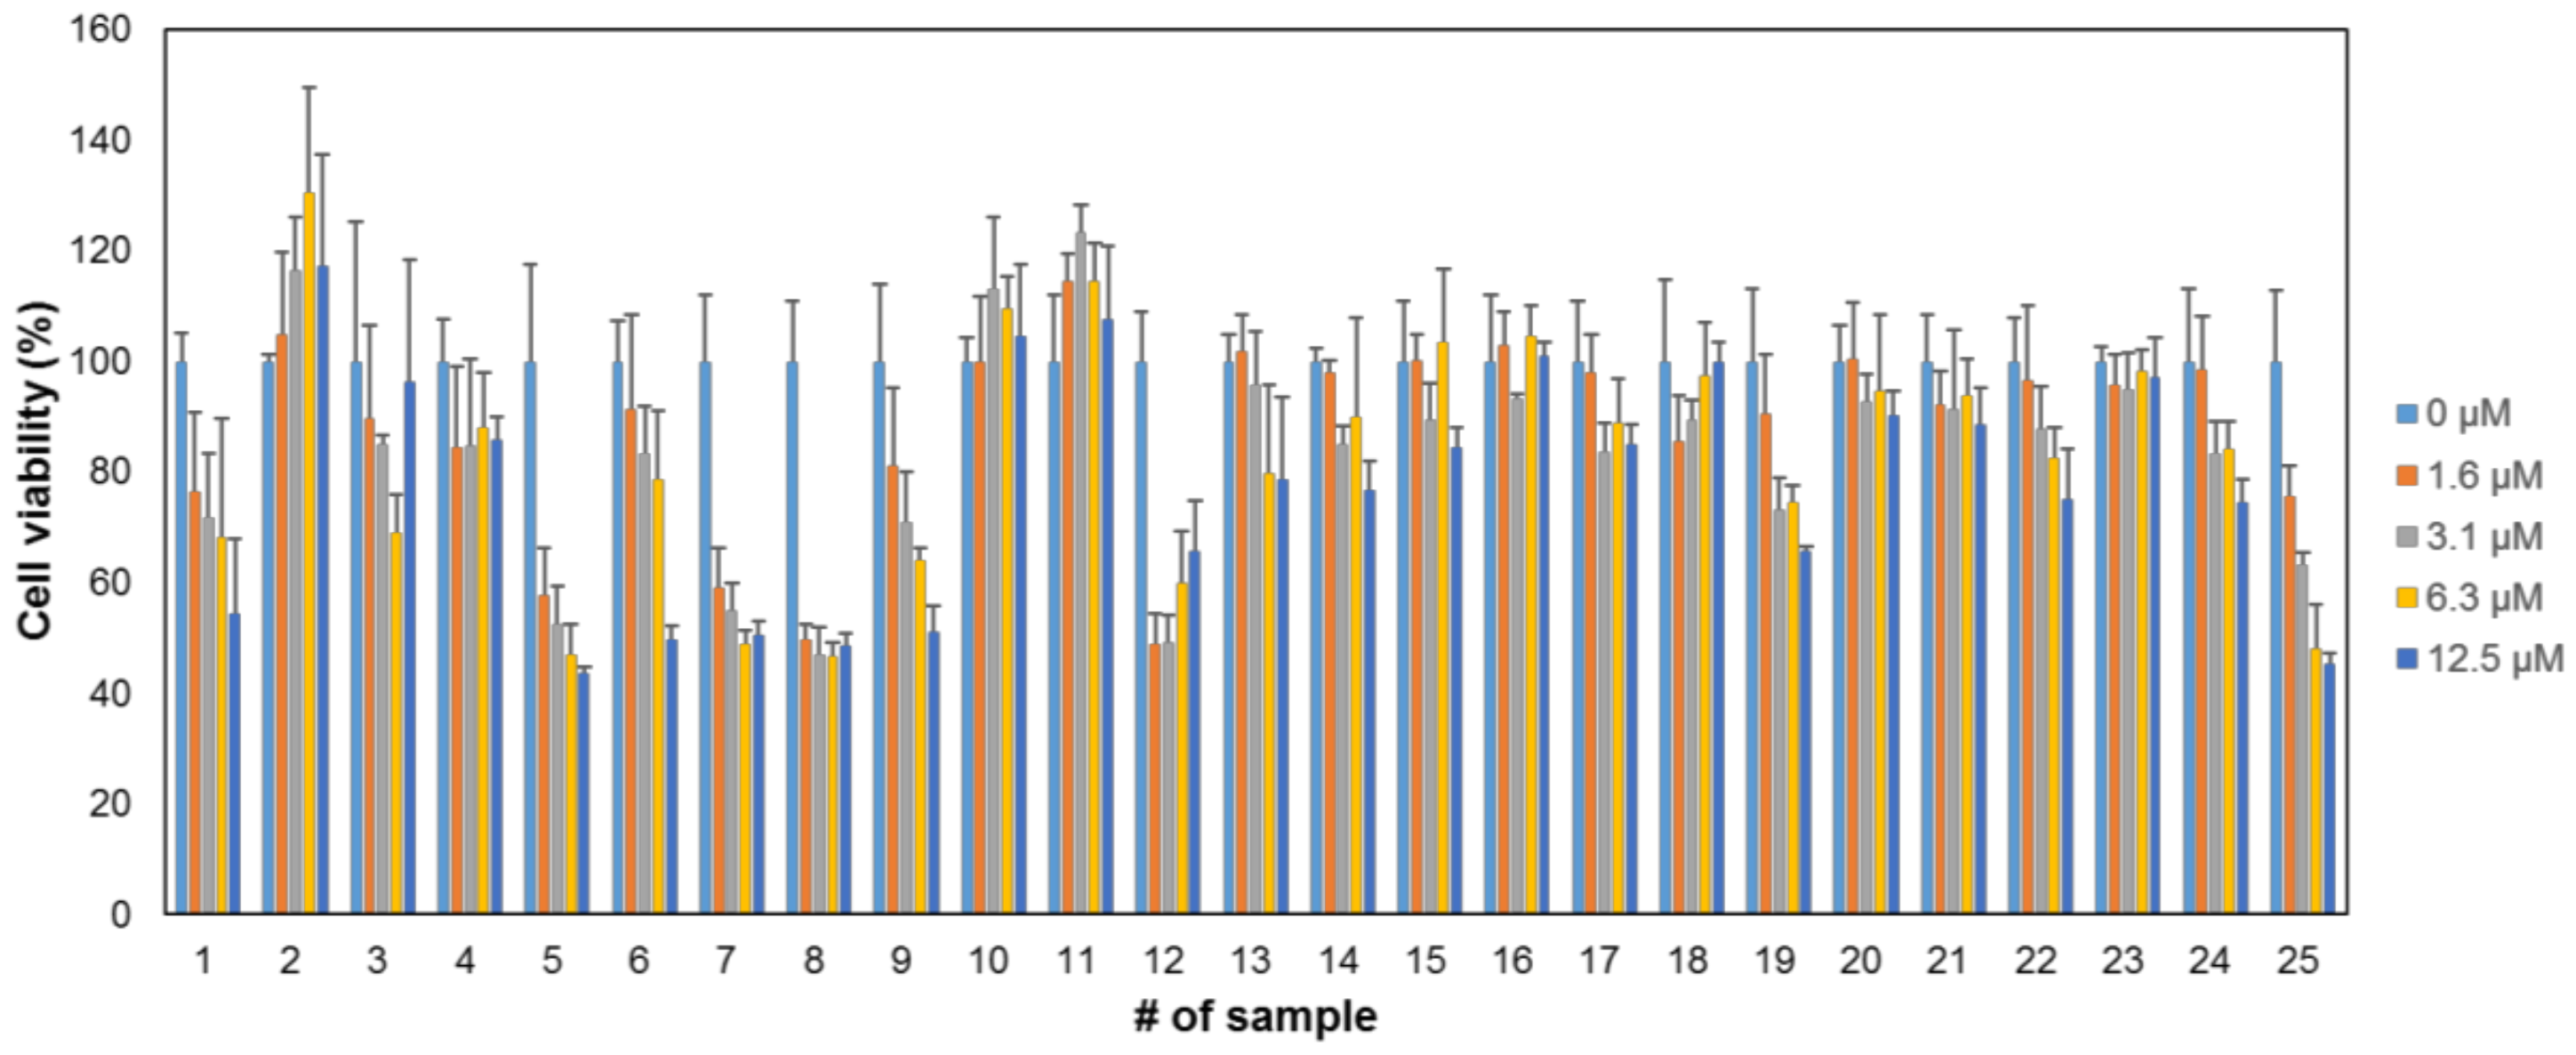
2.2. Cytotoxicity of the Compounds
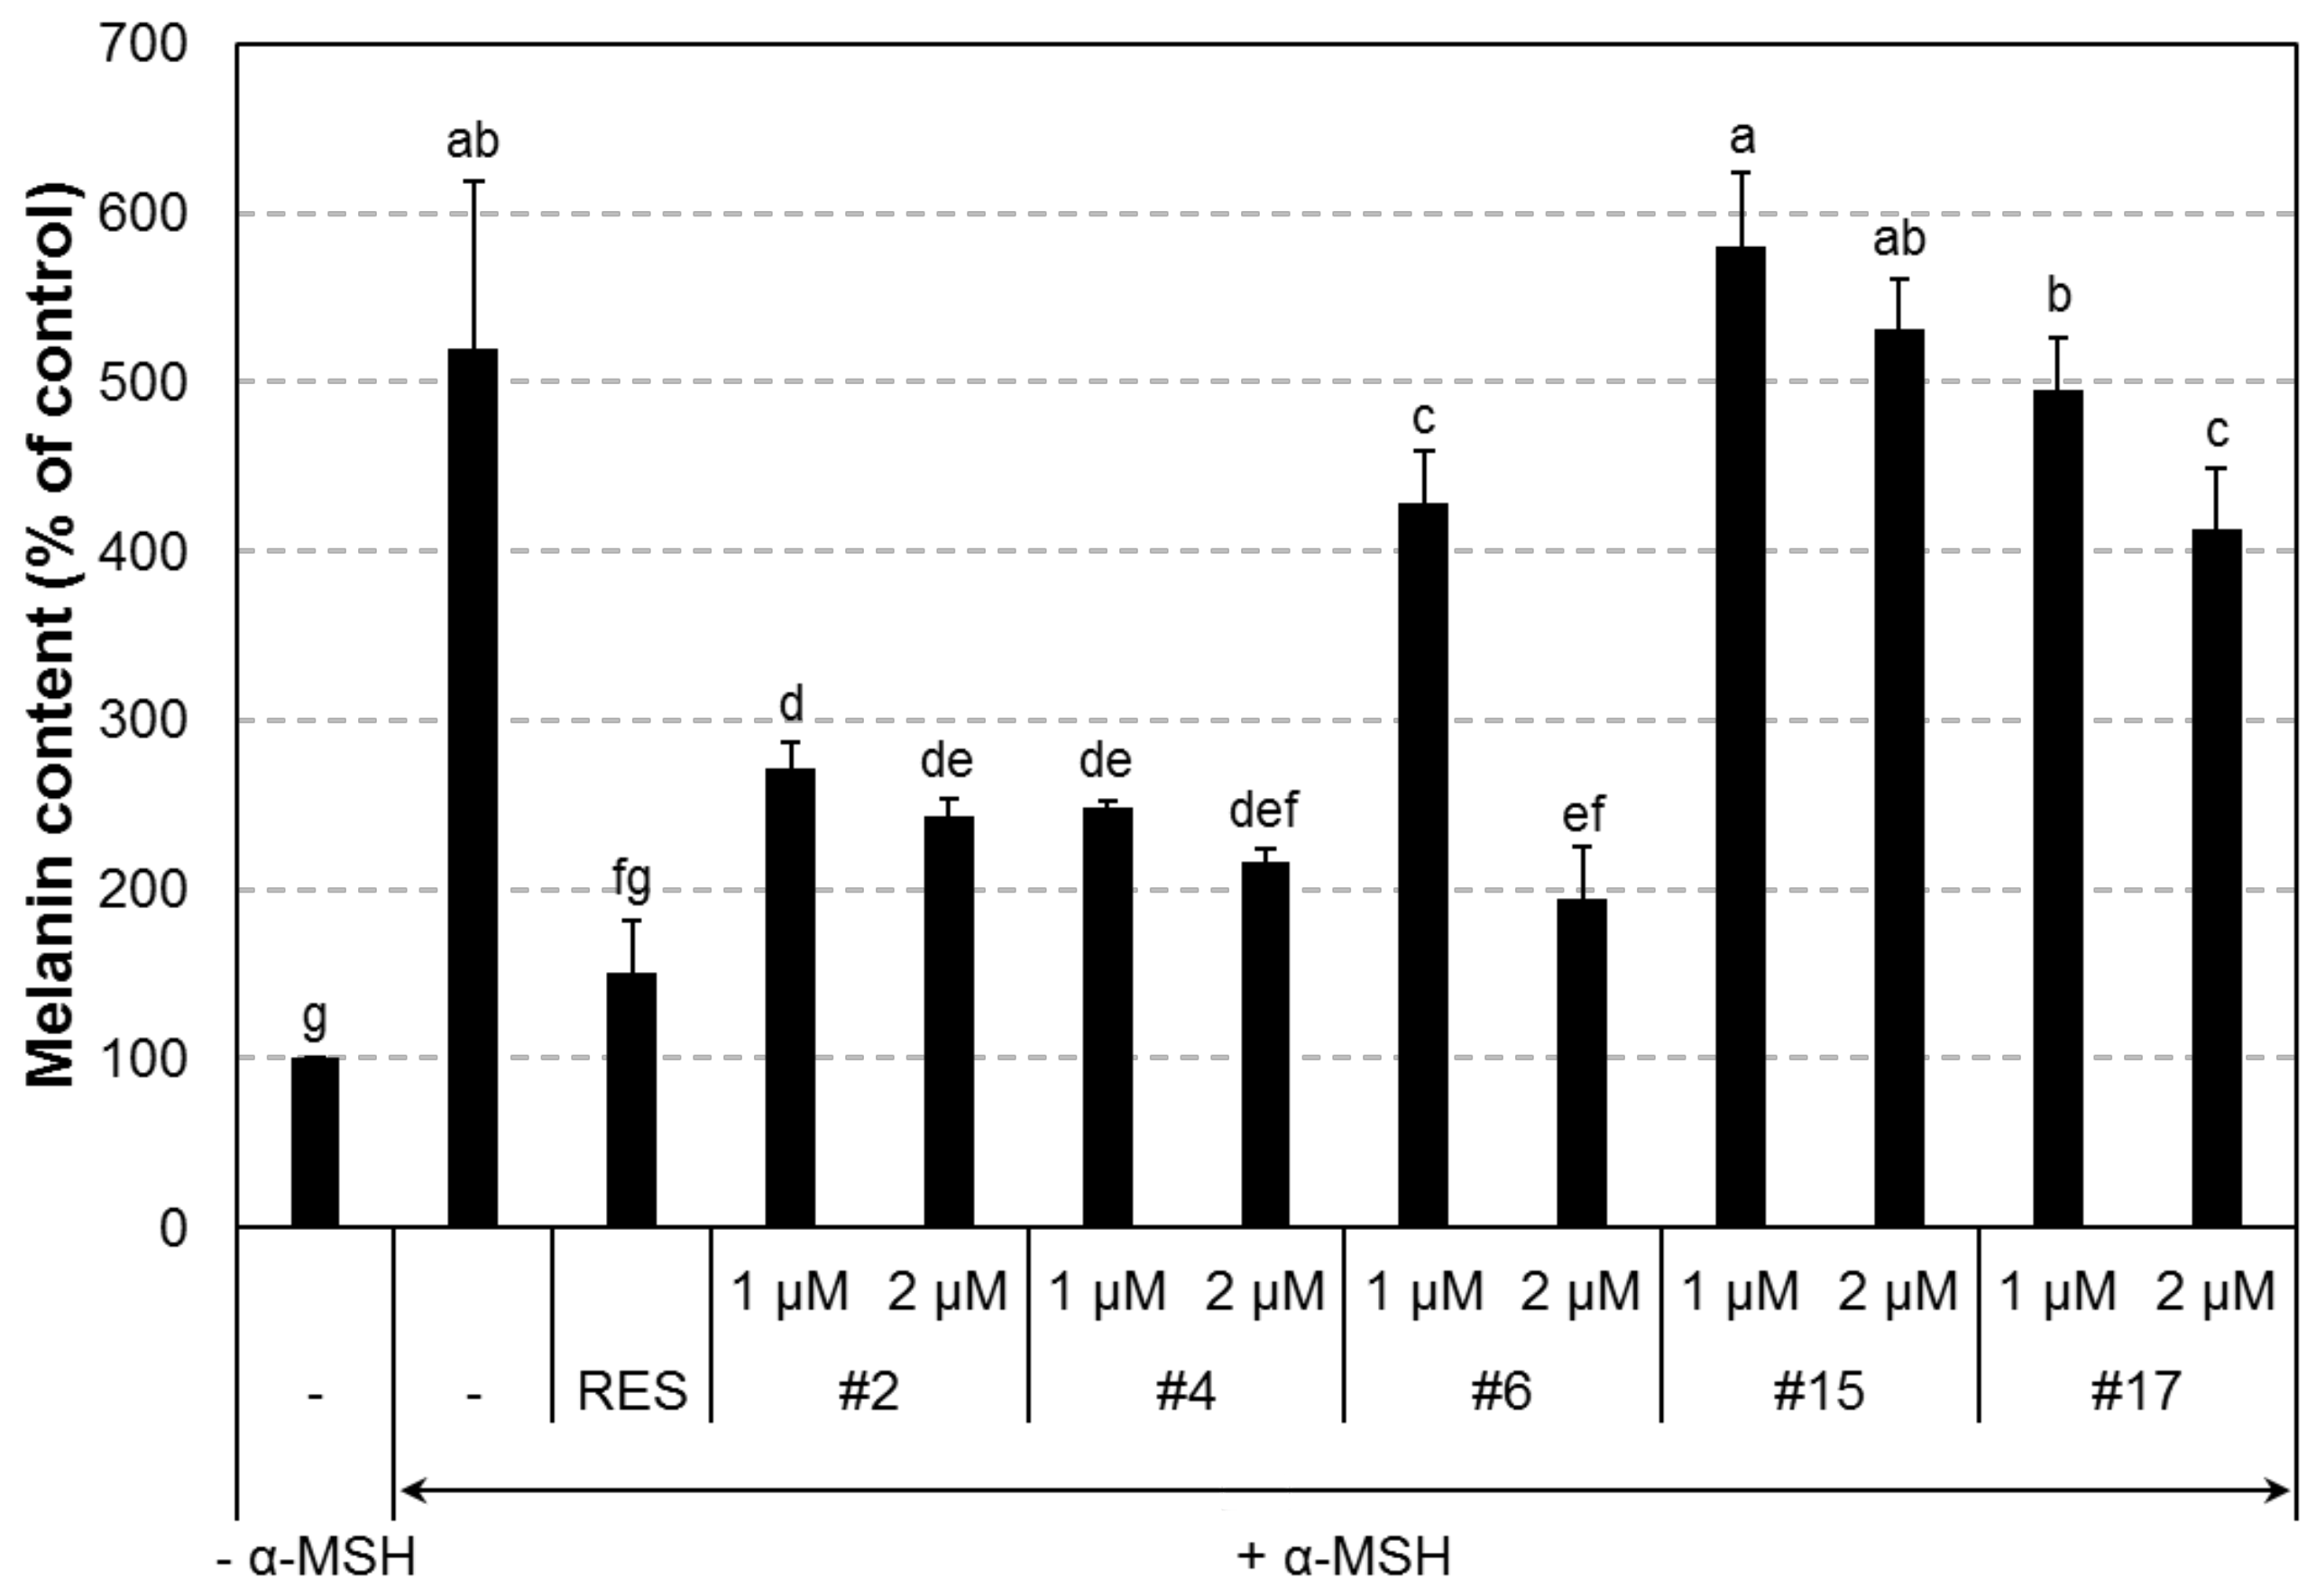
2.3. In Vitro Anti-Melanogenic Effect of the Compounds
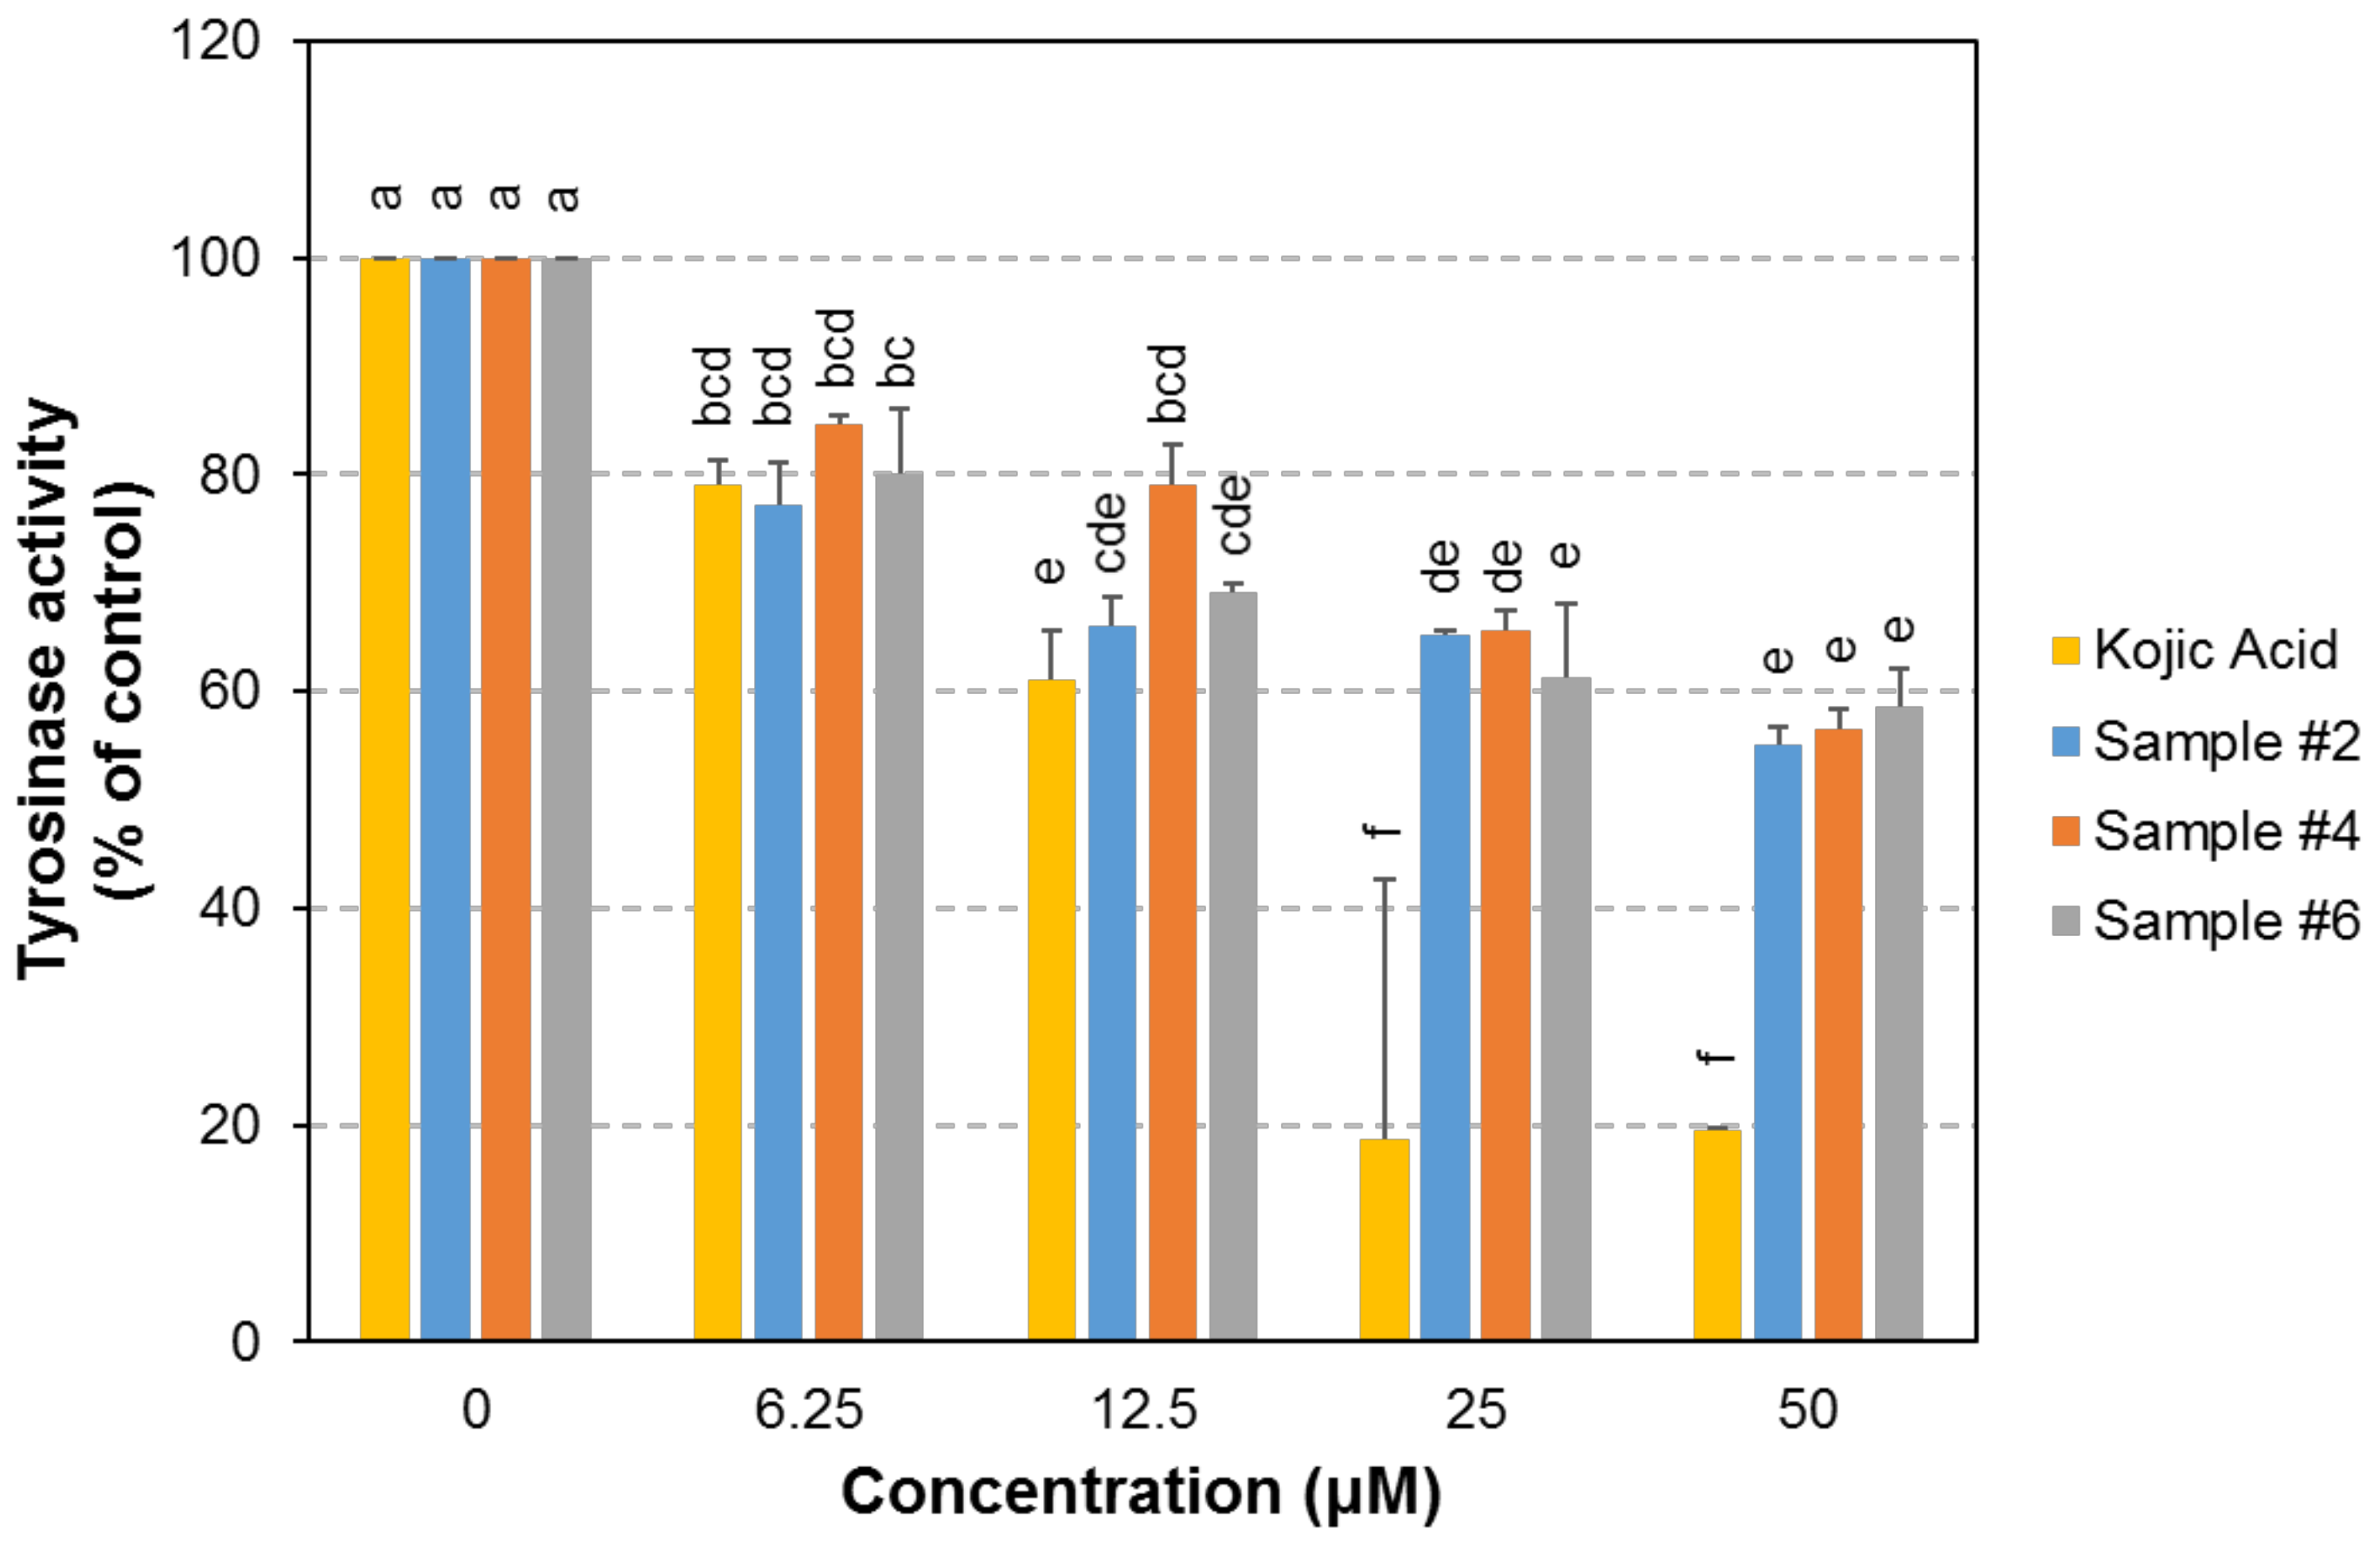
2.4. Tyrosinase Inhibition Activity of the Selected Compounds
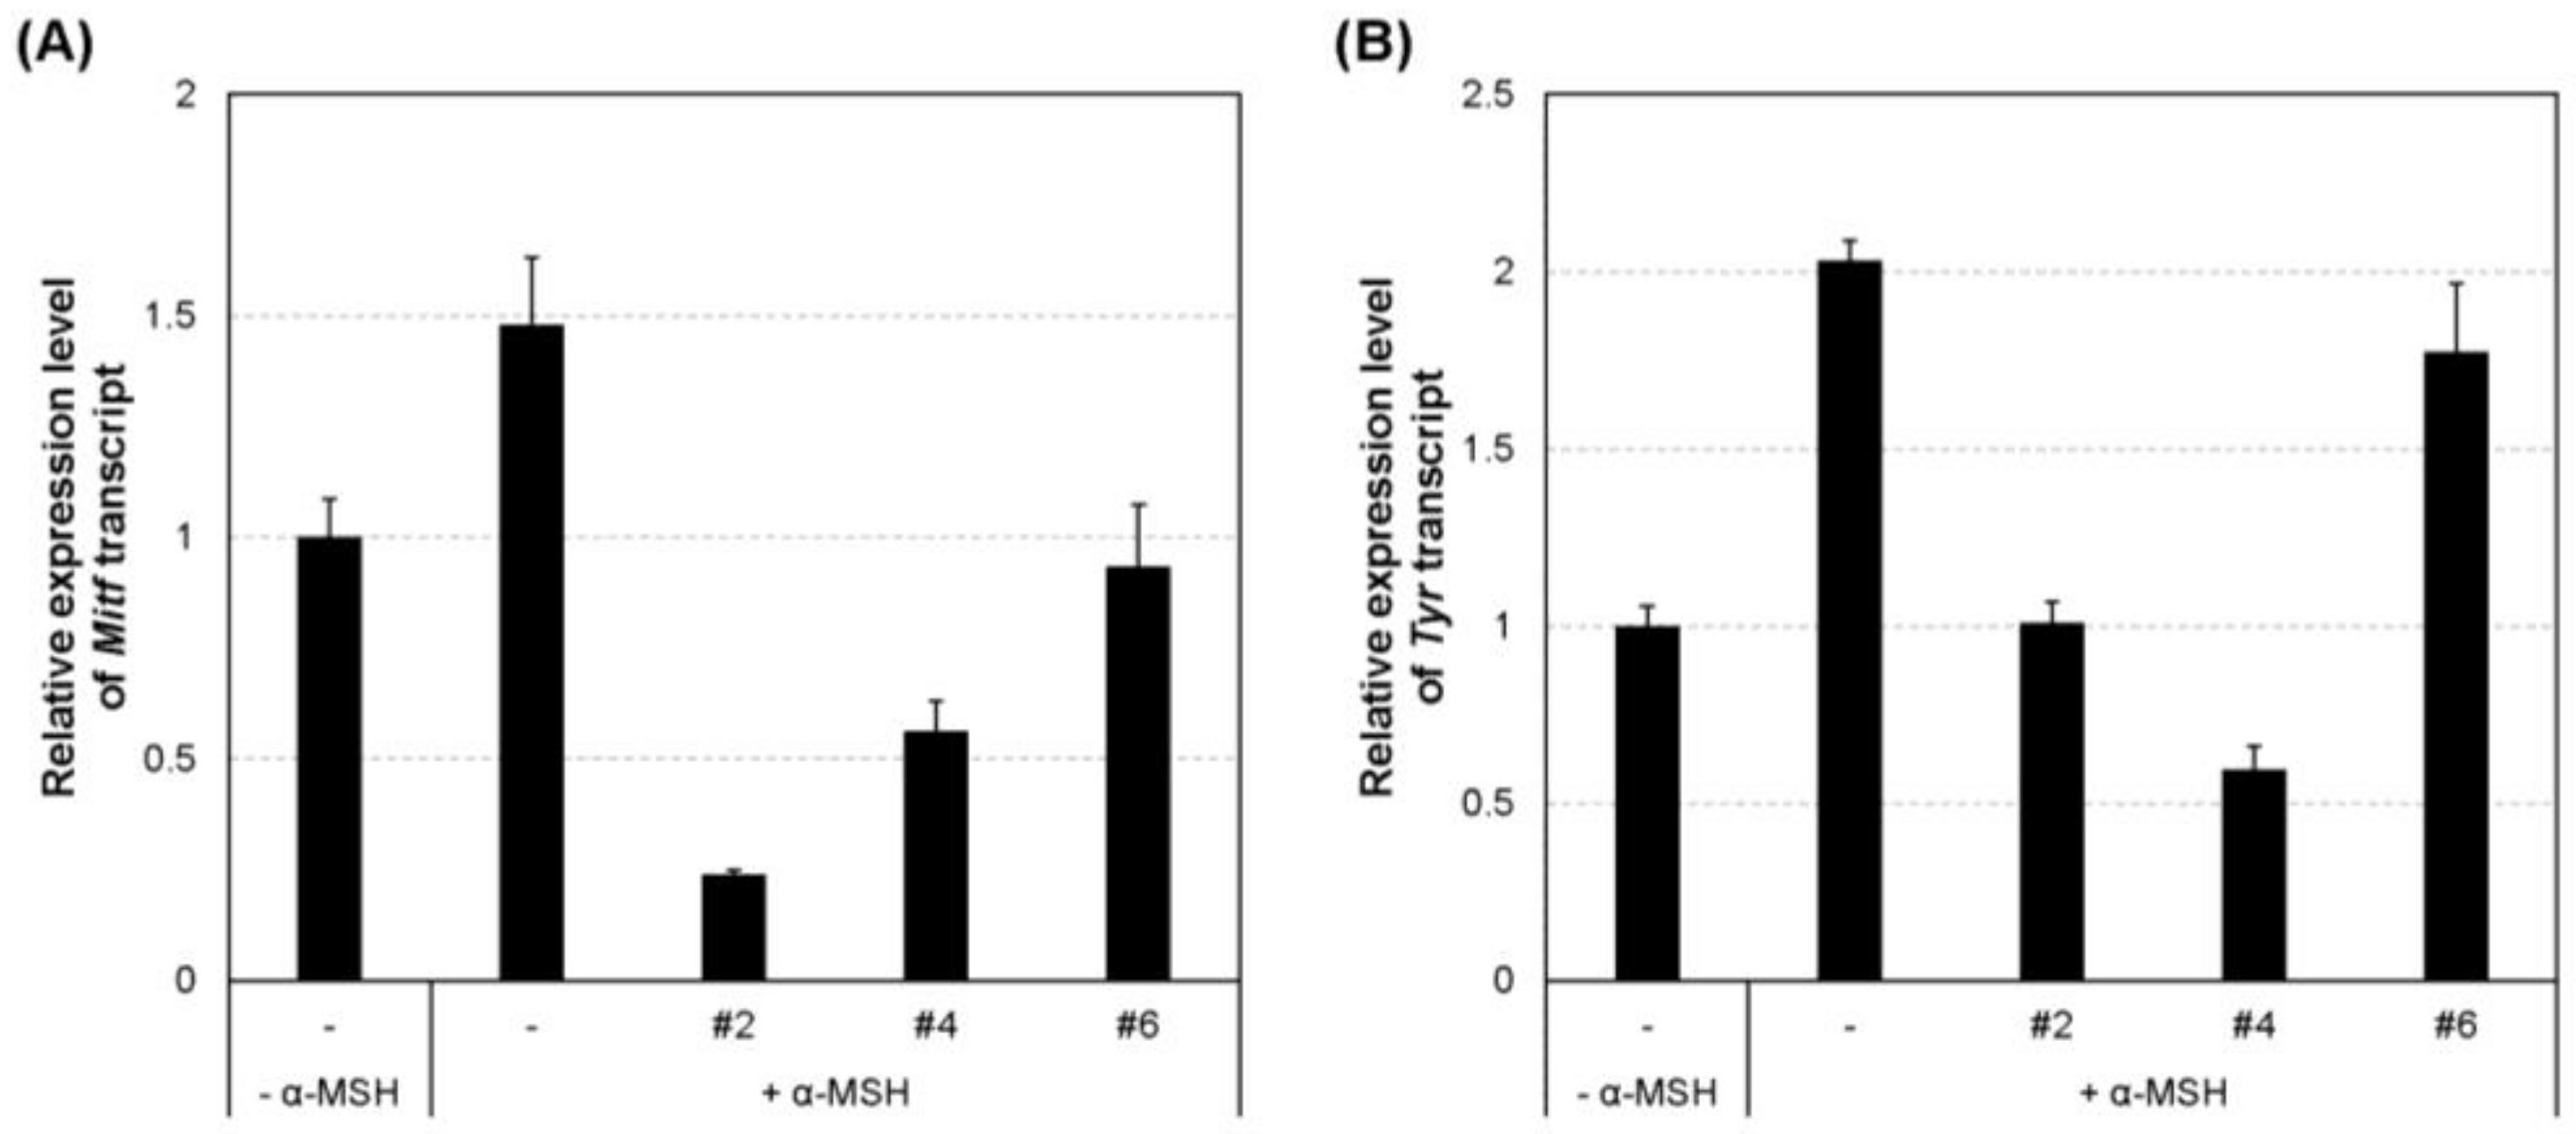
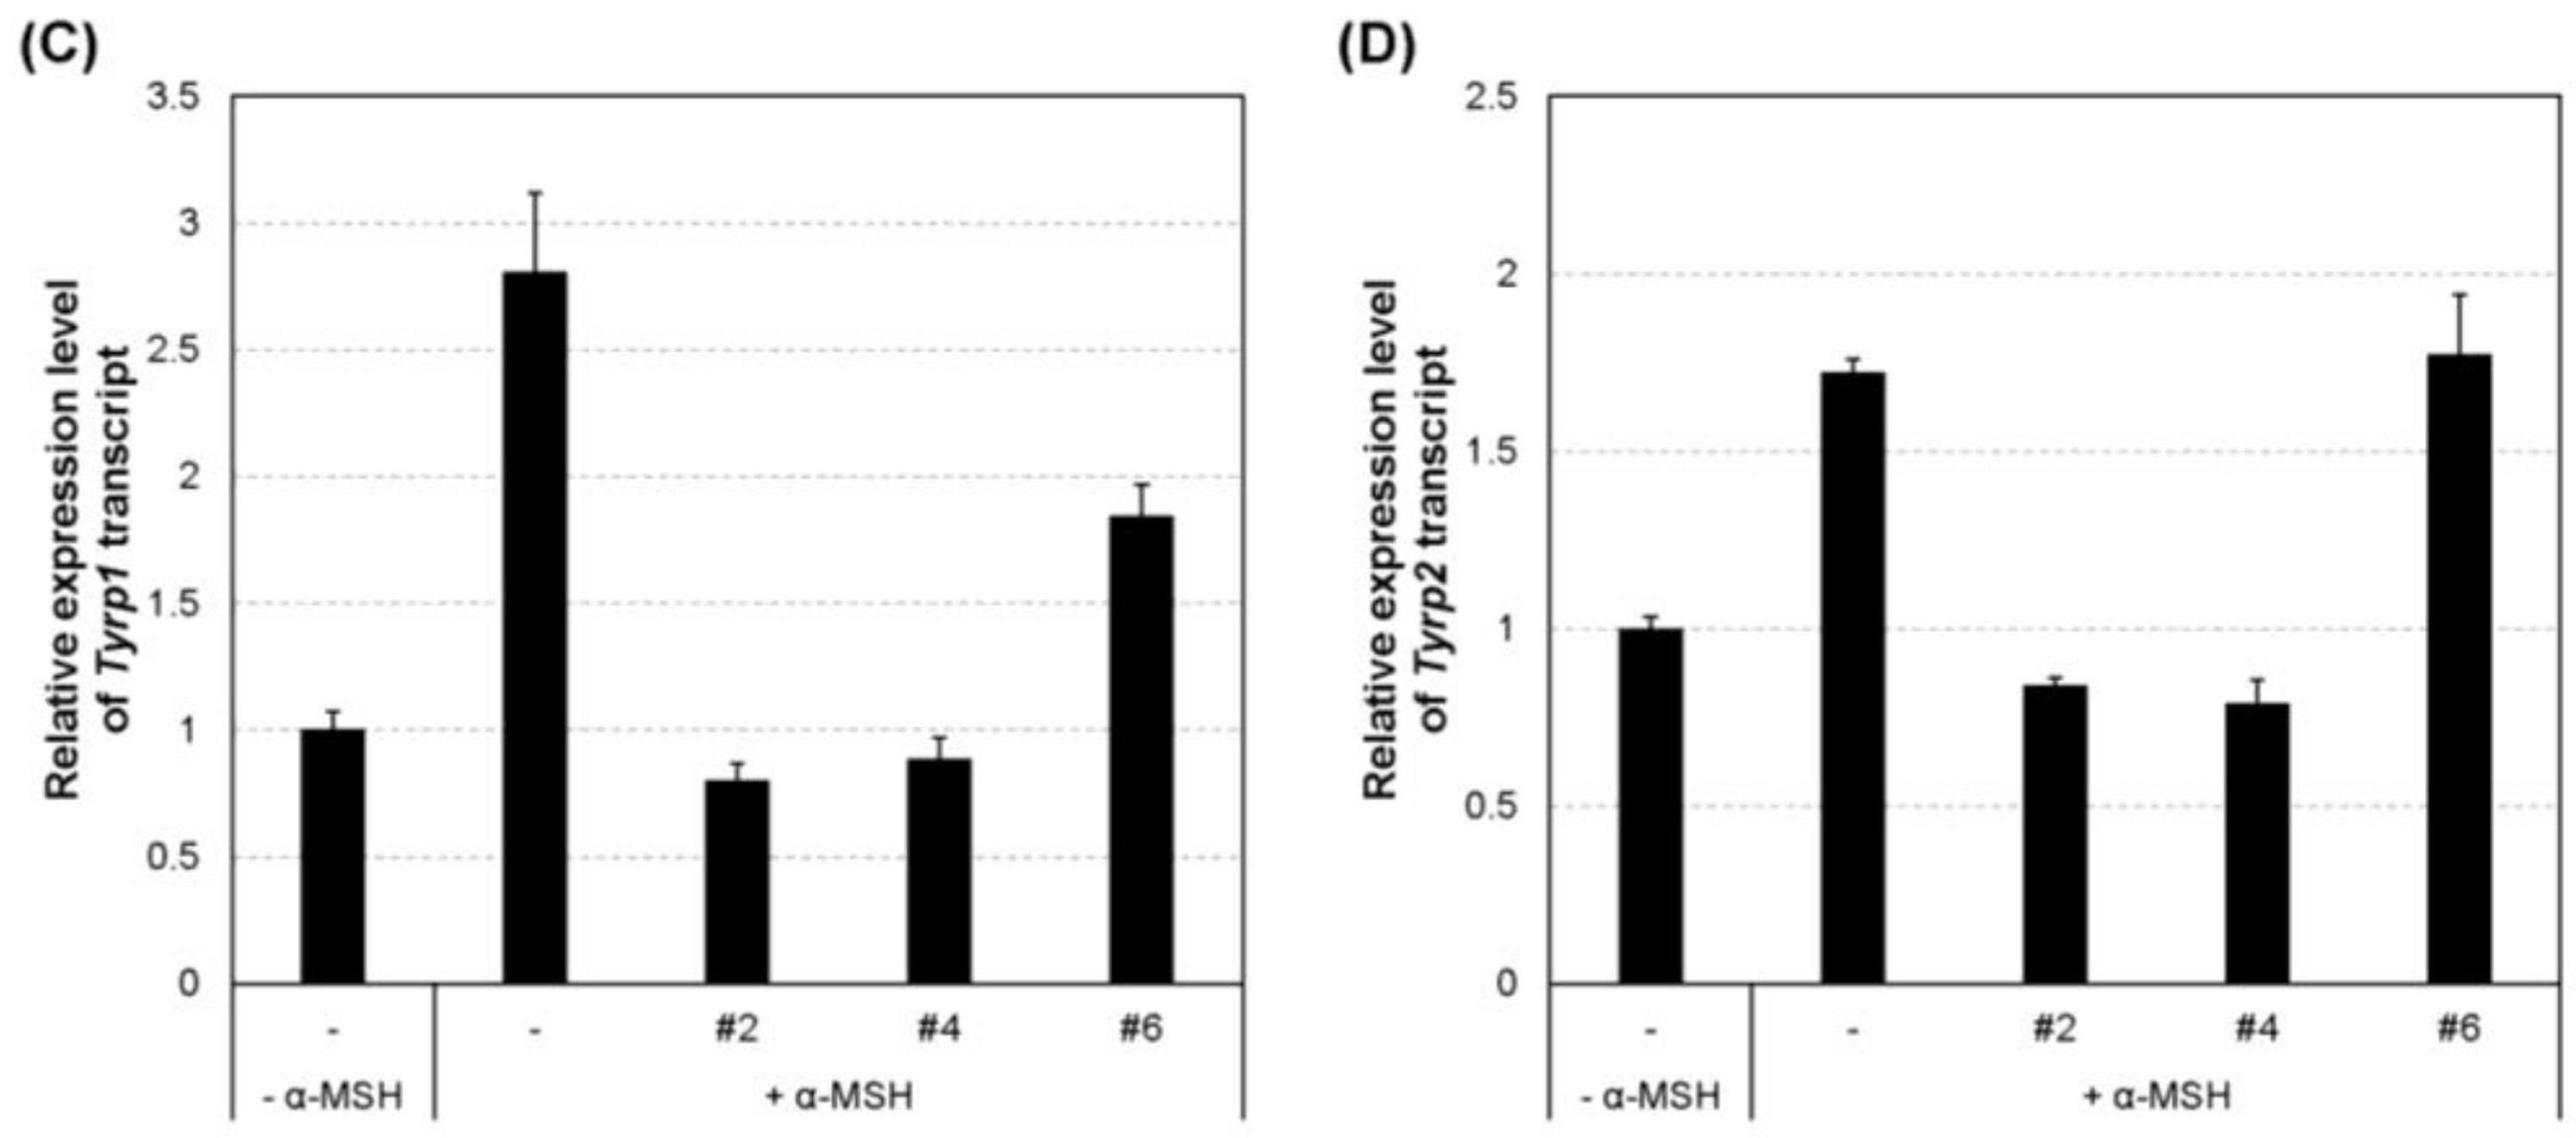
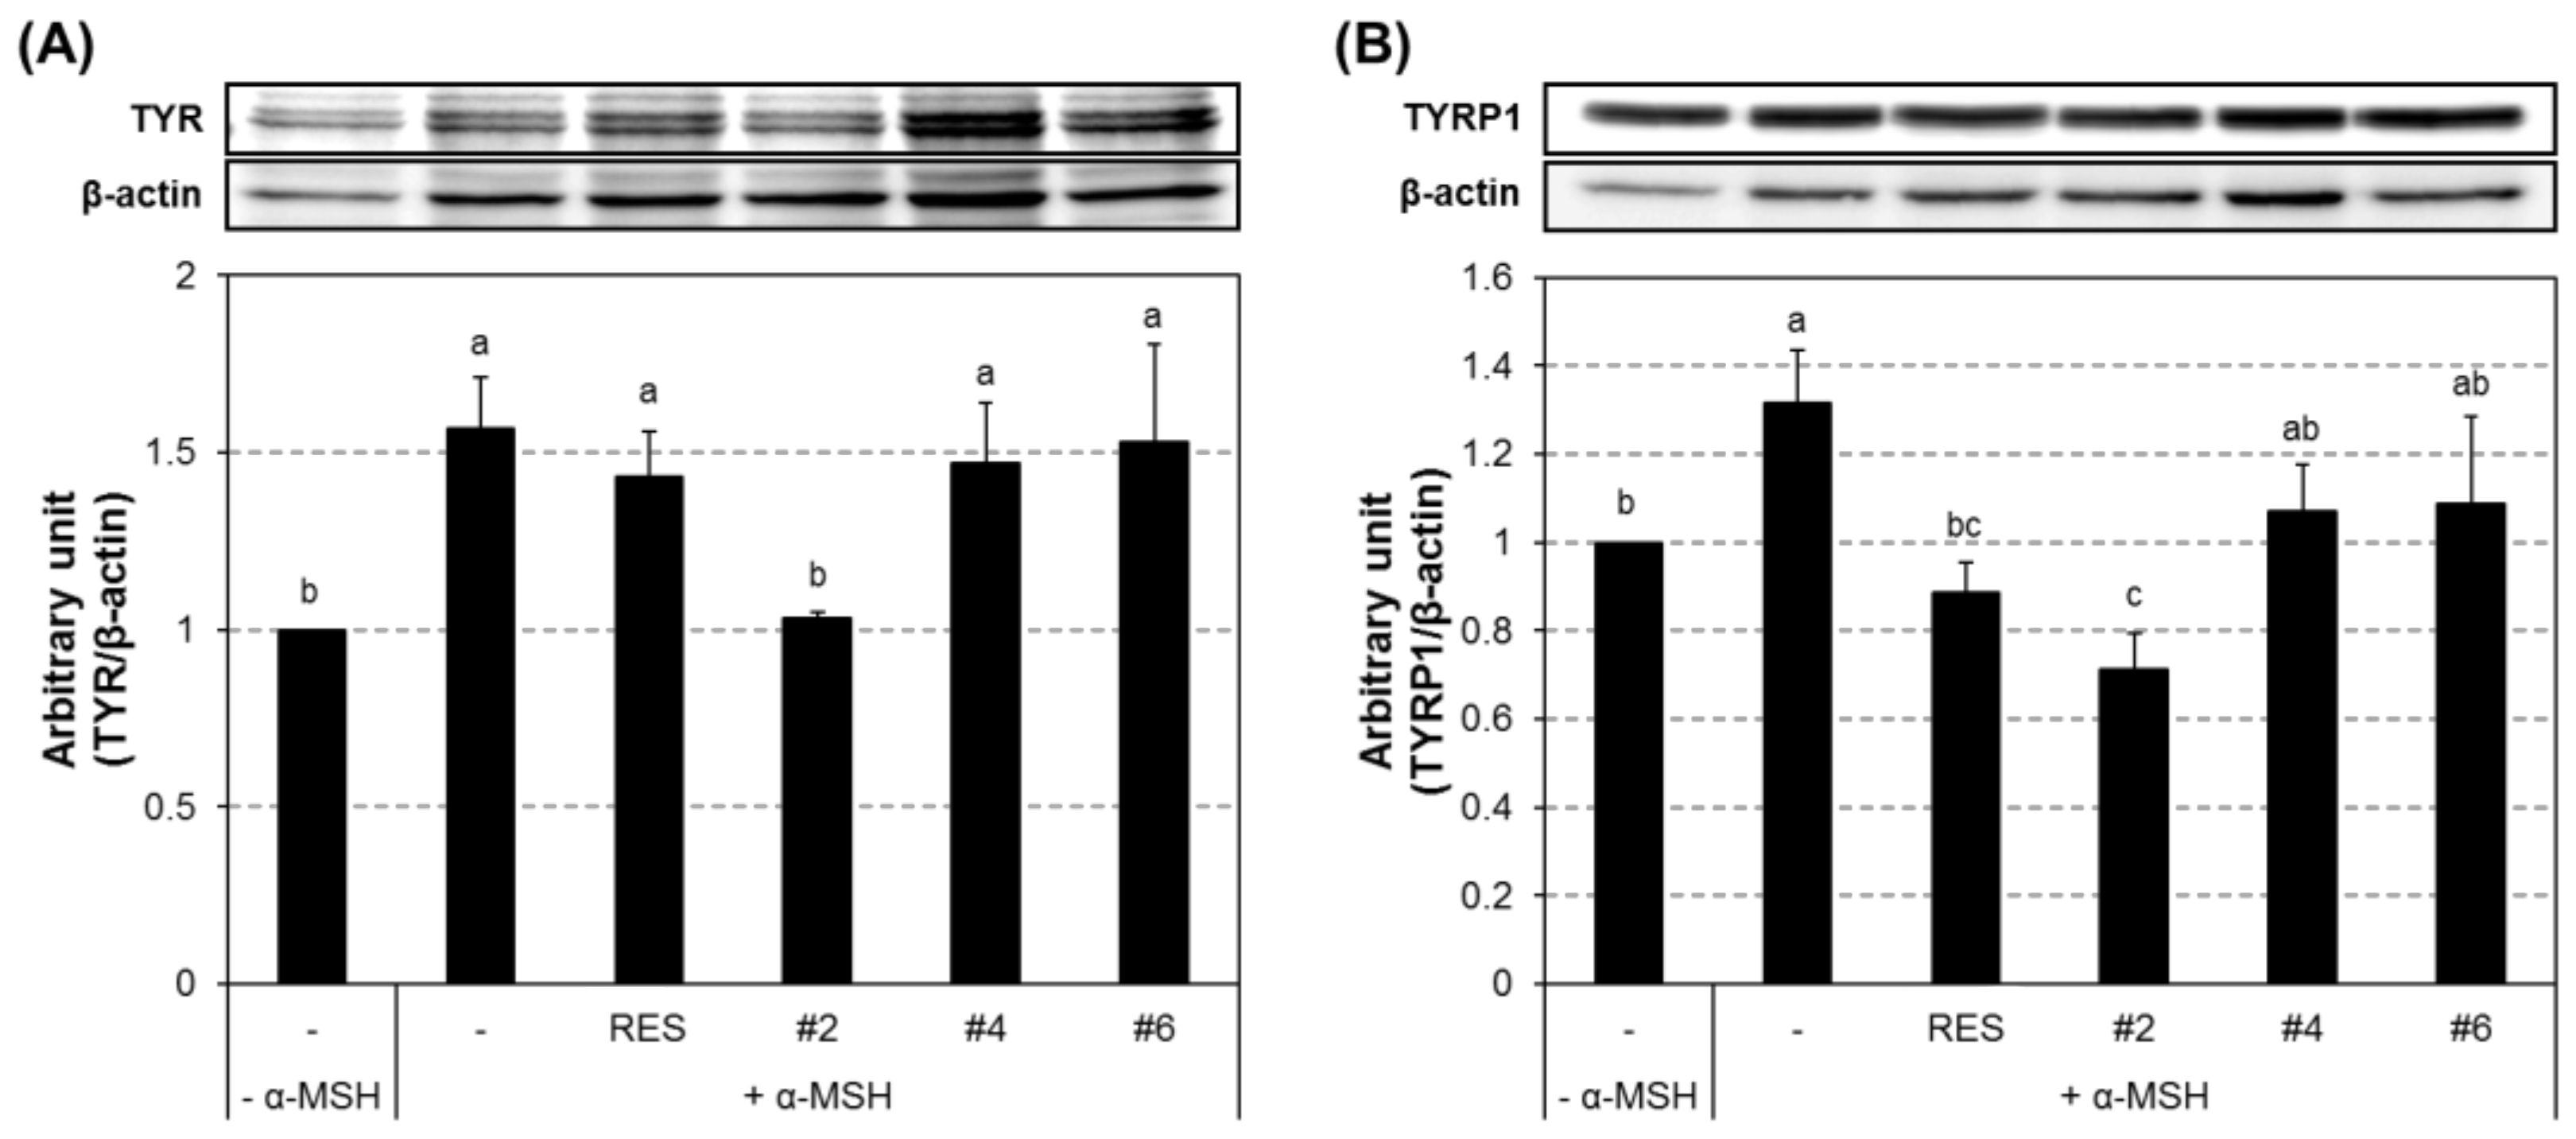
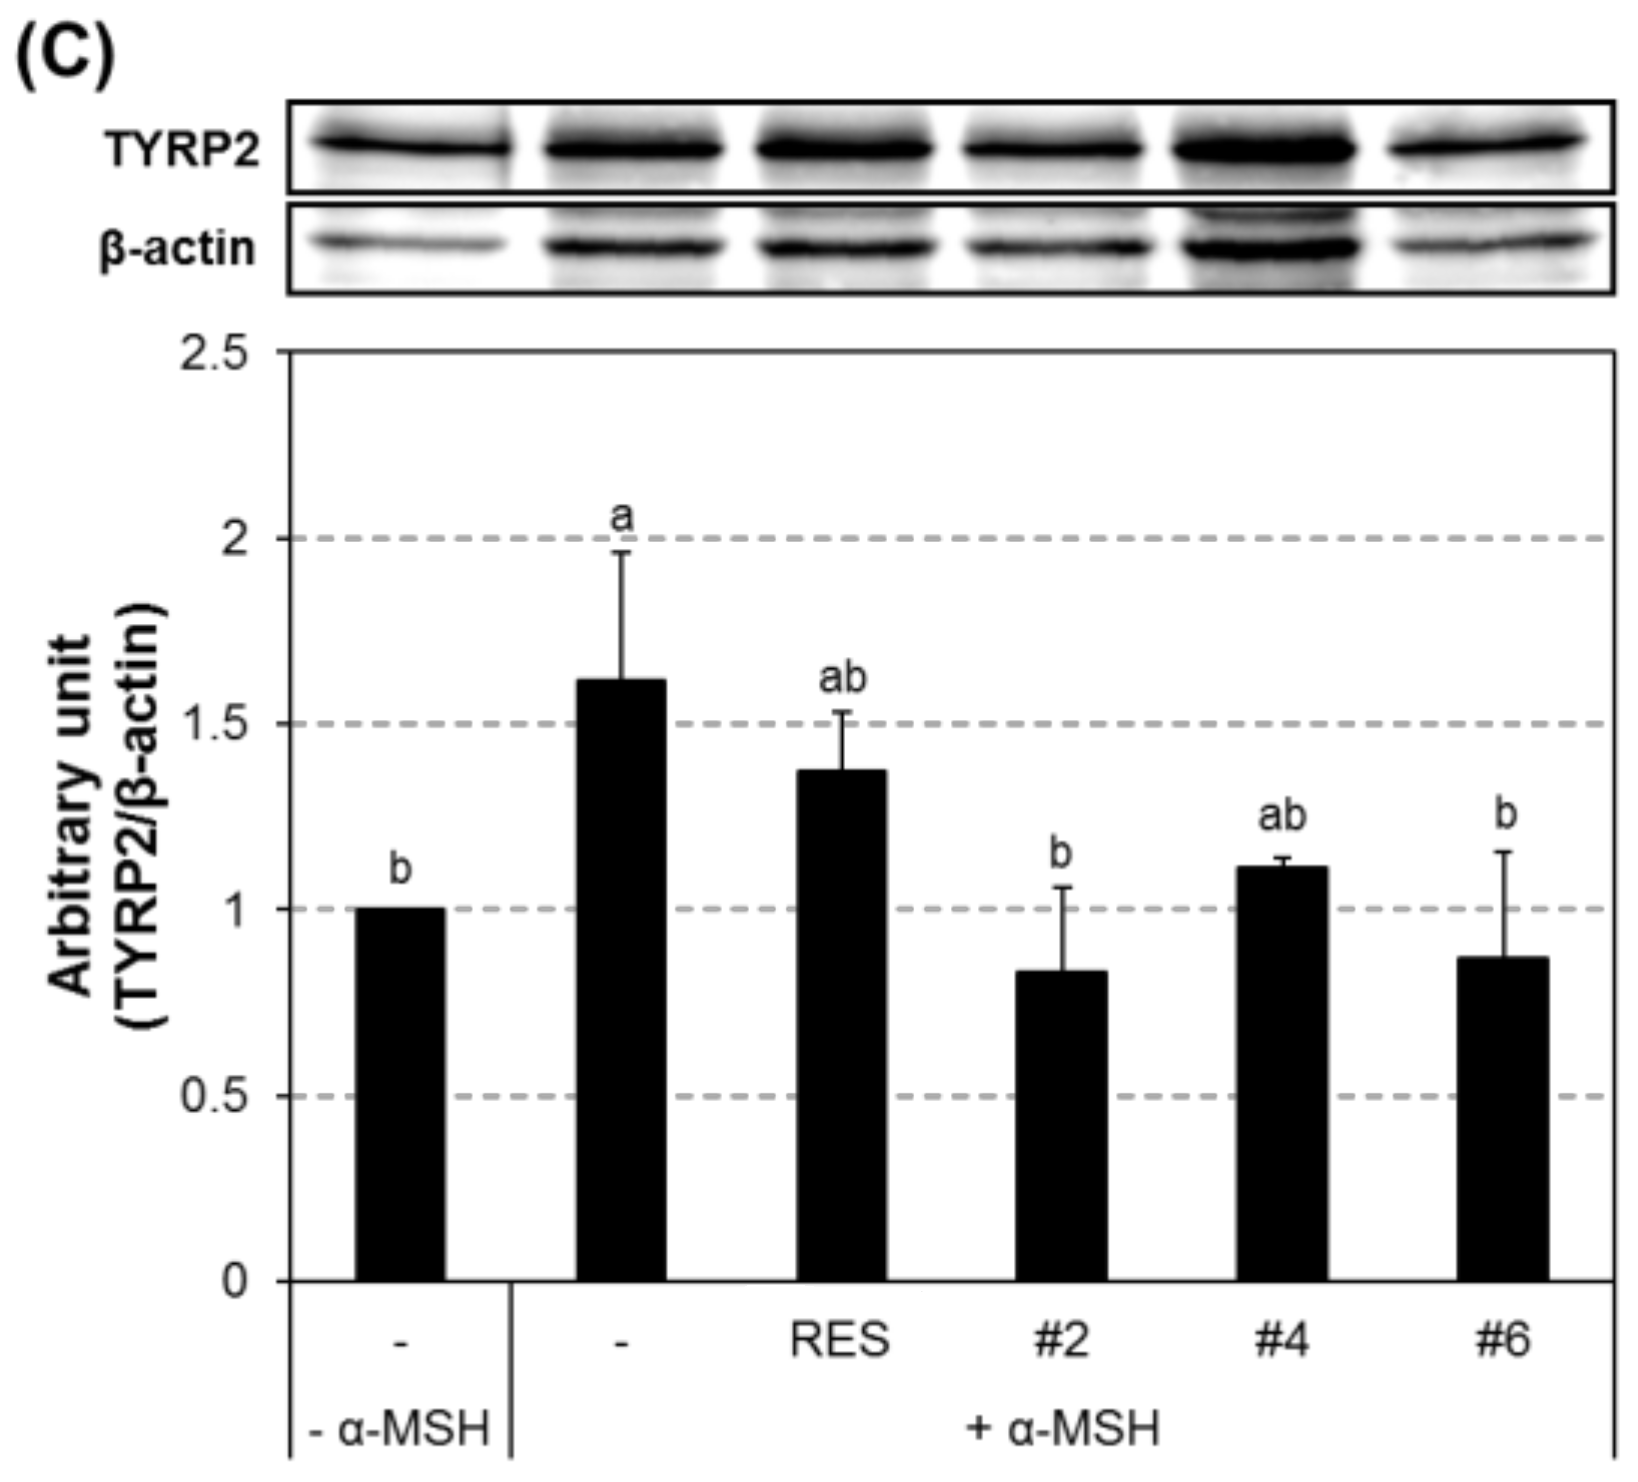
2.5. Inhibition of the Transcript and Protein Expression of MITF and Melanogenic Enzymes
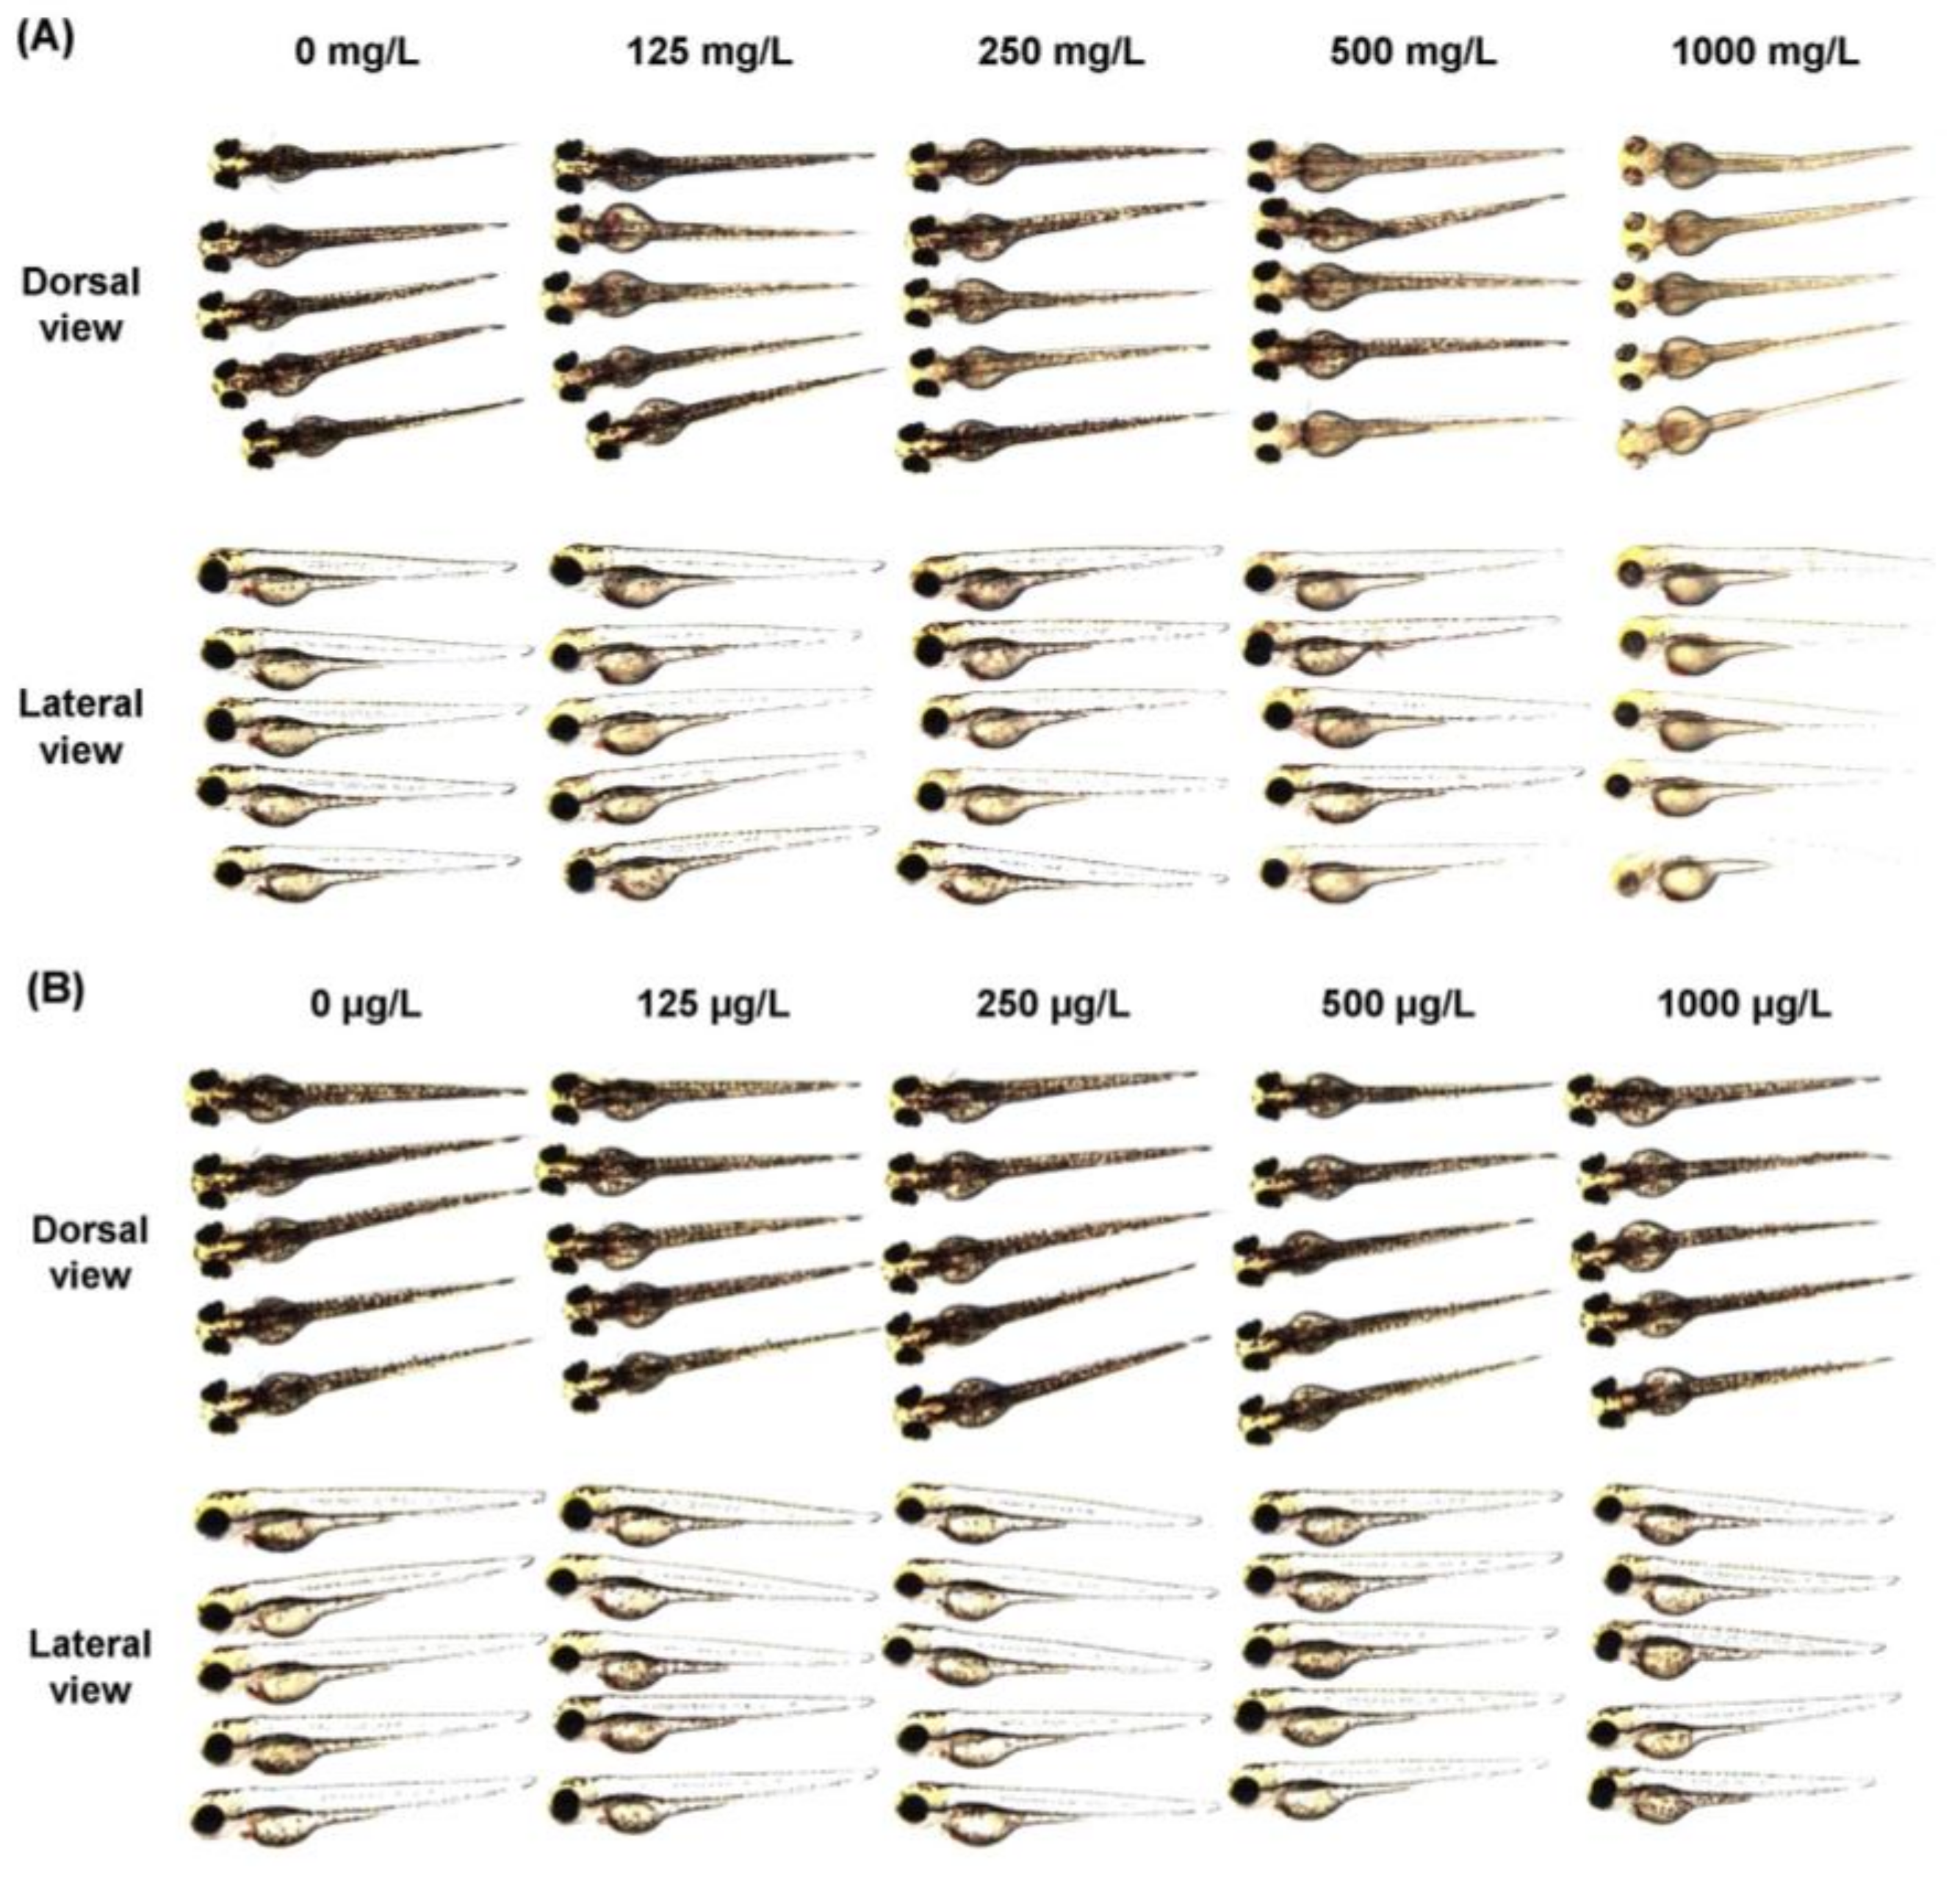
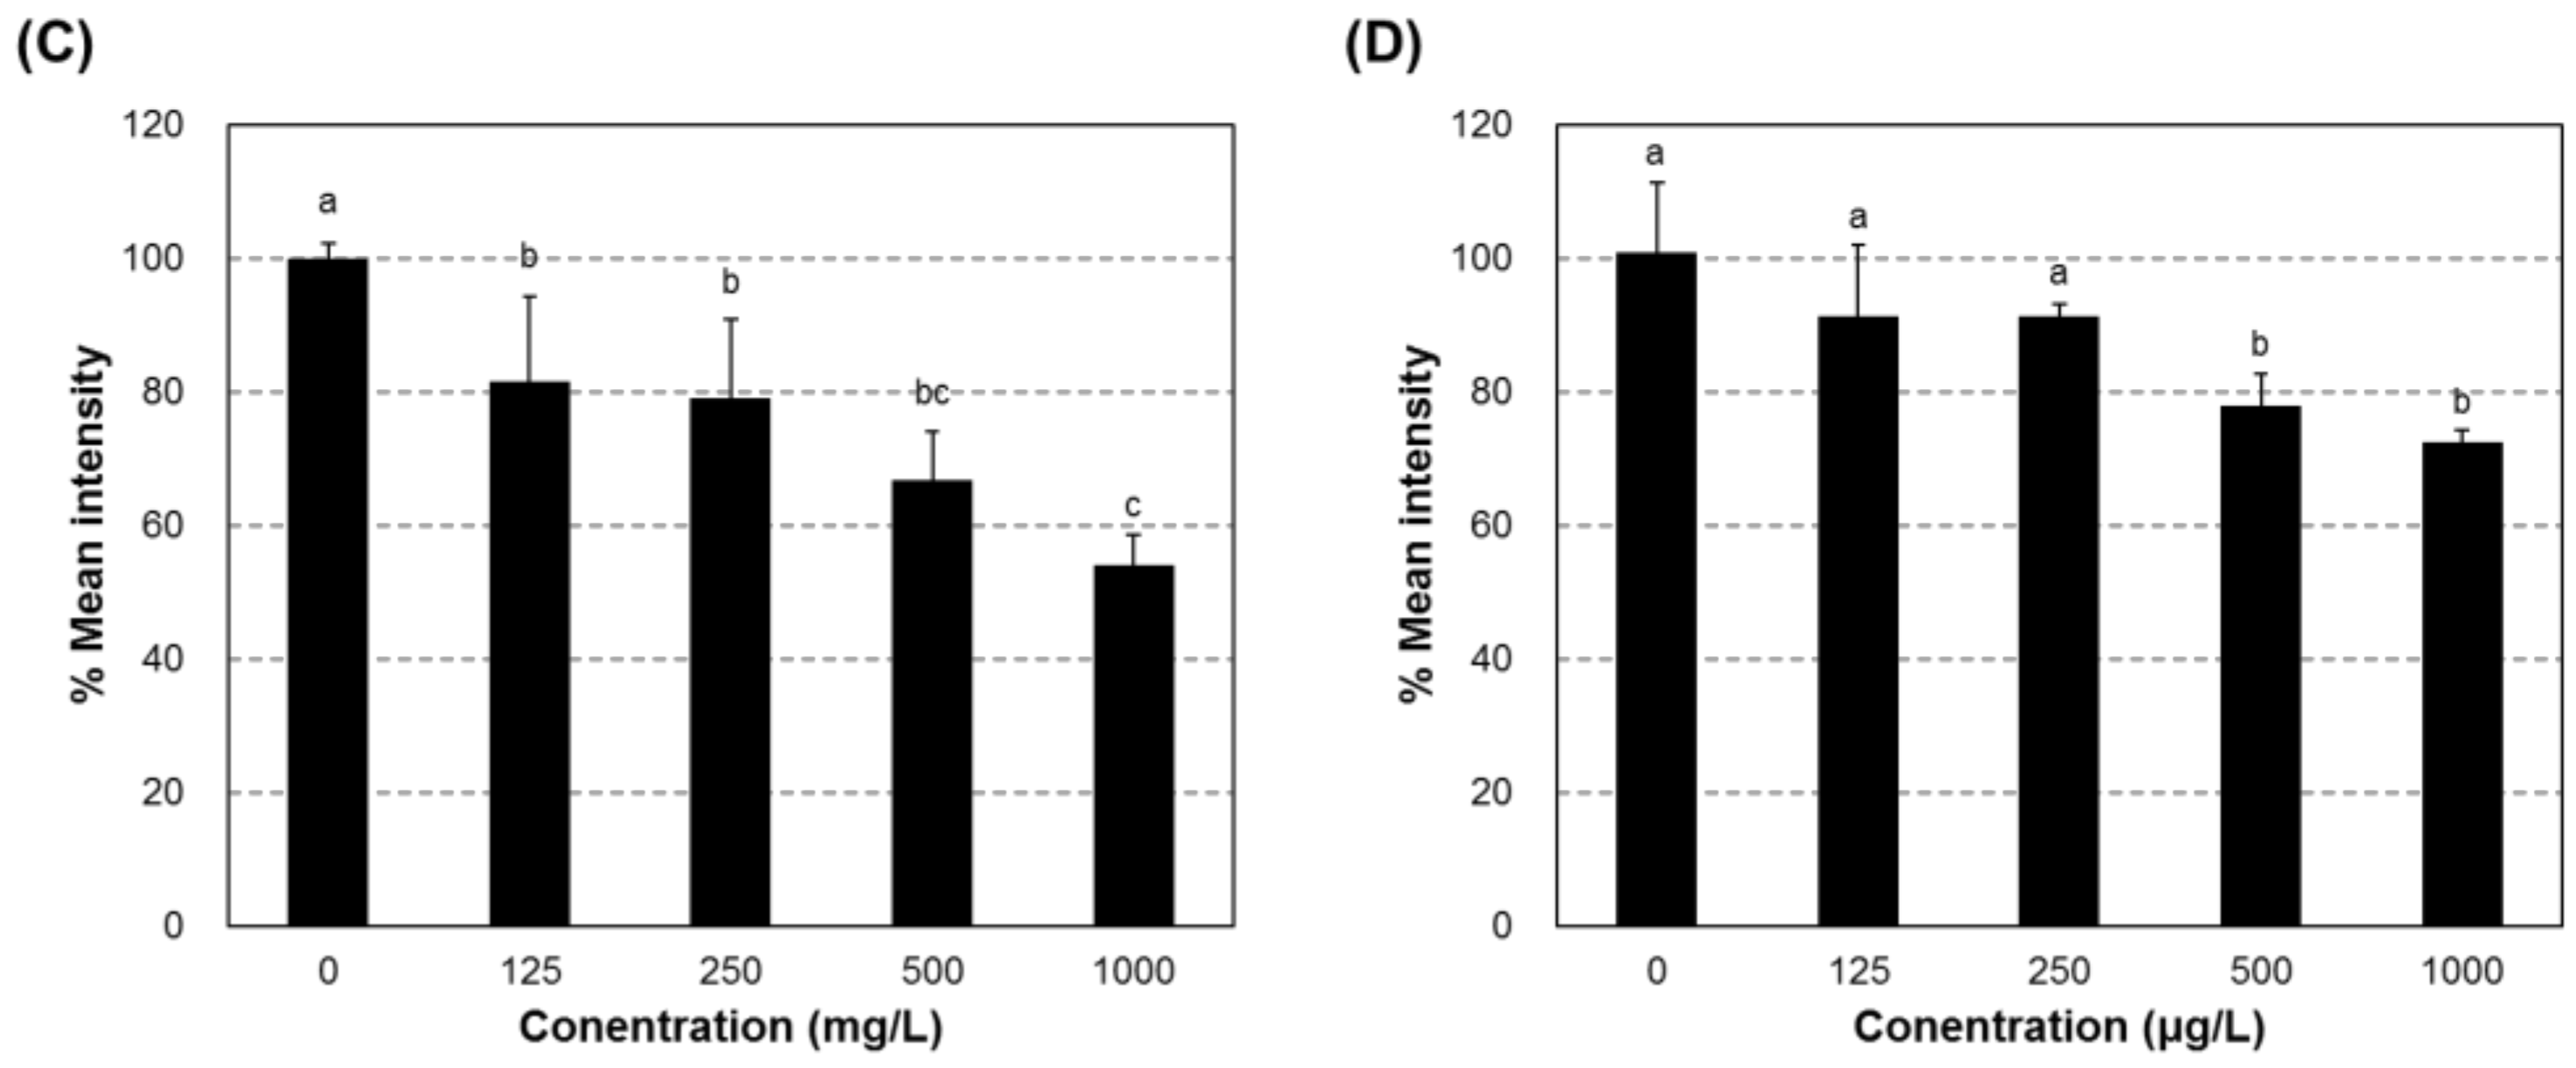
2.6. Depigmentation in Zebrafish Exposed to Compound #2
3. Discussion
4. Materials and Methods
4.1. Preparation of Synthetic Compounds
4.2. Cell Culture
4.3. Determination of Cytotoxicity
4.4. Determination of Relative Melanin Contents
4.5. Measurement of Tyrosinase Inhibitory Activity
4.6. Quantitative Polymerase Chain Reaction (qPCR) Analysis
4.7. Western Blot Analysis
4.8. Determination of Depigmentation in Zebrafish
4.9. Statistical Analysis
Supplementary Materials
Acknowledgments
Author Contributions
Conflicts of Interest
References
- Schallreuter, K.U.; Kothari, S.; Chavan, B.; Spencer, J.D. Regulation of melanogenesis—Controversies and new concepts. Exp. Dermatol. 2008, 17, 395–404. [Google Scholar] [CrossRef] [PubMed]
- Rinnerthaler, M.; Bischof, J.; Streubel, M.K.; Trost, A.; Richter, K. Oxidative stress in aging human skin. Biomolecules 2015, 5, 545–589. [Google Scholar] [CrossRef] [PubMed]
- Natarajan, V.T.; Ganju, P.; Ramkumar, A.; Grover, R.; Gokhale, R.S. Multifaceted pathways protect human skin from UV radiation. Nat. Chem. Biol. 2014, 10, 542–551. [Google Scholar] [CrossRef] [PubMed]
- Baldea, I.; Mocan, T.; Cosgarea, R. The role of ultraviolet radiation and tyrosine stimulated melanogenesis in the induction of oxidative stress alterations in fair skin melanocytes. Exp. Oncol. 2009, 31, 200–208. [Google Scholar] [PubMed]
- Solano, F.; Briganti, S.; Picardo, M.; Ghanem, G. Hypopigmenting agents: An updated review on biological, chemical and clinical aspects. Pigment Cell Melanoma Res. 2006, 19, 550–571. [Google Scholar] [CrossRef] [PubMed]
- Ando, H.; Kondoh, H.; Ichihashi, M.; Hearing, V.J. Approaches to identify inhibitors of melanin biosynthesis via the quality control of tyrosinase. J. Investig. Dermatol. 2007, 127, 751–761. [Google Scholar] [CrossRef] [PubMed]
- Kim, Y.J.; Uyama, H. Tyrosinase inhibitors from natural and synthetic sources: Structure, inhibition mechanism and perspective for the future. Cell. Mol. Life Sci. 2005, 62, 1707–1723. [Google Scholar] [CrossRef] [PubMed]
- Parvez, S.; Kang, M.; Chung, H.S.; Bae, H. Naturally occurring tyrosinase inhibitors: Mechanism and applications in skin health, cosmetics and agriculture industries. Phytother. Res. 2007, 21, 805–816. [Google Scholar] [CrossRef] [PubMed]
- Pillaiyar, T.; Manickam, M.; Namasivayam, V. Skin whitening agents: Medicinal chemistry perspective of tyrosinase inhibitors. J. Enzym. Inhib. Med. Chem. 2017, 32, 403–425. [Google Scholar] [CrossRef] [PubMed]
- Chang, T.S. An updated review of tyrosinase inhibitors. Int. J. Mol. Sci. 2009, 10, 2440–2475. [Google Scholar] [CrossRef] [PubMed]
- Loizzo, M.R.; Tundis, R.; Menichini, F. Natural and synthetic tyrosinase inhibitors as antibrowning agents: An update. Compr Rev. Food Sci. Food Saf. 2012, 11, 378–398. [Google Scholar] [CrossRef]
- Cabanes, J.; Chazarra, S.; Garciacarmona, F. Kojic acid, a cosmetic skin whitening agent, is a slow-binding inhibitor of catecholase activity of tyrosinase. J. Pharm. Pharmacol. 1994, 46, 982–985. [Google Scholar] [CrossRef] [PubMed]
- Chakraborty, A.K.; Funasaka, Y.; Komoto, M.; Ichihashi, M. Effect of arbutin on melanogenic proteins in human melanocytes. Pigment Cell Melanoma Res. 1998, 11, 206–212. [Google Scholar] [CrossRef]
- Palumbo, A.; d’Ischia, M.; Misuraca, G.; Prota, G. Mechanism of inhibition of melanogenesis by hydroquinone. Biochim. Biophys. Acta 1991, 1073, 85–90. [Google Scholar] [CrossRef]
- Shimogaki, H.; Tanaka, Y.; Tamai, H.; Masuda, M. In vitro and in vivo evaluation of ellagic acid on melanogenesis inhibition. Int. J. Cosmet. Sci. 2000, 22, 291–303. [Google Scholar] [CrossRef] [PubMed]
- Ha, Y.M.; Lee, H.J.; Park, D.; Jeong, H.O.; Park, J.Y.; Park, Y.J.; Lee, K.J.; Lee, J.Y.; Moon, H.R.; Chung, H.Y. Molecular docking studies of (1E,3E,5E)-1,6-bis(substituted phenyl)hexa-1,3,5-triene and 1,4-bis(substituted trans-styryl)benzene analogs as novel tyrosinase inhibitors. Biol. Pharm. Bull. 2013, 36, 55–65. [Google Scholar] [CrossRef] [PubMed]
- Shi, Y.; Chen, Q.X.; Wang, Q.; Song, K.K.; Qiu, L. Inhibitory effects of cinnamic acid and its derivatives on the diphenolase activity of mushroom (Agaricus bisporus) tyrosinase. Food Chem. 2005, 92, 707–712. [Google Scholar] [CrossRef]
- Kermasha, S.; Goetghebeur, M.; Monfette, A.; Metche, M.; Rovel, B. Studies on Inhibition of Mushroom Polyphenol Oxidase Using Chlorogenic Acid as Substrate. J. Agric. Food Chem. 1993, 41, 526–531. [Google Scholar] [CrossRef]
- Robert, C.; Rouch, C.; Cadet, F. Inhibition of palmito (Acanthophoenix rubra) polyphenol oxidase by carboxylic acids. Food Chem. 1997, 59, 355–360. [Google Scholar] [CrossRef]
- Davenport, L.; Dale, R.E.; Bisby, R.H.; Cundall, R.B. Transverse location of the fluorescent probe 1,6-diphenyl-1,3,5-hexatriene in model lipid bilayer membrane systems by resonance excitation energy transfer. Biochemistry 1985, 24, 4097–4108. [Google Scholar] [CrossRef] [PubMed]
- Tachibana, M. MITF: A stream flowing for pigment cells. Pigment Cell Melanoma Res. 2000, 13, 230–240. [Google Scholar] [CrossRef]
- Videira, I.F.; Moura, D.F.; Magina, S. Mechanisms regulating melanogenesis. An. Bras. Dermatol. 2013, 88, 76–83. [Google Scholar] [CrossRef] [PubMed]
- Park, H.Y.; Kosmadaki, M.; Yaar, M.; Gilchrest, B.A. Cellular mechanisms regulating human melanogenesis. Cell. Mol. Life Sci. 2009, 66, 1493–1506. [Google Scholar] [CrossRef] [PubMed]
- Slominski, A.; Tobin, D.J.; Shibahara, S.; Wortsman, J. Melanin pigmentation in mammalian skin and its hormonal regulation. Physiol. Rev. 2004, 84, 1155–1228. [Google Scholar] [CrossRef] [PubMed]
- Choi, T.Y.; Kim, J.H.; Ko, D.H.; Kim, C.H.; Hwang, J.S.; Ahn, S.; Kim, S.Y.; Kim, C.D.; Lee, J.H.; Yoon, T.J. Zebrafish as a new model for phenotype-based screening of melanogenic regulatory compounds. Pigment Cell Melanoma Res. 2007, 20, 120–127. [Google Scholar] [CrossRef] [PubMed]
- Raies, A.B.; Bajic, V.B. In silico toxicology: Computational methods for the prediction of chemical toxicity. Wiley Interdiscip. Rev. Comput. Mol. Sci. 2016, 6, 147–172. [Google Scholar] [CrossRef] [PubMed]
- Marchant, C.A.; Briggs, K.A.; Long, A. In silico tools for sharing data and knowledge on toxicity and metabolism: Derek for windows, meteor, and vitic. Toxicol. Mech. Methods 2008, 18, 177–187. [Google Scholar] [CrossRef] [PubMed]
- Oh, J.; Jeon, S.B.; Lee, Y.; Lee, H.; Kim, J.; Kwon, B.R.; Yu, K.Y.; Cha, J.D.; Hwang, S.M.; Choi, K.M.; Jeong, Y.S. Fermented red ginseng extract inhibits cancer cell proliferation and viability. J. Med. Food 2015, 18, 421–428. [Google Scholar] [CrossRef] [PubMed]
- Bradford, M.M. A rapid and sensitive method for the quantitation of microgram quantities of protein utilizing the principle of protein-dye binding. Anal. Biochem. 1976, 72, 248–254. [Google Scholar] [CrossRef]
- Masamoto, Y.; Ando, H.; Murata, Y.; Shimoishi, Y.; Tada, M.; Takahata, K. Mushroom tyrosinase inhibitory activity of esculetin isolated from seeds of Euphorbia lathyris L. Biosci. Biotechnol. Biochem. 2003, 67, 631–634. [Google Scholar] [CrossRef] [PubMed]
- Satooka, H.; Kubo, I. Resveratrol as a kcat type inhibitor for tyrosinase: Potentiated melanogenesis inhibitor. Bioorg. Med. Chem. 2012, 20, 1090–1099. [Google Scholar] [CrossRef] [PubMed]
- Woo, Y.; Oh, J.; Kim, J.S. Suppression of Nrf2 activity by chestnut leaf extract increases chemosensitivity of breast cancer stem cells to paclitaxel. Nutrients 2017, 9, 760. [Google Scholar] [CrossRef] [PubMed]
- Seo, H.; Oh, J.; Hahn, D.; Kwon, C.S.; Lee, J.S.; Kim, J.S. Protective effect of glyceollins in a mouse model of dextran sulfate sodium-induced colitis. J. Med. Food 2017, 20, 1055–1062. [Google Scholar] [CrossRef] [PubMed]
- Choi, J.S.; Kim, R.O.; Yoon, S.; Kim, W.K. Developmental toxicity of zinc oxide nanoparticles to zebrafish (Danio rerio): A transcriptomic analysis. PLoS ONE 2016, 11, e0160763. [Google Scholar] [CrossRef] [PubMed]
- Chen, W.C.; Tseng, T.S.; Hsiao, N.W.; Lin, Y.L.; Wen, Z.H.; Tsai, C.C.; Lee, Y.C.; Lin, H.H.; Tsai, K.C. Discovery of highly potent tyrosinase inhibitor, T1, with significant anti-melanogenesis ability by zebrafish in vivo assay and computational molecular modeling. Sci. Rep. 2015, 5, 7995. [Google Scholar] [CrossRef] [PubMed]


| Gene (NCBI Accession No.) | Primer (5′→3′) | Product Length (bp) | |
|---|---|---|---|
| Forward | Reverse | ||
| Tyr (NM_011661) | CCTCCTGGCAGATCATTTGT | GGCAAATCCTTCCAGTGTGT | 236 |
| Tyrp1 (NM_001282015) | CTTGGAGGTCCGTGTATTTG | GACCGCATCAGTGAAAGTGT | 223 |
| Tyrp2 (NM_010024) | TACCATCTGTTGTGGCTGGA | CAAGCTGTCGCACACAATCT | 204 |
| Mitf (NM_001178049) | AGGACCTTGAAAACCGACAG | GTGGATGGGATAAGGGAAAG | 115 |
| β-actin (NM_007393) | ACTATTGGCAACGAGCGGTT | ATGGATGCCACAGGATTCCA | 81 |
© 2018 by the authors. Licensee MDPI, Basel, Switzerland. This article is an open access article distributed under the terms and conditions of the Creative Commons Attribution (CC BY) license (http://creativecommons.org/licenses/by/4.0/).
Share and Cite
Oh, J.; Kim, J.; Jang, J.H.; Lee, S.; Park, C.M.; Kim, W.-K.; Kim, J.-S. Novel (1E,3E,5E)-1,6-bis(Substituted phenyl)hexa-1,3,5-triene Analogs Inhibit Melanogenesis in B16F10 Cells and Zebrafish. Int. J. Mol. Sci. 2018, 19, 1067. https://doi.org/10.3390/ijms19041067
Oh J, Kim J, Jang JH, Lee S, Park CM, Kim W-K, Kim J-S. Novel (1E,3E,5E)-1,6-bis(Substituted phenyl)hexa-1,3,5-triene Analogs Inhibit Melanogenesis in B16F10 Cells and Zebrafish. International Journal of Molecular Sciences. 2018; 19(4):1067. https://doi.org/10.3390/ijms19041067
Chicago/Turabian StyleOh, Jisun, Jungeun Kim, Jin Ho Jang, Sangwoo Lee, Chul Min Park, Woo-Keun Kim, and Jong-Sang Kim. 2018. "Novel (1E,3E,5E)-1,6-bis(Substituted phenyl)hexa-1,3,5-triene Analogs Inhibit Melanogenesis in B16F10 Cells and Zebrafish" International Journal of Molecular Sciences 19, no. 4: 1067. https://doi.org/10.3390/ijms19041067