In Vitro Identification of New Transcriptomic and miRNomic Profiles Associated with Pulmonary Fibrosis Induced by High Doses Everolimus: Looking for New Pathogenetic Markers and Therapeutic Targets

 , ,
, ,  ,
,  , ,
, , 

Abstract
:1. Introduction
2. Results
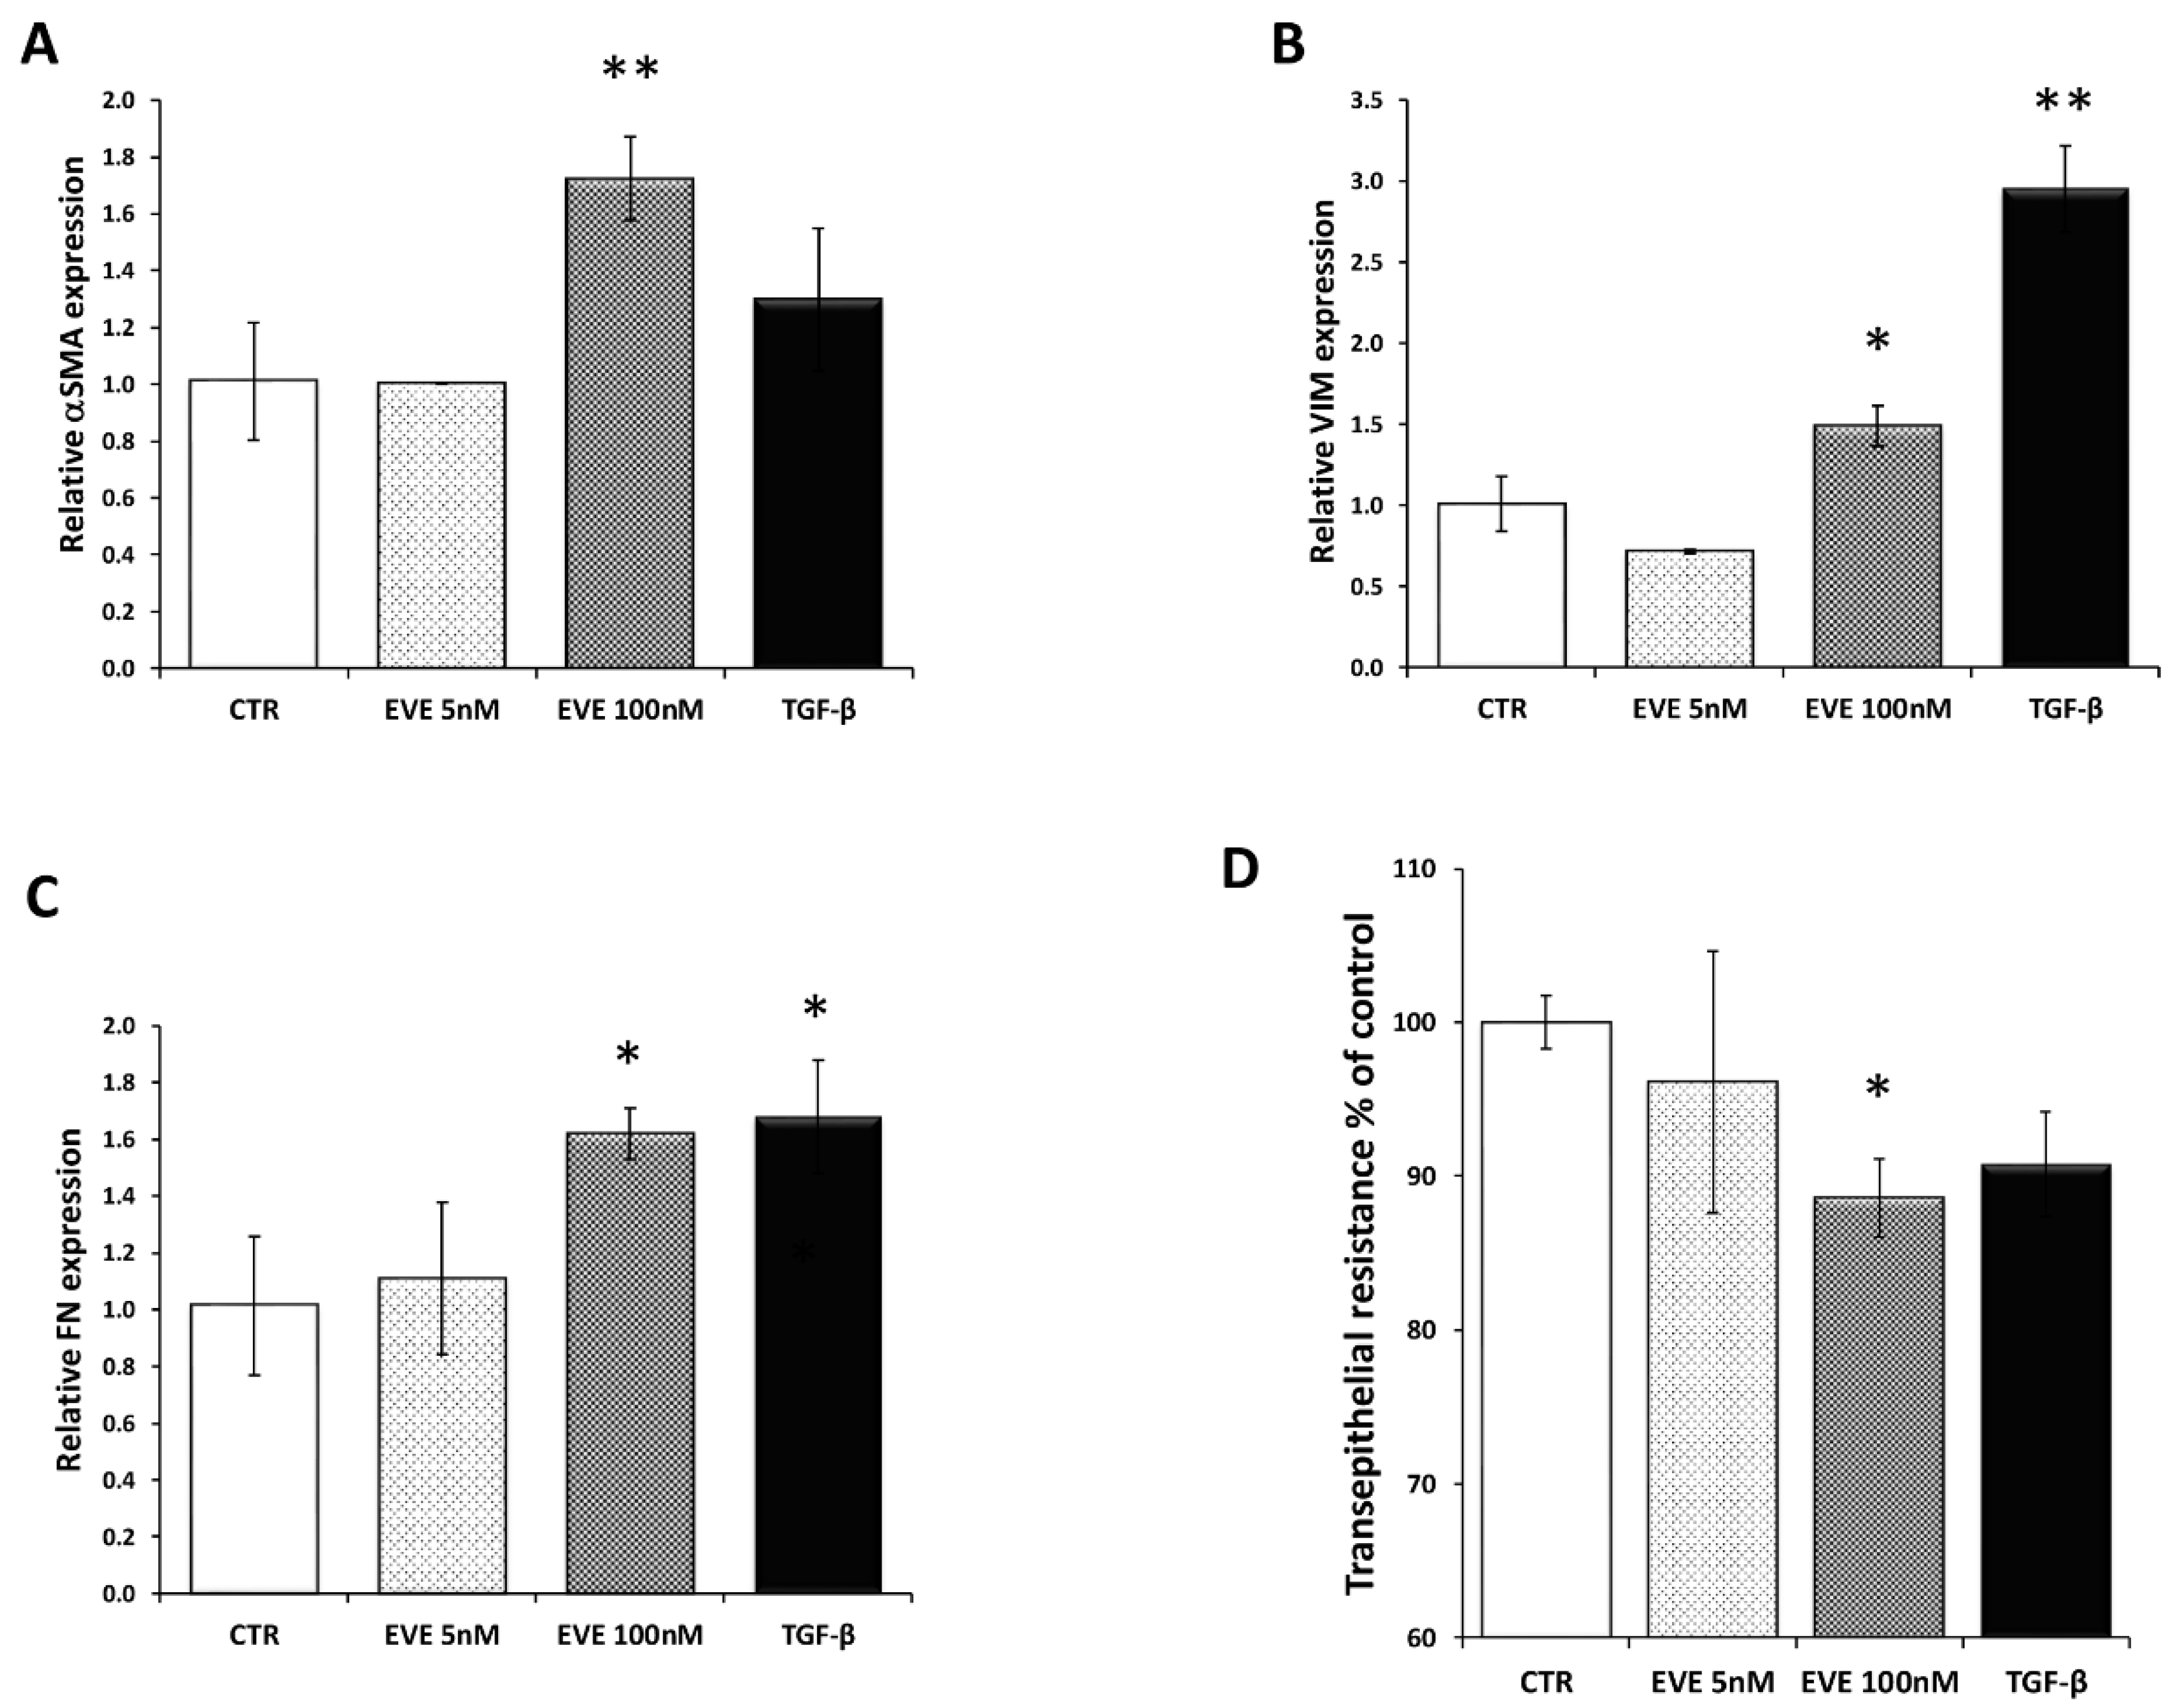
2.1. High Dosage Everolimus (EVE) Induced Epithelial to Mesenchymal Transition (EMT) of BE63/3 (Primary Bronchial Epithelial Cells)
2.2. Transcriptomic Analysis Revealed That High Dosage of EVE Up-Regulated Genes Involved in Collagen Synthesis and Metabolism
2.3. MiRNome Analysis Identified Specific MicroRNAs Deregulated by EVE
2.4. Gene Expression and Protein Analysis for Matrix Metalloproteinase 12 (MMP12) and Connective Tissue Growth Factor (CTGF) Validated High-Throughput Results
2.5. Validation of Transcriptomic Results in an Additional Primary Cell Line (BE121/3)
2.6. High Dosage EVE Up-Regulated CTGF and Collagen1 in Fibroblasts and Hepatic Stellate Cells
3. Discussion
4. Materials and Methods
4.1. Cell Culture Treatment
4.2. RNA Extraction and Gene Expression Profiling
4.3. Pathway Analysis
4.4. MicroRNA Expression Profiling
4.5. Real-Time PCR
4.6. Western Blot
4.7. Transepithelial Resistance (TER)
4.8. Statistical Analysis
Supplementary Materials
Acknowledgments
Author Contributions
Conflicts of Interest
References
- Fasolo, A.; Sessa, C. Targeting mTOR pathways in human malignancies. Curr. Pharm. Des. 2012, 18, 2766–2777. [Google Scholar] [CrossRef] [PubMed]
- Sarbassov, D.D.; Ali, S.M.; Sabatini, D.M. Growing roles for the mTOR pathway. Curr. Opin. Cell Biol. 2005, 17, 596–603. [Google Scholar] [CrossRef] [PubMed]
- Chan, L.; Hartmann, E.; Cibrik, D.; Cooper, M.; Shaw, L.M. Optimal everolimus concentration is associated with risk reduction for acute rejection in de novo renal transplant recipients. Transplantation 2010, 90, 31–37. [Google Scholar] [CrossRef] [PubMed]
- Romagnoli, J.; Citterio, F.; Favi, E.; Salerno, M.P.; Tondolo, V.; Spagnoletti, G.; Renna, R.; Castagneto, M. Higher incidence of acute rejection in renal transplant recipients with low everolimus exposure. Transplant. Proc. 2007, 39, 1823–1826. [Google Scholar] [CrossRef] [PubMed]
- Zaza, G.; Tomei, P.; Ria, P.; Granata, S.; Boschiero, L.; Lupo, A. Systemic and nonrenal adverse effects occurring in renal transplant patients treated with mTOR inhibitors. Clin. Dev. Immunol. 2013, 2013, 403280. [Google Scholar] [CrossRef] [PubMed]
- Kaplan, B.; Qazi, Y.; Wellen, J.R. Strategies for the management of adverse events associated with mTOR inhibitors. Transplant. Rev. 2014, 28, 126–133. [Google Scholar] [CrossRef] [PubMed]
- Engelen, M.A.; Welp, H.A.; Gunia, S.; Amler, S.; Klarner, M.P.; Dell’aquila, A.M.; Stypmann, J. Prospective study of everolimus with calcineurin inhibitor-free immunosuppression after heart transplantation: Results at four years. Ann. Thorac. Surg. 2014, 97, 888–893. [Google Scholar] [CrossRef] [PubMed]
- Champion, L.; Stern, M.; Israël-Biet, D.; Mamzer-Bruneel, M.-F.; Peraldi, M.-N.; Kreis, H.; Porcher, R.; Morelon, E. Sirolimus-associated pneumonitis: 24 cases in renal transplant recipients. Ann. Intern. Med. 2006, 144, 505–509. [Google Scholar] [CrossRef] [PubMed]
- Pham, P.T.; Pham, P.C.; Danovitch, G.M.; Ross, D.J.; Gritsch, H.A.; Kendrick, E.A.; Singer, J.; Shah, T.; Wilkinson, A.H. Sirolimus-associated pulmonary toxicity. Transplantation 2004, 77, 1215–1220. [Google Scholar] [CrossRef] [PubMed]
- Weiner, S.M.; Sellin, L.; Vonend, O.; Schenker, P.; Buchner, N.J.; Flecken, M.; Viebahn, R.; Rump, L.C. Pneumonitis associated with sirolimus: Clinical characteristics, risk factors and outcome—A single-centre experience and review of the literature. Nephrol. Dial. Transplant. 2007, 22, 3631–3637. [Google Scholar] [CrossRef] [PubMed]
- West, M.L. Bronchiolitis obliterans and organizing pneumonia in renal transplant recipients. Transplantation 2000, 69, 1531. [Google Scholar] [CrossRef]
- Feagans, J.; Victor, D.; Moehlen, M.; Florman, S.S.; Regenstein, F.; Balart, L.A.; Joshi, S.; Killackey, M.T.; Slakey, D.P.; Paramesh, A.S. Interstitial pneumonitis in the transplant patient: Consider sirolimus-associated pulmonary toxicity. J. La. State Med. Soc. 2009, 161, 166–172. [Google Scholar] [PubMed]
- Molas-Ferrer, G.; Soy-Muner, D.; Anglada-Martínez, H.; Riu-Viladoms, G.; Estefanell-Tejero, A.; Ribas-Sala, J. Interstitial pneumonitis as an adverse reaction to mTOR inhibitors. Nefrologia 2013, 33, 297–300. [Google Scholar] [PubMed]
- Lopez, P.; Kohler, S.; Dimri, S. Interstitial lung disease associated with mTOR inhibitors in solid organ transplant recipients: Results from a large phase III clinical trial program of everolimus and review of the literature. J. Transplant. 2014, 2014, 305931. [Google Scholar] [CrossRef] [PubMed]
- Morelon, E.; Stern, M.; Israël-Biet, D.; Correas, J.M.; Danel, C.; Mamzer-Bruneel, M.F.; Peraldi, M.N.; Kreis, H. Characteristics of sirolimus-associated interstitial pneumonitis in renal transplant patients. Transplantation 2001, 72, 787–790. [Google Scholar] [CrossRef] [PubMed]
- Hasni, K.; Slusher, J.; Siddiqui, W.; Matsumura, D.; Malek, B.; Heifets, M.; Ahmed, Z. Bronchiolitis obliterans organizing pneumonia in renal transplant patients. Dial. Transplant. 2010, 39, 449–451. [Google Scholar] [CrossRef]
- Errasti, P.; Izquierdo, D.; Martín, P.; Errasti, M.; Slon, F.; Romero, A.; Lavilla, F.J. Pneumonitis associated with mammalian target of rapamycin inhibitors in renal transplant recipients: A single-center experience. Transplant. Proc. 2010, 42, 3053–3054. [Google Scholar] [CrossRef] [PubMed]
- Alexandru, S.; Ortiz, A.; Baldovi, S.; Milicua, J.M.; Ruíz-Escribano, E.; Egido, J.; Plaza, J.J. Severe everolimus-associated pneumonitis in a renal transplant recipient. Nephrol. Dial. Transplant. 2008, 23, 3353–3355. [Google Scholar] [CrossRef] [PubMed]
- Rodríguez-Moreno, A.; Ridao, N.; García-Ledesma, P.; Calvo, N.; Pérez-Flores, I.; Marques, M.; Barrientos, A.; Sánchez-Fructuoso, A.I. Sirolimus and everolimus induced pneumonitis in adult renal allograft recipients: Experience in a center. Transplant. Proc. 2009, 41, 2163–2165. [Google Scholar] [CrossRef] [PubMed]
- Kage, H.; Borok, Z. EMT and interstitial lung disease: A mysterious relationship. Curr. Opin. Pulm. Med. 2012, 18, 517–523. [Google Scholar] [CrossRef] [PubMed]
- Horowitz, J.C.; Thannickal, V.J. Epithelial-mesenchymal interactions in pulmonary fibrosis. Semin. Respir. Crit. Care Med. 2006, 27, 600–612. [Google Scholar] [CrossRef] [PubMed]
- Strieter, R.M.; Mehrad, B. New mechanisms of pulmonary fibrosis. Chest 2009, 136, 1364–1370. [Google Scholar] [CrossRef] [PubMed]
- Felton, V.M.; Inge, L.J.; Willis, B.C.; Bremner, R.M.; Smith, M.A. Immunosuppression-induced bronchial epithelial-mesenchymal transition: A potential contributor to obliterative bronchiolitis. J. Thorac. Cardiovasc. Surg. 2011, 141, 523–530. [Google Scholar] [CrossRef] [PubMed]
- Tomei, P.; Masola, V.; Granata, S.; Bellin, G.; Carratù, P.; Ficial, M.; Ventura, V.A.; Onisto, M.; Resta, O.; Gambaro, G.; et al. Everolimus-induced epithelial to mesenchymal transition (EMT) in bronchial/pulmonary cells: When the dosage does matter in transplantation. J. Nephrol. 2016, 29, 881–891. [Google Scholar] [CrossRef] [PubMed]
- Masola, V.; Carraro, A.; Zaza, G.; Bellin, G.; Montin, U.; Violi, P.; Lupo, A.; Tedeschi, U. Epithelial to mesenchymal transition in the liver field: The double face of Everolimus in vitro. BMC Gastroenterol. 2015, 15, 118. [Google Scholar] [CrossRef] [PubMed]
- Masola, V.; Zaza, G.; Granata, S.; Gambaro, G.; Onisto, M.; Lupo, A. Everolimus-induced epithelial to mesenchymal transition in immortalized human renal proximal tubular epithelial cells: Key role of heparanase. J. Transl. Med. 2013, 11, 292. [Google Scholar] [CrossRef] [PubMed]
- Breuleux, M.; Klopfenstein, M.; Stephan, C.; Doughty, C.A.; Barys, L.; Maira, S.M.; Kwiatkowski, D.; Lane, H.A. Increased AKT S473 phosphorylation after mTORC1 inhibition is rictor dependent and does not predict tumor cell response to PI3 K/mTOR inhibition. Mol. Cancer Ther. 2009, 8, 742–753. [Google Scholar] [CrossRef] [PubMed]
- Wan, X.; Harkavy, B.; Shen, N.; Grohar, P.; Helman, L.J. Rapamycin induces feedback activation of Akt signaling through an IGF-1R-dependent mechanism. Oncogene 2007, 26, 1932–1940. [Google Scholar] [CrossRef] [PubMed]
- Bhaskar, P.T.; Hay, N. The two TORCs and Akt. Dev. Cell 2007, 12, 487–502. [Google Scholar] [CrossRef] [PubMed]
- Carracedo, A.; Ma, L.; Teruya-Feldstein, J.; Rojo, F.; Salmena, L.; Alimonti, A.; Egia, A.; Sasaki, A.T.; Thomas, G.; Kozma, S.C.; et al. Inhibition of mTORC1 leads to MAPK pathway activation through a PI3K-dependent feedback loop in human cancer. J. Clin. Investig. 2008, 118, 3065–3074. [Google Scholar] [CrossRef] [PubMed]
- Witzig, T.E.; Reeder, C.; Han, J.J.; LaPlant, B.; Stenson, M.; Tun, H.W.; Macon, W.; Ansell, S.M.; Habermann, T.M.; Inwards, D.J.; et al. The mTORC1 inhibitor everolimus has antitumor activity in vitro and produces tumor responses in patients with relapsed T-cell lymphoma. Blood 2015, 126, 328–335. [Google Scholar] [CrossRef] [PubMed]
- Guo, H.; Zhong, Y.; Jackson, A.L.; Clark, L.H.; Kilgore, J.; Zhang, L.; Han, J.; Sheng, X.; Gilliam, T.P.; Gehrig, P.A.; et al. Everolimus exhibits anti-tumorigenic activity in obesity-induced ovarian cancer. Oncotarget 2016, 7, 20338–20356. [Google Scholar] [CrossRef] [PubMed]
- Yunokawa, M.; Koizumi, F.; Kitamura, Y.; Katanasaka, Y.; Okamoto, N.; Kodaira, M.; Yonemori, K.; Shimizu, C.; Ando, M.; Masutomi, K.; et al. Efficacy of everolimus, a novel mTOR inhibitor, against basal-like triple-negative breast cancer cells. Cancer Sci. 2012, 103, 1665–1671. [Google Scholar] [CrossRef] [PubMed]
- Browne, A.J.; Kubasch, M.L.; Göbel, A.; Hadji, P.; Chen, D.; Rauner, M.; Stölzel, F.; Hofbauer, L.C.; Rachner, T.D. Concurrent antitumor and bone-protective effects of everolimus in osteotropic breast cancer. Breast Cancer Res. 2017, 19, 92. [Google Scholar] [CrossRef] [PubMed]
- Vandewiele, B.; Vandecasteele, S.J.; Vanwalleghem, L.; De Vriese, A.S. Diffuse alveolar hemorrhage induced by everolimus. Chest 2010, 137, 456–459. [Google Scholar] [CrossRef] [PubMed]
- Vlahakis, N.E.; Rickman, O.B.; Morgenthaler, T. Sirolimus-associated diffuse alveolar hemorrhage. Mayo Clin. Proc. 2004, 79, 541–545. [Google Scholar] [CrossRef] [PubMed]
- Cravedi, P.; Ruggenenti, P.; Remuzzi, G. Sirolimus for calcineurin inhibitors in organ transplantation: Contra. Kidney Int. 2010, 78, 1068–1074. [Google Scholar] [CrossRef] [PubMed]
- Schmitz, F.; Heit, A.; Dreher, S.; Eisenächer, K.; Mages, J.; Haas, T.; Krug, A.; Janssen, K.P.; Kirschning, C.J.; Wagner, H. Mammalian target of rapamycin (mTOR) orchestrates the defense program of innate immune cells. Eur. J. Immunol. 2008, 38, 2981–2992. [Google Scholar] [CrossRef] [PubMed]
- Ussavarungsi, K.; Elsanjak, A.; Laski, M.; Raj, R.; Nugent, K. Sirolimus induced granulomatous interstitial pneumonitis. Respir. Med. Case Rep. 2012, 7, 8–11. [Google Scholar] [CrossRef] [PubMed]
- Vasudevan, S.; Steitz, J.A. AU-rich-element-mediated upregulation of translation by FXR1 and Argonaute 2. Cell 2007, 128, 1105–1118. [Google Scholar] [CrossRef] [PubMed]
- Valinezhad Orang, A.; Safaralizadeh, R.; Kazemzadeh-Bavili, M. Mechanisms of miRNA-mediated gene regulation from common downregulation to mRNA-specific upregulation. Int. J. Genom. 2014, 2014, 970607. [Google Scholar] [CrossRef] [PubMed]
- Duncan, M.R.; Frazier, K.S.; Abramson, S.; Williams, S.; Klapper, H.; Huang, X.; Grotendorst, G.R. Connective tissue growth factor mediates transforming growth factor β-induced collagen synthesis: Down-regulation by cAMP. FASEB J. 1999, 13, 1774–1786. [Google Scholar] [CrossRef] [PubMed]
- Cicha, I.; Goppelt-Struebe, M. Connective tissue growth factor: Context-dependent functions and mechanisms of regulation. Biofactors 2009, 35, 200–208. [Google Scholar] [CrossRef] [PubMed]
- Pan, L.H.; Yamauchi, K.; Uzuki, M.; Nakanishi, T.; Takigawa, M.; Inoue, H.; Sawai, T. Type II alveolar epithelial cells and interstitial fibroblasts express connective tissue growth factor in IPF. Eur. Respir. J. 2001, 17, 1220–1227. [Google Scholar] [CrossRef] [PubMed]
- Lipson, K.E.; Wong, C.; Teng, Y.; Spong, S. CTGF is a central mediator of tissue remodeling and fibrosis and its inhibition can reverse the process of fibrosis. Fibrogenes. Tissue Repair 2012, 5, S24. [Google Scholar] [CrossRef] [PubMed]
- Grotendorst, G.R. Connective tissue growth factor: A mediator of TGF-beta action on fibroblasts. Cytokine Growth Factor Rev. 1997, 8, 171–179. [Google Scholar] [CrossRef]
- Nishida, T.; Kondo, S.; Maeda, A.; Kubota, S.; Lyons, K.M.; Takigawa, M. CCN family 2/connective tissue growth factor (CCN2/CTGF) regulates the expression of Vegf through Hif-1α expression in a chondrocytic cell line, HCS-2/8, under hypoxic condition. Bone 2009, 44, 24–31. [Google Scholar] [CrossRef] [PubMed]
- Sonnylal, S.; Shi-Wen, X.; Leoni, P.; Naff, K.; van Pelt, C.S.; Nakamura, H.; Leask, A.; Abraham, D.; Bou-Gharios, G.; de Crombrugghe, B. Selective expression of connective tissue growth factor in fibroblasts in vivo promotes systemic tissue fibrosis. Arthritis Rheumatol. 2010, 62, 1523–1532. [Google Scholar] [CrossRef] [PubMed]
- Balah, A.; Ezzate, O. The mTOR inhibitor rapamycin induces CTGF and TIMP-1 expression in rat kidney: Implication of TGF-β/SMAD signaling cascade. Eur. J. Pharm. Med. Res. 2017, 4, 49–56. [Google Scholar]
- Xu, X.; Dai, H.; Geng, J.; Wan, X.; Huang, X.; Li, F.; Jiang, D.; Wang, C. Rapamycin increases CCN2 expression of lung fibroblasts via phosphoinositide 3-kinase. Lab. Investig. 2015, 95, 846–859. [Google Scholar] [CrossRef] [PubMed]
- Xu, X.; Wan, X.; Geng, J.; Li, F.; Yang, T.; Dai, H. Rapamycin regulates connective tissue growth factor expression of lung epithelial cells via phosphoinositide 3-kinase. Exp. Biol. Med. 2013, 238, 1082–1094. [Google Scholar] [CrossRef] [PubMed]
- Finckenberg, P.; Inkinen, K.; Ahonen, J.; Merasto, S.; Louhelainen, M.; Vapaatalo, H.; Müller, D.; Ganten, D.; Luft, F.; Mervaala, E. Angiotensin II induces connective tissue growth factor gene expression via calcineurin-dependent pathways. Am. J. Pathol. 2003, 163, 355–366. [Google Scholar] [CrossRef]
- Mikaelian, I.; Malek, M.; Gadet, R.; Viallet, J.; Garcia, A.; Girard-Gagnepain, A.; Hesling, C.; Gillet, G.; Gonzalo, P.; Rimokh, R.; et al. Genetic and pharmacologic inhibition of mTORC1 promotes EMT by a TGF-β-independent mechanism. Cancer Res. 2013, 73, 6621–6631. [Google Scholar] [CrossRef] [PubMed]
- Shihab, F.S.; Bennett, W.M.; Yi, H.; Andoh, T.F. Effect of cyclosporine and sirolimus on the expression of connective tissue growth factor in rat experimental chronic nephrotoxicity. Am. J. Nephrol. 2006, 26, 400–407. [Google Scholar] [CrossRef] [PubMed]
- O’Connell, S.; Slattery, C.; Ryan, M.P.; McMorrow, T. Sirolimus enhances cyclosporine a-induced cytotoxicity in human renal glomerular mesangial cells. J. Transplant. 2012, 2012, 980910. [Google Scholar] [CrossRef] [PubMed]
- Catania, J.M.; Chen, G.; Parrish, A.R. Role of matrix metalloproteinases in renal pathophysiologies. Am. J. Physiol. Renal. Physiol. 2007, 292, F905–F911. [Google Scholar] [CrossRef] [PubMed]
- Parks, W.C.; Wilson, C.L.; López-Boado, Y.S. Matrix metalloproteinases as modulators of inflammation and innate immunity. Nat. Rev. Immunol. 2004, 4, 617–629. [Google Scholar] [CrossRef] [PubMed]
- Matute-Bello, G.; Wurfel, M.M.; Lee, J.S.; Park, D.R.; Frevert, C.W.; Madtes, D.K.; Shapiro, S.D.; Martin, T.R. Essential role of MMP-12 in Fas-induced lung fibrosis. Am. J. Respir. Cell Mol. Biol. 2007, 37, 210–221. [Google Scholar] [CrossRef] [PubMed]
- Kang, H.R.; Cho, S.J.; Lee, C.G.; Homer, R.J.; Elias, J.A. Transforming growth factor (TGF)-β1 stimulates pulmonary fibrosis and inflammation via a Bax-dependent, Bid-activated pathway that involves matrix metalloproteinase-12. J. Biol. Chem. 2007, 282, 7723–7732. [Google Scholar] [CrossRef] [PubMed]
- Tanaka, Y.; Kanda, M.; Sugimoto, H.; Shimizu, D.; Sueoka, S.; Takami, H.; Ezaka, K.; Hashimoto, R.; Okamura, Y.; Iwata, N.; et al. Translational implication of Kallmann syndrome-1 gene expression in hepatocellular carcinoma. Int. J. Oncol. 2015, 46, 2546–2554. [Google Scholar] [CrossRef] [PubMed]
- Raju, R.; Jian, B.; Hooks, J.J.; Nagineni, C.N. Transforming growth factor-β regulates the expression of anosmin (KAL-1) in human retinal pigment epithelial cells. Cytokine 2013, 61, 724–727. [Google Scholar] [CrossRef] [PubMed]
- Carew, R.M.; Browne, M.B.; Hickey, F.B.; Brazil, D.P. Insulin receptor substrate 2 and FoxO3a signalling are involved in E-cadherin expression and transforming growth factor-β1-induced repression in kidney epithelial cells. FEBS J. 2011, 278, 3370–3380. [Google Scholar] [CrossRef] [PubMed]
- Rieger, M.E.; Sims, A.H.; Coats, E.R.; Clarke, R.B.; Briegel, K.J. The embryonic transcription cofactor LBH is a direct target of the Wnt signaling pathway in epithelial development and in aggressive basal subtype breast cancers. Mol. Cell Biol. 2010, 30, 4267–4279. [Google Scholar] [CrossRef] [PubMed]
- Liu, Q.; Guan, X.; Lv, J.; Li, X.; Wang, Y.; Li, L. Limb-bud and Heart (LBH) functions as a tumor suppressor of nasopharyngeal carcinoma by inducing G1/S cell cycle arrest. Sci. Rep. 2015, 5, 7626. [Google Scholar] [CrossRef] [PubMed]
- Lam, A.P.; Flozak, A.S.; Russell, S.; Wei, J.; Jain, M.; Mutlu, G.M.; Budinger, G.R.; Feghali-Bostwick, C.A.; Varga, J.; Gottardi, C.J. Nuclear β-catenin is increased in systemic sclerosis pulmonary fibrosis and promotes lung fibroblast migration and proliferation. Am. J. Respir. Cell Mol. Biol. 2011, 45, 915–922. [Google Scholar] [CrossRef] [PubMed]
- Chen, H.F.; Ma, R.R.; He, J.Y.; Zhang, H.; Liu, X.L.; Guo, X.Y.; Gao, P. Protocadherin 7 inhibits cell migration and invasion through E-cadherin in gastric cancer. Tumour Biol. 2017, 39, 1010428317697551. [Google Scholar] [CrossRef] [PubMed]
- Galietta, L.J.; Lantero, S.; Gazzolo, A.; Sacco, O.; Romano, L.; Rossi, G.A.; Zegarra-Moran, O. An improved method to obtain highly differentiated monolayers of human bronchial epithelial cells. In Vitro Cell. Dev. Biol. Anim. 1998, 34, 478–481. [Google Scholar] [CrossRef] [PubMed]


| Probe ID | Fold Change | Regulation | Symbol | Entrez Gene ID | Definition |
|---|---|---|---|---|---|
| 4760626 | 2.275 | Up | MMP12 | 4321 | matrix metallopeptidase 12 (macrophage elastase), mRNA. |
| 4780209 | 2.218 | Up | MMP12 | 4321 | matrix metallopeptidase 12 (macrophage elastase) mRNA. |
| 670041 | 1.925 | Up | AKAP12 | 9590 | A kinase (PRKA) anchor protein (gravin) 12, transcript variant 2, mRNA. |
| 6770746 | 1.903 | Up | LOC728715 | 728715 | similar to hCG38149 (LOC728715), mRNA. |
| 4640086 | 1.814 | Up | FOXQ1 | 94234 | forkhead box Q1, mRNA. |
| 2810246 | 1.808 | Up | LBH | 81606 | limb bud and heart development homolog (mouse) (LBH), mRNA. |
| 6330270 | 1.804 | Up | GPC4 | 2239 | glypican 4, mRNA. |
| 6620201 | 1.789 | Up | KLHL24 | 54800 | kelch-like 24 (Drosophila), mRNA. |
| 5690687 | 1.783 | Up | CTGF | 1490 | connective tissue growth factor, mRNA. |
| 5420577 | 1.775 | Up | CLCA4 | 22802 | chloride channel, calcium activated, family member 4, mRNA. |
| 2640292 | 1.769 | Up | CTGF | 1490 | connective tissue growth factor, mRNA. |
| 1070477 | 1.753 | Up | ALDH1A1 | 216 | aldehyde dehydrogenase 1 family, member A1, mRNA. |
| 3130301 | 1.729 | Up | PIM1 | 5292 | pim-1 oncogene, mRNA. |
| 6620008 | 1.705 | up | KAL1 | 3730 | Kallmann syndrome 1 sequence, mRNA. |
| 4040576 | 1.704 | up | IL6 | 3569 | interleukin 6 (interferon, beta 2), mRNA. |
| 1820315 | 1.677 | up | C4orf26 | 152816 | chromosome 4 open reading frame 26 (C4orf26), mRNA. |
| 1990142 | 1.671 | up | C20orf114 | 92747 | chromosome 20 open reading frame 114 (C20orf114), mRNA. |
| 1940647 | 1.668 | up | HBP1 | 26959 | HMG-box transcription factor 1, mRNA. |
| 2640324 | 1.665 | up | SLC46A3 | 283537 | solute carrier family 46, member 3, mRNA. |
| 3800241 | 1.651 | up | CDH6 | 1004 | cadherin 6, type 2, K-cadherin (fetal kidney), mRNA. |
| 6110736 | 1.646 | up | IRS2 | 8660 | insulin receptor substrate 2, mRNA. |
| 4610056 | 1.641 | up | FLRT2 | 23768 | fibronectin leucine rich transmembrane protein 2, mRNA. |
| 6420687 | 1.638 | up | PLUNC | 51297 | palate, lung and nasal epithelium carcinoma associated, transcript variant 2, mRNA. |
| 6420465 | 1.625 | up | GABARAPL1 | 23710 | GABA(A) receptor-associated protein like 1, mRNA. |
| 4780128 | 1.625 | up | ATF3 | 467 | activating transcription factor 3, transcript variant 4, mRNA. |
| 160242 | 1.622 | up | C13orf15 | 28984 | chromosome 13 open reading frame 15 (C13orf15), mRNA. |
| 2650709 | 1.620 | up | CDH11 | 1009 | cadherin 11, type 2, OB-cadherin (osteoblast), mRNA. |
| 2230767 | 1.615 | up | LOC387825 | 387825 | misc_RNA (LOC387825), miscRNA. |
| 6860228 | 1.610 | up | C5orf41 | 153222 | chromosome 5 open reading frame 41 (C5orf41), mRNA. |
| 6510754 | 1.609 | up | ALDH1A1 | 216 | aldehyde dehydrogenase 1 family, member A1, mRNA. |
| 1980255 | 1.605 | up | RNF39 | 80352 | ring finger protein 39, transcript variant 2, mRNA. |
| 6840491 | 1.604 | up | C5orf41 | 153222 | chromosome 5 open reading frame 41 (C5orf41), mRNA. |
| 4280228 | 1.595 | up | IVNS1ABP | 10625 | influenza virus NS1A binding protein, mRNA. |
| 5080021 | 1.593 | up | BIRC3 | 330 | baculoviral IAP repeat-containing 3, transcript variant 1, mRNA. |
| 6400131 | 1.589 | up | CYP24A1 | 1591 | cytochrome P450, family 24, subfamily A, polypeptide 1, nuclear gene encoding mitochondrial protein, mRNA. |
| 7160239 | 1.580 | up | FOSB | 2354 | FBJ murine osteosarcoma viral oncogene homolog B, mRNA. |
| 380689 | 1.578 | up | TSC22D1 | 8848 | TSC22 domain family, member 1, transcript variant 1, mRNA. |
| 3060095 | 1.574 | up | COL12A1 | 1303 | collagen, type XII, alpha 1, transcript variant short, mRNA. |
| 1410209 | 1.571 | up | SGK1 | 6446 | serum/glucocorticoid regulated kinase 1, transcript variant 1, mRNA. |
| 2190553 | 1.556 | up | FZD6 | 8323 | frizzled homolog 6 (Drosophila), mRNA. |
| 4570075 | 1.544 | up | KIAA1641 | 57730 | KIAA1641, transcript variant 7, mRNA. |
| 5090626 | 1.540 | up | FAP | 2191 | fibroblast activation protein, alpha, mRNA. |
| 6620538 | 1.540 | up | UBL3 | 5412 | ubiquitin-like 3, mRNA. |
| 5960398 | 1.537 | up | NT5E | 4907 | 5′-nucleotidase, ecto (CD73), mRNA. |
| 5570731 | 1.533 | up | C8orf4 | 56892 | chromosome 8 open reading frame 4 (C8orf4), mRNA. |
| 830639 | 1.531 | up | LOC653778 | 653778 | similar to solute carrier family 25, member 37 (LOC653778), mRNA. |
| 3290187 | 1.529 | up | PCMTD1 | 115294 | protein-l-isoaspartate (d-aspartate) O-methyltransferase domain containing 1 (PCMTD1), mRNA. |
| 3440670 | 1.517 | up | LOC402251 | 402251 | similar to eukaryotic translation elongation factor 1 alpha 2 (LOC402251), mRNA. |
| 630315 | 1.514 | up | DHRS9 | 10170 | dehydrogenase/reductase (SDR family) member 9, transcript variant 1, mRNA. |
| 1410161 | 1.513 | up | KLHL5 | 51088 | kelch-like 5 (Drosophila), transcript variant 3, mRNA. |
| 4150575 | 1.513 | up | LETMD1 | 25875 | LETM1 domain containing 1, transcript variant 2, mRNA. |
| 7210497 | 1.513 | up | NUAK1 | 9891 | NUAK family, SNF1-like kinase, 1, mRNA. |
| 1240440 | 1.511 | up | TXNIP | 10628 | thioredoxin interacting protein, mRNA. |
| 4760747 | 1.509 | up | TPST1 | 8460 | tyrosylprotein sulfotransferase 1, mRNA. |
| 2360220 | 1.508 | up | MATR3 | 9782 | matrin 3, transcript variant 1, mRNA. |
| 3800431 | 1.508 | up | RCOR3 | 55758 | REST corepressor 3, mRNA. |
| 4390450 | 1.504 | up | SGK | 6446 | serum/glucocorticoid regulated kinase, mRNA. |
| 2450465 | 1.503 | up | CYBRD1 | 79901 | cytochrome b reductase 1, mRNA. |
| 6110053 | 1.501 | up | ZNF32 | 7580 | zinc finger protein 32, transcript variant 2, mRNA. |
| 4570398 | 1.501 | up | F2R | 2149 | coagulation factor II (thrombin) receptor, mRNA. |
| 3800050 | −1.503 | down | ADCY3 | 109 | adenylate cyclase 3, mRNA. |
| 5900008 | −1.504 | down | KLK11 | 11012 | kallikrein-related peptidase 11, transcript variant 2, mRNA. |
| 5080605 | −1.504 | down | SNRPA1 | 6627 | small nuclear ribonucleoprotein polypeptide A′, mRNA. |
| 4560541 | −1.521 | down | MLKL | 197259 | mixed lineage kinase domain-like, mRNA. |
| 520682 | −1.523 | down | CPA4 | 51200 | carboxypeptidase A4, mRNA. |
| 4010296 | −1.527 | down | RNASE1 | 6035 | ribonuclease, RNase A family, 1 (pancreatic), transcript variant 1, mRNA. |
| 6350161 | −1.530 | down | LCP1 | 3936 | lymphocyte cytosolic protein 1 (l-plastin), mRNA. |
| 4730605 | −1.532 | down | AURKA | 6790 | aurora kinase A, transcript variant 5, mRNA. |
| 6840075 | −1.532 | down | NP | 4860 | nucleoside phosphorylase, mRNA. |
| 6770187 | −1.533 | down | SPRR2A | 6700 | small proline-rich protein 2A, mRNA. |
| 870131 | −1.533 | down | HSPA5 | 3309 | heat shock 70 kDa protein 5 (glucose-regulated protein, 78 kDa), mRNA. |
| 1570193 | −1.535 | down | ARHGDIB | 397 | Rho GDP dissociation inhibitor (GDI) beta, mRNA. |
| 2450167 | −1.537 | down | RPL29 | 6159 | ribosomal protein L29, mRNA. |
| 7510709 | −1.540 | down | CEP55 | 55165 | centrosomal protein 55 kDa, mRNA. |
| 2350465 | −1.544 | down | RPL29 | 6159 | ribosomal protein L29, mRNA. |
| 160097 | −1.546 | down | MELK | 9833 | maternal embryonic leucine zipper kinase, mRNA. |
| 3930703 | −1.547 | down | WDR4 | 10785 | WD repeat domain 4, transcript variant 2, mRNA. |
| 1170066 | −1.554 | down | SULT2B1 | 6820 | sulfotransferase family, cytosolic, 2B, member 1, transcript variant 1, mRNA. |
| 2070520 | −1.556 | down | CDCA7 | 83879 | cell division cycle associated 7, transcript variant 1, mRNA. |
| 6550048 | −1.559 | down | DHCR7 | 1717 | 7-dehydrocholesterol reductase, mRNA. |
| 5310634 | −1.566 | down | FASN | 2194 | fatty acid synthase, mRNA. |
| 6560494 | −1.566 | down | ARTN | 9048 | artemin, transcript variant 2, mRNA. |
| 5860348 | −1.568 | down | SC4MOL | 6307 | sterol-C4-methyl oxidase-like, transcript variant 2, mRNA. |
| 5270112 | −1.570 | down | HMGCS1 | 3157 | 3-hydroxy-3-methylglutaryl-Coenzyme A synthase 1 (soluble), transcript variant 2, mRNA. |
| 5690274 | −1.571 | down | MCM6 | 4175 | minichromosome maintenance complex component 6, mRNA. |
| 940487 | −1.573 | down | FUT3 | 2525 | fucosyltransferase 3 (galactoside 3(4)-l-fucosyltransferase, Lewis blood group), transcript variant 4, mRNA. |
| 5810154 | −1.580 | down | ALOX15B | 247 | arachidonate 15-lipoxygenase, type B, transcript variant b, mRNA. |
| 870546 | −1.581 | down | MAD2L1 | 4085 | MAD2 mitotic arrest deficient-like 1 (yeast), mRNA. |
| 6020139 | −1.588 | down | KLK7 | 5650 | kallikrein-related peptidase 7, transcript variant 1, mRNA. |
| 4250156 | −1.589 | down | EBP | 10682 | emopamil binding protein (sterol isomerase), mRNA. |
| 10341 | −1.599 | down | SHMT2 | 6472 | serine hydroxymethyltransferase 2 (mitochondrial), nuclear gene encoding mitochondrial protein, mRNA. |
| 5360678 | −1.602 | down | DHCR7 | 1717 | 7-dehydrocholesterol reductase, transcript variant 1, mRNA. |
| 6580059 | −1.610 | down | UCP2 | 7351 | uncoupling protein 2 (mitochondrial, proton carrier), nuclear gene encoding mitochondrial protein, mRNA. |
| 5090278 | −1.610 | down | GPX2 | 2877 | glutathione peroxidase 2 (gastrointestinal), mRNA. |
| 3940673 | −1.617 | down | LOC728285 | 728285 | similar to keratin associated protein 2-4 (LOC728285), mRNA. |
| 2650564 | −1.623 | down | RARRES3 | 5920 | retinoic acid receptor responder (tazarotene induced) 3, mRNA. |
| 360367 | −1.625 | down | PCDH7 | 5099 | protocadherin 7, transcript variant a, mRNA. |
| 7560364 | −1.635 | down | LOC729779 | 729779 | misc_RNA (LOC729779), miscRNA. |
| 780528 | −1.635 | down | CKS2 | 1164 | CDC28 protein kinase regulatory subunit 2, mRNA. |
| 5960224 | −1.636 | down | PTTG3P | 26255 | pituitary tumor-transforming 3 (pseudogene), non-coding RNA. |
| 4730196 | −1.653 | down | TK1 | 7083 | thymidine kinase 1, soluble, mRNA. |
| 1510296 | −1.656 | down | ASNS | 440 | asparagine synthetase, transcript variant 1, mRNA. |
| 1190142 | −1.657 | down | EMILIN2 | 84034 | elastin microfibril interfacer 2, mRNA. |
| 1170170 | −1.662 | down | STC2 | 8614 | stanniocalcin 2, mRNA. |
| 2140128 | −1.670 | down | SCD | 6319 | stearoyl-CoA desaturase (delta-9-desaturase), mRNA. |
| 5360070 | −1.674 | down | CCNB2 | 9133 | cyclin B2, mRNA. |
| 3990619 | −1.675 | down | TOP2A | 7153 | topoisomerase (DNA) II alpha 170 kDa, mRNA. |
| 3780047 | −1.679 | down | GBP6 | 163351 | guanylate binding protein family, member 6, mRNA. |
| 2000148 | −1.683 | down | IFIT1 | 3434 | interferon-induced protein with tetratricopeptide repeats 1, transcript variant 2, mRNA. |
| 2070494 | −1.700 | down | PRC1 | 9055 | protein regulator of cytokinesis 1, transcript variant 2, mRNA. |
| 10414 | −1.704 | down | PTTG1 | 9232 | pituitary tumor-transforming 1, mRNA. |
| 2940110 | −1.720 | down | UHRF1 | 29128 | ubiquitin-like with PHD and ring finger domains 1, transcript variant 1, mRNA. |
| 1510291 | −1.733 | down | PTTG1 | 9232 | pituitary tumor-transforming 1, mRNA. |
| 1780446 | −1.739 | down | PCK2 | 5106 | phosphoenolpyruvate carboxykinase 2 (mitochondrial), nuclear gene encoding mitochondrial protein, transcript variant 1, mRNA. |
| 1660521 | −1.745 | down | SPRR2D | 6703 | small proline-rich protein 2D, mRNA. |
| 730689 | −1.763 | down | LOC652595 | 652595 | similar to U2 small nuclear ribonucleoprotein A (U2 snRNP-A) (LOC652595), mRNA. |
| 5090754 | −1.766 | down | KIAA0101 | 9768 | KIAA0101, transcript variant 1, mRNA. |
| 5080139 | −1.789 | down | PRSS3 | 5646 | protease, serine, 3 (mesotrypsin), mRNA. |
| 3800452 | −1.805 | down | EMP3 | 2014 | epithelial membrane protein 3, mRNA. |
| 1230047 | −1.810 | down | CBS | 875 | cystathionine-beta-synthase, mRNA. |
| 6370615 | −1.858 | down | TGM1 | 7051 | transglutaminase 1 (K polypeptide epidermal type I, protein-glutamine-gamma-glutamyltransferase), mRNA. |
| 5310471 | −1.894 | down | UBE2C | 11065 | ubiquitin-conjugating enzyme E2C, transcript variant 6, mRNA. |
| 7380719 | −1.897 | down | IGFBP6 | 3489 | insulin-like growth factor binding protein 6, mRNA. |
| 940327 | −1.907 | down | KLK13 | 26085 | kallikrein-related peptidase 13, mRNA. |
| 520195 | −1.914 | down | TMEM79 | 84283 | transmembrane protein 79, mRNA. |
| 4040398 | −1.954 | down | MAL | 4118 | mal, T-cell differentiation protein, transcript variant d, mRNA. |
| 1990630 | −1.979 | down | TRIB3 | 57761 | tribbles homolog 3 (Drosophila), mRNA. |
| 430446 | −1.996 | down | KRT81 | 3887 | keratin 81, mRNA. |
| 4260368 | −2.022 | down | UBE2C | 11065 | ubiquitin-conjugating enzyme E2C, transcript variant 3, mRNA. |
| 290767 | −2.038 | down | KRTDAP | 388533 | keratinocyte differentiation-associated protein, mRNA. |
| 6520139 | −2.046 | down | FGFR3 | 2261 | fibroblast growth factor receptor 3 (achondroplasia, thanatophoric dwarfism), transcript variant 2, mRNA. |
| 620102 | −2.046 | down | MALL | 7851 | mal, T-cell differentiation protein-like, mRNA. |
| 5870653 | −2.050 | down | LOC651397 | 651397 | misc_RNA (LOC651397), miscRNA. |
| 4050398 | −2.071 | down | KLK12 | 43849 | kallikrein-related peptidase 12, transcript variant 1, mRNA. |
| 7330753 | −2.102 | down | ACAT2 | 39 | acetyl-Coenzyme A acetyltransferase 2, mRNA. |
| 4900458 | −2.147 | down | KRT14 | 3861 | keratin 14 (epidermolysis bullosa simplex, Dowling-Meara, Koebner), mRNA. |
| 540546 | −2.283 | down | KRT4 | 3851 | keratin 4, mRNA. |
| 1500010 | −2.322 | down | CDC20 | 991 | cell division cycle 20 homolog (S. cerevisiae), mRNA. |
| 6550356 | −2.430 | down | SPRR2C | 6702 | small proline-rich protein 2C (pseudogene), non-coding RNA. |
| 4850674 | −2.452 | down | PSAT1 | 29968 | phosphoserine aminotransferase 1, transcript variant 2, mRNA. |
| 5890400 | −2.577 | down | SPRR2E | 6704 | small proline-rich protein 2E, mRNA. |
| 240086 | −2.608 | down | PHGDH | 26227 | phosphoglycerate dehydrogenase, mRNA. |
| 7650441 | −2.696 | down | FGFBP1 | 9982 | fibroblast growth factor binding protein 1, mRNA. |
| 5810546 | −2.894 | down | SPRR2E | 6704 | small proline-rich protein 2E, mRNA. |
| 7330184 | −2.933 | down | SPRR1A | 6698 | small proline-rich protein 1A, mRNA. |
| 2230035 | −2.936 | down | KRT13 | 3860 | keratin 13, transcript variant 2, mRNA. |
| 4610131 | −3.284 | down | SPRR3 | 6707 | small proline-rich protein 3, transcript variant 1, mRNA. |
| Pathways | Adj. p Value | Associated Genes |
|---|---|---|
| Epidermis development | 1.24 × 10⁻⁶ | ALOX15B, CTGF, FOXQ1, FZD6, KLK7, KRT14, RNASE1, SPRR1A, SPRR2A, SPRR2D, SPRR2E, SPRR3, TGM1, TMEM79, TXNIP |
| Keratinization | 5.22 × 10⁻⁶ | SPRR1A, SPRR2A, SPRR2D, SPRR2E, SPRR3, TGM1, TMEM79 |
| Negative regulation of cell division | 2.58 × 10⁻⁵ | CDC20, FGFR3, MAD2L1, PTTG1, PTTG3P, RGCC, TXNIP, UBE2C |
| Negative regulation of mitotic nuclear division | 2.81 × 10⁻⁵ | CDC20, FGFR3, MAD2L1, PTTG1, PTTG3P, RGCC, UBE2C |
| Keratinocyte differentiation | 3.05 × 10⁻⁵ | ALOX15B, SPRR1A, SPRR2A, SPRR2D, SPRR2E, SPRR3, TGM1, TMEM79, TXNIP |
| L-serine metabolic process | 3.54 × 10⁻⁵ | CBS, PHGDH, PSAT1, SHMT2 |
| Epidermal cell differentiation | 9.21 × 10⁻⁵ | ALOX15B, RNASE1, SPRR1A, SPRR2A, SPRR2D, SPRR2E, SPRR3, TGM1, TMEM79, TXNIP |
| L-serine biosynthetic process | 9.75 × 10⁻⁵ | PHGDH, PSAT1, SHMT2 |
| Negative regulation of nuclear division | 1.10 × 10⁻⁴ | CDC20, FGFR3, MAD2L1, PTTG1, PTTG3P, RGCC, UBE2C |
| Skin development | 1.82 × 10⁻⁴ | ALOX15B, FOXQ1, FZD6, SPRR1A, SPRR2A, SPRR2D, SPRR2E, SPRR3, TGM1, TMEM79, TXNIP |
| Peptide cross-linking | 2.05 × 10⁻⁴ | SPRR1A, SPRR2A, SPRR2D, SPRR2E, SPRR3, TGM1 |
| Serine family amino acid biosynthetic process | 3.55 × 10⁻⁴ | CBS, PHGDH, PSAT1, SHMT2 |
| Regulation of collagen metabolic process | 5.84 × 10⁻⁴ | CTGF, F2R, FAP, IL6, RGCC |
| Regulation of multicellular organismal metabolic process | 6.51 × 10⁻⁴ | CTGF, F2R, FAP, IL6, RGCC |
| Steroid biosynthesis | 6.77 × 10⁻⁴ | CYP24A1, DHCR7, EBP, MSMO1 |
| Chromosome separation | 0.00192 | CDC20, MAD2L1, PTTG1, PTTG3P, TOP2A, UBE2C |
| Negative regulation of mitotic sister chromatid separation | 0.00199 | CDC20, MAD2L1, PTTG1, PTTG3P, UBE2C |
| Collagen metabolic process | 0.00200 | COL12A1, CTGF, F2R, FAP, IL6, MMP12, RGCC |
| Negative regulation of mitotic sister chromatid segregation | 0.00231 | CDC20, MAD2L1, PTTG1, PTTG3P, UBE2C |
| Multicellular organismal macromolecule metabolic process | 0.00248 | COL12A1, CTGF, F2R, FAP, IL6, MMP12, RGCC |
| Negative regulation of sister chromatid segregation | 0.00267 | CDC20, MAD2L1, PTTG1, PTTG3P, UBE2C |
| Negative regulation of chromosome segregation | 0.00267 | CDC20, MAD2L1, PTTG1, PTTG3P, UBE2C |
| Regulation of nuclear division | 0.00302 | AURKA, CDC20, FGFR3, MAD2L1, PTTG1, PTTG3P, RGCC, UBE2C |
| Multicellular organismal metabolic process | 0.00456 | COL12A1, CTGF, F2R, FAP, IL6, MMP12, RGCC |
| Regulation of collagen biosynthetic process | 0.00457 | CTGF, F2R, IL6, RGCC |
| Mitotic sister chromatid separation | 0.00664 | CDC20, MAD2L1, PTTG1, PTTG3P, UBE2C |
| Regulation of mitotic sister chromatid segregation | 0.00834 | CDC20, MAD2L1, PTTG1, PTTG3P, UBE2C |
| Sister chromatid segregation | 0.00851 | CDC20, CEP55, MAD2L1, PTTG1, PTTG3P, TOP2A, UBE2C |
| Glycine, serine and threonine metabolism | 0.00873 | CBS, PHGDH, PSAT1, SHMT2 |
| Collagen biosynthetic process | 0.00873 | CTGF, F2R, IL6, RGCC |
| Oocyte meiosis | 0.01153 | ADCY3, AURKA, CCNB2, CDC20, MAD2L1, PTTG1 |
| Regulation of sister chromatid segregation | 0.01277 | CDC20, MAD2L1, PTTG1, PTTG3P, UBE2C |
| Negative regulation of chromosome organization | 0.01396 | ARTN, CDC20, MAD2L1, PTTG1, PTTG3P, UBE2C |
| PERK-mediated unfolded protein response | 0.01404 | ASNS, ATF3, HSPA5 |
| Regulation of stress fiber assembly | 0.01630 | CTGF, RGCC, RNASE1 |
| FoxO signaling pathway | 0.01634 | CCNB2, GABARAPL1, IL6, IRS2, PCK2, SGK1 |
| Anaphase-promoting complex-dependent proteasomal ubiquitin-dependent protein catabolic process | 0.01664 | AURKA, CDC20, MAD2L1, PTTG1, UBE2C |
| Alpha-amino acid biosynthetic process | 0.01664 | ASNS, CBS, PHGDH, PSAT1, SHMT2 |
| Positive regulation of collagen biosynthetic process | 0.02234 | CTGF, F2R, RGCC |
| Regulation of systemic arterial blood pressure by circulatory renin-angiotensin | 0.02412 | CPA4, F2R, MMP12 |
| Positive regulation of multicellular organismal metabolic process | 0.02412 | CTGF, F2R, RGCC |
| Secondary alcohol biosynthetic process | 0.02578 | DHCR7, EBP, HMGCS1, MSMO1 |
| Regulation of chromosome segregation | 0.02590 | CDC20, MAD2L1, PTTG1, PTTG3P, UBE2C |
| Negative regulation of proteasomal ubiquitin-dependent protein catabolic process | 0.03145 | CDC20, MAD2L1, UBE2C |
| Probe ID | Fold Change | Regulation | Symbol | Entrez Gene ID | Definition |
|---|---|---|---|---|---|
| 2230035 | 7.508 | up | KRT13 | 3860 | keratin 13, transcript variant 2, mRNA. |
| 6510754 | 3.841 | up | ALDH1A1 | 216 | aldehyde dehydrogenase 1 family, member A1, mRNA. |
| 1070477 | 3.395 | up | ALDH1A1 | 216 | aldehyde dehydrogenase 1 family, member A1, mRNA. |
| 540546 | 2.749 | up | KRT4 | 3851 | keratin 4, mRNA. |
| 1990142 | 2.644 | up | C20orf114 | 92747 | chromosome 20 open reading frame 114, mRNA. |
| 5900368 | 2.385 | up | MSMB | 4477 | microseminoprotein, beta-, transcript variant PSP94, mRNA. |
| 4610131 | 2.358 | up | SPRR3 | 6707 | small proline-rich protein 3, transcript variant 1, mRNA. |
| 3190110 | 2.194 | up | MSMB | 4477 | microseminoprotein, beta-, transcript variant PSP94, mRNA. |
| 630315 | 2.151 | up | DHRS9 | 10170 | dehydrogenase/reductase (SDR family) member 9, transcript variant 1, mRNA. |
| 5420577 | 2.149 | up | CLCA4 | 22802 | chloride channel, calcium activated, family member 4, mRNA. |
| 5560369 | 2.107 | up | ALDH3A1 | 218 | aldehyde dehydrogenase 3 family, memberA1, mRNA. |
| 4150598 | 1.990 | up | MSMB | 4477 | microseminoprotein, beta-, transcript variant PSP57, mRNA. |
| 1820414 | 1.897 | up | ATP12A | 479 | ATPase, H+/K+ transporting, nongastric, alpha polypeptide, mRNA. |
| 3520709 | 1.888 | up | ADH7 | 131 | alcohol dehydrogenase 7 (class IV), mu or sigma polypeptide, mRNA. |
| 7160468 | 1.807 | up | DHRS9 | 10170 | dehydrogenase/reductase (SDR family) member 9, transcript variant 1, mRNA. |
| 5310646 | 1.795 | up | AKR1B10 | 57016 | aldo-keto reductase family 1, member B10 (aldose reductase), mRNA. |
| 4250092 | 1.749 | up | C10orf99 | 387695 | chromosome 10 open reading frame 99, mRNA. |
| 110372 | 1.748 | up | CSTA | 1475 | cystatin A (stefin A), mRNA. |
| 3710671 | 1.712 | up | KRT15 | 3866 | keratin 15, mRNA. |
| 1770603 | 1.705 | up | TCN1 | 6947 | transcobalamin I (vitamin B12 binding protein, R binder family), mRNA. |
| 6100537 | 1.655 | up | FAM3D | 131177 | family with sequence similarity 3, member D, mRNA. |
| 4540400 | 1.623 | up | CYP4B1 | 1580 | cytochrome P450, family 4, subfamily B, polypeptide 1, transcript variant 2, mRNA. |
| 2900050 | 1.611 | up | GSTA1 | 2938 | glutathione S-transferase alpha 1, mRNA. |
| 1510170 | 1.565 | up | NLRP2 | 55655 | NLR family, pyrin domain containing 2, mRNA. |
| 5820400 | 1.526 | up | CYP4B1 | 1580 | cytochrome P450, family 4, subfamily B, polypeptide 1, mRNA. |
| 130561 | 1.525 | up | GSTA4 | 2941 | glutathione S-transferase A4, mRNA. |
| 3850246 | 1.513 | up | HOPX | 84525 | HOP homeobox, transcript variant 3, mRNA. |
| 7200612 | −1.522 | down | LOC730417 | 730417 | hypothetical protein LOC730417, mRNA. |
| 1510296 | −1.556 | down | ASNS | 440 | asparagine synthetase, transcript variant 1, mRNA. |
| 3290390 | −1.563 | down | LOC729841 | 729841 | misc_RNA, miscRNA. |
| 7380193 | −1.574 | down | ARPC3 | 10094 | actin related protein 2/3 complex, subunit 3, 21 kDa, mRNA. |
| 130717 | −1.610 | down | ARPC1B | 10095 | actin related protein 2/3 complex, subunit 1B, 41 kDa, mRNA. |
| 430446 | −1.689 | down | KRT81 | 3887 | keratin 81, mRNA. |
| PATHWAYS | Adj. p Value | Associated Genes Found |
|---|---|---|
| Retinol metabolism | 8.58 × 10⁻⁵ | ADH7, ALDH1A1, DHRS9 |
| Metabolism of xenobiotics by cytochrome P450 | 1.48 × 10⁻⁵ | ADH7, ALDH3A1, GSTA1, GSTA4 |
| Drug metabolism | 1.37 × 10⁻⁵ | ADH7, ALDH3A1, GSTA1, GSTA4 |
| Retinoid metabolic process | 1.41 × 10⁻⁵ | ADH7, AKR1B10, ALDH1A1, DHRS9 |
| Chemical carcinogenesis | 1.96 × 10⁻⁵ | ADH7, ALDH3A1, GSTA1, GSTA4 |
| Cellular aldehyde metabolic process | 2.60 × 10⁻⁵ | ADH7, AKR1B10, ALDH1A1, ALDH3A1 |
| Primary alcohol metabolic process | 3.30 × 10⁻⁶ | ADH7, AKR1B10, ALDH1A1, DHRS9 |
| Retinol metabolic process | 1.99 × 10⁻⁵ | ADH7, ALDH1A1, DHRS9 |
| Systematic Name | Regulation | Fold Change |
|---|---|---|
| hsa-miR-8485 | up | 5.372 |
| hsa-miR-937-5p | up | 1.787 |
| hsa-miR-5194 | up | 1.694 |
| Systematic Name | Regulation | Fold Change |
|---|---|---|
| hsa-miR-8485 | up | 9.183 |
| hsa-miR-4730 | up | 2.900 |
| hsa-miR-5194 | up | 2.732 |
| hsa-miR-6716-3p | up | 2.561 |
| Cell Treatments | miRNA | Fold Change | mRNA Target | Gene Name |
|---|---|---|---|---|
| EVE 5 nM | miR-8485 | 9.183 | CYP4B1 | cytochrome P450, family 4, subfamily B, polypeptide 1 |
| miR-5194 | 2.732 | ARPC3 | actin related protein 2/3 complex, subunit 3, 21 kDa | |
| EVE 100 nM | miR-8485 | 5.372 | CYP24A1 | cytochrome P450, family 24, subfamily A, polypeptide 1 |
| KAL1 | Kallmann syndrome 1 sequence | |||
| UBL3 | ubiquitin-like 3 | |||
| IRS2 | insulin receptor substrate 2 | |||
| CTGF | connective tissue growth factor | |||
| LBH | limb bud and heart development | |||
| FLRT2 | fibronectin leucine rich transmembrane protein 2 | |||
| CDH6 | cadherin 6, type 2, K-cadherin (fetal kidney) | |||
| CYBRD1 | cytochrome b reductase 1 | |||
| LETMD1 | LETM1 domain containing 1 | |||
| FGFR3 | fibroblast growth factor receptor 3 | |||
| CPA4 | carboxypeptidase A4 | |||
| AURKA | aurora kinase A | |||
| CBS | cystathionine-beta-synthase | |||
| MAD2L1 | MAD2 mitotic arrest deficient-like 1 (yeast) | |||
| ADCY3 | adenylate cyclase 3 | |||
| TMEM79 | transmembrane protein 79 | |||
| IFIT1 | interferon-induced protein with tetratricopeptide repeats 1 | |||
| PTTG1 | pituitary tumor-transforming 1 | |||
| PCDH7 | protocadherin 7 | |||
| miR-937-5p | 1.787 | CDH6 | cadherin 6, type 2, K-cadherin (fetal kidney) | |
| KIAA0101 | KIAA0101 | |||
| EMILIN2 | elastin microfibril interfacer 2 | |||
| miR-5194 | 1.694 | KLHL24 | kelch-like family member 24 | |
| FAP | fibroblast activation protein, alpha | |||
| LBH | limb bud and heart development | |||
| PIM1 | pim-1 oncogene | |||
| FLRT2 | fibronectin leucine rich transmembrane protein 2 | |||
| LETMD1 | LETM1 domain containing 1 | |||
| FGFR3 | fibroblast growth factor receptor 3 | |||
| KIAA0101 | KIAA0101 | |||
| RARRES3 | retinoic acid receptor responder (tazarotene induced) 3 | |||
| ARTN | artemin | |||
| IGFBP6 | insulin-like growth factor binding protein 6 | |||
| LCP1 | lymphocyte cytosolic protein 1 (L-plastin) | |||
| MALL | small integral membrane protein 5 | |||
| SCD | LSM14B, SCD6 homolog B (S. cerevisiae) | |||
| IFIT1 | interferon-induced protein with tetratricopeptide repeats 1 |
© 2018 by the authors. Licensee MDPI, Basel, Switzerland. This article is an open access article distributed under the terms and conditions of the Creative Commons Attribution (CC BY) license (http://creativecommons.org/licenses/by/4.0/).
Share and Cite
Granata, S.; Santoro, G.; Masola, V.; Tomei, P.; Sallustio, F.; Pontrelli, P.; Accetturo, M.; Antonucci, N.; Carratù, P.; Lupo, A.; et al. In Vitro Identification of New Transcriptomic and miRNomic Profiles Associated with Pulmonary Fibrosis Induced by High Doses Everolimus: Looking for New Pathogenetic Markers and Therapeutic Targets. Int. J. Mol. Sci. 2018, 19, 1250. https://doi.org/10.3390/ijms19041250
Granata S, Santoro G, Masola V, Tomei P, Sallustio F, Pontrelli P, Accetturo M, Antonucci N, Carratù P, Lupo A, et al. In Vitro Identification of New Transcriptomic and miRNomic Profiles Associated with Pulmonary Fibrosis Induced by High Doses Everolimus: Looking for New Pathogenetic Markers and Therapeutic Targets. International Journal of Molecular Sciences. 2018; 19(4):1250. https://doi.org/10.3390/ijms19041250
Chicago/Turabian StyleGranata, Simona, Gloria Santoro, Valentina Masola, Paola Tomei, Fabio Sallustio, Paola Pontrelli, Matteo Accetturo, Nadia Antonucci, Pierluigi Carratù, Antonio Lupo, and et al. 2018. "In Vitro Identification of New Transcriptomic and miRNomic Profiles Associated with Pulmonary Fibrosis Induced by High Doses Everolimus: Looking for New Pathogenetic Markers and Therapeutic Targets" International Journal of Molecular Sciences 19, no. 4: 1250. https://doi.org/10.3390/ijms19041250