Fluorescent Proteins for Investigating Biological Events in Acidic Environments

1
Department of Biotechnology, Graduate School of Engineering, Osaka University, 2-1 Yamadaoka, Suita 565-0871, Japan
2
The Institute of Scientific and Industrial Research, Osaka University, 8-1 Mihogaoka, Ibaraki 567-0047, Japan
*
Author to whom correspondence should be addressed.
Int. J. Mol. Sci. 2018, 19(6), 1548; https://doi.org/10.3390/ijms19061548
Submission received: 2 May 2018
/
Revised: 18 May 2018
/
Accepted: 19 May 2018
/
Published: 23 May 2018
(This article belongs to the Special Issue Fluorescent Proteins)
Abstract
:The interior lumen of acidic organelles (e.g., endosomes, secretory granules, lysosomes and plant vacuoles) is an important platform for modification, transport and degradation of biomolecules as well as signal transduction, which remains challenging to investigate using conventional fluorescent proteins (FPs). Due to the highly acidic luminal environment (pH ~ 4.5–6.0), most FPs and related sensors are apt to lose their fluorescence. To address the need to image in acidic environments, several research groups have developed acid-tolerant FPs in a wide color range. Furthermore, the engineering of pH insensitive sensors, and their concomitant use with pH sensitive sensors for the purpose of pH-calibration has enabled characterization of the role of luminal ions. In this short review, we summarize the recent development of acid-tolerant FPs and related functional sensors and discuss the future prospects for this field.
Keywords:
fluorescent protein; GFP; acidic organelle; lysosome; secretory granule; endosome; pH; pH-sensitivity; Ca2+; FRET
1. Introduction
For cells to maintain their function, the construction and transportation of useful biomolecules must be balanced with the degradation and recycling of unnecessary ones. Acidic organelles (e.g., endosomes, secretory granules, lysosomes, plant vacuoles, etc.) play an important role in biomolecule degradation. Such organelles maintain luminal pH (pH ~ 4.5–6.0), and contain many unique modification and degradation enzymes that actively work in acidic conditions [1]. In addition to these well characterized functions, their involvement in the cell-wide signaling network has recently been elucidated [2,3]. In particular, Ca2+ release from and uptake into acidic organelles (in concert with other Ca2+-storing organelles, mainly the endoplasmic reticulum) has been shown to control local Ca2+ levels in the cytosol, leading to the regulation of biological events such as autophagy, apoptosis and membrane repair [4]. Intraluminal Cl− acts as a major counterion during the V-ATPase dependent acidification of endocytic and secretory organelles. It has also been reported that the disturbance of Cl− transport into/out of vesicles leads to impaired membrane-trafficking [5]. Additionally, levels of amino acids in lysosomes control activity of the mTOR complex 1 (mTORC1) on the lysosomal membrane, regulating the autophagic pathway to control biosynthesis and the catabolic state [6].
Fluorescent proteins (FPs) are some of the most useful tools to investigate these cellular functions [7]. They enable us to observe the spatial dynamics of biomolecules and have been adapted to sense ions (for example Ca2+, Mg2+, Zn2+, K+, Cl−) in living cells, all of which are highly important for signal transduction. FPs and FP-based sensors can easily be localized to acidic organelles by fusing them to signal peptides or organelle-specific proteins. However, the application of FPs to study the lumen of acidic organelles has been limited because: (1) many FPs that are practical for neutral pH imaging tend to lose fluorescence in acidic conditions due to their neutral pKa of ~6.0 [8]; and (2) functional domains used in most FP-based sensors change their affinity to target molecules depending on pH, complicating data analysis in acidic organelles in which pH is variable and sometimes dynamic. To overcome these limitations, acid-tolerant FPs have been developed, and FP-based sensors have been used in combination with pH sensors to compensate for effects triggered by pH change. In this short review we introduce the recent development of acid-tolerant FPs and compare mechanisms of pH sensitivity in conventional FPs with acid-tolerant ones. We show examples of the application of FP-based sensors in acidic organelles and discuss the future prospects for this field.
2. GFP-Like Protein
2.1. Green-Yellow-Red Fluorescent Protein
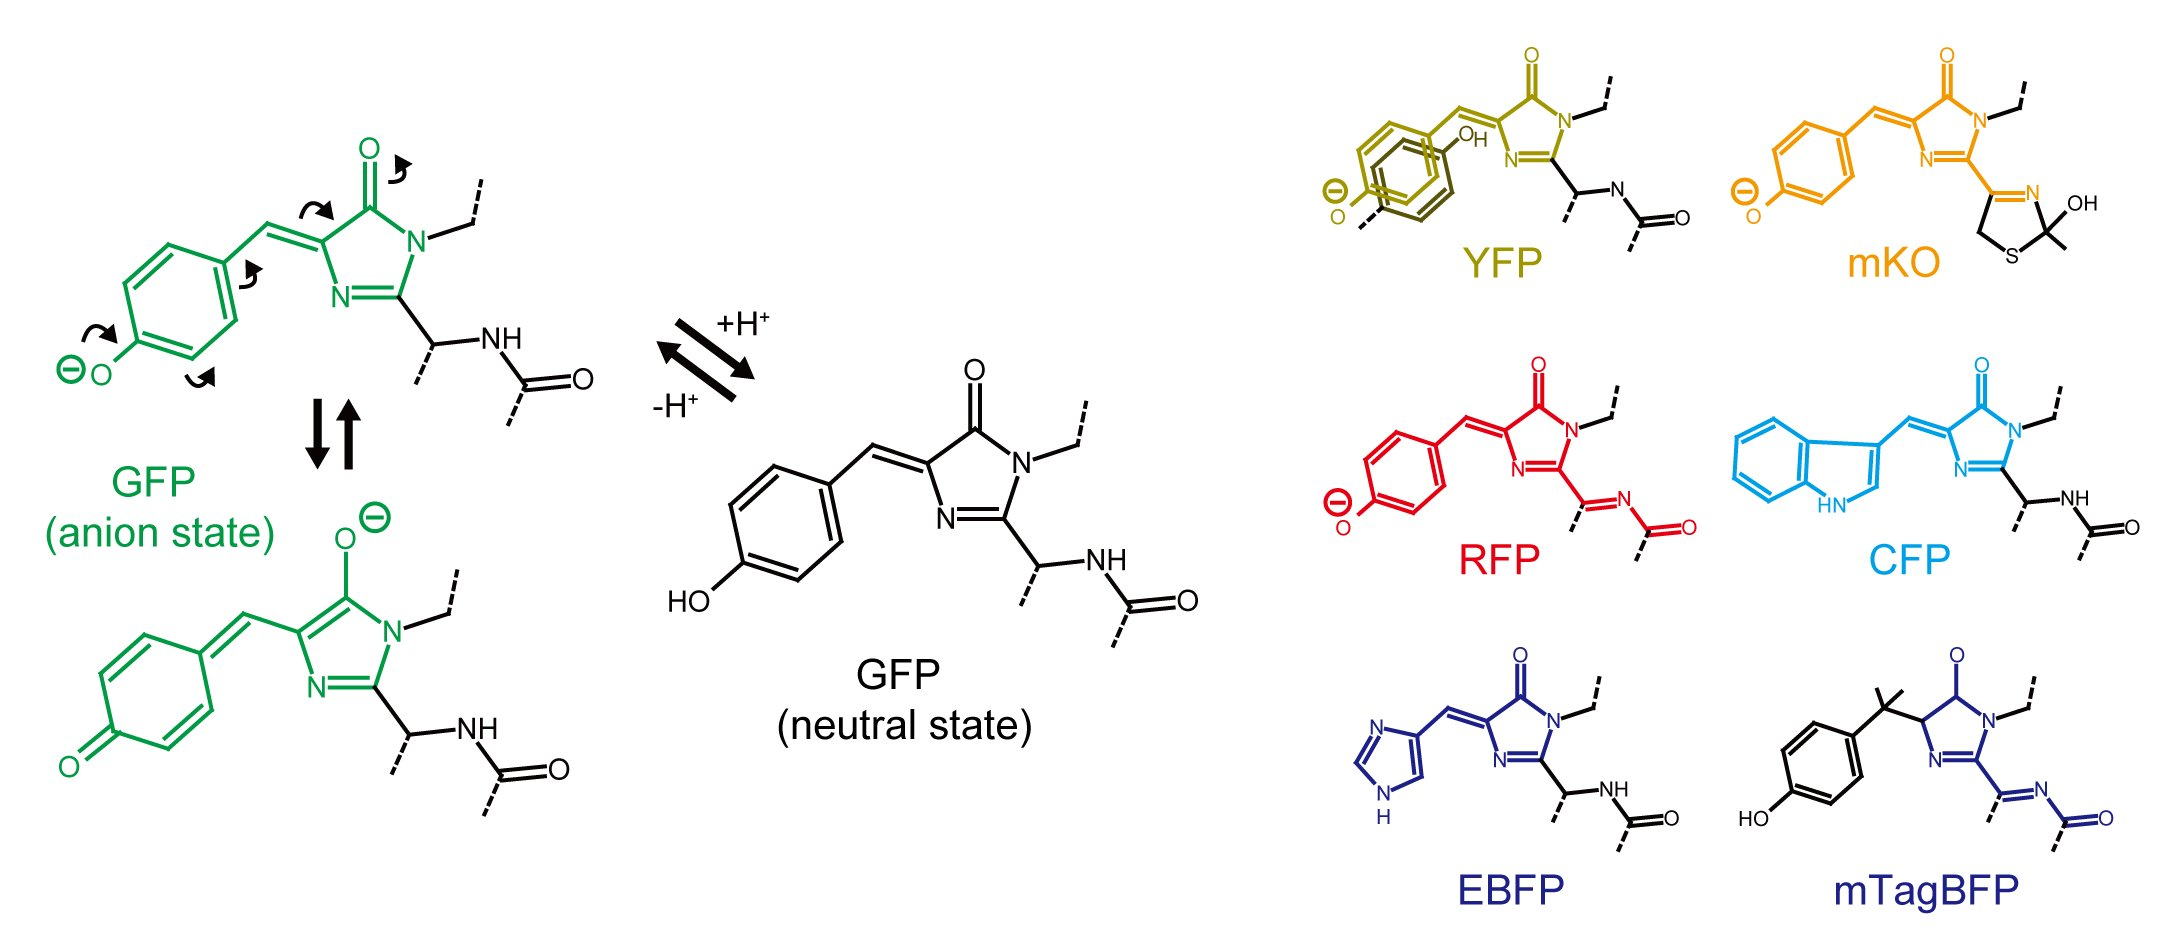
Green and yellow FPs are widely used by researchers because of their brightness, fast and simple chromophore maturation mechanism, and excellent photostability. GFPs form a p-hydroxybenzylideneimidazolinone chromophore, containing a hydroxyphenyl ring originating from a side chain of Tyr. YFP is a slightly red-shifted variant of GFP, a shift that is caused by a π-π stacking interaction between the chromophore and a neighboring hydroxyphenyl ring from a Tyr side chain [7]. At neutral pH, a phenolate oxide of the GFP or YFP chromophore is deprotonated by hydrogen bonding with a neighboring amino acid (usually an OH group of a side chain of Ser or Thr) and a water molecule. In this situation an electron can be reversibly relayed between the phenolate oxide ion and imidazole ring to form an imidazole oxide ion. This results in the extension of a π conjugation system and resultant light energy absorption with a peak at around 480–500 nm. Additionally, the hydrogen bonds at the phenolate oxide stabilize the chromophore by limiting the movement caused by thermal fluctuation, enabling effective energy conversion of the chromophore as it relaxes from the excited state and emits fluorescence. On the other hand, in acidic pH the phenolate oxide is protonated, which causes contraction of the π conjugation system and a shift in absorption to the UV spectral region (a peak at around 360–380 nm) (Figure 1A). Absence of a hydrogen bond at the phenolate oxide increases thermal fluctuation of the chromophore, so that excited state energy in the chromophore is likely to be consumed by thermal relaxation, leading to a decrease in the fluorescence quantum yield. Because of this acid-quenching mechanism, most widely-used GFPs and YFPs are pH sensitive (pKa for EGFP: 6.0, mEmerald: 6.0, sfGFP: 5.5, mNeonGreen: 5.7, mClover: 5.9, mCitrine: 5.7, mVenus: 6.0 [8], Table 1).
Several wild-type GFPs less sensitive to pH such as CpYGFP (pKa = 4.4) [9], bfloGFPa1 (pKa = 4.0) [10] and zFP506 (pKa < 4.0) [11] were originally reported, however their application to imaging has been limited. This is because they form homo-dimeric or -tetrameric structures under physiological conditions and/or form aggregates in cells, which can cause dysfunction or mislocalization of the fused proteins. Recently, a monomeric and bright acid-tolerant GFP: Gamillus, has been developed from flower hat jellyfish (Olindias formosa) [12]. Gamillus emits fluorescence with the same brightness and photo-physics over a wide pH range of 4.5 to 9.0, covering almost all physiological pH values observed inside cells (pKa = 3.4). Mechanistically, it has been suggested that the unique trans configuration of the chromophore phenyl ring is important for acid-tolerance. Gamillus exhibits a photochromic decrease in fluorescence to 60% or 10% of its initial intensity when excited by 457–487 nm or 488–512 nm, which is rapidly recovered by subsequent excitation with 352–388 nm light. On the other hand, it shows a negligible photochromic decrease when excited by 440–480 nm light. Therefore, with care and caution to avoid undesired photochromic effects, Gamillus will help researchers to perform multicolor imaging or FRET analysis to investigate biological events inside acidic cellular environments.
Red FPs derived from GFP-like proteins form chromophores containing the same hydroxyphenyl ring as in GFP but with further extension of the π-π conjugation system to form an acylimine structure (Figure 1B). Therefore, as pH decreases, red FPs tend to decrease fluorescence by the same mechanism as GFP and YFP. Compared with GFP and YFP based proteins however, many more monomeric acid-tolerant RFPs have been reported (to the best of our knowledge, as to why RFP tends to have higher acid-tolerance than GFP has not been well studied). Among the reported RFPs, DsRed-derivatives such as mRFP1 (pKa ≤ 4.5) [13], mCherry (<4.5) [14], mCherry2 (3.3) [15], mStrawberry (<4.5) [14], mScarlet (5.3) [16], mPlum (<4.5) [17] and mRaspberry (<4.5) [17], eqFP611-derivatives such as mRuby (4.4) [18], mRuby2 (5.3) [19] and mRuby3 (4.8) [20], and eqFP578-derivatives such as tagRFP (3.1) [21], TagRFP657 (3.4) [22], FusionRed (4.6) [23] are widely-used and highly pH-stable. DsRed- and eqFP611-derived FPs are likely resistant to proteolytic degradation in lysosomes, whereas eqFP578-derived FPs are not (the detail will be discussed in the following section). Therefore, in order to observe lysosome-related events, careful choice of FPs is necessary. For the application to acidic-organelles aside from lysosomes, FusionRed may be well-suited because of its superior monomeric property and less toxicity in comparison with other RFPs including mCherry and mRuby [23].
Large-Stokes-shift FPs (LSS-FP) such as mT-Sapphire (green) [24] and LSSmKate (red) [25] adopt a neutral Tyr side chain in their chromophore at steady state. When the neutral chromophore is excited, it converts to the excited intermediate anion form via proton transfer to a neighboring side chain of Asp/Glu (an example of so-called excited-state proton transfer (ESPT)) (Figure 1C). Red-shifted fluorescence is then emitted when excited electron (S1) transit to the ground state (S0). In the case of LSSmKate, pH sensitivity depends on the ionic state of Asp/Glu160 which act as a proton acceptor for the chromophore hydroxyphenol moiety via ESPT [26]. At pH levels below 3.5, the carboxylate group of Glu/Asp160 is protonated so that ESPT does not occur. Probably because pKa of Glu/Asp side chains is low, LSSmKate1 and LSSmKate2 exhibit high acid-tolerance with pKa of 3.2 and 2.7, respectively.
2.2. Blue-Cyan Fluorescent Protein
Color variants that emit shorter wavelengths of light such as ECFP (cyan), EBFP (blue) and Sirius (ultramarine) were artificially constructed from A. victoria-derived GFP by substitution of the Tyr residue constituting the chromophore with a Trp, His or Phe residue, respectively [7]. The side chains of Trp, His and Phe in these chromophores are neutral or cationic state, in the β-barrel, at steady state, and environmental pH decrease causes a slight shrinkage of the π-π conjugation system as in the case of the GFP chromophore. Their fluorescence loss by pH decrease is mostly accompanied not with an absorption spectral shift but with a decrease in the fluorescence quantum yield. In this color range, several acid-tolerant FPs have been reported as follows. Sirius, a FP with Phe-derived chromophore emitting the shortest wavelength of excitation/emission peaks (355/424 nm), shows the highest acid-tolerance of all FPs, where its fluorescence intensity is essentially constant between pH 9.0 and 3.0 (pKa < 3.0, Table 1) [27]. However, the molecular brightness is low (ε: 15,000 M−1·cm−1; QY: 0.24), and UV illumination to excite Sirius is likely to cause cytotoxicity. The best options so far are mTurquoise2 [30] and mCerulean3 [31], improved versions of ECFP with pH-insensitive indole rings. Their low pKa values (3.1 and 3.2, respectively) and high molecular brightness (ε: 30,000 M−1·cm−1; QY: 0.93 for mTurquoise2; ε: 40,000 M−1·cm−1, QY: 0.80 for mCerulean3) make them amenable for use in acidic environments. Because of their high quantum yields, these FPs can serve as effective FRET donors for GFP and YFP. pH-tolerant Cyan-Green FP, ECGFP was also engineered from ECFP by substituting Thr underneath the chromophore with Tyr (T203Y) [33]. This substitution introduced π-π interaction between the chromophore’s indole ring and the Tyr’s phenolate ring, resulting in the shift of excitation/emission peaks from 434/476 nm to 463/506 nm. Another type of Blue FP, mTagBFP (and mTagBFP2) was developed by introducing mutations, which (1) prevent chromophore maturation from blue to red and (2) stabilize the blue protonated intermediate [28]. mTagBFP contains N-acylimine, the same chromophore as in TagRFP, but lacks a Cα-Cβ double bond in the Tyr side chain. mTagBFP2 shows the highest molecular brightness (ε: 50,600 M−1·cm−1; QY: 0.64) and acid tolerance (pKa = 2.7) of all blue FPs.
2.3. Character and Stability of β-Barrel Structure
Chromophores from GFP-like proteins appear at first glance almost completely shielded by the rigid β-barrel structure. However, most GFP-like proteins have an unstructured loop region in the middle of the 7th β-strand, which makes a cleft-like structure between the 7th and 10th β-strand [42]. Some FPs such as Dronpa and TurboGFP have a water-filled opening there, and this connects the chromophore with bulk solvent. This opening may well be important for facilitating oxygen conveyance from the bulk solution to the premature chromophore, which may speed up the process of maturation [43]. Meanwhile, the opening possibly relays environmental pH changes to the chromophore, enhancing its pH sensitivity. Although the apparent opening has rarely been observed in the structure of other FPs, this opening at the same position may occur for other GFPs too. A molecular dynamics study has identified that fluctuation of the 6th–7th strand can generate an opening with enough size for water molecules passing through [44]. Also, X-ray crystallographic study of KillerRed revealed a water-filled channel at a different position reaching from an end cap of the β-barrel to the chromophore [45]. Therefore these are likely the reason why chromophores protected by rigid β-barrel structures are sensitive to pH. Resistance of the β-barrel structure itself to acidic quenching is also an important point. For example, at pH below 5.0, fluorescence intensity of EGFP and DsRed gradually decreases, and does not fully recover to the initial intensity after readjusting the pH to neutral. CD spectral measurement of DsRed revealed that the secondary structure breaks down in pH 4.1 buffer [46].
2.4. Resistance to Degradative Enzymes in Lysosomes
It has been observed that several days after transfection, some types of non-fused GFP-like proteins exhibit fluorescent puncta in cells, the localization pattern of which resembles that of lysosomes [29]. FPs in the cytosol are likely to be delivered to lysosomes by autophagy-related activity, then those resistant to both acidic quenching and degradation enzymes keep emitting fluorescence there. Incubation of several jellyfish-derived FPs (EGFP, ECFP and Sapphire) in pH 5.0 buffer containing lysosomal contents resulted in their loss of detection (relevant bands) by SDS-PAGE, while the same experiment with coral-derived FPs (such as DsRed, mRFP1 and zFP506) showed detection by SDS-PAGE at the expected size-positions. The control experiment using pH 5.0 buffer without lysosomal contents for both of the jellyfish- and coral-derived FPs also resulted in the appearance of the bands [29], together suggesting that only coral-derived FPs are resistant to acidic lysosomal degradation. For observation of events in the cytosol with FPs, this property is sometimes a problem because the fluorescent puncta may perturb analysis of imaging data and have a negative effect on long-term cell viability [39]. Meanwhile, FP resistance to degradation in lysosomes is essential for their application to lysosome-related imaging. For this purpose, mCherry and Gamillus are preferable because of their high resistance in lysosomes and their monomeric properties.
In addition, it has to be kept in mind that possible peptide cleavage may occur between the FP and the fused protein. It was reported that mCherry fused with the C-terminus of lysosomal proteins such as Niemann-Pick disease type C protein 2 (NPC2) and lysosomal protease tripeptidyl peptidase I (TPP1) showed separation of the two proteins due to lysosomal degradation enzymes [47]. This cleavage was suppressed by deletion of a flexible 11 amino acid region from the N-terminus of mCherry and the use of a rigid linker composed of 5 or 10 prolines. Therefore, to study trafficking of protein-complexes in lysosomes, which then travel from lysosomes to other organelles or plasma membrane, such linker optimization to prevent FP-fusion protein cleavage has to be considered.
3. FP-Based Sensor for Acidic Organelle Imaging
3.1. FP-Based Sensor and Chemical Dye-Based Sensor
To investigate the role of ions inside acidic organelles (e.g., Ca2+, Zn2+ and Cl−) and acidic organelle-related cellular events (e.g., autophagy, exocytosis and endocytosis), several organic dye-based and FP-based sensors have been developed (Table 2). Comparing the two types of sensor, organic dye-based sensors have advantages that include higher brightness, less photobleaching, easy sample preparation and superior resistance to acidic environments and degradative enzymes. The last characteristic is especially important for imaging applications in lysosomes. Accordingly, many organic dye-based sensors have been developed to obtain information about lysosomal ion concentration. Some organic dyes however are cytotoxic, (e.g., widely-used Ca2+ sensors such as Fluo-4 acetoxymethyl (AM), Rhod-2 AM and Fura-2-AM can suppress activity of Na+- and K+-dependent adenosine triphosphatase (Na,K-ATPase) [48]) so careful interpretation of data obtained with these dyes is necessary. In contrast, FP-based sensors have the advantage that they can be expressed in specific cell-types using a cell-selective promoter and can be easily localized to cellular compartments of interest by fusing them with organelle-specific targeting motifs or proteins. FP-based sensors, therefore, have been preferred for in vivo imaging [49], and imaging in specific organelles such as secretory granules, endosomes and Golgi body which are difficult for chemical dye-based sensors to correctly target (see Table 2). Their application in lysosomes is currently very limited due to the generally high pH sensitivity of FP fluorescence and their weak resistance to acidic quenching and proteolytic degradation.
In the following section, we introduce several examples of the development and application of FP-based functional sensors in acidic organelles (Figure 2 and Table 2). Before moving to that topic, we explain how pH-dependent properties of FP-based sensors can introduce difficulties when investigating acidic organelles. We emphasize the importance of simultaneous measurement of pH values during imaging for calibration of the sensor. To the best of our knowledge, all ionic sensors are somewhat sensitive to pH changes (organic dyes are no exception). Additionally, placing the inherent pH sensitivity of FPs aside for a moment, the ionic state of functional binding domains in FP-based sensors, which are positively or negatively charged to trap their specific counter ions (e.g., Ca2+, Zn2+, Cl−), can be affected by pH changes. Generally, pH decreases results in decreased affinity for cation sensors and increased affinity for anion sensors. In addition, environmental pH alters electric charge on the protein surface (London forces [50] as well as ionic forces), which can change the ionic interaction between two FPs (in the case of FRET-based sensors) or that between the FP and the functional domain. pH values in acidic organelles are very dynamic in many cases, as listed here: (1) the maturation process from early endosomes to late endosomes (a pH drop from 6.3 to 5.5 [51]; (2) the starvation induced-pH drop in lysosomes which results in increased activity of lysosomal degradation enzymes to facilitate turnover of biomolecules [52]; (3) the fusion of several membrane vesicles (e.g., during formation of autolysosome); and (4) the release or collection of ions though channels or pumps on the membranes of acidic organelles accompanied with pH changes in order to balance ion gradients or for use in proton-motive force [53,54]. Therefore, discreet investigation of the pH-dependent property of sensors and careful pH-calibration of imaging data is essential to validate imaging results.
3.2. pH Sensors
A variety of FP-based pH sensors have been developed until now, including (1) intensity-based sensors composed of a single FP; (2) ratiometric-based sensors composed of a single FP and (3) FRET-based sensors composed of two FPs. Single FP-based ratiometric pH sensors allow more reliable measurement which is less affected by concentration changes of the sensors, and easy tagging into intracellular organelles because of their smaller size (~28 kDa) compared with FRET-based sensors. Thus, in this section, we mainly introduce some examples of single FP-based ratiometric pH sensors for pH measurement in acidic organelles. For details of other types of pH sensors, see other review articles, such as [55] published in 2013. In addition to various pH sensors listed in the article, new intentiometric RFP-based pH sensors, pHuji (pKa = 7.7, Hill coefficient (nH) = 1.10) and pHoran4 (pKa = 7.5, Hill coefficient (nH) = 0.92) have recently been reported [56].
mKeima is a large Stokes-shift version of monomeric red FP (Figure 2A) [57,58]. It exhibits a single emission peak (620 nm) with bimodal excitation spectra (438 and 550 nm peaks), corresponding to neutral (protonated) and anionic (deprotonated) forms of the chromophore, respectively. The ratio of the chromophore’s ionized form is dependent on pH with a pKa of 6.5, thus mKeima can be used as a ratiometric pH sensor. mKeima also shows high resistance to lysosomal degradation enzymes. Katayama et al. utilized these advantages to develop a sensor to detect autophagic events, specifically conversion of autophagosomes to autolysosomes [58]. To achieve this, they fused mKeima with microtubule-associated protein light chain 3 (LC3). During starvation-induced autophagy, the LC3 undergoes cleavage and phosphatidylethanolamine modification, then being recruited to the outer and inner membrane of autophagosomes. Then, they fuse with lysosomes (autolysosomal maturation), so that the packed cargoes are exposed to an acidic and degradative environment for degradation. The mKeima-LC3 probe enabled visualization of these autolysosomal maturation events by detection of the acidification-induced color change of mKeima, and provided a cumulative fluorescent readout of autophagic activity, which was not possible with previous FPs undergoing acidic or proteolytic quenching in lysosomes. An improved version of the ratiometric dual-excitation pH sensor, pHRed was later developed from mKeima [59]. The ratio of fluorescence emission under excitation at 440 and 585 nm changes >10-fold dynamic range with an apparent pKa of 6.6. pHRed also exhibits pH-dependent fluorescence lifetime in the range of pH 5 and 8 with near-infrared two-photon excitation. Because near-infrared light has higher light penetration and less light scattering in thick samples, such as brains, two-photon fluorescence lifetime imaging would offer an advantage for deep-tissue pH monitoring across a broad pH range.
E1GFP is a ratiometric dual emission pH sensor with a pKa of 6.0 [60]. Under excitation at 403 nm, the emission peak shifts from 500 nm (pH ~ 5.0) to 523 nm (pH ~ 7.0). Although the mechanism is unclear, the authors expect it derives from a different acceptor residue in the ESPT process: presumably the neighboring E222 residue is protonated in low pH and cannot act as an ESPT acceptor. The utility to measure pH values in mildly-acidic organelles was demonstrated by fusing it with Trans-activating (Tat) viral protein and monitoring the process of intracellular trafficking after internalization in HeLa cells, which involved pH changes from ~6.3 to ~5.8.
3.3. Calcium Ion Sensors
D1-SG is a FRET-based sensor for simultaneous Ca2+ and pH measurement in secretory granules (Figure 2B) [65]. It was developed from a cameleon [86], which consists of a CFP and a Citrine (YFP) in conjunction with a calmodulin (CaM) insert that contains mutations to lower its Ca2+ affinity along with a CaM-binding peptide (M13) from myosin light-chain kinase. D1-SG also contains a tissue plasminogen activator (tPA) at the N-terminal for localization into secretory granules. In the presence of Ca2+ a CaM changes its conformation to interact with the M13 peptide (the CaM wraps around the M13 peptide). This conformational change renders the distance between the donor CFP and the acceptor Citrine closer, leading to an increase in the FRET efficiency. Surprisingly, Ca2+ affinity is hardly affected by pH changes between pH 7.4 and 5.5 (Kd ~ 120–190 μM), however, the FRET ratio value (CFP intensity to Citrine) is variable depending on pH. Therefore, simultaneous recording of pH values during the FRET measurement are required to calibrate the correct Ca2+ concentration. For use in secretory granules of PC12 cells, Citrine within D1-SG was directly excited to obtain an emission signal whose intensity was dependent on pH (pKa = 5.8)—calibration was achieved by fully alkalizing the secretory granules by treating cells with NH4Cl solution (20 mM), whereby maximum emission was achieved. Accordingly, steady state pH and Ca2+ concentration in the secretory granules of PC12 cells was calculated as 5.8 and 69 ± 15 μM respectively. In the paper, Ca2+ imaging by using the D1-SG probe suggested important new roles for secretory granules, such as contributors to local cytoplasmic Ca2+ rise and refilling of luminal Ca2+ in the ER.
Single FP-based sensors such as the GCaMP series have been widely used to investigate Ca2+-related signal dynamics in the cytoplasm, especially in the field of neuroscience. GCaMP variants with low affinity to Ca2+, such as CEPIAs (Kd ~ 560–670 μM at pH 7.2) [87] and GCaMPer (Kd ~ 400 μM at pH 7.2) [88] have been developed to observe Ca2+ dynamics inside the endoplasmic reticulum. However, the application of most of the GCaMP series to acidic organelles is not currently practical due to their decreased fluorescence intensity at pH less than 7.0 [89]. Their application to imaging within lysosomes is almost impossible because most of them are not resistant to degradative enzymes. The fluorescence of DsRed and eqFP611-derived RCaMPs show higher resistance to degradation enzymes, although the resistance of the Ca2+-binding domain is not clear [39]. Among them, one good choice as a relatively pH-insensitive GCaMP-type sensor is GEM-GECO, which has been utilized to investigate the concentration and dynamics of Ca2+ in single endosomes [63,89]. GEM-GECO is composed of a circular permutant of GFP sandwiched with CaM and the M13 peptide. When excited at ~400 nm, GEM-GECO1 exhibits green (~510 nm) emission in the absence of Ca2+, and blue (~450 nm) emission in the presence of Ca2+. The dynamic range of GEM-GECO1 seems mostly unaffected by pH in the range of pH 7.50 and 5.42, although the Ca2+ affinity is reduced as pH drops (KdCa = 0.27 (pH 7.50), 0.46 (pH 7.00), 0.68 (pH 6.50), 3.09 (pH 6.00), 17.88 (pH 5.42), 54.24 μM (pH 4.97)). In order to correct for pH-dependent effects of the GEM-GECO’s Ca2+ affinity in endosomes, the authors used a ratiometric dual-excitation pH sensor, mKeima (pKa = 6.0). Their semi-quantitative estimation by using the in vitro Kd values suggested that Ca2+ concentration within a majority of endosomes in MIN6 beta-cells is below 2 μM. Ca2+ concentration in more acidic Rab7-positive late endosomes was higher than that in Rab5a-positive early endosomes. Taken together, these Ca2+ sensors in combination with proper pH sensors will help researchers elucidate unknown mechanisms and roles of acidic organelles relating to the intracellular Ca2+ signaling network.
3.4. Zinc Ion Sensors
eCALWY and eZinCh are FRET-based sensors used to monitor intracellular free Zn2+ concentration (Figure 2C) [82]. For eCALWY, a functional Zn2+ binding domain composed of Atox1 and linked via a long flexible linker to domain 4 of ATP7B is sandwiched by Cerulean (CFP) and Citrine (YFP), both of which show reduced pH sensitivity. Mutations on both FPs at their dimeric interface (S208F and V224L) promoted an intramolecular interaction which increased FRET from CFP to YFP in the absence of Zn2+, while the interaction (and therefore the FRET) was decreased upon Zn2+ binding to the functional domain, leading to a 2.4-fold decrease in the emission ratio value. Kd (pH 7.1) for eCALWY variants 1–6 is 2, 9, 45, 630, 1850 and 2900 pM respectively, and Kd (pH 6.0) for VAMP2-eCALWY-6 is 0.5 μM. For eZinCh, Cerulean and Citrine with mutations (Y39H and S208C) to coordinate Zn2+ at their dimeric interface are connected via a long flexible linker. eZinCh exhibits Kd of 8 μM (pH 7.1) and 250 μM (pH 6.0). In the presence of Zn2+, Cerulean and Citrine presumably align in a parallel orientation to bind to Zn2+ at their respective Cys208, and subsequently bind to the 2nd Zn2+ at their respective His39, resulting in enhanced FRET efficiency [90]. These sensors could be targeted in insulin granules of INS-1 (832/13) cells by fusing them to the C-terminal of vesicle-associated membrane protein2 (VAMP2). As a result, free Zn2+ concentration in these vesicles was estimated at between 1 and 100 μM.
3.5. Chloride Ion Sensors
ClopHensor is a non-FRET-based sensor for simultaneous measurement of intracellular Cl− concentration and pH (Figure 2D) [68]. It is composed of Cl−- and pH-sensitive E2GFP and Cl−- and pH-insensitive monomeric DsRed (RFP) linked via a long linker. E2GFP shows dual excitation spectra (~440 and 510 nm peaks) originating from neutral and ionic states of the chromophore, where the ratio is dependent on pH values with an isosbestic point at 458 nm. E2GFP also has a Cl− binding pocket in the vicinity of the chromophore imidazolidinone aromatic ring and shows Cl−-dependent changes of the fluorescence properties. Cl−-binding to the protein does not affect the ratio of the neutral and ionic chromophore. Accordingly, (1) 458 nm excitation at the isosbestic point for E2GFP; (2) 488 nm excitation for E2GFP; and (3) 543 nm excitation for monomeric DsRed generate (1) Cl−-dependent; (2) pH- and Cl−-dependent; and (3) pH- and Cl−-independent signals. The pH calibration curve was obtained by calculating the ratio RpH ((2) green to (1) cyan; pKa = 6.81 ± 0.05 in Cl− unligated form). The pH-dependent calibration curve for Cl− concentration was derived from the ratio RCl ((1) cyan to (3) red; 1KdCl = 13.1 ± 0.5 mM in pH 6.9). The authors applied ClopHensor in large dense-core vesicles (LDCVs), the dominant secretory organelles in neuroendocrine cells by fusing to the N-terminal signal sequence of neuropeptide Y (NPY). They successfully revealed that the average pH of LCDVs is 5.2 ± 0.4 and the average Cl− concentration is 110 ± 48 mM (mean ± s.d.).
4. Conclusions and Future Prospective
A variety of acid-tolerant FPs (pKa < 4.0) with a wide color-range of excitation and emission spectra have been developed. These provide researchers with more options to perform multicolor imaging and develop single FP-based and FRET-based sensors to elucidate molecular or ionic mechanisms in acidic cellular environments [91]. Many different ions inside acidic organelles play important roles during regulation of the activity of internal proteins, cellular signaling and biological homeostasis. To investigate their functions, several ion sensors (Ca2+, Zn2+ and Cl−) have been developed and applied in acidic organelles. As we discussed in Section 3, simultaneous use of a pH sensor for pH calibration is essential for quantitative measurement. In order to avoid spectral overlap, good combinations of ion and pH sensor are as follows: (1) a FRET-based ion sensor composed of CFP and GFP (or YFP), and an intentiometric or ratiometric pH sensor composed of a single RFP (e.g., mOrange2, mKeima and pHRed [40,57,59]); (2) a ratiometric ion sensor composed of a single GFP (or YFP), and an intentiometric or ratiometric pH sensor composed of a single RFP; (3) a ratiometric ion sensor composed of a single RFP, and an intentiometric or ratiometric pH sensor composed of a single GFP (e.g., mNeonGreen and E1GFP [37,60]); (4) a FRET-based ion sensor in which acceptor fluorescence is pH sensitive upon direct excitation (e.g., D1-SG, Figure 2B [65]); (5) an exceptional FP which shows bimodal excitation (or emission) spectra sensitive to both specific ion and pH (e.g., ClopHensor, Figure 2D [68]), and a FP insensitive to both the ion and pH which is used as reference fluorescence for ratiometric measurement.
Among the various ion species in acidic organelles, in particular Ca2+-mediated communication between acidic organelles and neutral pH organelles, as well as signaling network activation triggered by Ca2+ release from acidic organelles in both mammalian and plant cells have recently become areas of increased interest for researchers [4]. The vacuole is the largest and acidic Ca2+-store in plant cells, which may contribute to broad Ca2+ signaling, however, precious few functional roles have been directly demonstrated [92]. The development of Ca2+ sensors with less pH sensitivity would be highly useful for investigating these temporal and spatial dynamics. New types of FP-based sensors to monitor cytosolic K+ (GEPIIs and KIRIN-1 [93,94]) and Mg2+ concentration (MagFRET and MARIO [95,96]) have recently been published. Improvement of these sensors to facilitate their application to acidic cellular environments may help to reveal heretofore unknown functions (e.g., ion homeostasis, ionic gradients or potential across the membrane, and subsequent biological events). Sensors to detect amino acids such as glutamate (SuperGluSnFR, iGluSnFR, iGluf and iGluu [97,98,99]) and arginine (QBP/Citrine/ECFP [100]) have also been reported. The development of such sensors for acidic environments would be useful, especially in the case of glutamate release from synaptic vesicles (pH ~ 5.8 [64]) into the synaptic cleft, which induces neural excitation; the concentration and turnover rate of glutamate into the synaptic vesicles would help in the study of synaptogenesis. The development of a lysosomal arginine sensor would be useful to unveil potential connections between arginine concentration in lysosomes and the autophagy-related signaling pathway [101]. As an alternative application for imaging with acid-tolerant FPs, the development of new acid-tolerant chemiluminescent proteins (CPs) will also expand choices for researchers: CPs can overcome flaws inherent to FPs due to their requirement for excitation light including autofluorescence from samples, undesired activation of light-dependent biological process such as photoreception, and incompatibility with optogenetic tools due to their spectral overlap [102]. To date, there are no acid-tolerant CPs optimized for imaging application. Protein engineering of unique dinoflagellate-derived CPs which emit strong luminescence in acidic conditions [103], or searching for new CPs from uncharacterized bioluminescent species will fulfill these niche but necessary demands of researchers in the future.
Acknowledgments
This work was supported by the ‘CREST, JST’ (No. JPMJCR15N3, JPMJCR12M6), and the MEXT ‘Grant-in-Aid for Scientific Research on Innovative Areas’ ‘Spying minority in biological phenomena’ (No. JP23115003).
Conflicts of Interest
The authors declare no conflict of interest.
References
- Huotari, J.; Helenius, A. Endosome maturation. EMBO J. 2011, 30, 3481–3500. [Google Scholar] [CrossRef] [PubMed]
- Settembre, C.; Fraldi, A.; Medina, D.L.; Ballabio, A. Signals from the lysosome: A control centre for cellular clearance and energy metabolism. Nat. Rev. Mol. Cell Biol. 2013, 14, 283–296. [Google Scholar] [CrossRef] [PubMed]
- Turk, B.; Turk, V. Lysosomes as “suicide bags” in cell death: Myth or reality? J. Biol. Chem. 2009, 284, 21783–21787. [Google Scholar] [CrossRef] [PubMed]
- Patel, S.; Docampo, R. Acidic calcium stores open for business: Expanding the potential for intracellular Ca2+ signaling. Trends Cell Biol. 2010, 20, 277–286. [Google Scholar] [CrossRef] [PubMed]
- Stauber, T.; Jentsch, T.J. Chloride in Vesicular Trafficking and Function. Annu. Rev. Physiol. 2013, 75, 453–477. [Google Scholar] [CrossRef] [PubMed]
- Zoncu, R.; Bar-Peled, L.; Efeyan, A.; Wang, S.; Sancak, Y.; Sabatini, D.M. mTORC1 senses lysosomal amino acids through an inside-out mechanism that requires the vacuolar H+-ATPase. Science 2011, 334, 678–683. [Google Scholar] [CrossRef] [PubMed]
- Tsien, R.Y. The Green Fluorescent Proteins. Annu. Rev. Biochem. 1998, 67, 509–544. [Google Scholar] [CrossRef] [PubMed]
- Cranfill, P.J.; Sell, B.R.; Baird, M.A.; Allen, J.R.; Lavagnino, Z.; De Gruiter, H.M.; Kremers, G.; Davidson, M.W.; Ustione, A.; Piston, D.W. Quantitative assessment of fluorescent proteins. Nat. Methods 2016, 13, 557–562. [Google Scholar] [CrossRef] [PubMed]
- Masuda, H.; Takenaka, Y.; Yamaguchi, A.; Nishikawa, S.; Mizuno, H. A novel yellowish-green fluorescent protein from the marine copepod, Chiridius poppei, and its use as a reporter protein in HeLa cells. Gene 2006, 372, 18–25. [Google Scholar] [CrossRef] [PubMed]
- Bomati, E.K.; Haley, J.E.; Noel, J.P.; Deheyn, D.D. Spectral and structural comparison between bright and dim green fluorescent proteins in Amphioxus. Sci. Rep. 2014, 4, 5469. [Google Scholar] [CrossRef] [PubMed]
- Matz, M.V.; Fradkov, A.F.; Labas, Y.A.; Savitsky, A.P.; Zaraisky, A.G.; Markelov, M.L.; Lukyanov, S.A. Fluorescent proteins from nonbioluminescent Anthozoa species. Nat. Biotechnol. 1999, 17, 969–973. [Google Scholar] [CrossRef] [PubMed]
- Shinoda, H.; Ma, Y.; Nakashima, R.; Sakurai, K.; Matsuda, T.; Nagai, T. Acid-Tolerant Monomeric GFP from Olindias formosa. Cell Chem. Biol. 2018, 25, 330–338. [Google Scholar] [CrossRef] [PubMed]
- Campbell, R.E.; Tour, O.; Palmer, A.E.; Steinbach, P.A.; Baird, G.S.; Zacharias, D.A.; Tsien, R.Y. A monomeric red fluorescent protein. Proc. Natl. Acad. Sci. USA 2002, 99, 7877–7882. [Google Scholar] [CrossRef] [PubMed]
- Shaner, N.C.; Campbell, R.E.; Steinbach, P.A.; Giepmans, B.N.G.; Palmer, A.E.; Tsien, R.Y. Improved monomeric red, orange and yellow fluorescent proteins derived from Discosoma sp. red fluorescent protein. Nat. Biotechnol. 2004, 22, 1567–1572. [Google Scholar] [CrossRef] [PubMed]
- Shen, Y.; Chen, Y.; Wu, J.; Shaner, N.C.; Campbell, R.E. Engineering of mCherry variants with long Stokes shift, red-shifted fluorescence, and low cytotoxicity. PLoS ONE 2017, 12, e0171257. [Google Scholar] [CrossRef] [PubMed]
- Bindels, D.S.; Haarbosch, L.; Van Weeren, L.; Postma, M.; Wiese, K.E.; Mastop, M.; Aumonier, S.; Gotthard, G.; Royant, A.; Hink, M.A.; et al. mScarlet: A bright monomeric red fluorescent protein for cellular imaging. Nat. Methods 2016, 14, 53–56. [Google Scholar] [CrossRef] [PubMed]
- Wang, L.; Jackson, W.C.; Steinbach, P.A.; Tsien, R.Y. Evolution of new nonantibody proteins via iterative somatic hypermutation. Proc. Natl. Acad. Sci. USA 2004, 101, 16745–16749. [Google Scholar] [CrossRef] [PubMed]
- Kredel, S.; Oswald, F.; Nienhaus, K.; Deuschle, K.; Röcker, C.; Wolff, M.; Heilker, R.; Nienhaus, G.U.; Wiedenmann, J. mRuby, a bright monomeric red fluorescent protein for labeling of subcellular structures. PLoS ONE 2009, 4, e4391. [Google Scholar] [CrossRef] [PubMed]
- Lam, A.J.; St-Pierre, F.; Gong, Y.; Marshall, J.D.; Cranfill, P.J.; Baird, M.A.; McKeown, M.R.; Wiedenmann, J.; Davidson, M.W.; Schnitzer, M.J.; et al. Improving FRET dynamic range with bright green and red fluorescent proteins. Nat. Methods 2012, 9, 1005–1012. [Google Scholar] [CrossRef] [PubMed]
- Bajar, B.T.; Wang, E.S.; Lam, A.J.; Kim, B.B.; Jacobs, C.L.; Howe, E.S.; Davidson, M.W.; Lin, M.Z.; Chu, J. Improving brightness and photostability of green and red fluorescent proteins for live cell imaging and FRET reporting. Sci. Rep. 2016, 6, 20889. [Google Scholar] [CrossRef] [PubMed]
- Merzlyak, E.M.; Goedhart, J.; Shcherbo, D.; Bulina, M.E.; Shcheglov, A.S.; Fradkov, A.F.; Gaintzeva, A.; Lukyanov, K.A.; Lukyanov, S.; Gadella, T.W.J.; et al. Bright monomeric red fluorescent protein with an extended fluorescence lifetime. Nat. Methods 2007, 4, 555–557. [Google Scholar] [CrossRef] [PubMed]
- Piatkevich, K.D.; Malashkevich, V.N.; Morozova, K.S.; Nemkovich, N.A.; Almo, S.C.; Verkhusha, V.V. Extended stokes shift in fluorescent proteins: Chromophore-protein interactions in a near-infrared TagRFP675 variant. Sci. Rep. 2013, 3, 1847. [Google Scholar] [CrossRef] [PubMed]
- Shemiakina, I.I.; Ermakova, G.V.; Cranfill, P.J.; Baird, M.A.; Evans, R.A.; Souslova, E.A.; Staroverov, D.B.; Gorokhovatsky, A.Y.; Putintseva, E.V.; Gorodnicheva, T.V.; et al. A monomeric red fluorescent protein with low cytotoxicity. Nat. Commun. 2012, 3, 1204–1207. [Google Scholar] [CrossRef] [PubMed]
- Zapata-Hommer, O.; Griesbeck, O. Efficiently folding and circularly permuted variants of the Sapphire mutant of GFP. BMC Biotechnol. 2003, 3, 5. [Google Scholar] [CrossRef] [PubMed] [Green Version]
- Piatkevich, K.D.; Hulit, J.; Subach, O.M.; Wu, B.; Abdulla, A.; Segall, J.E.; Verkhusha, V.V. Monomeric red fluorescent proteins with a large Stokes shift. Proc. Natl. Acad. Sci. USA 2010, 107, 5369–5374. [Google Scholar] [CrossRef] [PubMed]
- Piatkevich, K.D.; Malashkevich, V.M.; Almo, S.C.; Verkhusha, V.V. Engineering ESPT pathway based on structural analysis of LSSmKate red fluorescent proteins with large Stokes shift. J. Am. Chem. Soc. 2010, 132, 10762–10770. [Google Scholar] [CrossRef] [PubMed]
- Tomosugi, W.; Matsuda, T.; Tani, T.; Nemoto, T.; Kotera, I.; Saito, K.; Horikawa, K.; Nagai, T. An ultramarine fluorescent protein with increased photostability and pH insensitivity. Nat. Methods 2009, 6, 351–353. [Google Scholar] [CrossRef] [PubMed]
- Subach, O.M.; Cranfill, P.J.; Davidson, M.W.; Verkhusha, V.V. An enhanced monomeric blue fluorescent protein with the high chemical stability of the chromophore. PLoS ONE 2011, 6, e28674. [Google Scholar] [CrossRef] [PubMed]
- Katayama, H.; Yamamoto, A.; Mizushima, N.; Yoshimori, T.; Miyawaki, A. GFP-like Proteins Stably Accumulate in Lysosomes. Cell Struct. Funct. 2008, 33, 1–12. [Google Scholar] [CrossRef] [PubMed]
- Goedhart, J.; Von Stetten, D.; Noirclerc-Savoye, M.; Lelimousin, M.; Joosen, L.; Hink, M.A.; Van Weeren, L.; Gadella, T.W.J.; Royant, A. Structure-guided evolution of cyan fluorescent proteins towards a quantum yield of 93%. Nat. Commun. 2012, 3, 751. [Google Scholar] [CrossRef] [PubMed]
- Markwardt, M.L.; Kremers, G.J.; Kraft, C.A.; Ray, K.; Cranfill, P.J.C.; Wilson, K.A.; Day, R.N.; Wachter, R.M.; Davidson, M.W.; Rizzo, M.A. An improved cerulean fluorescent protein with enhanced brightness and reduced reversible photoswitching. PLoS ONE 2011, 6, e17896. [Google Scholar] [CrossRef] [PubMed] [Green Version]
- Ai, H.; Henderson, J.N.; Remington, S.J.; Campbell, R.E. Directed evolution of a monomeric, bright and photostable version of Clavularia cyan fluorescent protein: Structural characterization and applications in fluorescence imaging. Biochem. J. 2006, 400, 531–540. [Google Scholar] [CrossRef] [PubMed]
- Sawano, A.; Miyawaki, A. Directed evolution of green fluorescent protein by a new versatile PCR strategy for site-directed and semi-random mutagenesis. Nucleic Acids Res. 2000, 28, e78. [Google Scholar] [CrossRef] [PubMed]
- Shaner, N.C.; Patterson, G.H.; Davidson, M.W. Advances in fluorescent protein technology. J. Cell Sci. 2007, 120, 4247–4260. [Google Scholar] [CrossRef] [PubMed]
- Roberts, T.M.; Rudolf, F.; Meyer, A.; Pellaux, R.; Whitehead, E.; Panke, S.; Held, M. Identification and Characterisation of a pH-stable GFP. Sci. Rep. 2016, 6, 28166. [Google Scholar] [CrossRef] [PubMed]
- Nagai, T.; Ibata, K.; Park, E.S.; Kubota, M.; Mikoshiba, K.; Miyawaki, A. A variant of YFP with fast and efficient maturation for cell-biological applications. Nat. Biotechnol. 2002, 20, 1585–1588. [Google Scholar] [CrossRef] [PubMed]
- Shaner, N.C.; Lambert, G.G.; Chammas, A.; Ni, Y.; Cranfill, P.J.; Baird, M.A.; Sell, B.R.; Allen, J.R.; Day, R.N.; Israelsson, M.; et al. A bright monomeric green fluorescent protein derived from Branchiostoma lanceolatum. Nat. Methods 2013, 10, 407–409. [Google Scholar] [CrossRef] [PubMed]
- Tsutsui, H.; Karasawa, S.; Okamura, Y.; Miyawaki, A. Improving membrane voltage measurements using FRET with new fluorescent proteins. Nat. Methods 2008, 5, 683–685. [Google Scholar] [CrossRef] [PubMed]
- Shen, Y.; Dana, H.; Abdelfattah, A.S.; Patel, R.; Shea, J.; Molina, R.S.; Rawal, B.; Rancic, V.; Chang, Y.F.; Wu, L.; et al. A genetically encoded Ca2+ indicator based on circularly permutated sea anemone red fluorescent protein eqFP578. BMC Biol. 2018, 16, 9. [Google Scholar] [CrossRef] [PubMed]
- Shaner, N.C.; Lin, M.Z.; McKeown, M.R.; Steinbach, P.A.; Hazelwood, K.L.; Davidson, M.W.; Tsien, R.Y. Improving the photostability of bright monomeric orange and red fluorescent proteins. Nat. Methods 2008, 5, 545–551. [Google Scholar] [CrossRef] [PubMed]
- Guan, Y.; Meurer, M.; Raghavan, S.; Rebane, A.; Lindquist, J.R.; Santos, S.; Kats, I.; Davidson, M.W.; Mazitschek, R.; Hughes, T.E.; et al. Live-cell multiphoton fluorescence correlation spectroscopy with an improved large Stokes shift fluorescent protein. Mol. Biol. Cell 2015, 26, 2054–2066. [Google Scholar] [CrossRef] [PubMed]
- Stiel, A.C.; Trowitzsch, S.; Weber, G.; Andresen, M.; Eggeling, C.; Hell, S.W.; Jakobs, S.; Wahl, M.C. 1.8 Å bright-state structure of the reversibly switchable fluorescent protein Dronpa guides the generation of fast switching variants. Biochem. J. 2007, 402, 35–42. [Google Scholar] [CrossRef] [PubMed]
- Evdokimov, A.G.; Pokross, M.E.; Egorov, N.S.; Zaraisky, A.G.; Yampolsky, I.V.; Merzlyak, E.M.; Shkoporov, A.N.; Sander, I.; Lukyanov, K.A.; Chudakov, D.M. Structural basis for the fast maturation of Arthropoda green fluorescent protein. EMBO Rep. 2006, 7, 1006–1012. [Google Scholar] [CrossRef] [PubMed]
- Shinobu, A.; Agmon, N. The hole in the barrel: Water exchange at the GFP chromophore. J. Phys. Chem. B 2015, 119, 3464–3478. [Google Scholar] [CrossRef] [PubMed]
- Pletnev, S.; Gurskaya, N.G.; Pletneva, N.V.; Lukyanov, K.A.; Chudakov, D.M.; Martynov, V.I.; Popov, V.O.; Kovalchuk, M.V.; Wlodawer, A.; Dauter, Z.; et al. Structural basis for phototoxicity of the genetically encoded photosensitizer KillerRed. J. Biol. Chem. 2009, 284, 32028–32039. [Google Scholar] [CrossRef] [PubMed]
- Verkhusha, V.V.; Akovbian, N.A.; Efremenko, E.N.; Varfolomeyev, S.D.; Vrzheshch, P.V. Kinetic analysis of maturation and denaturation of DsRed, a coral- derived red fluorescent protein. Biochemistry 2001, 66, 1342–1351. [Google Scholar] [PubMed]
- Huang, L.; Pike, D.; Sleat, D.E.; Nanda, V.; Lobel, P. Potential pitfalls and solutions for use of fluorescent fusion proteins to study the lysosome. PLoS ONE 2014, 9, e88893. [Google Scholar] [CrossRef] [PubMed]
- Smith, N.A.; Kress, B.T.; Lu, Y.; Chandler-Militello, D.; Benraiss, A.; Nedergaard, M. Fluorescent Ca2+ indicators directly inhibit the Na,K-ATPase and disrupt cellular functions. Sci. Signal 2018, 11, eaal2039. [Google Scholar] [CrossRef] [PubMed]
- Kuroki, S.; Yoshida, T.; Tsutsui, H.; Iwama, M.; Ando, R.; Michikawa, T.; Miyawaki, A.; Ohshima, T.; Itohara, S. Excitatory Neuronal Hubs Configure Multisensory Integration of Slow Waves in Association Cortex. Cell Rep. 2018, 22, 2809–2817. [Google Scholar] [CrossRef] [PubMed]
- Nick Pace, C.; Scholtz, J.M.; Grimsley, G.R. Forces stabilizing proteins. FEBS Lett. 2014, 588, 2177–2184. [Google Scholar] [CrossRef] [PubMed]
- Casey, J.R.; Grinstein, S.; Orlowski, J. Sensors and regulators of intracellular pH. Nat. Rev. Mol. Cell Biol. 2010, 11, 50–61. [Google Scholar] [CrossRef] [PubMed]
- Zhou, J.; Tan, S.H.; Nicolas, V.; Bauvy, C.; Di Yang, N.; Zhang, J.; Xue, Y.; Codogno, P.; Shen, H.M. Activation of lysosomal function in the course of autophagy via mTORC1 suppression and autophagosome-lysosome fusion. Cell Res. 2013, 23, 508–523. [Google Scholar] [CrossRef] [PubMed]
- Christensen, K.A.; Myers, J.T.; Swanson, J.A. pH-dependent regulation of lysosomal calcium in macrophages. J. Cell Sci. 2002, 115, 599–607. [Google Scholar] [PubMed]
- Steinberg, B.E.; Huynh, K.K.; Brodovitch, A.; Jabs, S.; Stauber, T.; Jentsch, T.J.; Grinstein, S. A cation counterflux supports lysosomal acidification. J. Cell Biol. 2010, 189, 1171–1186. [Google Scholar] [CrossRef] [PubMed]
- Benčina, M. Illumination of the Spatial Order of Intracellular pH by Genetically Encoded pH-Sensitive Sensors. Sensors 2013, 13, 16736–16758. [Google Scholar] [CrossRef] [PubMed]
- Shen, Y.; Rosendale, M.; Campbell, R.E.; Perrais, D. pHuji, a pH-sensitive red fluorescent protein for imaging of exo- and endocytosis. J. Cell Biol. 2014, 207, 419–432. [Google Scholar] [CrossRef] [PubMed]
- Kogure, T.; Karasawa, S.; Araki, T.; Saito, K.; Kinjo, M.; Miyawaki, A. A fluorescent variant of a protein from the stony coral Montipora facilitates dual-color single-laser fluorescence cross-correlation spectroscopy. Nat. Biotechnol. 2006, 24, 577–581. [Google Scholar] [CrossRef] [PubMed]
- Katayama, H.; Kogure, T.; Mizushima, N.; Yoshimori, T.; Miyawaki, A. A sensitive and quantitative technique for detecting autophagic events based on lysosomal delivery. Chem. Biol. 2011, 18, 1042–1052. [Google Scholar] [CrossRef] [PubMed]
- Tantama, M.; Hung, Y.P.; Yellen, G. Imaging intracellular pH in live cells with a genetically encoded red fluorescent protein sensor. J. Am. Chem. Soc. 2011, 133, 10034–10037. [Google Scholar] [CrossRef] [PubMed]
- Serresi, M.; Bizzarri, R.; Cardarelli, F.; Beltram, F. Real-time measurement of endosomal acidification by a novel genetically encoded biosensor. Anal. Bioanal. Chem. 2009, 393, 1123–1133. [Google Scholar] [CrossRef] [PubMed]
- Miesenböck, G.; De Angelis, D.A.; Rothman, J.E. Visualizing secretion and synaptic transmission with pH-sensitive green fluorescent proteins. Nature 1998, 394, 192–195. [Google Scholar] [CrossRef] [PubMed]
- Disbrow, G.L.; Hanover, J.A.; Schlegel, R. Endoplasmic Reticulum-Localized Human Papillomavirus Type 16 E5 Protein Alters Endosomal pH but Not trans -Golgi pH Endoplasmic Reticulum-Localized Human Papillomavirus Type 16 E5 Protein Alters Endosomal pH but Not trans -Golgi pH. J. Virol. 2005, 79, 5839–5846. [Google Scholar] [CrossRef] [PubMed]
- Albrecht, T.; Zhao, Y.; Nguyen, T.H.; Campbell, R.E.; Johnson, J.D. Fluorescent biosensors illuminate calcium levels within defined beta-cell endosome subpopulations. Cell Calcium 2015, 57, 263–274. [Google Scholar] [CrossRef] [PubMed]
- Egashira, Y.; Takase, M.; Watanabe, S.; Ishida, J.; Fukamizu, A.; Kaneko, R.; Yanagawa, Y.; Takamori, S. Unique pH dynamics in GABAergic synaptic vesicles illuminates the mechanism and kinetics of GABA loading. Proc. Natl. Acad. Sci. USA 2016, 113, 10702–10707. [Google Scholar] [CrossRef] [PubMed]
- Dickson, E.J.; Duman, J.G.; Moody, M.W.; Chen, L.; Hille, B. Orai-STIM-mediated Ca2+ release from secretory granules revealed by a targeted Ca2+ and pH probe. Proc. Natl. Acad. Sci. USA 2012, 109, E3539–E3548. [Google Scholar] [CrossRef] [PubMed]
- Poëa-Guyon, S.; Pasquier, H.; Mérola, F.; Morel, N.; Erard, M. The enhanced cyan fluorescent protein: A sensitive pH sensor for fluorescence lifetime imaging. Anal. Bioanal. Chem. 2013, 405, 3983–3987. [Google Scholar] [CrossRef] [PubMed]
- Mitchell, K.J.; Pinton, P.; Varadi, A.; Tacchetti, C.; Ainscow, E.K.; Pozzan, T.; Rizzuto, R.; Rutter, G.A. Dense core secretory vesicles revealed as a dynamic Ca2+ store in neuroendocrine cells with a vesicle-associated membrane protein aequorin chimaera. J. Cell Biol. 2001, 155, 41–51. [Google Scholar] [CrossRef] [PubMed]
- Arosio, D.; Ricci, F.; Marchetti, L.; Gualdani, R.; Albertazzi, L.; Beltram, F. Simultaneous intracellular chloride and pH measurements using a GFP-based sensor. Nat. Methods 2010, 7, 516–518. [Google Scholar] [CrossRef] [PubMed]
- Wan, Q.; Chen, S.; Shi, W.; Li, L.; Ma, H. Lysosomal pH rise during heat shock monitored by a lysosome-targeting near-infrared ratiometric fluorescent probe. Angew. Chem. Int. Ed. 2014, 53, 10916–10920. [Google Scholar] [CrossRef] [PubMed]
- Shen, J.; Zeng, Y.; Zhuang, X.; Sun, L.; Yao, X.; Pimpl, P.; Jiang, L. Organelle pH in the arabidopsis endomembrane system. Mol. Plant 2013, 6, 1419–1437. [Google Scholar] [CrossRef] [PubMed]
- Bagar, T.; Altenbach, K.; Read, N.D.; Benčina, M. Live-cell imaging and measurement of intracellular pH in filamentous fungi using a genetically encoded ratiometric probe. Eukaryot. Cell 2009, 8, 703–712. [Google Scholar] [CrossRef] [PubMed]
- Gerasimenko, J.V.; Tepikin, A.V.; Petersen, O.H.; Gerasimenko, O.V. Calcium uptake via endocytosis with rapid release from acidifying endosomes. Curr. Biol. 1998, 8, 1335–1338. [Google Scholar] [CrossRef]
- Sherwood, M.W.; Prior, I.A.; Voronina, S.G.; Barrow, S.L.; Woodsmith, J.D.; Gerasimenko, O.V.; Petersen, O.H.; Tepikin, A.V. Activation of trypsinogen in large endocytic vacuoles of pancreatic acinar cells. Proc. Natl. Acad. Sci. USA 2007, 104, 5674–5679. [Google Scholar] [CrossRef] [PubMed]
- Rossier, J.; Tricoire, L.; Tsuzuki, K.; Courjean, O.; Gibelin, N.; Lambolez, B. Calcium dependence of aequorin bioluminescence dissected by random mutagenesis. Proc. Natl. Acad. Sci. USA 2006, 103, 9500–9505. [Google Scholar] [CrossRef]
- Mahapatra, N.R.; Mahata, M.; Hazra, P.P.; Mcdonough, P.M.; Connor, D.T.O.; Mahata, S.K. A Dynamic Pool of Calcium in Catecholamine Storage Vesicles. J. Biol. Chem. 2004, 279, 51107–51121. [Google Scholar] [CrossRef] [PubMed]
- Gee, K.R.; Brown, K.A.; Chen, W.U.; Gray, D.; Johnson, I. Chemical and physiological characterization of fluo-4 Ca2+-indicator dyes. Cell Calcium 2000, 27, 97–106. [Google Scholar] [CrossRef] [PubMed]
- Raveh, A.; Valitsky, M.; Shani, L.; Coorssen, J.R.; Blank, P.S.; Zimmerberg, J.; Rahamimoff, R. Cell Calcium Observations of calcium dynamics in cortical secretory vesicles. Cell Calcium 2012, 52, 217–225. [Google Scholar] [CrossRef] [PubMed]
- Lloyd-Evans, E.; Morgan, A.J.; He, X.; Smith, D.A.; Elliot-Smith, E.; Sillence, D.J.; Churchill, G.C.; Schuchman, E.H.; Galione, A.; Platt, F.M. Niemann-Pick disease type C1 is a sphingosine storage disease that causes deregulation of lysosomal calcium. Nat. Med. 2008, 14, 1247–1255. [Google Scholar] [CrossRef] [PubMed]
- Sonawane, N.D.; Thiagarajah, J.R.; Verkman, A.S. Chloride Concentration in Endosomes Measured Using a Ratioable Fluorescent Cl− Indicator. J. Biol. Chem. 2002, 277, 5506–5513. [Google Scholar] [CrossRef] [PubMed]
- Sonawane, N.D.; Verkman, A.S. Determinants of [Cl−] in recycling and late endosomes and Golgi complex measured using fluorescent ligands. J. Cell Biol. 2003, 160, 1129–1138. [Google Scholar] [CrossRef] [PubMed]
- Li, P.; Zhang, S.; Fan, N.; Xiao, H.; Zhang, W.; Zhang, W.; Wang, H. Quantitative Fluorescence Ratio Imaging of Intralysosomal Chloride Ions with Single Excitation/Dual Maximum Emission. Chemistry 2014, 20, 11760–11767. [Google Scholar] [CrossRef] [PubMed]
- Vinkenborg, J.L.; Nicolson, T.J.; Bellomo, E.A.; Koay, M.S.; Rutter, G.A.; Merkx, M. Genetically encoded FRET sensors to monitor intracellular Zn2+ homeostasis. Nat. Methods 2009, 6, 737–740. [Google Scholar] [CrossRef] [PubMed]
- Xue, L.; Li, G.; Zhu, D.; Liu, Q.; Jiang, H. Rational Design of a Ratiometric and Targetable Fluorescent Probe for Imaging Lysosomal Zinc Ions. Inorg. Chem. 2012, 51, 10842–10849. [Google Scholar] [CrossRef] [PubMed]
- Zhu, H.; Fan, J.; Zhang, S.; Cao, J.; Song, K.; Ge, D.; Dong, H.; Wang, J.; Peng, X. Ratiometric fluorescence imaging of lysosomal Zn2+ release under oxidative stress in stem cells. Biomater. Sci. 2014, 89–97. [Google Scholar] [CrossRef]
- Lee, H.; Cho, C.; Seo, H.; Singha, S.; Jun, Y.W.; Lee, K.; Jung, Y.; Kim, K.; Park, S.; Bae, S.C.; et al. A two-photon fluorescent probe for lysosomal zinc ions. Chem. Commun. 2016, 52, 124–127. [Google Scholar] [CrossRef] [PubMed]
- Miyawaki, A.; Llopis, J.; Heim, R.; McCaffery, J.M.; Adams, J.A.; Ikura, M.; Tsien, R.Y. Fluorescent indicators for Ca2+ based on green fluorescent proteins and calmodulin. Nature 1997, 388, 882–887. [Google Scholar] [CrossRef] [PubMed]
- Suzuki, J.; Kanemaru, K.; Ishii, K.; Ohkura, M.; Okubo, Y.; Iino, M. Imaging intraorganellar Ca2+ at subcellular resolution using CEPIA. Nat. Commun. 2014, 5, 4153. [Google Scholar] [CrossRef] [PubMed]
- Henderson, M.J.; Baldwin, H.A.; Werley, C.A.; Boccardo, S.; Whitaker, L.R.; Yan, X.; Holt, G.T.; Schreiter, E.R.; Looger, L.L.; Cohen, A.E.; et al. A low affinity GCaMP3 variant (GCaMPer) for imaging the endoplasmic reticulum calcium store. PLoS ONE 2015, 10, e0139273. [Google Scholar] [CrossRef] [PubMed]
- Zhao, Y.; Araki, S.; Wu, J.; Teramoto, T.; Chang, Y.; Nakano, M.; Abdelfattah, A.S.; Fujiwara, M.; Ishihara, T.; Nagai, T.; Campbell, R.E. An Expanded Palette of Genetically Encoded Ca2+ indicators. Science 2011, 557, 1888–1891. [Google Scholar] [CrossRef] [PubMed]
- Evers, T.H.; Appelhof, M.A.M.; de Graaf-Heuvelmans, P.T.H.M.; Meijer, E.W.; Merkx, M. Ratiometric Detection of Zn(II) Using Chelating Fluorescent Protein Chimeras. J. Mol. Biol. 2007, 374, 411–425. [Google Scholar] [CrossRef] [PubMed]
- Betolngar, D.B.; Erard, M.; Pasquier, H.; Bousmah, Y.; Diop-Sy, A.; Guiot, E.; Vincent, P.; Mérola, F. pH sensitivity of FRET reporters based on cyan and yellow fluorescent proteins. Anal. Bioanal. Chem. 2015, 407, 4183–4193. [Google Scholar] [CrossRef] [PubMed]
- Schö, G. Calcium Signals from the Vacuole. Plants 2013, 2, 589–614. [Google Scholar] [CrossRef]
- Bischof, H.; Rehberg, M.; Stryeck, S.; Artinger, K.; Eroglu, E.; Waldeck-Weiermair, M.; Gottschalk, B.; Rost, R.; Deak, A.T.; Niedrist, T.; et al. Novel genetically encoded fluorescent probes enable real-time detection of potassium in vitro and in vivo. Nat. Commun. 2017, 8, 1422. [Google Scholar] [CrossRef] [PubMed]
- Shen, Y.; Wu, S.; Rancic, V.; Qian, Y.; Miyashita, S. Genetically encoded ratiometric indicators for potassium ion. bioRxiv 2018. [Google Scholar] [CrossRef]
- Lindenburg, L.H.; Vinkenborg, J.L.; Oortwijn, J.; Aper, S.J.A.; Merkx, M. MagFRET: The First Genetically Encoded Fluorescent Mg2+ Sensor. PLoS ONE 2013, 8, e82009. [Google Scholar] [CrossRef] [PubMed]
- Maeshima, K.; Matsuda, T.; Shindo, Y.; Imamura, H.; Tamura, S.; Imai, R.; Kawakami, S.; Nagashima, R.; Soga, T.; Noji, H.; et al. A transient Rise in Free Mg2+ Ions Released from ATP-Mg Hydrolysis Contributes to Mitotic Chromosome Condensation. Curr. Biol. 2018, 28, 444–450. [Google Scholar] [CrossRef] [PubMed]
- Hires, S.A.; Zhu, Y.; Tsien, R.Y. Optical measurement of synaptic glutamate spillover and reuptake by linker optimized glutamate-sensitive fluorescent reporters. Proc. Natl. Acad. Sci. USA 2008, 105, 4411–4416. [Google Scholar] [CrossRef] [PubMed]
- Marvin, J.S.; Borghuis, B.G.; Tian, L.; Cichon, J.; Harnett, M.T.; Akerboom, J.; Gordus, A.; Renninger, S.L.; Chen, T.W.; Bargmann, C.I.; et al. An optimized fluorescent probe for visualizing glutamate neurotransmission. Nat. Methods 2013, 10, 162–170. [Google Scholar] [CrossRef] [PubMed]
- Helassa, N.; Dürst, C.D.; Coates, C.; Kerruth, S.; Arif, U.; Schulze, C.; Wiegert, J.S.; Geeves, M.; Oertner, T.G.; Török, K. Ultrafast glutamate sensors resolve high-frequency release at Schaffer collateral synapses. Proc. Natl. Acad. Sci. USA 2018, 1–6. [Google Scholar] [CrossRef] [PubMed]
- Bogner, M.; Ludewig, U. Visualization of arginine influx into plant cells using a specific FRET-sensor. J. Fluoresc. 2007, 17, 350–360. [Google Scholar] [CrossRef] [PubMed]
- Yao, Y.; Jones, E.; Inoki, K. Lysosomal regulation of mTORC1 by amino acids in mammalian cells. Biomolecules 2017, 7, 51. [Google Scholar] [CrossRef] [PubMed]
- Suzuki, K.; Nagai, T. Recent progress in expanding the chemiluminescent toolbox for bioimaging. Curr. Opin. Biotechnol. 2017, 48, 135–141. [Google Scholar] [CrossRef] [PubMed]
- Valiadi, M.; Iglesias-Rodriguez, D. Understanding Bioluminescence in Dinoflagellates—How Far Have We Come? Microorganisms 2013, 1, 3–25. [Google Scholar] [CrossRef] [PubMed]
Figure 1.
Chromophore structures of GFP-like proteins. (A) Protonation of the GFP chromophore causes contraction of the π conjugation system, resulting in an absorption spectral shift from 480–500 nm to 360–380 nm. The protonation also makes the chromophore unstable and results in a fluorescence quantum yield decrease; (B) Chemical structures of selected GFP-like proteins. The π-conjugation system responsible for fluorescence emission are colored to correspond with the color of fluorescence emission; (C) Excited state proton transfer (ESPT) in LSS-mKate1. Glu160 act as a proton acceptor in ESPT.

Figure 2.
Schematic drawing of FP-based sensors for application in acidic organelles. (A) mKeima emits single emission at 620 nm, with dual excitation peaks at 438 and 550 nm, corresponding to protonated and deprotonated state of the chromophore. Under starvation-induced autophagy LC3-tagged mKeima is incorporated into autophagosomes, then recruited into lysosomes. This acidification induces color change of mKeima. LC3: microtubule-associated protein light chain 3; (B) D1-SG is a FRET-based and low-affinity Ca2+ sensor applicable at pH levels between 5.5 and 7.4 (Kd ~ 120–190 μM). Citrine can serve as an intentiometric pH sensor with direct excitation of ~500 nm, due to its inherent pH sensitivity (pKa = 5.8). tPA: tissue plasminogen activator (secretory granule localization); (C) eZinCh is FRET-based, with low-affinity Zn2+ sensors composed of Cerulean and Citrine with Cys and His substitutions directed outside the β-barrel. Simultaneous use with pH sensor is necessary for pH calibration of the sensor. VAMP2: vesicle-associated membrane protein 2 (secretory granule localization); (D) ClopHensor records both Cl− and pH in a ratiometric manner by applying three lasers for excitation (458, 488 and 543 nm). E2GFP changes the ratio of two excitation peaks and fluorescence intensity (protonated and deprotonated forms) depending on Cl− concentration and pH. A pH isosbestic point exists at ~458 nm so that E2GFP emission under 458 nm excitation is pH-insensitive.


Table 1.
Optical property of acid-tolerant GFP-like proteins.
| Color | Protein | λex/em a (nm) | ε b (103 M−1 cm−1) | QY c | Bright-ness d | Oligomeric State e (In Vitro/OSER) | pKa f | Resistance to Lysosomal Enzymes | Ref. |
|---|---|---|---|---|---|---|---|---|---|
| Blue | Sirius | 355/424 | 15.0 | 0.24 | 3.6 | mono/N.D. | <3.0 | Yes g | [27] |
| mTagBFP2 | 399/454 | 50.6 (76.0) | 0.64 (0.48) | 32.4 (36.5) | mono/oligo | 2.7 (2.4) | eqFP578-derivatives. Maybe no. | [28] | |
| Cyan | mTurquoise2 | 434/474 | 30.0 (31.0) | 0.93 (0.92) | 27.9 (28.5) | mono/mono | 3.1 (3.6) | avGFP-derivatives. Maybe no. [29] h | [30] |
| mCerulean3 | 434/475 | 40.0 (29.0) | 0.80 (0.80) | 32.0 (23.2) | mono/mono | 3.2 (3.4) | [31] | ||
| mTFP1 | 462/492 | 64.0 (53.0) | 0.85 (0.85) | 54.4 (45.1) | mono/mono | 4.3 (4.3) | N.D. | [32] | |
| UV-excitable Green | mT-Sapphire | 399/511 | 44.0 (34.0) | 0.60 (0.59) | 26.4 (20.1) | mono/mono | 4.9 (4.8) | avGFP-derivatives. Basically no. | [24] |
| Green | ECGFP | 463/506 | 23.9 | 0.14 | 3.3 | mono/N.D. | <4.0 | [33] | |
| mEmerald | 487/509 | 57.5 (62.0) | 0.68 (0.75) | 39.1 (46.5) | mono/mono | 6.0 (4.6) | [34] | ||
| pH-tdGFP | 488/515 | N.D. | N.D. | N.D. | tandem-dimer | 4.8 | [35] | ||
| Yellow-Green | mVenus | 515/527 | 105.0 (127.0) | 0.64 (0.67) | 67.2 (85.1) | mono/mono | 6.0 (5.4) | [36] | |
| Gamillus | 504/519 | 83.0 | 0.90 | 74.7 | mono/mono | 3.4 | Yes | [12] | |
| mNeonGreen | 506/517 | 116.0 (113.0) | 0.80 (0.80) | 92.8 (90.4) | mono/mono | 5.7 (5.4) | Maybe no [12] | [37] | |
| Orange | mKOk | 551/563 | 105.0 | 0.61 | 64.1 | mono/N.D. | 4.2 | N.D. | [38] |
| Red | mRFP1 | 584/607 | 50.0 (55.0) | 0.25 (0.35) | 12.5 (19.3) | mono/mono | 4.5 (3.8) | DsRed-derivatives. Basically yes. [39] | [13] |
| mCherry | 587/610 | 72.0 (85.0) | 0.22 (0.30) | 15.8 (25.5) | mono/mono | <4.5 (3.8) | [14] | ||
| mCherry2 | 589/610 | 79.4 | 0.22 | 17.5 | mono/N.D. | 3.3 | [15] | ||
| mStrawberry | 574/596 | 90.0 | 0.29 | 26.1 | mono/mono | <4.5 | [14] | ||
| mScarlet | 569/594 | 100.0 | 0.70 | 70.0 | mono/mono | 5.3 | [16] | ||
| mRuby | 558/605 | 112.0 (109.0) | 0.35 (0.38) | 39.2 (41.4) | mono/mono | 4.4 (4.4) | eqFP611-derivatives. Basically yes. [39] | [18] | |
| mRuby2 | 559/600 | 113.0 (107.0) | 0.38 (0.37) | 42.9 (39.6) | mono/mono | 5.3 (4.4) | [19] | ||
| mRuby3 | 558/592 | 128.0 | 0.45 | 57.6 | mono/N.D. | 4.8 | [20] | ||
| TagRFP | 555/584 | 100.0 (130.0) | 0.48 (0.33) | 48.0 (42.9) | mono/oligo | 3.1 (3.0) | eqFP578-derivatives. Basically no. [39] | [21] | |
| TagRFP-T | 555/584 | 81.0 (106.0) | 0.41 (0.32) | 33.2 (33.9) | mono/oligo | 4.6 (4.3) | [40] | ||
| FusionRed | 580/608 | 83.0 (85.0) | 0.19 (0.30) | 15.8 (25.5) | mono/mono | 4.6 (4.2) | [23] | ||
| Blue-excitable Red | LSSmKate1 | 463/624 | 31.2 | 0.08 | 2.5 | mono/N.D. | 3.2 | [25] | |
| LSSmKate2 | 460/605 | 26.0 | 0.17 | 4.4 | mono/N.D. | 2.7 | [25] | ||
| hmKeima4.15 | 436/612 | 28.0 | 0.29 | 8.1 | mono/N.D. | 5.2 | mKeima-derivative. Maybe yes. | [41] | |
| Far Red | mPlum | 590/649 | 41.0 (80.0) | 0.10 (0.13) | 4.1 (10.4) | mono/mono | <4.5 (4.6) | DsRed-derivatives. Maybe yes. | [17] |
| mRaspberry | 598/625 | 86.0 | 0.15 | 12.9 | mono/mono | <4.5 | [17] | ||
| TagRFP657 | 611/657 | 34.0 | 0.10 | 3.4 | mono/N.D. | 3.4 | eqFP578-derivatives. Maybe no. | [22] |
a Wavelength of excitation and emission peaks; b Molar extinction coefficient; c Fluorescence quantum yield; d Product of ε and QY, divided by 1000; e Oligomeric state of FPs determined by gel-filtration chromatography (in vitro) or OSER assay with mammalian cells; f pH at which fluorescence intensity becomes its half-maximal value; g Sirius is derived from avGFP, however it kept emitting fluorescence in phagosomes in Dictyostelium discoidium; h FPs from the same origin tend to show similar resistance to proteolytic degradation in lysosomes. Values without parentheses are from original articles. Values indicated in parentheses are referred from a paper [8]. N.D. indicates “Not Determined”.
Table 2.
FP-based or chemical dye-based sensors for measurement of ion concentration in acidic organelles.
Table 2.
FP-based or chemical dye-based sensors for measurement of ion concentration in acidic organelles.
| Ion | Organelle | Cell | Sensor | Class | pKa or Kd (pH or pKa) | Resting pH, or [Ca2+, Zn2+ or Cl−] (pH) | Ref. |
|---|---|---|---|---|---|---|---|
| pH | Endosome | Foreskin keratino-cyte | Cellubrevin-r-pHluorin | Gen a, Single FP-base dual-excitation | 6.9 [61] | Early endosome: 5.9 | [62] |
| HeLa | Tat-E1GFP | Gen, Single FP-base dual-excitation | 6.4–6.7 | Early endosome: 6.8 Endosome: 5.8–6.3 | [60] | ||
| MIN6 beta-cell | TiVAMP-mKeima | Gen, Single FP-base dual-excitation | 5.8 | Early endosome: 6.3 Late endosome: 5.8 | [63] | ||
| Synaptic vesicle (SV) | Hippocam-pal neuron | Synaptophysin-mOrange2 | Gen, Single FP-base, intensiometric | 6.5 | GABAergic SV: ~6.4 Glutamatergic SV: ~5.8 | [64] | |
| Secretory granule | PC12 | Citrine (YFP) used in D1-SG (Ca2+ sensor) | Gen, intensiometric | 5.8 | 5.8 | [65] | |
| PC12 | CgA-ECFP | Gen, Single FP-base, FLIM | N.D. | 5.5 | [66] | ||
| MIN6 | VAMP2-pH.fluorin(e) | Gen, Single FP-base, Intensiometric | N.D. | 6.3 | [67] | ||
| PC12, WSS-1 | NPY-ClopHensor | Gen, Ratiometric (Non-FRET-base) | 6.8 | 5.2 (PC12) 5.6 (WSS1) | [68] | ||
| Lysosome | HeLa, MCF-7 | Lyso-pH | Chem b, Ratiometric | 5.0 | 4.6 | [69] | |
| Vacuole | A. thaliana | Aleurain-PRpHluorin | Gen, Single FP-base dual-excitation | 6.6 | 5.2 | [70] | |
| A. niger | RaVC (improved version of pHluorin for pH imaging in filamentous fungi) | Gen, Single FP-base dual-excitation | 6.7 (in vitro) 6.9 (in cell) | 6.2–6.5 | [71] | ||
| Ca2+ | Endosome | MIN6 beta-cell | TiVAMP-GEM-GECO1 | Gen, Single FP-base dual-emission | 0.27 (pH 7.5), 0.46 (7.0), 0.68 (6.5), 3.1 (6.0), 17.9 (5.4), 54.2 μM (5.0) | Early endosome: 0.5 (6.3) Late endosome: 2.5 μM (5.8) | [63] |
| 3T3 Swiss fibroblast | Oregon green 488 BAPTA-5N | Chem, Intensiometric | 20 μM | 3.0 μM (5.7) (30 min incubation) | [72] | ||
| Pancreatic acinar cell | Oregon green 488 BAPTA-5N | Chem, Intensiometric | 36.5 (pH 7.2), 55.3 (5.9), 116 μM (5.3) | 37 μM (5.9) | [73] | ||
| Secretory granule | PC12 | D1-SG | Gen, FRET-base | 120–190 μM (pH 7.4–5.5) | 69 μM (5.8) | [65] | |
| MIN6 | VAMP2-mut.aequorin | Gen, Intensiometric | 1–10 μM | ~50 μM (6.3) | [67] | ||
| PC12 | Chromogranin-aequorin | Gen, Intensiometric | 3.8 μM [74] | 1.4 μM (~5.5) | [75] | ||
| Sea urchin egg | Fluo-4 | Chem, Intensiometric | 345 nM (pH 7.2) [76] | ~10–100 μM | [77] | ||
| Lysosome | Mouse macrophage | Fura-2 dextran | Chem, Ratiometric | ~200 μM | 600 μM (4.5) | [53] | |
| Mouse macrophage | Oregon green BAPTA-1 dextran | Chem, Intensiometric | ~500 μM | 400 μM (4.5) | [53] | ||
| Human fibroblast | Rhod dextran | Chem, Intensiometric | 551 ± 107 μM | 550 μM (4.5) | [78] | ||
| Cl− | Endosome | J774 cell, CHO cell | BAC-TMR-dextran | Chem, Ratiometric | ~25–50 mM (pH 7.4) | 17→53 mM (6.95→5.30) (J773) 28→73 mM (6.92→5.60) (CHO) | [79] |
| J774 cell, CHO cell | BAC-dextran-Tf-TMR | Chem, Ratiometric | ~25–50 mM (pH 7.4) | 18→40 mM (6.91→6.05) (J773) 24→46 mM (6.95→6.18) (CHO) | [80] | ||
| Secretory granule | PC12, WSS-1 | NPY-ClopHensor | Gen, Ratiometric (Non-FRET-base) | 13.1 mM (pKa 6.81) | 110 ± 48 mM (5.2) (PC12) 122 mM (5.6) (WSS1) | [68] | |
| Lysosome | Venticular myocyte | 6-methoxyquino-linium–dansyl | Chem, Ratiometric | ~15 mM (pH 4.5) | 9.46 mM | [81] | |
| Zn2+ | Secretory granule | INS-1 (832/13) | VAMP2-eZinCh | Gen, Ratiometric (FRET) | 8 (pH 7.1), 260 μM (6.0) | 1–100 μM | [82] |
| Lysosome | NIH 3T3 | DQZn4 | Chem, Ratiometric | 16 nM (pH 5.2) | N.D. | [83] | |
| NSCs, MCF-7, HeLa | LysoZn-1 | Dhem, Ratiometric | ~150 μM (pH 7.2) | N.D. | [84] | ||
| NIH 3T3 | probe 1 (no name) | Chem, Intensiometric | 8.55 μM (pH 5.0) | N.D. | [85] |
a FP-based sensor; b Organic dye-based sensor.
© 2018 by the authors. Licensee MDPI, Basel, Switzerland. This article is an open access article distributed under the terms and conditions of the Creative Commons Attribution (CC BY) license (http://creativecommons.org/licenses/by/4.0/).
Share and Cite
MDPI and ACS Style
Shinoda, H.; Shannon, M.; Nagai, T. Fluorescent Proteins for Investigating Biological Events in Acidic Environments. Int. J. Mol. Sci. 2018, 19, 1548. https://doi.org/10.3390/ijms19061548
AMA Style
Shinoda H, Shannon M, Nagai T. Fluorescent Proteins for Investigating Biological Events in Acidic Environments. International Journal of Molecular Sciences. 2018; 19(6):1548. https://doi.org/10.3390/ijms19061548
Chicago/Turabian StyleShinoda, Hajime, Michael Shannon, and Takeharu Nagai. 2018. "Fluorescent Proteins for Investigating Biological Events in Acidic Environments" International Journal of Molecular Sciences 19, no. 6: 1548. https://doi.org/10.3390/ijms19061548
Note that from the first issue of 2016, this journal uses article numbers instead of page numbers. See further details here.