Article

Increased Phenacetin Oxidation upon the L382V Substitution in Cytochrome P450 1A2 is Associated with Altered Substrate Binding Orientation

Department of Pharmaceutical Sciences, School of Pharmacy, West Virginia University, Morgantown, WV 26506, USA
*
Author to whom correspondence should be addressed.
Int. J. Mol. Sci. 2018, 19(6), 1580; https://doi.org/10.3390/ijms19061580
Submission received: 3 May 2018 / Revised: 23 May 2018 / Accepted: 23 May 2018 / Published: 25 May 2018
(This article belongs to the Special Issue Cytochromes P450: Drug Metabolism and Bioactivation)

Abstract

:
Leucine382 of cytochrome P450 1A2 (CYP1A2) plays an important role in binding and O-dealkylation of phenacetin, with the L382V mutation increasing substrate oxidation (Huang and Szklarz, 2010, Drug Metab. Dispos. 38:1039–1045). This was attributed to altered substrate binding orientation, but no direct experimental evidence had been available. Therefore, in the current studies, we employed nuclear magnetic resonance (NMR) longitudinal (T1) relaxation measurements to investigate phenacetin binding orientations within the active site of CYP1A2 wild type (WT) and mutants. Paramagnetic relaxation time (T1P) for each proton of phenacetin was calculated from the T1 value obtained from the enzymes in ferric and ferrous-CO state in the presence of phenacetin, and used to model the orientation of phenacetin in the active site. All aromatic protons of phenacetin were nearly equidistant from the heme iron (6.34–8.03 Å). In contrast, the distance between the proton of the –OCH2– group, which is abstracted during phenacetin oxidation, and the heme iron, was much shorter in the L382V (5.93 Å) and L382V/N312L (5.96 Å) mutants compared to the N312L mutant (7.84 Å) and the wild type enzyme (6.55 Å), consistent with modeling results. These studies provide direct evidence for the molecular mechanism underlying increased oxidation of phenacetin upon the L382V mutation.

1. Introduction

Cytochromes P450 (P450s, CYPs) are heme-containing monoxygenase enzymes, which are responsible for the oxidation of a large variety of drugs, carcinogens, and other xenobiotics in species ranging from bacteria to humans. A P450 enzyme usually has the ability to metabolize a number of different substrates, and different P450s often display overlapping substrate specificities and inhibitor susceptibilities [1,2].
The CYP1A subfamily has two isoforms, 1A1 and 1A2, which display ~72% sequence identity but exhibit different substrate specificities and inhibitor susceptibilities. CYP1A2 is one of the major hepatic CYPs exclusively in human liver (~13–15%) and metabolizes about 15% of clinical drugs [3]. CYP1A2 was first characterized as phenacetin O-dealkylase [4], and phenacetin O-dealkylation has been used as the most common marker reaction for CYP1A2 activity in the in vitro studies [5].
The crystal structure of CYP1A2 (Protein Data Bank ID: 2HI4) in complex with α-naphthoflavone (ANF) has been solved by X-ray crystallography, with the structural refinement of 1.95 Å [6]. The compact active site is closed without apparent solvent or substrate access channels. The active site cavity of CYP1A2 has a medium volume of 375 Å3 [6], which is larger than that of CYP2A6 (260 Å3) [7], but much smaller than that of CYP3A4 and CYP2C8, with cavity volumes of 1385 Å3 and 1438 Å3, respectively [8,9]. The narrow substrate binding cavity of CYP1A2 is lined by residues on helices F and I. The cavity of CYP1A2 is stabilized by strong hydrogen-bonding interactions between the side chain of Thr223 on helix F and the side chain of Asp320 on helix I. Both Thr223 and Asp320 are involved in an extensive network of hydrogen-bonded water molecules and side chains, including Tyr189, Val220, Thr498, and Lys500 [6].
The crystal structure of CYP1A2 reveals that Leu382 is located near the heme iron, and thus may play a role in determining substrate specificity. This is consistent with our previous findings that the L382V mutation alters enzyme specificity with alkoxyresorufins and phenacetin [10,11,12]. Enzyme kinetics studies have shown that the L382V mutant and other multiple mutants containing the L382V mutation displayed about 2-fold or 3-fold higher catalytic activities with phenacetin than the wild type enzyme, while other single mutants, such as T124S, T223N, V227G, and N312L, showed much lower activities [12]. In addition, molecular modeling studies have shown that the substitution of Leu by a smaller Val allowed the substrate to move closer to the heme iron, thereby promoting hydrogen abstraction and increasing P450 catalysis [12]. Although this explanation provided a plausible mechanism for changes in the catalytic activities of the mutants, no direct experimental evidence was available to support this hypothesis.
Therefore, in the current study, we used nuclear magnetic resonance (NMR) methods to further investigate the above proposition. NMR longitudinal (T1) relaxation measurements provide an efficient experimental method to elucidate the binding orientations of substrate within the active sites of P450 [13,14]. In general, NMR-derived T1 relaxation time is shortened in a distance-dependent manner when paramagnetic molecules, such as iron, are present [15,16]. Therefore, the distance of ligand protons from the heme of P450 can be estimated by calculating the difference of T1 relaxation times before and after P450 is bubbled with carbon monoxide and the T1 times of substrate protons closest to the heme iron will show more significant decreases than T1 times of those farther away [15,16]. We had previously reported the preferred binding orientations of phenacetin in CYP1A1 and 1A2 associated with isoform-selective metabolism using this method [17]. The results have confirmed the importance of residue 382 in CYP1A2-catalyzed oxidations and showed that a single residue substitution can dramatically affect enzymatic activity.
In the present work, we compared the distances between the protons of phenacetin and heme-iron in CYP1A2 wild type (WT) and the mutants to investigate the effects of single and multiple mutations of CYP1A2 on phenacetin O-dealkylation. In addition, a molecular model was provided to illustrate the different binding orientations of phenacetin in the active sites of CYP1A2 WT and the mutants using the distance constraints derived from T1 NMR experiments.

2. Results

2.1. Purification of CYP1A2 Enzymes

The overall yields of purified enzymes were about 25–50%, similar to those reported previously [10,11,12]. The purity of CYP1A2 enzymes was verified by sodium dodecyl sulfate polyacrylamide gel electrophoresis (SDS-PAGE) and Western blots, which indicated that the proteins were at least 95% pure. The ultraviolet/visible (UV/Vis) spectra of the purified enzymes were typical of P450s purified mainly in the low spin form, while the spectra of the Fe2+-CO complexes exhibited the characteristic peak at 450 nm, indicative of little or no P420 formation. The holoenzyme content of the enzymes was 40–60%, similarly as observed previously in our laboratory.

2.2. Interactions of Phenacetin with CYP1A2 Enzymes

The chemical structure along with the proton numbering scheme used for phenacetin is shown in Figure 1. The P450 absorbance spectrum is sensitive to ligand binding and solution conditions, and is composed of overlapping spectra of low spin (S = 1/2) and high spin (S = 5/2) states of the heme [18]. The addition of different concentrations of phenacetin to purified CYP1A2 WT and mutants led to an increase of their Soret peak at 390 nm and a decrease of a band at 417 nm, as shown in Figure 2A. Thus, for all enzymes, we observed a typical Type I spectrum, which indicates a change of the spin state of the heme iron from low spin (S = 1/2) to high spin (S = 5/2) due to the binding of the substrate to the protein in close proximity of heme [19]. The dependence of UV/Vis absorption changes on the concentration of the substrate was used to calculate the spectral binding constants, Ks, for the P450-phenacetin complexes at 27 °C. Table 1 presents the Ks values for phenacetin binding with CYP1A2 WT and the mutants. The Ks values for N312L, L382V, L382V/N312L mutants were lower than that of the WT enzyme (Table 1, Figure 2B).

2.3. Determination of Spin State in CYP1A2 Enzymes

The UV/Vis spectra (wavelength 320–500 nm) of CYP1A2 WT and the mutants can be deconvoluted into a low-spin component (~416–420 nm), a high-spin component (~390–405 nm), and δ bands (~360 nm). The concentrations of phenacetin used in the determination of spin state were identical to those used in NMR T1 studies. The percentages of low and high spin calculated from the Soret bands of CYP1A2 WT and the mutants in the absence and presence of substrate are shown in Table 2. In the absence of substrate, CYP1A2 WT and the mutants, L312N, L382V, and L382V/N312L, existed primarily in the low spin state (93–97% low spin). The addition of phenacetin increased the percentage of high-spin enzyme approximately 2- to 3-fold. It is critical to know these relative percentages for interpreting NMR data because the increasing percentage of high-spin state results in paramagnetic broadening and shifting [20,21].
To verify fast-exchange conditions, the temperature dependence of the T1 relaxation of the substrate protons was used. The double reciprocal plots of T1p versus temperature for CYP1A2 WT, L312N, L382V, and L382V/N312L mutants are shown in Figure 3. The positive slopes in the double reciprocal plot of T1p versus temperature indicate that the fast exchange condition is being met. Double reciprocal plots of T1,Fe3+ or T1,Fe2+-CO versus temperature also have positive slopes (data not shown).

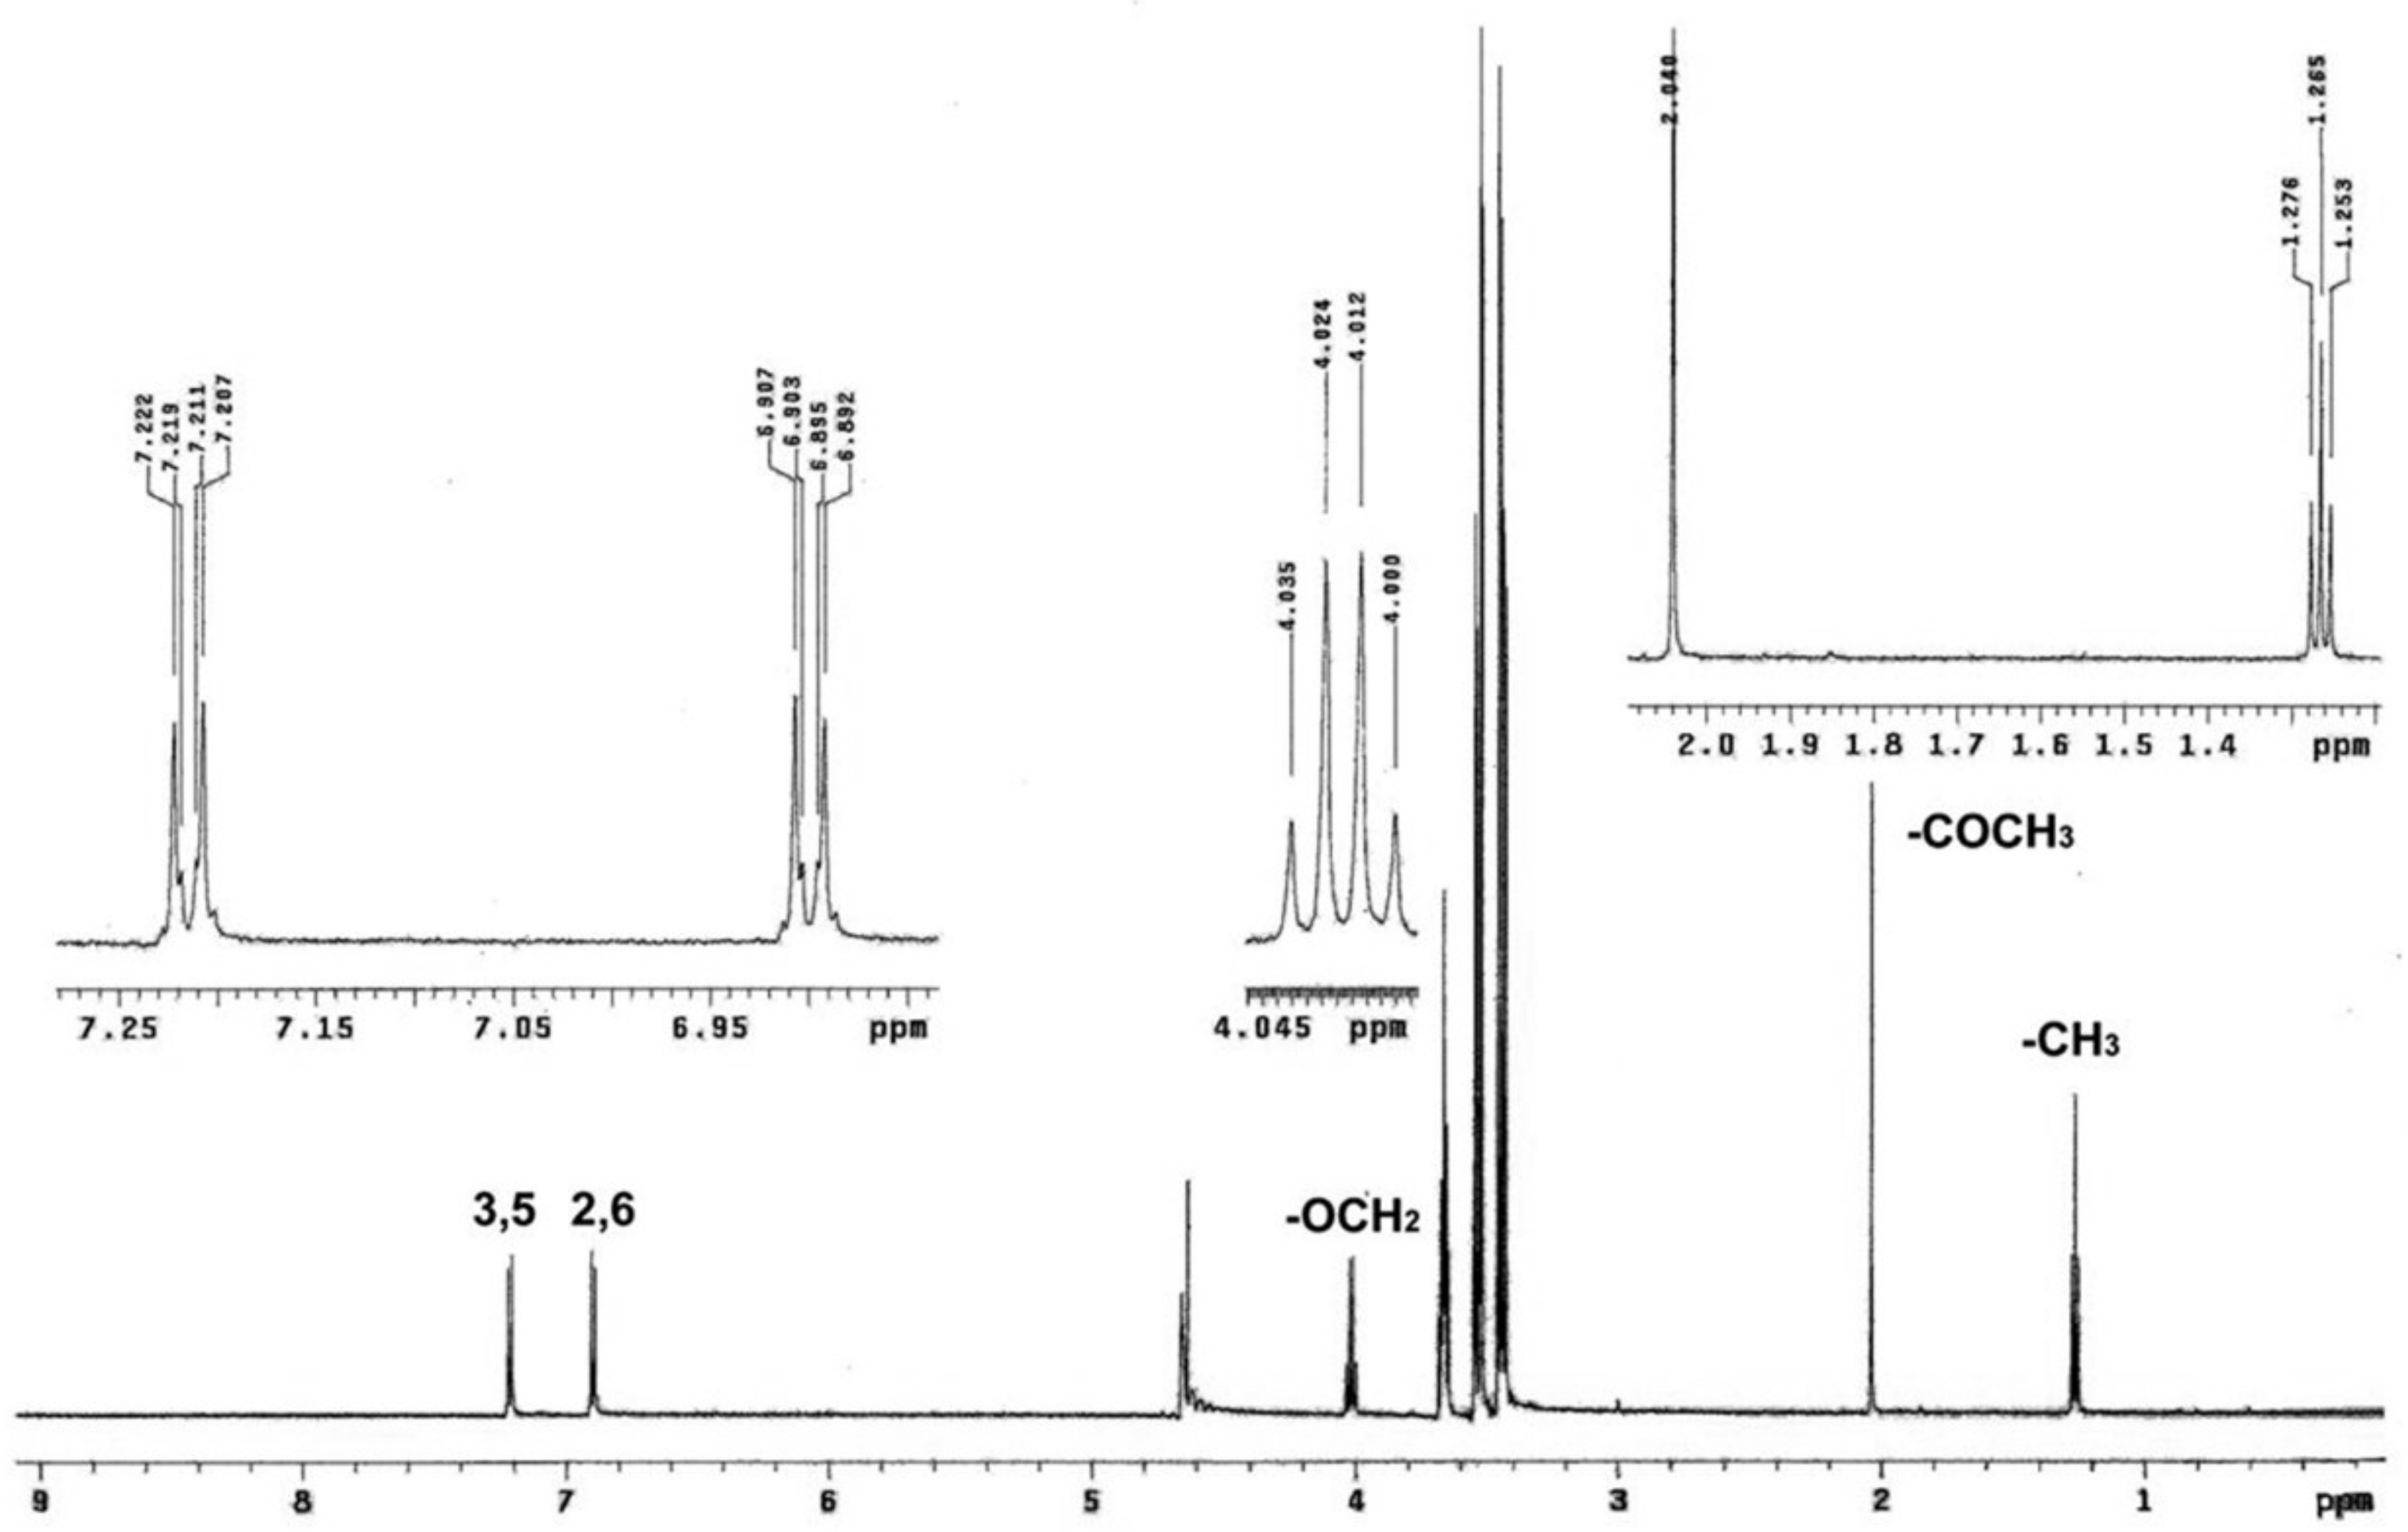
2.4. Nuclear Magnetic Resonance (NMR) T1 Experiments

The 1H NMR spectrum of phenacetin consists of five well-resolved signals (one NMR peak, one triplet, one quadruplet, and two doublets) and some additional peaks reflecting contamination (Figure 4). From the splitting and the relative area of the peaks, one doublet centered at 7.21 ppm was assigned to the protons at positions 3 and 5 on the phenyl ring, while the other doublet with the same peak area but centered at 6.90 ppm was assigned to the protons at positions 2 and 6 on the phenyl ring. In contrast, –COCH3, –CH3 and OCH2– groups of phenacetin formed a singlet (centered at 2.04 ppm), a triplet (centered at 1.26 ppm), and a quadruplet (centered at 4.02 ppm) in the NMR spectrum, respectively. The average distances between the substrate protons and the heme iron for phenacetin with each of the enzymes, CYP1A2 WT, N312L, L382V, and L382V/N312L mutants, were obtained from T1 relaxation experiments (Table 3). T1 relaxation times decreased for all protons of phenacetin in the presence of enzymes compared to those measured in the presence of enzymes and carbon monoxide. T1 relaxation times showed a substantial difference between the samples with and without carbon monoxide. All the aromatic protons of phenacetin are nearly equidistant from the heme iron (6.34–8.03 Å). However, the distance between the proton of the –OCH2– group, which is abstracted during phenacetin oxidation, and the heme iron is much shorter in the L382V mutant (5.93 Å) and L382V/N312L mutant (5.96 Å) than that in WT (6.55 Å). In contrast, the distance between the proton of the –OCH2– group and the heme iron is longer in the N312L mutant (7.84 Å) than that in WT, consistent with previous molecular modeling results. In addition, the distances obtained by averaging the 20 lowest energy conformations of the phenacetin are also presented in Table 3. The distances between the protons of phenacetin and heme iron obtained from molecular modeling were about 1 Å longer, but still correlate well with T1 data.

2.5. Position of Phenacetin Relative to Heme in CYP1A2 Wild Type (WT) and Mutants

3D models consisting of the substrate phenacetin and CYP1A2 WT and various mutants that correspond to the NMR-derived proton-heme distances listed in Table 3 were constructed. The enzyme-substrate interaction energies for various substrate conformations were never higher than 5 kcal/mol. Figure 5a displays the binding orientations of phenacetin within the active sites of CYP1A2 WT and the L382V mutant. Additionally, in order to clearly identify each atom in phenacetin and the distances between protons of phenacetin and heme iron, the cartoon diagram is presented as Figure 5b. As shown in the figures, phenacetin displays similar binding orientations in both CYP1A2 WT and L382V mutant. However, based on the final position after the restraint molecular dynamics (MD) run, the protons of –OCH2 group of phenacetin, the site of metabolism, are closer to the heme-iron in the L382V mutant (6.95 Å) than the WT (8.01 Å).

3. Discussion

The objective of the present study was to explore the structural basis for changes in CYP1A2 activity upon the substitution of residue Leu382 using phenacetin as a probe. Previous work has demonstrated that all CYP1A2 mutants that contained the L382V substitution (L382V, L382V/T223N, L382V/N312L, L382V/T223N/N312L, L382V/T124S/N312) displayed much higher phenacetin oxidation activities than CYP1A2 WT, with Kcat values 3-fold higher, in contrast to other mutants (T124S, T223N, V227G, and N312L), for which Kcat decreased [12]. Further stoichiometry studies suggested that the CYP1A2 L382V mutants were more efficient in coupling NADPH to the product, and displayed less uncoupling to water, leading to the increased overall coupling efficiency of the enzyme [12]. Molecular modeling indicated that L382V substitution increased the volume of the active site near the heme and allowed phenacetin to move closer to the heme, which promotes hydrogen abstraction [12].
In order to provide direct evidence to support our previous findings, we investigated the orientation of substrate phenacetin in the active site of CYP1A2 WT and its mutants using NMR T1 relaxation measurements. This allowed us to calculate the distance between phenacetin protons and heme iron in various CYP1A2 enzymes. Except for the –OCH2– group, the substrate proton-heme iron distances for CYP1A2 WT, L382V, N312L, and L382V/N312L were very similar, ranging from 6.1 to 8.2 Å. These values are similar to the distances between hydroxylation sites and the heme iron reported for other P450 enzymes [15,17,22,23,24,25,26]. The distance between the protons of the –OCH2– group and heme iron in CYP1A2 N312L was about 7.84 Å, which is much longer than that in CYP1A2 WT (6.55 Å). In contrast, the distances in CYP1A2 L382V and L382V/N312L were 5.93 Å and 5.96 Å, respectively, much closer to the heme iron than those of the WT enzyme (Table 3). Interestingly, the same distances obtained from molecular modeling were 1–2 Å longer than those from the NMR data. The reason, in part, might be because the distances calculated from MD are based on a very small subset of orientations, while the distances calculated from the NMR T1 data represent a large number of possible orientations. However, these values should be very similar if MD run time is sufficiently extended.
Previously, we had successfully used the T1 NMR methodology to estimate the distances between the –OCH2– protons of the ethoxy group (site of phenacetin O-deethylation) and the heme iron in both CYP1A1 and CYP1A2 WTs [17]. The calculated distances were shorter in CYP1A2 WT than in CYP1A1 WT, indicating a more efficient metabolism of phenacetin by CYP1A2. Taken together, our findings from the previous and current studies on CYP1A2 WT and the mutants provide a rationale for the efficient phenacetin O-dealkylation by CYP1A2 WT and 1A2 mutants containing the substitution of Leu-382 with a small Val. In contrast, CYP1A1 and CYP1A2 N312L metabolized phenacetin with a very low efficiency, as shown in our previous studies [12].
The NMR T1 relaxation measurements were also used to examine the orientation of other substrates within the active site of human CYP1A2. Regal and Nelson investigated the positioning of caffeine in CYP1A2 and found that the averaged distance for the N3 group was shorter than those for N1 and N7 groups [15], consistent with the known preference of the enzyme, which oxidizes caffeine at the N3 position [27,28]. However, Regal and Nelson calculated the relevant distances using an equation, r = C [ T 1 P α m f ( τ c ) ] 1 / 6 , which did not take into account the fact that the spin state may change upon substrate binding and, therefore, the value of C may be incorrect [29]. Thus, the authors had to provide a range of distances, representing the change in the spin state of CYP1A2 ranging from 100% low spin to 100% high spin. The modified equation, r = [ 9.78 × 10 16   T 1 P α m S ( S + 1 ) τ c ] 1 / 6 , used in the present work, shown as Equation (2), takes into the account the constant changes of spin state, and has been widely used to calculate the distances in NMR T1 measurement in more recent studies [12,29,30].
A bias in the calculations leading to an overestimation of the distances can be introduced if the exchange between the free and bound ligands is not fast enough to neglect the residence time for the protons near the paramagnetic site [31]. To test the fast exchange condition, three different temperatures: 283, 298, and 310 K were adapted to perform T1 relaxation measurements. The slopes 1/T1,Fe3+, 1/T1,Fe2+-CO, and 1/T1p versus 1/temperature are all positive and show a good linear relationship (R2 > 0.95) (Figure 3), which suggests that fast exchange exists.
NMR T1 relaxation measurements have been often used for investigating substrate orientation in various P450s. However, it has not been applied as extensively as other spectroscopic techniques due to the requirements for large amounts of highly purified enzymes and sufficiently water-soluble substrates.
The interaction between phenacetin and CYP1A2 WT and the mutants resulted in a type I binding spectrum (Figure 2a for CYP1A2 L382V, other data not shown), which indicates the interaction is a competitive binding, in contrast to ligation of the inhibitor to the heme iron (type II binding) or the formation of a metabolite inhibitory complex (MIC) by mechanism-based inhibitors (type III binding) [32]. Although local single or multiple mutation of CYP1A2 did not change the interaction type of substrate with enzyme, the binding capability altered significantly upon mutation. Ks values indicate that phenacetin binds much tighter to CYP1A2 L382V and L382V/N312L than in the WT and N312L (Table 1), as well as CYP1A1 [17]. This may indicate that phenacetin, and especially the oxidation site, moves much closer to the heme iron in CYP1A2 L382V and L382V/N312L to form a more stable complex.
Similar to previous findings with CYP1A1 WT and CYP1A2 WT [17], the ligand-free CYP1A2 WT and the mutants exhibited a high percentage of low spin state (90–95%), indicating that a water molecule forms a sixth axial ligand of the Fe3+ in the substrate-free form. The percent of high spin P450 was substantially increased during co-incubation with the substrate phenacetin (Table 2) due to the displacement of the water ligand by the substrate. Although the percentages of high spin for CYP1A2 WT (17%), L382V (16%), and L382V/N312L (11%) were higher than for N312L (8%), the relationship between binding affinity and the ability to increase the percentage of high spin state of the enzyme is still unclear.
In summary, the substitution of Leu382 with a small Val in CYP1A2 led to the substrate phenacetin moving closer to the heme, with the site of metabolism closer to the heme iron than in the WT enzyme. Spectral binding studies revealed that the mutation of L382V significantly increased the affinity of the mutants for phenacetin. These results demonstrate that both the distance between protons of phenacetin and the heme iron, as well as the change in substrate binding affinity are likely responsible for altering the catalytic efficiency of the enzyme, which is consistent with our previous findings regarding enzyme kinetics and stoichiometry, as well as predictions from molecular modeling studies [12].

4. Materials and Methods

4.1. Materials

Phenacetin, dilauroyl-l-3-phosphatidyl choline (DLPC), sodium dithionite, polyvinyl pyrolidone (PVP) and D2O were purchased from Sigma-Aldrich (St. Louis, MO, USA). Potassium phosphate and EDTA were purchased from Fisher Scientific (Pittsburgh, PA, USA). Emulgen® and Chaps® were obtained from the Chemical Division of the KAO Corporation (Tokyo, Japan) and EMD Biosciences (Lajolla, CA, USA), respectively. Deuterium oxide (D2O, 99.9%) was obtained from Cambridge Isotope Laboratory (Andover, MA, USA). Centricon 10 kDa MW cut-off filters were purchased from Millipore Corporation (Billerica, MA, USA). Carbon monoxide was obtained from Mountain State AirGas (Morgantown, WV, USA). All other chemicals were of analytical grade and were purchased from standard commercial sources.

4.2. Protein Expression and Purification

CYP1A2 WT, two single mutants N312L and L382V, and a multiple mutant L382V/N312L, were expressed and purified according to previously established methods [10,11,12]. Briefly, the His-tag-containing CYP1A2 WT and mutants were expressed in Escherichia coli DH5α cells, and the enzymes were purified by affinity chromatography with Ni-NTA agarose. During purification, 5 mM caffeine was added to all the buffers to stabilize the enzyme. Subsequently, caffeine was removed completely from the preparation at the ultrafiltration stage [12]. Rat P450 reductase was expressed and purified as described earlier [10,33]. The purified enzyme fractions were aliquoted and stored at −80 °C for further use.

4.3. Binding Constant Determination

The interactions between the substrate phenacetin and purified CYP1A2 WT and mutants were studied by difference visible spectroscopy [34] on a Beckman DU640 spectrophotometer (Beckman Instruments Inc., Fullerton, CA, USA). Solutions (800 µL) contained 0.5 µM CYP1A2 enzymes in 100 mM phosphate buffer (20% glycerol and 0.1 mM EDTA, pH 7.4). The spectrophotometer was set to record spectra from 350 to 500 nm. The temperature was held constant at 27 °C. Two microliters of different concentrations of solutions of phenacetin in methanol were added to the sample cuvette, and the same volume of methanol was added to the reference, and UV/Vis spectra were then recorded. The spectral binding constant (Ks) was derived from fitting of the data to Equation (1) using GraphPad Prism 7 (GraphPad Software Inc., La Jolla, CA, USA):
Δ A = B max × [ S ] K s + [ S ]
where ΔA represents absorbance difference, Bmax is the maximum absorbance difference extrapolated to infinite ligand concentration, and [S] is the substrate concentration.

4.4. Spin State Determination

The percentages of high and low spin in CYP1A2 enzymes upon binding of phenacetin were determined as previously described [32]. Spectral titrations with phenacetin in CYP1A2 enzymes were performed by spectral scanning between 320 and 500 nm, with substrate concentrations identical to those in NMR studies. By using multiple Gaussian curve fitting with the OriginPro v8 package (OriginLab Corporation, Northampton, MA, USA), absorbance spectra were deconvoluted into three components: a low-spin component, a high-spin component, and the broad δ-band. The three components (δ-bands, low spin, and high spin) were used to fit data for phenacetin with CYP1A2 enzymes and estimate percentages of low spin.

4.5. Enzyme Preparation for NMR

The procedure of sample preparation and incubation has been described in detail previously [17]. Briefly, 1% (w/v) PVP in 100 mM deuterated phosphate buffer was prepared and applied to the surface of 10 kDa MW cutoff Centricon filter. The enzyme preparation was exchanged and concentrated against 100 mM deuterated phosphate buffer over the Centricon filter by centrifugation (1000× g, 4 °C) for 3~4 times. The final enzyme preparation contained less than 1% glycerol and ~20 μM CYP1A2.

4.6. NMR Spectroscopy

NMR T1 relaxation studies were carried out on a Varian Inova NMR Spectrometer (Varian Inc, Palo Alto, CA, USA) operating at 600 MHz, internally locked on the deuterium signal of the solvent, deuterium oxide (D2O), as described previously [17,29]. Signals were referenced internally to hydrogen deuterium oxide (HDO) peak at 4.8 ppm. A standard inversion recovery sequence (d1-180°-d2-90°) was utilized, along with presaturation of the residual HDO signal. The 90° pulse width was calibrated on each sample. The preacquisition delay d1 was set to 10 × T1 (40 s) of the longest relaxation time. The NMR spectra associated with at least 10 d2 values were needed. Line broadening and the Gaussian fitting function were used for precise calculations of T1 values for the protons. The value of the longitudinal relaxation time was obtained from the Varian software by using a nonlinear least-square fitting of the peak height as a function of the delay d2. T1 values were calculated from the substrate solutions without the enzyme, and after the addition of the enzyme. The T1 (ferrous-CO) of the ligand protons were measured after in situ conversion of the enzyme to its diamagnetic ferrous carbonyl complex (Fe2+-CO) by bubbling carbon monoxide for 15 min, followed by adding ~1 mg of sodium dithionite. The sample was allowed to equilibrate for 30 min before T1 (ferrous-CO) measurement. The final T1 (ferrous-CO) measurement of the ligands in presence of the Fe2+-CO complex and the T1 of the enzyme-free ligand were nearly identical, which indicates very little paramagnetic contribution due to impurities. The integrity of the enzyme was assayed by measuring the UV/Vis spectra of samples maintained under similar conditions. No significant P420 formation was observed throughout the experiment.
To validate the fast-exchange conditions, the temperature dependence of T1P was studied at three different temperatures (283, 298, and 310 K). Experiments involving enzyme titration studies with CYP1A2 WT and the mutants were performed with phenacetin as a substrate. Concentrated enzyme was added to the substrate in small increments, and the T1 measurements were performed after each addition.

4.7. Proton-Heme Iron Distance Calculations

A more precise method for the distance (r) calculation using spin-state data was adopted, described in details earlier [17,29]. Briefly, the calculation for distance can be written as Equation (2):
r = [ 9.78 × 10 16   T 1 P α m S ( S + 1 ) τ c ] 1 / 6
The distance is given by r. The tumbling coefficient τc, calculated by measuring T1P at several magnetic field strengths, represents the correlation time of the dipolar interactions of the protein in solution [16]. An estimate for τc of CYP1A2 is 3.38 × 10⁻¹⁰ s−1, as reported previously [15]. T1P is the portion of T1 due to paramagnetic affects alone and is given by Equation (3):
1 T 1 P = 1 T 1 , Fe 3 + 1 T 1 , Fe 2 + CO
assuming that all of the diamagnetic contribution is represented by 1/T1,Fe2+-CO [15]. This assumption appears to be generally valid when used in many similar studies [25,35]. The parameter αm, the fractional binding coefficient, is obtained by the equation α m = [ P 450 ] K S + [ S ]   under conditions of fast exchange when only one substrate is present [15]. Ks values determined from visible spectroscopy were utilized for the distance calculations rather than KD determined by NMR for phenacetin because of the equal or slight difference between Ks and KD based on Michaelis–Menten kinetics [15]. The S(S + 1) term was simplified by Equation (4) [29].
S ( S + 1 ) = 8.75 f H S + 0.75 f L S
where fHS and fLS refer to the fractions of the high spin and low spin iron, respectively [29].

4.8. Molecular Modeling: General

All molecular modeling was conducted by Insight II software (Accelrys, San Diego, CA, USA) on a Silicon Graphics Octane workstation. Phenacetin was constructed and minimized using the Insight II/Builder module. Energy minimization and MD simulations were performed by the Insight II/Discover module with the consistent valence force field (CVFF). The parameters for heme containing Fe3+ had been described earlier [17,36,37].

4.9. Substrate Docking with Distance Restraints

Phenacetin as substrate was initially placed into the active sites of both CYP1A2 WT and the mutants manually to avoid steric overlaps. Automated docking of ligands was then conducted by the Insight II/Affinity module using default parameters, as previously described [10,12,17,38], except that the ferric form of the heme was used. After 20 positions (or poses) were obtained, the most energetically favorable complex was chosen and subjected to MD simulations and minimization with NMR-based distance restraints imposed. The protein backbone was tethered to its initial coordinates by a harmonic restraint force to avoid possible protein deformation resulting from restraint forces. Substrate protons were guided to NMR-derived distances from the heme iron by applying gradually strengthening harmonic restraint ( k = 2 32   kcal · mol 1 · Å 1 ) throughout 5 ps of MD. The non-bond cutoff parameter was 15 Å, and a screened Coulomb potential with a distance-dependent dielectric was used to simulate an aqueous solvent environment. After MD simulations, the final frame of the trajectory was minimized to convergence while the distance restraints were maintained during the minimization.

Author Contributions

Both authors conceived and designed the experiments; Q.H. performed the experiments and analyzed the data; both authors wrote the paper.

Acknowledgments

We thank Novruz G. Akhmedov for excellent technical support. This work was supported by the National Institutes of Health/National Institute of General Medical Sciences, Grant GM079724 (GDS).

Conflicts of Interest

The authors declare no conflict of interest.

Abbreviations

CYPCytochrome P450
WTWild Type
EDTAEthlenediaminetetraacetic Acid
1H NMRProton Nuclear Magnetic Resonance

References

  1. Guengerich, F.P. Mechanisms of cytochrome P450 substrate oxidation: Mini Review. J. Biochem. Mol. Toxicol. 2007, 21, 163–168. [Google Scholar] [CrossRef] [PubMed]
  2. Isin, E.M.; Guengerich, F.P. Substrate binding to cytochromes P450. Anal. Bioanal. Chem. 2008, 392, 1019–1030. [Google Scholar] [CrossRef] [PubMed]
  3. Zhou, S.F.; Chan, E.; Zhou, Z.W.; Xue, C.C.; Lai, X.; Duan, W. Insights into the structure, function, and regulation of human cytochrome P450 1A2. Curr. Drug Metab. 2009, 10, 1–17. [Google Scholar] [CrossRef]
  4. Distlerath, L.M.; Reilly, P.E.; Martin, M.V.; Davis, G.G.; Wilkinson, G.R.; Guengerich, F.P. Purification and characterization of the human liver cytochromes P-450 involved in debrisoquine 4-hydroxylation and phenacetin O-deethylation, two prototypes for genetic polymorphism in oxidative drug metabolism. J. Biol. Chem. 1985, 260, 9057–9067. [Google Scholar] [PubMed]
  5. Yuan, R.; Madani, S.; Wei, X.X.; Reynolds, K.; Huang, S.M. Evaluation of cytochrome P450 probe substrates commonly used by the pharmaceutical industry to study in vitro drug interactions. Drug Metab. Dispos. 2002, 30, 1311–1319. [Google Scholar] [CrossRef] [PubMed]
  6. Sansen, S.; Yano, J.K.; Reynald, R.L.; Schoch, G.A.; Griffin, K.J.; Stout, C.D.; Johnson, E.F. Adaptations for the oxidation of polycyclic aromatic hydrocarbons exhibited by the structure of human P450 1A2. J. Biol. Chem. 2007, 282, 14348–14355. [Google Scholar] [CrossRef] [PubMed]
  7. Yano, J.K.; Hsu, M.H.; Griffin, K.J.; Stout, C.D.; Johnson, E.F. Structures of human microsomal cytochrome P450 2A6 complexed with coumarin and methoxsalen. Nat. Struct. Mol. Biol. 2005, 12, 822–823. [Google Scholar] [CrossRef] [PubMed]
  8. Schoch, G.A.; Yano, J.K.; Wester, M.R.; Griffin, K.J.; Stout, C.D.; Johnson, E.F. Structure of human microsomal cytochrome P450 2C8. Evidence for a peripheral fatty acid binding site. J. Biol. Chem. 2004, 279, 9497–9503. [Google Scholar] [CrossRef] [PubMed]
  9. Williams, P.A.; Cosme, J.; Vinkovic, D.M.; Ward, A.; Angove, H.C.; Day, P.J.; Vonrhein, C.; Tickle, I.J.; Jhoti, H. Crystal structures of human cytochrome P450 3A4 bound to metyrapone and progesterone. Science 2004, 305, 683–686. [Google Scholar] [CrossRef] [PubMed]
  10. Liu, J.; Ericksen, S.S.; Sivaneri, M.; Besspiata, D.; Fisher, C.W.; Szklarz, G.D. The effect of reciprocal active site mutations in human cytochromes P450 1A1 and 1A2 on alkoxyresorufin metabolism. Arch. Biochem. Biophys. 2004, 424, 33–43. [Google Scholar] [CrossRef] [PubMed]
  11. Tu, Y.; Deshmukh, R.; Sivaneri, M.; Szklarz, G.D. Application of molecular modeling for prediction of substrate specificity in cytochrome P450 1A2 mutants. Drug Metab. Dispos. 2008, 36, 2371–2380. [Google Scholar] [CrossRef] [PubMed]
  12. Huang, Q.; Szklarz, G.D. Significant increase in phenacetin oxidation upon Leu-382→Val substitution in human cytochrome P450 1A2. Drug Metab. Dispos. 2010, 38, 1039–1045. [Google Scholar] [CrossRef] [PubMed]
  13. Gay, S.C.; Roberts, A.G.; Halpert, J.R. Structural features of cytochromes P450 and ligands that affect drug metabolism as revealed by X-ray crystallography and NMR. Future Med. Chem. 2010, 2, 1451–1468. [Google Scholar] [CrossRef] [PubMed]
  14. Mak, P.J.; Denisov, I.G. Spectroscopic studies of the cytochrome P450 reaction mechanisms. Biochim. Biophys. Acta 2018, 1866, 178–204. [Google Scholar] [CrossRef] [PubMed]
  15. Regal, K.A.; Nelson, S.D. Orientation of caffeine within the active site of human cytochrome P450 1A2 based on NMR longitudinal (T1) relaxation measurements. Arch. Biochem. Biophys. 2000, 384, 47–58. [Google Scholar] [CrossRef] [PubMed]
  16. Mildvan, A.S.; Gupta, R.K. Nuclear relaxation measurements of the geometry of enzyme-bound substrates and analogs. Methods Enzymol. 1978, 49, 322–359. [Google Scholar] [PubMed]
  17. Huang, Q.; Deshmukh, R.S.; Ericksen, S.S.; Tu, Y.; Szklarz, G.D. Preferred binding orientations of phenacetin in CYP 1A1 and 1A2 are associated with isoform-selective metabolism. Drug Metab. Dispos. 2012, 40, 2324–2331. [Google Scholar] [CrossRef] [PubMed]
  18. Roberts, A.G.; Sjögren, S.E.; Fomina, N.; Vu, K.T.; Almutairi, A.; Halpert, J.R. NMR-derived models of amidopyrine and its metabolites in complexes with rabbit cytochrome P450 2B4 reveal a structural mechanism of sequential N-dealkylation. Biochemistry 2011, 50, 2123–2134. [Google Scholar] [CrossRef] [PubMed]
  19. Dawson, J.H. Probing structure-function relations in heme-containing oxygenases and peroxidases. Science 1988, 240, 433–439. [Google Scholar] [CrossRef] [PubMed]
  20. Bertini, I.; Fragai, M.; Luchinat, C.; Parigi, G. Solvent (1)H NMRD study of hexaaquochromium(III): inferences on hydration and electron relaxation. Inorg. Chem. 2001, 40, 4030–4035. [Google Scholar] [CrossRef] [PubMed]
  21. Pintacuda, G.; Hohenthanner, K.; Otting, G.; Müller, N. Angular dependence of dipole-dipole-Curie-spin cross-correlation effects in high-spin and low-spin paramagnetic myoglobin. J. Biomol. NMR 2003, 27, 115–132. [Google Scholar] [CrossRef] [PubMed]
  22. Modi, S.; Primrose, W.U.; Boyle, J.M.; Gibson, C.F.; Lian, L.Y.; Roberts, G.C. NMR studies of substrate binding to cytochrome P450 BM3: Comparisons to cytochrome P450 cam. Biochemistry 1995, 34, 8982–8988. [Google Scholar] [CrossRef] [PubMed]
  23. Modi, S.; Paine, M.J.; Sutcliffe, M.J.; Lian, L.Y.; Primrose, W.U.; Wolf, C.R.; Roberts, G.C. A model for human cytochrome P450 2D6 based on homology modeling and NMR studies of substrate binding. Biochemistry 1996, 35, 4540–4550. [Google Scholar] [CrossRef] [PubMed]
  24. Li, H.; Poulos, T.L. The structure of the cytochrome P450BM3 heam domain complexed with the fatty acid substrate, palmitoleic acid. Nat. Struct. Biol. 1997, 4, 140–146. [Google Scholar] [CrossRef] [PubMed]
  25. Poli-Scaife, S.; Attias, R.; Dansette, P.M.; Mansuy, D. The substrate binding site of human liver cytochrome P450 2C9: An NMR study. Biochemistry 1997, 36, 12672–12682. [Google Scholar] [CrossRef] [PubMed]
  26. Estrada, D.F. The cytochrome P450 24A1 interaction with adrenodoxin relies on multiple recognition sites that vary among species. J. Biol. Chem. 2018, 293, 4167–4179. [Google Scholar] [CrossRef] [PubMed]
  27. Lelo, A.; Miners, J.O.; Robson, R.A.; Birkett, D.J. Quantitative assessment of caffeine partial clearances in man. Br. J. Clin. Pharmacol. 1986, 22, 183–186. [Google Scholar] [CrossRef] [PubMed]
  28. Gu, L.; Gonzalez, F.J.; Kalow, W.; Tang, B.K. Biotransformation of caffeine, paraxanthine, theobromine and theophylline by cDNA-expressed human CYP1A2 and CYP2E1. Pharmacogenetics 1992, 2, 73–77. [Google Scholar] [CrossRef] [PubMed]
  29. Hummel, M.A.; Gannett, P.M.; Aguilar, J.S.; Tracy, T.S. Substrate proton to heme distances in CYP2C9 allelic variants and alterations by the heterotropic activator, dapsone. Arch. Biochem. Biophys. 2008, 475, 175–183. [Google Scholar] [CrossRef] [PubMed]
  30. Hummel, M.A.; Gannett, P.M.; Aguilar, J.S.; Tracy, T.S. Effector-mediated alteration of substrate orientation in cytochrome P450 2C9. Biochemistry 2004, 43, 7207–7214. [Google Scholar] [CrossRef] [PubMed]
  31. Schoch, G.A.; Attias, R.; Belghazi, M.; Dansette, P.M.; Werck-Reichhart, D. Engineering of a water-soluble plant cytochrome P450, CYP73A1, and NMR-based orientation of natural and alternate substrates in the active site. Plant Physiol. 2003, 133, 1198–1208. [Google Scholar] [CrossRef] [PubMed]
  32. Locuson, C.W.; Hutzler, J.M.; Tracy, T.S. Visible spectra of type II cytochrome P450-drug complexes: Evidence that “incomplete” heme coordination is common. Drug Metab. Dispos. 2007, 35, 614–622. [Google Scholar] [CrossRef] [PubMed]
  33. Liu, J.; Ericksen, S.S.; Besspiata, D.; Fisher, C.W.; Szklarz, G.D. Characterization of substrate binding to cytochrome P450 1A1 using molecular modeling and kinetic analyses: Case of residue 382. Drug Metab. Dispos. 2003, 31, 412–420. [Google Scholar] [CrossRef] [PubMed]
  34. Jefcoate, C.R. Measurement of substrate and inhibitor binding to microsomal cytochrome P-450 by optical-difference spectroscopy. Methods Enzymol. 1978, 52, 258–279. [Google Scholar] [PubMed]
  35. Paine, M.J.; Gilham, D.; Roberts, G.C.; Wolf, C.R. Functional high level expression of cytochrome P450 CYP2D6 using baculoviral expression systems. Arch. Biochem. Biophys. 1996, 328, 143–150. [Google Scholar] [CrossRef] [PubMed]
  36. Paulsen, M.D.; Ornstein, R.L. A 175-psec molecular dynamics simulation of camphorbound cytochrome P-450cam. Proteins 1991, 11, 184–204. [Google Scholar] [CrossRef] [PubMed]
  37. Paulsen, M.D.; Ornstein, R.L. Predicting the product specificity and coupling of cytochrome P450cam. J. Comput. Aided Mol. Des. 1992, 6, 449–460. [Google Scholar] [CrossRef] [PubMed]
  38. Ericksen, S.S.; Szklarz, G.D. Regiospecificity of human cytochrome P450 1A1-mediated oxidations: The role of steric effects. J. Biomol. Struct. Dyn. 2005, 23, 243–256. [Google Scholar] [CrossRef] [PubMed]
Figure 1. Structure of phenacetin with protons numbered as referenced in the text. Proton abstraction occurs at the –OCH2– group, which is the oxidation site.
Ijms 19 01580 g001
Figure 2. Phenacetin binding determined for CYP1A2 wild type (WT) and the mutants by ultraviolet/visible (UV/Vis) spectroscopy. (a) Spectral binding curves for phenacetin bound in CYP1A2 L382V. A type I spectrum is evident with a peak at ~390 nm and a trough at ~420 nm. CYP1A2 WT, N312L and L382V/N312L have similar UV/Vis binding spectra (not shown); (b) Binding curves for phenacetin in CYP1A2 WT and the L382V mutant and the KS values derived from fitting of the data to Equation (1).
Ijms 19 01580 g002
Figure 3. Temperature dependence of T1P of phenacetin protons in the presence of CYP1A2 WT (a), N312L (b), L382V (c), and L382V/N312L (d) mutants. Positive slopes indicate that the substrate bound in the active site is in fast exchange with the surroundings. ●, phenacetin protons H2/6; ○, H3/5; ▲, CH2; △, COCH3; ■, CH3.
Ijms 19 01580 g003
Figure 4. Nuclear magnetic resonance (NMR) spectrum of the protons of phenacetin obtained under conditions used for T1 measurements. The numbering scheme used is the same as shown in Figure 1.
Ijms 19 01580 g004
Figure 5. Binding of phenacetin in the active site of CYP1A2 WT and L382V. (a) A comparison of phenacetin binding orientations in CYP1A2 WT (substrate shown in yellow), and in CYP1A2 L382V (substrate shown in green). The enzymes were superimposed using the protein backbone as a basis; for clarity, the mutant enzyme is not displayed; (b) Cartoon representation of (a) to clearly show the distances of protons to heme iron. The heme is labeled and shown as a circle and a line, the distances of protons of phenacetin to heme iron are listed and represented by dotted lines.
Ijms 19 01580 g005
Table 1. Spectral binding constants for phenacetin with purified CYP1A2 WT and the mutants at 27 °C. The two cuvettes contained 0.5 μM CYP1A2 WT or the mutant in 0.1 M phosphate buffer, pH 7.4, with 20% glycerol. Difference spectra were obtained after the addition of increasing concentrations of substrate to the sample cuvette.
EnzymeSpectrum Type ( λ m a x λ m i n )Ks
(nm)(μM)
CYP1A2 WTI (390–420)17.1 ± 0.6
CYP1A2 N312LI (390–420)10.2 ± 0.4
CYP1A2 L382VI (390–420)0.7 ± 0.1
CYP1A2 L382V/N312LI (390–420)3.5 ± 0.2
Table 2. Percentages of low spin and high spin in CYP1A2 WT and the mutants in the absence and the presence of phenacetin at 27 °C.
Enzyme (+Substrate)Low SpinHigh Spin
%
CYP1A2 WT (no substrate)9010
  +Phenacetin7327
CYP1A2 N312L (no substrate)946
  +Phenacetin8614
CYP1A2 L382V (no substrate)955
  +Phenacetin7921
CYP1A2 L382V/N312L (no substrate)946
  +Phenacetin8317
Table 3. T1 relaxation rate-estimated distances of phenacetin protons from the heme iron of CYP1A2 WT and the mutants. Standard errors (SEs) for measurements are shown in parentheses. Errors in the T1 values were those reported by the fitting routine. Errors in the reported distances (r) were determined by propagation of error from the T1 calculation. Generally, the error is <10%.
Proton aCYP1A2 WT bCYP1A2 L382V c
T1,Fe3+T1,Fe2+-COr fR gT1,Fe3+T1,Fe2+-COr fR g
Å Å
2,62.22 (0.11)2.78 (0.05)6.76 (0.34)8.252.28 (0.11)3.06 (0.04)6.34 (0.31)7.96
3.52.02 (0.04)2.50 (0.01)6.72 (0.43)8.322.39 (0.22)3.21 (0.08)6.39 (0.28)7.87
–OCH21.54 (0.15)1.85 (0.18)6.55 (0.87)8.012.43 (0.18)4.10 (0.07)5.93 (0.31)6.95
–COCH31.53 (0.07)1.62 (0.06)7.85 (0.81)9.441.64 (0.13)1.87 (0.11)6.79 (0.71)8.05
–CH31.33 (0.07)1.53 (0.06)6.69 (0.45)8.642.03 (0.13)2.82 (0.11)6.13 (0.89)7.58
Proton aCYP1A2 N312L dCYP1A2 L382V/N312Le
T1,Fe3+T1,Fe2+-COR f (Å)R g(Å)T1,Fe3+T1,Fe2+-COr f (Å)R g (Å)
Å Å
2,62.32 (0.10)2.45 (0.10)8.03 (0.42)9.112.43 (0.07)3.00 (0.06)6.72 (0.31)7.28
3.51.94 (0.09)2.04 (0.10)7.94 (0.43)9.382.95 (0.09)3.70 (0.11)6.87 (0.47)7.25
–OCH21.62 (0.04)1.69 (0.04)7.84 (0.77)8.671.98 (0.12)2.90 (0.09)5.96 (0.35)7.24
–COCH31.54 (0.12)1.60 (0.11)8.19 (1.12)9.342.12 (0.14)2.59 (0.12)6.62 (0.15)8.01
–CH31.87 (0.12)1.97 (0.07)7.83 (0.52)8.942.23 (0.09)2.61 (0.11)6.92 (0.34)7.47
a See Figure 1 for the numbering scheme of the protons for phenacetin; b [CYP1A2 WT] = 0.017 μM, [phenacetin] = 171 μM, KS (CYP1A2 WT) = 17.1 μM; c [CYP1A2 L382V] = 0.007 μM, [phenacetin] = 7 μM, KS (CYP1A2 L382V) = 0.7 μM; d [CYP1A2 N312L] = 0.011 μM, [phenacetin] = 102 μM, KS (CYP1A2 N312L) = 10.2 μM; e [CYP1A2 L382V/N312L] = 0.004 μM, [phenacetin] = 35 μM, KS (CYP1A2 L382V/N312L) = 3.5 μM; f Values were calculated by r = [ 9.78 * 10 16   T 1 P α m S ( S + 1 ) τ c ] 1 / 6 ; g Values were obtained by averaging the 20 lowest-energy conformations selected by the docking program (See molecular dynamics (MD) Docking with Distance Restraints).

