Review

Prioritization of Variants Detected by Next Generation Sequencing According to the Mutation Tolerance and Mutational Architecture of the Corresponding Genes

Unit of Diagnosis and Treatment of Congenital Metabolic Diseases, Department of Pediatrics, Hospital Clínico Universitario de Santiago de Compostela, 15706 Santiago de Compostela, Spain
*
Author to whom correspondence should be addressed.
Int. J. Mol. Sci. 2018, 19(6), 1584; https://doi.org/10.3390/ijms19061584
Submission received: 3 April 2018 / Revised: 9 May 2018 / Accepted: 23 May 2018 / Published: 27 May 2018
(This article belongs to the Special Issue Rare Diseases: Molecular Mechanisms and Therapeutic Strategies)

Abstract

:
The biggest challenge geneticists face when applying next-generation sequencing technology to the diagnosis of rare diseases is determining which rare variants, from the dozens or hundreds detected, are potentially implicated in the patient’s phenotype. Thus, variant prioritization is an essential step in the process of rare disease diagnosis. In addition to conducting the usual in-silico analyses to predict variant pathogenicity (based on nucleotide/amino-acid conservation and the differences between the physicochemical features of the amino-acid change), three important concepts should be borne in mind. The first is the “mutation tolerance” of the genes in which variants are located. This describes the susceptibility of a given gene to any functional mutation and depends on the strength of purifying selection acting against it. The second is the “mutational architecture” of each gene. This describes the type and location of mutations previously identified in the gene, and their association with different phenotypes or degrees of severity. The third is the mode of inheritance (inherited vs. de novo) of the variants detected. Here, we discuss the importance of each of these concepts for variant prioritization in the diagnosis of rare diseases. Using real data, we show how genes, rather than variants, can be prioritized by calculating a gene-specific mutation tolerance score. We also illustrate the influence of mutational architecture on variant prioritization using five paradigmatic examples. Finally, we discuss the importance of familial variant analysis as final step in variant prioritization.

1. Introduction

The growing use of next-generation sequencing (NGS) technology in large human populations has revealed that the extent of the variation in the human genome exceeds previous estimations. Moreover, it has been shown that the vast majority of protein-coding variation is evolutionarily recent, rare, and enriched for deleterious alleles, and that the rarest single nucleotide variants (SNVs) are population-specific [1]. Rare variation, therefore, likely contributes significantly to human phenotypic variation and disease susceptibility, particularly in the field of rare diseases.
When a rare disease diagnosis using NGS analysis (focused gene panel, whole exome sequencing (WES) or whole genome sequencing (WGS)) is requested, there is a high likelihood that the result will consist of a list of rare variants of uncertain significance. Many of these variants will prove benign. While most laboratories that perform NGS testing will provide an assessment of the pathogenicity of the variant, this should be interpreted with caution. Currently available informatics tools used to evaluate pathogenicity are limited to the assessment of nucleotide conservation throughout evolution and differences in the physicochemical features of the two amino acids involved in the change (in the case of missense variants) [2,3,4,5,6,7,8,9,10,11]. In the case of synonymous and intronic variants, developed software can determine whether the nucleotide change disrupts a consensus sequence that is particularly important for splicing (acceptor/donor sites, enhancer/silencing motifs, and branchpoints) [12,13]. Nonetheless, any rare variant has the potential to be pathogenic, irrespective of the predictions of bioinformatic tools. Conversely, many variants with predicted pathogenicity are often subsequently revealed to be benign. Whenever possible, sequencing of both parents and the proband will substantially increase the interpretability of any variants detected. However, when seeking a molecular diagnosis, it is essential to consider two additional levels of variant prioritization: the mutation tolerance and the mutational architecture of each gene, both of which are intimately related. With the aid of examples created using real data, this review will provide a comprehensive explanation of these two important concepts.

2. Mutation Tolerance

2.1. Introduction

To prioritize variants detected by NGS-based analysis, it is important to perform a quantitative assessment of the tolerance of each gene to functional genetic variation. Certain genes are much more tolerant to mutation than others. Experts who work with genes implicated in rare diseases are familiar with the variability of these genes in controls and patients, and understand that the appearance of rare variants in certain genes is not a cause for alarm, whereas in other cases, the appearance of one or (in the case of a recessive disease) two rare variants is highly indicative of pathogenicity.
It has long been known that the extent of conservation varies between genes [14]. Several studies of substitution-rate variation have shown that the local mutation rate varies across the mammalian genome. The substitution rate is affected by the proportion of GC (since the base composition is not equilibrated), the site itself (CpG or non-CpG), and the mutation type (e.g., transition, transversion, length variants) [15,16]. Petrovski et al. [17] developed a system to assign to each gene a score that measures intolerance to functional genetic variation, based on data extracted from 6503 whole-exome sequences from the NHLBI Exome Sequencing Project (ESP). They showed that genes responsible for Mendelian diseases are significantly less tolerant to functional genetic variation than genes that do not cause any known disease, and observed striking variation in intolerance among genes that cause different classes of genetic disease [17]. As mentioned above, many tools have been developed to attempt to prioritize variants in terms of measures of conservation at either the phylogenetic level or based on amino acid characteristics. However, few analogous approaches have been developed to prioritize the genes in which the variants are detected [18,19]. By quantifying the strength and consistency of purifying selection acting against functional variation in a given gene, or the effects of other kinds of selection (e.g., balancing or positive selection), genes can be ranked based on their mutation tolerance. Thus, a gene-level score could be combined with well-established variant-level scores to highlight candidate causal mutations.

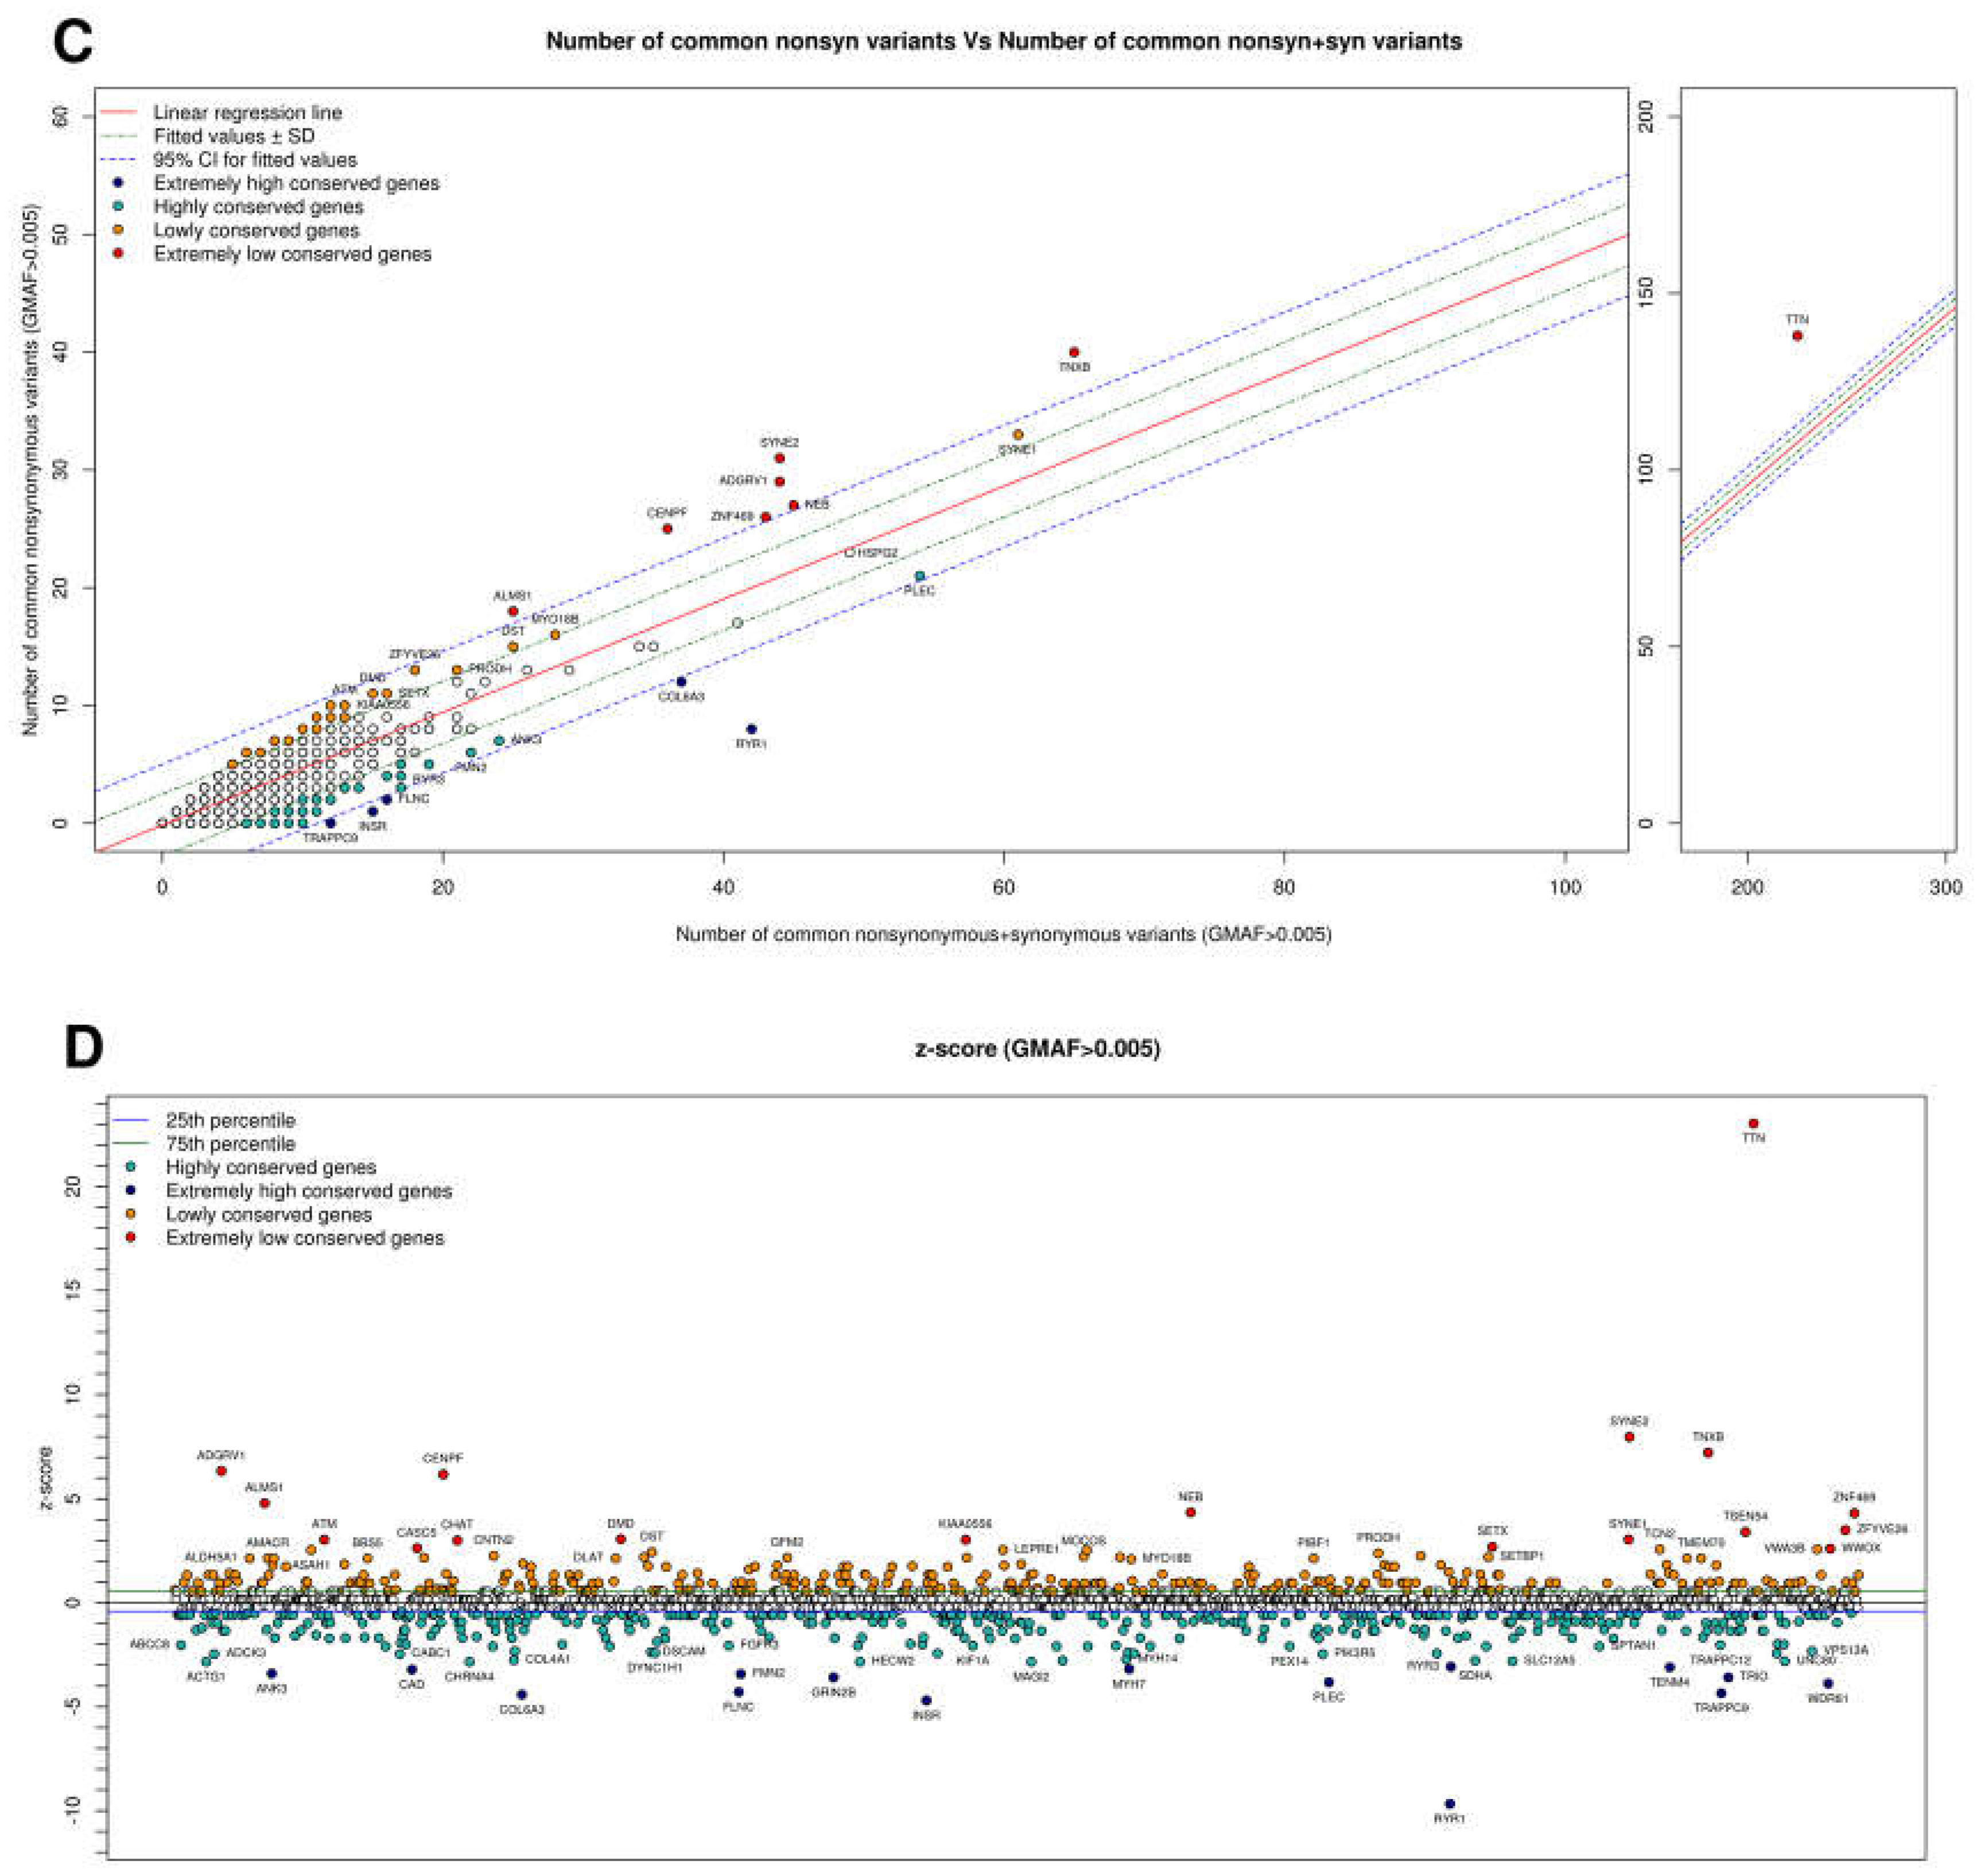
2.2. Information That Can Be Extracted from Common and Rare Variants in Control Sample Databases to Evaluate Mutation Tolerance

For the more evolutionarily conserved genes (intolerant genes), which are subjected to negative-purifying selection, it is assumed that, for common variants, the non-synonymous mutation rate (Kn-syn) should be lower than the synonymous mutation rate (Ksyn), which involves greater a priori impact for new mutations. This is because if one variant is pathogenic, the probability that it will be perpetuated in the population in the form of common variant decreases dramatically as a consequence of the negative-purifying selection acting against it. By contrast, new mutations found in less conserved genes (tolerant genes) involve lesser a priori functional impact. For example, the analysis of data generated from the sequencing of 6500 “control” exomes as part of the ESP6500 project has been previously used to define the load of loss-of-function mutations per gene [20] and to prioritize >4000 human genes that are most intolerant to variation [21].
In the case of rare variants (the most important for rare disease diagnosis), in addition to gene conservation, we must bear in mind that the length and specific mutation rate of each gene will influence the number of variants observed per gene. This is because in the case of novel rare variants, not enough time has passed to observe the effect of conservation force. Thus we cannot tell whether over time a given variant will be allowed perpetuate (i.e., is neutral) or will be eliminated (because it is harmful). Therefore, in addition to knowing the specific mutation tolerance of each gene, it is important to quantify the number of rare variants in genes in population controls in order to have a more precise estimate of the mutational load of rare variants expected for each gene. Rare variant data obtained from controls can be used to estimate the variant load (and distribution) per gene.

2.3. Mutation Tolerance of Genes Involved in Metabolic/Neurologic Diseases: Examples

To demonstrate the diversity of mutation tolerance among genes involved in rare disorders, we used the common variants detected in 659 samples from individuals of European ancestry extracted from the 1000 Genomes Project for each of the 1670 genes (additional data available upon request) included in our diagnostic panels for metabolic/neurologic rare diseases (www.neuromegen.com). We first regressed the number of total common exonic variants (minor allele frequency in 1000 G (GMAF) > 0.5%) against gene length (Figure 1A; RSE = 3.7, AdjR2 = 0.56). In this graph, the position of each gene is determined by two factors: (1) the specific mutation rate of the gene in question; and (2) the effect of conservation force on each gene (red genes exhibit more mutations than expected based on their size, and blue genes exhibit fewer variants than expected based on their size). Next, we plotted common functional variants (i.e., all except synonymous variants) against gene length (Figure 1B; RSE = 2.3, AdjR2 = 0.43). In this graph, more weight is given to evolutionary conservation force, since only variants that have functional consequences are considered. Compared with Figure 1, the position of most genes is unchanged, although in some cases, significant changes are observed, with some genes shifting position to the opposite side of the linear regression line. For example, the tolerance of TTN, SYNE2, ADGRV1, CENPF, ALMS1, ZNF469, and NEB is increased. While for some genes (e.g., NEB, ALMS1), the number of common variants is less than or equal to the number expected based on gene length, assessment of functional variants alone reveals a higher than expected mutational load, indicating that evolutionary conservation force does not exert a significant effect. Many of the genes for which this phenomenon was observed encode large structural proteins involved in muscular function (TTN, NEB, SYNE2). The opposite effect is observed for other genes (e.g., RYR1, RYR3, ANK3, TRIO, SPTAN1), for which the number of common variants is greater than that expected based on gene length (indicative of a high mutation rate for these genes). For these genes, restriction of the analysis to functional variants resulted in decreased mutation tolerance, with some genes (e.g., RYR1) shifting position to the other side of the linear regression line, indicating a significant effect of evolutionary conservation force on this gene (i.e., mutation intolerance). By regressing common non-synonymous variants against the total mutational load of the gene (common non-synonymous + synonymous) (Figure 1C; RSE = 1.3, AdjR2 = 0.81), we should discount the specific gene mutation rate for each gene and focus only on the weight of conservation force. This results in shifts in the positions of many genes from both the mutation-tolerant and mutation-intolerant sides of the graph to more neutral positions. Exceptions include RYR1, for which a decrease in tolerance is observed, and COL6A3, PLEC, and HSPG2, which shift from a mutation-tolerant to mutation-intolerant or neutral positions, indicating that their previous position was attributable only to their high specific mutation rate. For other genes, such as TTN or ATM, shifts in position reflecting increased mutation tolerance are observed, indicating that their previous positions were attributable to their a priori low mutation rate (e.g., DST moves from a mutation-intolerant to a mutation-tolerant position).
We calculated the z-score for each gene to quantify mutation tolerance using a previously described method [17,21], which is based on departure from the mean common non-synonymous variant spectrum (functional), corrected for the total mutation burden in a given gene. The z-score was generated by regressing the total number of common (GMAF > 0.5%) non-synonymous variants against the total number of common variants (non-synonymous + synonymous) observed within a gene, after which each gene was assigned the corresponding studentized residual as its z-score. A z-score of 0 indicates that the number of non-synonymous variants in a given gene is equivalent to the number estimated based on its total mutation burden. Genes with a negative z-score have fewer than the expected number of common non-synonymous variants based on the global mutational burden, and are thus likely to be less tolerant of functional mutations. A negative z-score is therefore indicative of genes subjected to strong purifying selection. Figure 1D shows the z-score calculated for each of the 1670 genes from our diagnostic panels. The higher the z-score obtained for a gene, the more tolerant it is to functional mutations and the lower the probability of a priori pathogenicity. The lower the z-score of a given gene, the higher the a priori probability that a new mutation will be pathogenic or related to the phenotype, although there are exceptions to this rule depending on the gene length, as we will show later. As it could be expected, dominant genes have a much lower z-score than recessive genes (Wilcoxon test: p-value = 1.4 × 10⁻¹³) (Figure 2). Intuitively, dominant genes should be less tolerant to variation than recessive genes, since in the former case, perturbation of one allele can promote disease, while in the case of recessive genes, the second allele can compensate for the damaged allele. Purifying selection force is greater for dominant genes. We found that 50.4% of X-linked genes had the same z-score (equal to the median of all X-linked and recessive genes analyzed), which entails that 77% of X-linked genes have a z-score lower or equal to the median of recessive genes. This makes sense since the X-linked genes in males behave as dominant since they are reduced to hemizygosity, so they do not have a second allele that compensates for the damaged one.
The five genes more intolerant (lowest z-score) and tolerant to mutation (highest z-score) for each of the lengths tracts are presented in Table 1.
The genes listed in the “most tolerant” column (right side of Table 1) are, in fact, genes that appear very often in the final dataset of filtered rare variants produced by our diagnostic panels. Moreover, most of the mutations in these genes which had been previously associated with pathologies are truncating mutations, indicating that these genes are more permissive to missense mutations. The most tolerant gene by far is TTN (z-score: 24). The mean number of rare missense TTN variants (with GMAF < 0.5%) found in any individual is 0.5. The 364-exon TTN gene (OMIM 188840) encodes titin, the largest known human protein [22]. Titin is one of the most important sarcomeric proteins, and is involved in the development of cardiac and skeletal muscle, as well as in architecture, elasticity, and cell signaling. TTN mutations are associated with a broad spectrum of phenotypic severity [23,24,25,26,27,28,29,30]. In our experience, the detection of rare missense variants in the TTN gene in patients with neuromuscular disorders is relatively common, and does not necessarily indicate the involvement of this gene in the patient’s phenotype. In fact, most of the TTN variants recorded in ClinVar that are implicated in titinopathies are truncating variants. Only some missense mutations in trans with a truncating variant or isolated missense mutations located in highly specific protein codons have been associated with diseases [23].
Mutation-intolerant genes (left side of Table 1) are not usually observed in the final dataset of filtered rare variants produced by our diagnostic panels. When these genes do appear, we subject them to careful analysis to evaluate the compatibility between the associated disease and the patient’s clinical history, since the genes will likely be implicated in the patient’s disorder. However, as described below, the length of the gene should also be considered in this evaluation.

2.4. Information Extracted from Rare Variant Spectrum for Genes Implicated in Metabolic/Neurologic Diseases: Examples

The presence of rare variants in a gene not only depends on the specific mutation tolerance of the gene in question (previous section), but is also influenced by the gene’s length and its specific mutation rate. To illustrate this, using data from the same 659 probands analyzed in the previous section, we calculated the probability of finding one rare variant in dominant or X-linked genes or two rare variants in recessive genes for each of the 1670 genes analyzed (Figure 3). Genes that behaved as both dominant and recessive were included in both groups. To this end, we used the Poisson distribution, P(λ), where λ is the frequency of rare variants (GMAF < 0.5%) in each gene. Since gene length influences this probability, we also grouped genes based on length. As expected, y-axis values increased with increasing gene length for both groups (Figure 3A,B). It is not unusual to find two or more functional rare variants in recessive genes with high z-scores (i.e., mutation-tolerant genes), exemplified in this case by TTN (9%) and NEB (0.8%). Nonetheless, for several genes with low z-scores (intolerant), including RYR1, RYR3, COL6A3, and PLEC, the probabilities are in the same range (0.3%, 0.2%, 0.3% and 0.7%, respectively), most likely due to their large gene length.
The position occupied by a given gene in these graphs is of vital importance for the prioritization of rare variants detected by NGS analysis. Table 2 shows the dominant (left) and recessive (right) genes for which the probability of finding one or two variants, respectively, by chance, was lowest.
As shown in Table 2, a large percentage of genes for which the lowest probabilities were obtained, especially recessive genes, are implicated in basic human metabolism (red). Furthermore, a large percentage of the dominant genes for which the probability of finding one variant (usually a de novo mutation) was lowest are implicated in epileptic encephalopathy and brain development (green).
In the case of recessive genes, the presence of 2 rare variants (or a homozygous rare variant) in GM2A, NEU1, DDHD1, and ARFGEF2 for example (in which the probability of detection by chance ranges from ~0% to 0.001%), dramatically increases the probability that these changes are associated with the patient’s phenotype, even if the patients’ clinical features do not match perfectly with the disease-associated gene. The opposite occurs for TTN, NEB, and SYNE1, for which the probability of finding two rare variants by chance is 9%, 0.8%, and 0.7%, respectively. However, it is important to note that the probability is based not only on the conservation score of each gene but also on gene length. Thus, despite the low z-scores of RYR1, RYR3, and PLEC, probabilities of 0.3%, 0.2%, and 0.7% were obtained, attributable to the length of the genes and possibly the effects of other factors influencing the mutation rate.
In the case of dominant genes, the detection of one rare variant in STX1B, GABRG2, TUBB2B, TUBB, TUBB1A, GRIN2D, CHD2, SCN2A, and SCN1A, all of which are implicated in epileptic encephalopathies or brain development and have scores ranging from ~0% to 1%, warrants careful attention and indicates a need to perform familial studies, since these mutations are likely de novo.

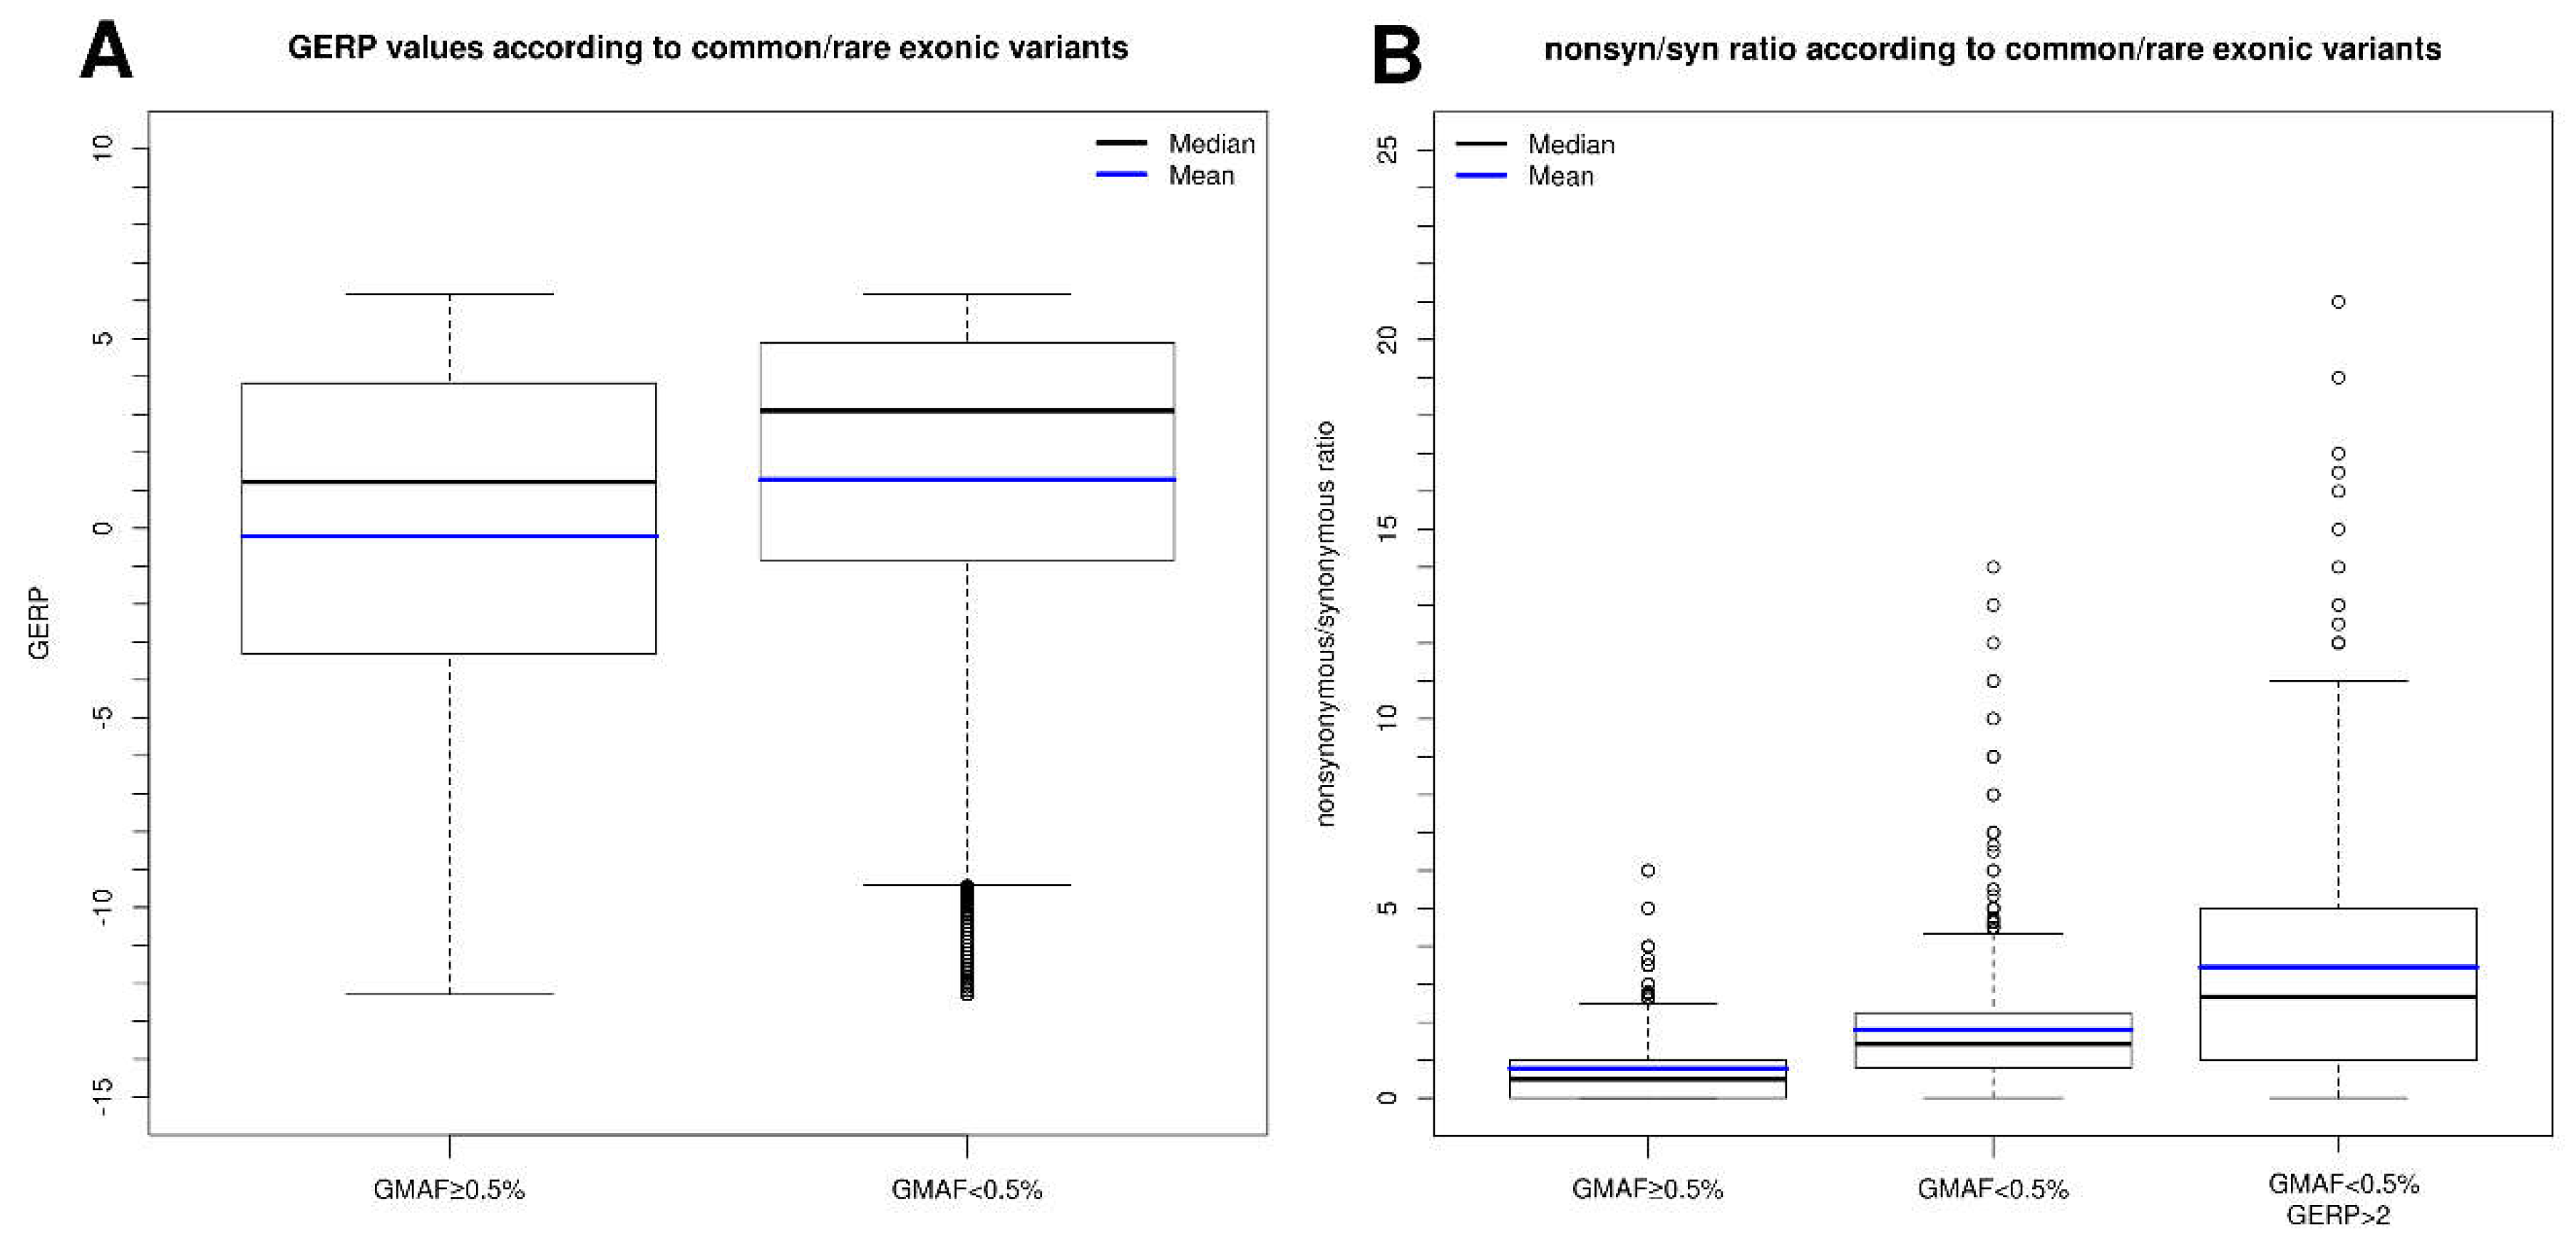
2.5. Conservation Score for Nucleotide(s) Affected in the Variant and Relationship with Variant Frequency

Once mutation tolerance and rare mutational load are assessed for each gene, it is important also to take into account a score that considers whether the specific nucleotide affected by the variant exhibits evidence of selective constraint throughout evolution. While a given gene may be highly mutation-intolerant, if the specific nucleotide that is mutated is not conserved, it is possible that the variant is neutral and vice versa (i.e., in mutation-tolerant genes, if the specific nucleotide is highly conserved, it is possible that the variant is harmful). There are bioinformatics tools that can quantitatively estimate nucleotide conservation throughout evolution [2,3].
The GERP (Genomic Evolutionary Rate Profiling) tool assigns a specific conservation score to each position using maximum likelihood evolutionary rate estimation. As previously demonstrated [14], the data obtained with our group of genes indicate that the higher the GERP value, the lower the variant frequency (Figure 4A), and show that the non-synonymous-to-synonymous ratio among rare (<0.5%) variants (with GERP > 2) is higher (typically in the range of 1–2) than that observed for common variants (range, 0.5–1.5). This suggests that 25–50% of rare non-synonymous variants are deleterious (and therefore subjected to purifying selection) (Figure 4B). Based on these findings, we can infer that the lower the GMAF and the higher the GERP score, the greater the probability that the variant in question is implicated in a pathogenic process. This also implies that when we find, for example, a synonymous or intronic mutation that is not described in any population database (frequency = 0) and has a high GERP score (>4), it is imperative to analyze this change using a program to evaluate regions involved in splicing, since the degree of conservation should indicate whether the nucleotide in question is important for the functionality of the gene studied.

3. Mutational Architecture

After determining how tolerant a given gene is to mutation, the next step in the variant prioritization process is to assess, for a given tolerance score, the types of mutations and their position within the gene, and the association between these variants and different phenotypes. This is known as mutational architecture. It is well known that perturbation of different functional regions of one gene can affect different functions and processes, giving rise to distinct phenotypes [31]. Furthermore, different types of mutation (truncating vs. missense, gain vs. loss of function) can give rise to distinct phenotypes. This is more important in the case of rare disorders; recent research findings have demonstrated a marked overlap between phenotypic spectrums arising from mutations on different genes. Knowledge of the specific mutational architecture of each gene allows us to prioritize variants detected by NGS analysis. Assessment of the possible involvement of a variant in a given phenotype must consider the specific mutational architecture of the gene in which the mutation is situated. The same variant (type and location) could have very deleterious effects in one gene, but not in another. Certain genes are susceptible only to truncating variants but tolerate missense variants (e.g., TTN, SYNE1). Similarly, some genes (e.g., KCNQ2) are only susceptible to missense gain-of-function mutations, while truncating mutations give rise to much milder phenotypes. SETBP1 is an example of a gene that is sensitive only to missense variants that are located in very specific positions of the protein and give rise to a very severe phenotype. In the case of CDKL5, specific exons of the gene are mutation-insensitive, while in some genes that only tolerate mosaic mutations, such as AKT1 and GNAS, germinal mutations are lethal. Having up-to-date information on the specific mutational architecture of each gene allows correct prioritization of variants detected by NGS analysis, as illustrated below in 5 paradigmatic examples of mutations implicated in neurologic and metabolic disorders. In each example, specific aspects of the mutation must be taken into account to ensure correct variant prioritization.

3.1. KCNQ2: Disease Severity Depends on the Mutation Type (Truncating vs. Missense)

In some genes, different mutation types (truncating vs. missense) result in different degrees of pathological severity. Contrary to expectation, truncating mutations do not always give rise to the most severe phenotype, which depends on the function of the protein encoded by the gene. This is well exemplified by the KCNQ2 gene. Mutations in this gene, which encodes one of the two subunits of the voltage-gated potassium channel that mediates the neuronal M-current (IKM) [32], give rise to early-onset epileptic diseases, which vary considerably in their phenotypic presentation [33]. The M channel mediates the conduction of a slowly activating and deactivating potassium current, and plays a major role in setting the lower electroexcitability threshold, as well as the capacity of neurons to respond to synaptic input. In 1998, the first dominant mutations in this channel were described, and were associated with benign familial neonatal epilepsy (BFNS) with good prognosis [33,34,35]. In stark clinical contrast, KCNQ2 mutations were subsequently implicated with early onset epileptic encephalopathy (EOEE), a much more severe and disabling disorder [36]. Patients with KCNQ2 encephalopathy display tonic seizures two to three days after birth, have an electroencephalography profile characterized by suppression-burst patterns or multifocal epileptic activity, and have a poor neurological prognosis [37,38,39]. The presence of KCNQ2 whole-gene deletions in BFNS patients demonstrates that total loss of function of one allele causes only benign phenotypes. Therefore, haploinsufficiency cannot explain the more severe KCNQ2–EOEE phenotype. Moreover, all KCNQ2–EOEE mutations described to date are missense mutations, never haploinsufficiency mutations (which are always associated with BFNS). A possible explanation for this finding is that haploinsufficiency may be physiologically reversed, as observed in BFNS patients, while alleles with missense mutations can give rise to M channels that are functional but have varying voltage sensitivities depending on the amino acid change in question (gain and loss of function). This finding is very important since it could lead to the development of personalized treatments for KCNQ2–EOEE. Therapies using antisense oligonucleotides are being developed for diseases caused by known dominant negative mutations. Specific inhibition of the transcription or translation of the mutated KCNQ2 allele could result in a loss-of-function scenario, mimicking KCNQ2 haploinsufficiency, which in turn is known to give rise to the milder BFNS phenotype. Such a strategy could therefore potentially convert severe EOEE to a benign neonatal epilepsy syndrome [40].

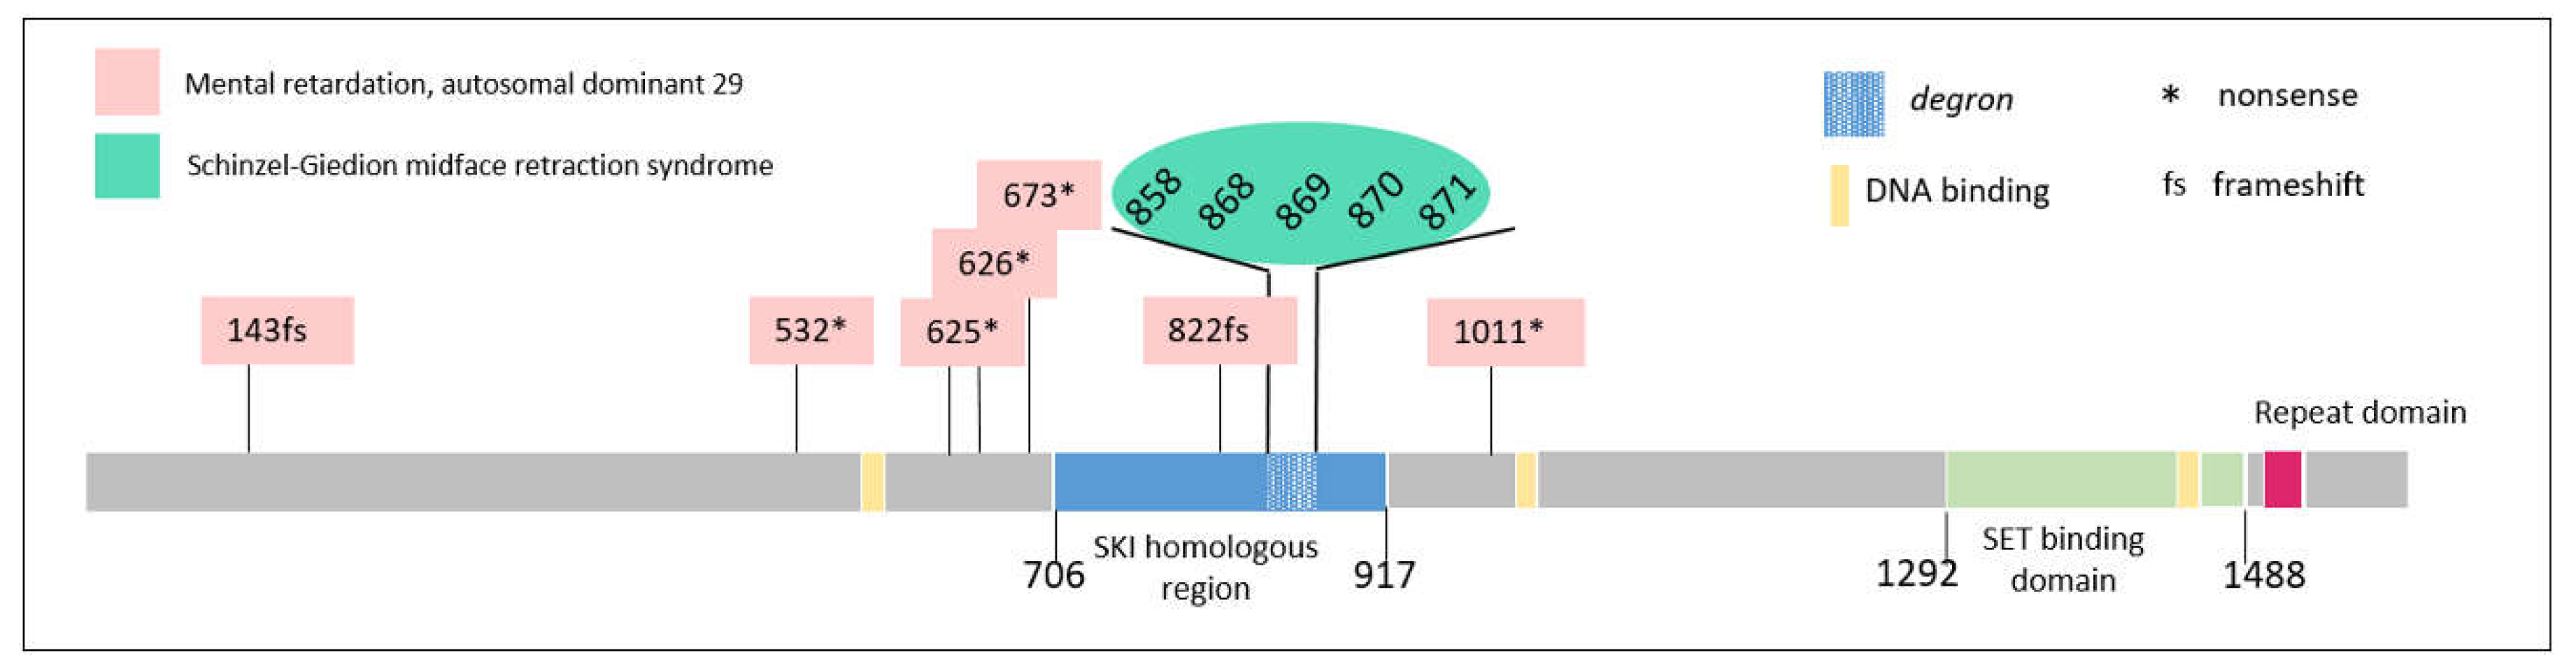
3.2. SETBP1: Phenotypes Differ Markedly Depending on the Type of Mutation, the Location Thereof, and the Percentage of Cells Affected

SETBP1 provides a particularly interesting example since the phenotype produced by mutations in this gene depends not only on the type of mutation (truncating vs. missense) but also on the region in which the missense mutation is located and the percentage of cells in which it is found (mosaic vs. germline mutations).
Haploinsufficiency mutations in this gene result in intellectual disability (ID) of variable severity associated with difficulties in verbal communication [41,42]. Although the spectrum of intellectual impairment ranges from normal to severe, mild ID is observed in most cases. Several individuals with disruptive mutations have good receptive language skills but completely lack expressive speech [20,43,44]. Other features include impaired fine motor skills, subtle dysmorphism, hyperactivity, and autistic traits [20,42].
However, missense de novo mutations in three specific amino acids clustered in a highly conserved 11-bp exonic region (Figure 5) that includes residues 868 to 871 result in a very severe disorder known as Schinzel–Giedion syndrome (SGS), the first dominant disorder for which the genetic basis was identified by whole-exome sequencing [45]. It is characterized by severe mental retardation, persistent feeding problems, severe forms of epilepsy, distinctive facial features, and various congenital organ defects, blindness, deafness, and increased risk of malignancy. Most affected individuals die before the age of 10.
The same mutations were reported in somatic mosaicism in several types of myeloid malignancies after the association of de novo germline mutations in SETBP1 with this syndrome [46,47,48]. This finding is unsurprising, since several other genes have been implicated in both developmental disorders and cancer, including HRAS (Costello syndrome), ASXL1 (Bohring-Opitz syndrome), EZH2 (Weaver syndrome), and FGFR2 (Pfeiffer, LADD, Jackson-Weiss, Crouzon, Saethre-Chotzen, Apert, Beare-Stevenson cutis gyrata, bent bone dysplasia, and Antley-Bixler syndromes) [49]. These findings partially explain the high rates of childhood cancer in patients with congenital developmental defects [50,51,52], given that common molecular pathways may mediate both embryogenesis and cancer development [53,54].
Mutations in this SETBP1 hotspot disrupt a degron, a signal that regulates protein degradation, leading to the accumulation of SET-binding protein 1. Interestingly, differences in phenotype severity depending on the amino acid changed in the degron sequence have also been reported [55]. The stability and protein levels of SETBP1 are affected differently depending on the type of mutation, both within and around the degron, as has been demonstrated in both in vitro and by in silico modeling. Changes in residue I871 result in mild increases in protein expression, and are found at a significantly greater frequency in SGS versus leukemia. On the other hand, substitutions in residue D868 result in the greatest increases in protein levels, and are associated with a higher cell proliferation rate in vitro and a greater incidence of cancer as compared with patients with other germline SETBP1 mutations. The degron is therefore more affected by somatic SETBP1 mutations that promote cancer than by germline mutations that cause SGS, implying that the threshold for cancer caused by mutations in the SETBP1 degron is higher than that for prenatal developmental alterations in SGS.

3.3. TCF4: Phenotype Depends on the Longitudinal Location of the Mutation in the Gene

Phenotypes produced by variants in TCF4 range from mild cognitive impairment to Pitt-Hopkins syndrome (PTHS), a neurodevelopmental disorder characterized by ID and characteristic facial features, in some cases accompanied by respiratory abnormalities, microcephaly, ophthalmological problems, epilepsy, or behavioural problems (autism spectrum disorder) [56,57,58,59,60,61]. The human TCF4 gene coded by 18 exons and the last 3′ UTR exon is predicted to encode at least 18 different proteins with distinct N-terminal sequences. TCF4 possesses numerous 5′ initial exons, and can thus generate a variety of different transcripts, all of which share the same final 12 exons (11 protein-coding exons and the last 3′ UTR exon) [62,63] (Figure 6). Depending on the location of the variants along the length of the TCF4 gene (from 5′ to 3′), one or more transcripts of the gene, and the corresponding protein isoforms, will be affected. This gives rise to a variety of phenotypic presentations along the same clinical spectrum. Impairment of different protein domains of TCF4 protein gives rise to a variable clinical presentation [61] (Figure 6). Variants in exons 1–6 result in mental retardation that is mild but does not fall within the spectrum of Pitt–Hopkins syndrome [64,65,66,57]. These types of variants affect the longer transcript, but spare many others transcripts that are initiated later, in which both NLS and bHLH are conserved in both alleles. Variants in exons 7 and 8 result in impairment limited to the NLS domain in several transcripts and cause a more severe phenotype that resembles Pitt–Hopkins syndrome (PTHS-like), albeit without the characteristic facial dysmorphism. This is because they allow the existence of shorter transcripts with an intact bHLH domain. Variants in exons 9–18 give rise to the most severe Pitt–Hopkins syndrome phenotype, since all isoforms are affected and both essential domains NLS and bHLH are reduced to haploinsufficiency.
Interestingly, while most disease-associated variants in TCF4 are truncating mutations, more missense than truncating mutations are found in exon 18, which encodes the bHLH domain (Figure 6). The N-terminal region of the bHLH domain contains a highly conserved group of positively charged amino acids that directly interacts with DNA. The remainder of the bHLH motif forms a surface that favors homodimerization and heterodimerization through the assembly of as stable 4-helix bundle with a defined hydrophobic core.

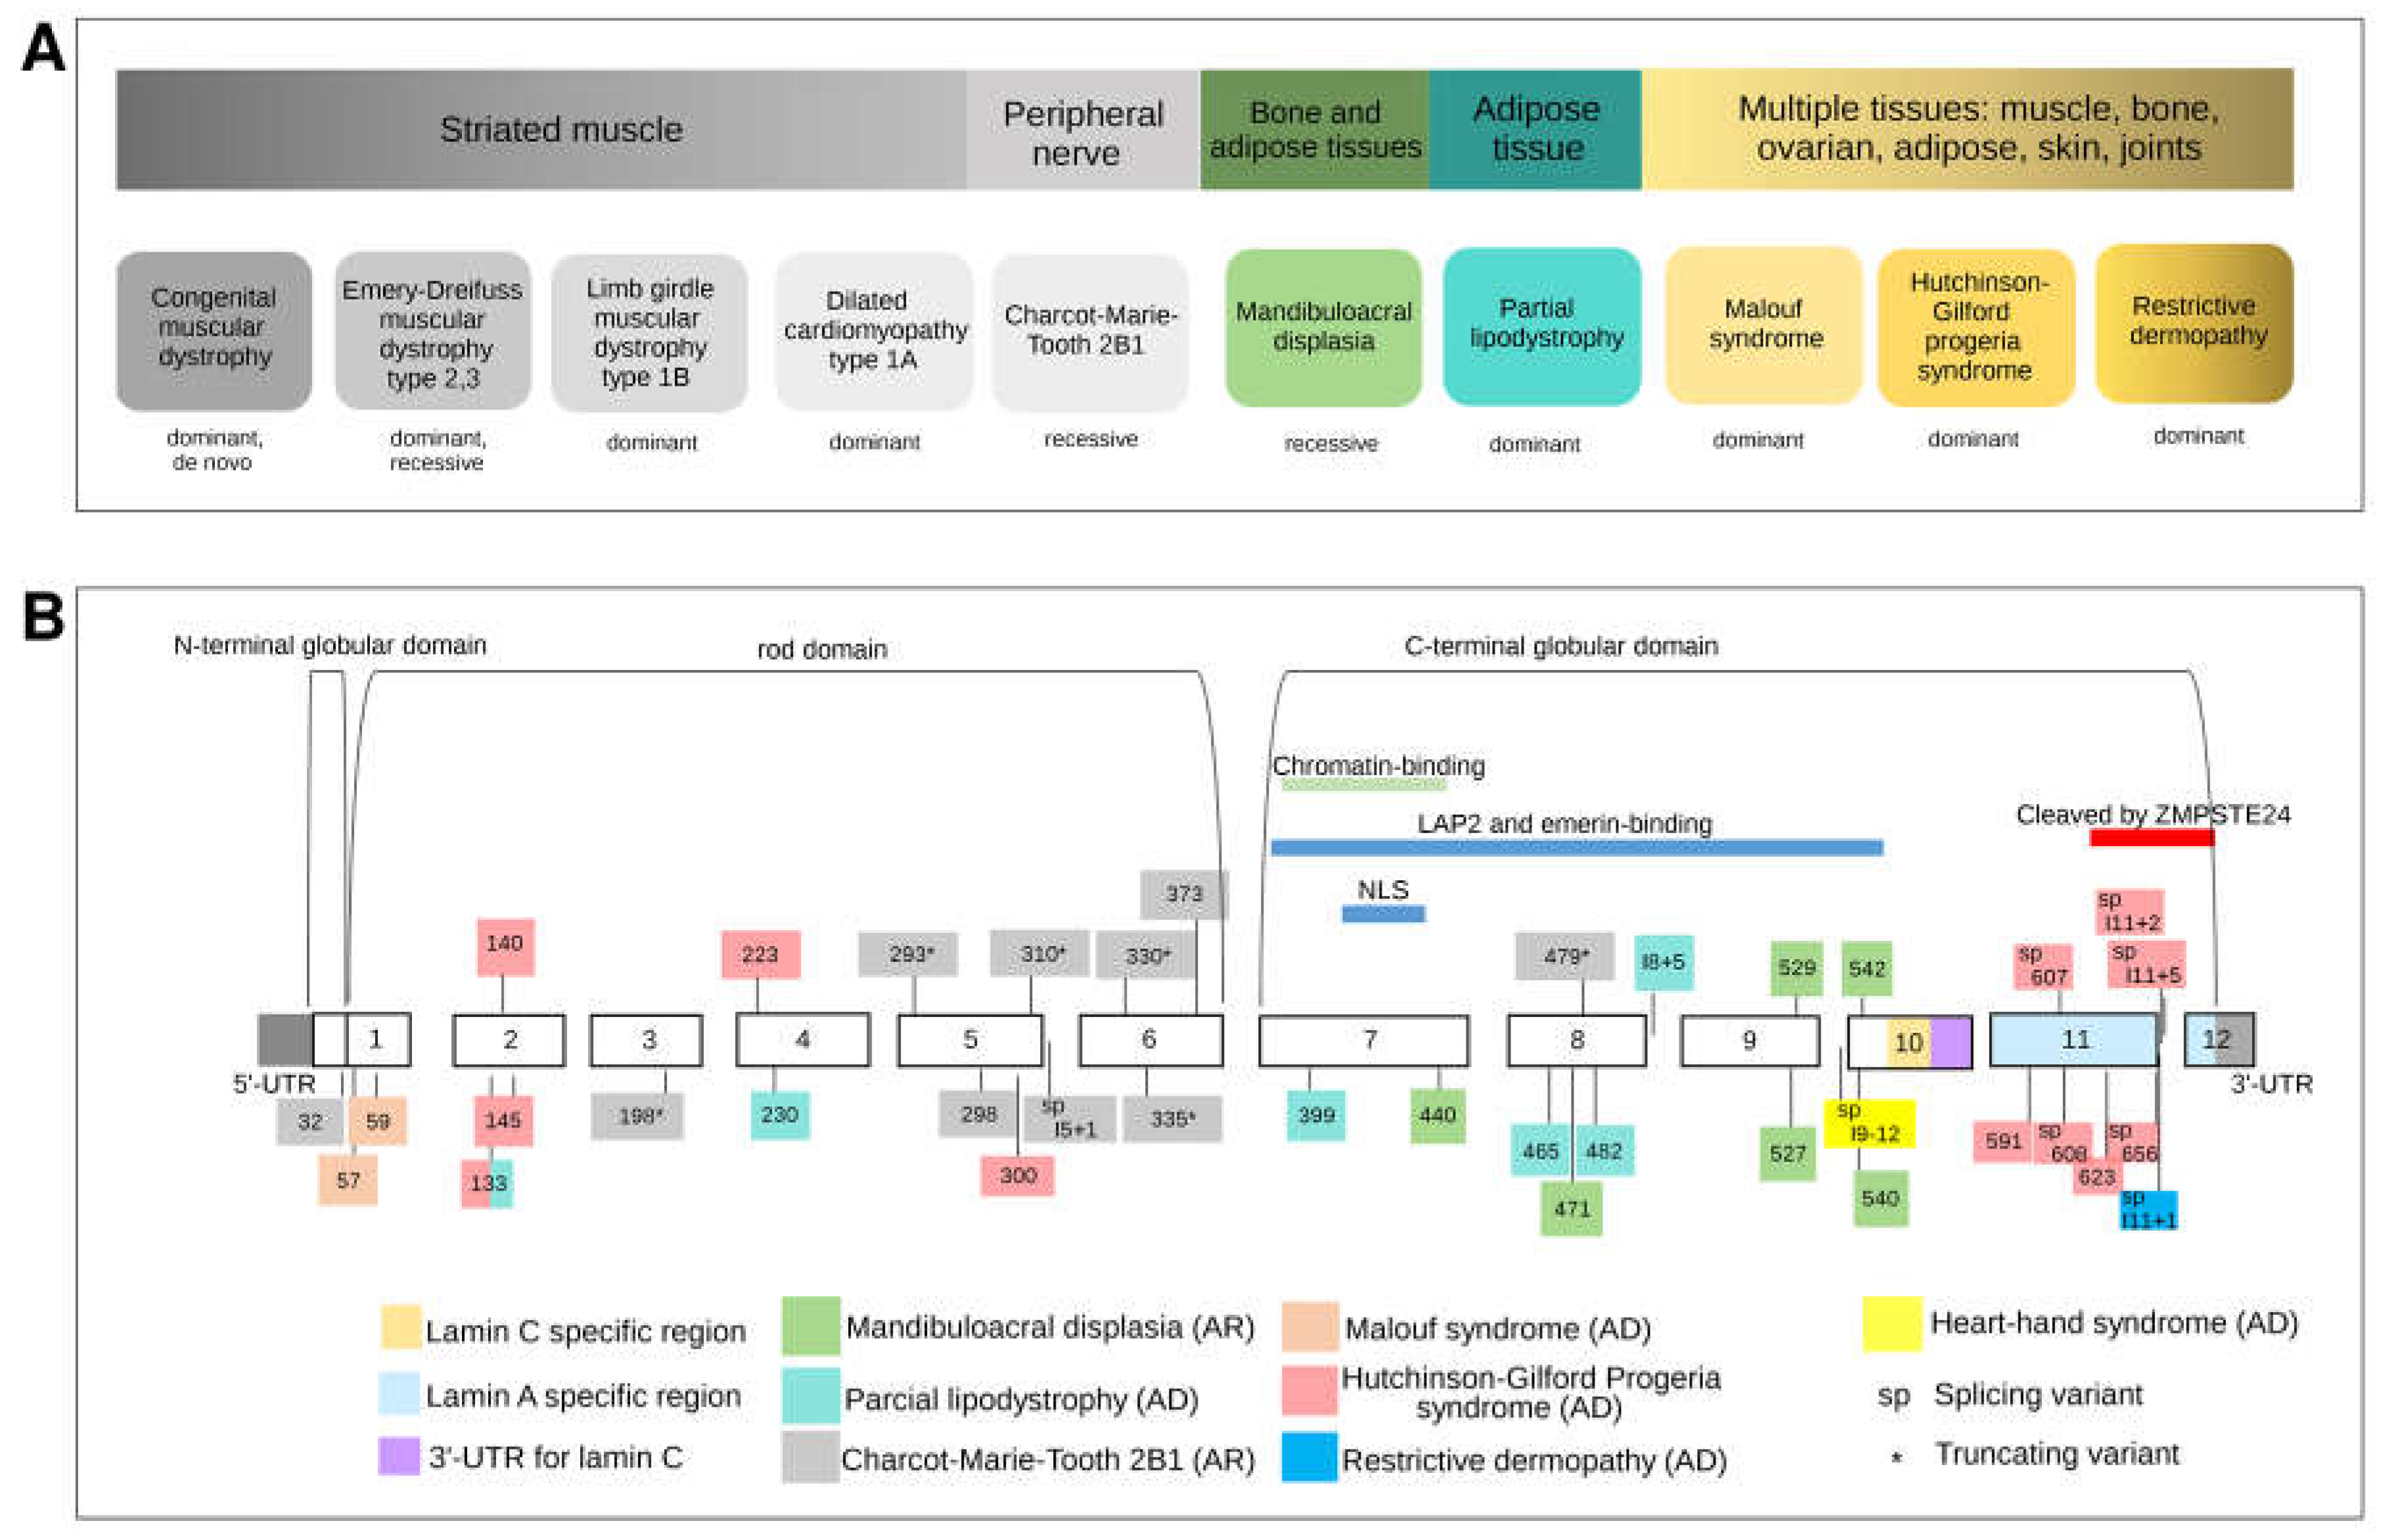
3.4. LMNA: The Malleable Gene Paradigm

In this gene, mutations of different types in different locations, influenced by genetic background and/or epigenetic and environmental factors, give rise to very different and apparently unrelated phenotypes.
LMNA encodes lamins A and C, which are produced in roughly equal amounts. Lamins A and C are structural proteins located in the nuclear lamina, a fibrillar network consisting of intermediate filaments and other proteins that adheres to the inner membrane of the nuclear envelope, which regulates molecular transport in and out of the nucleus. Lamins A and C, which are also found inside the nucleus, may influence the expression of specific genes. Before being incorporated into the lamina, lamin A must undergo processing within the cell. Its precursor, prelamin A, undergoes a complex series of steps that are required to enable insertion of the protein into the lamina layer. This preprocessing stage is not required for incorporation of lamin C into the nuclear lamina.
Mutations in LMNA, depending on their type and location, may alter different lamin A/C functions and affect various processes, leading to a spectrum of genetic disorders, collectively referred to as laminopathies. LMNA mutations can affect skeletal and cardiac muscle, fat storage and metabolism, cell differentiation, DNA replication, and gene regulation. Hundreds of LMNA mutations (193 of which classified as pathogenic in ClinVar) have been described in patients. Mutations in LMNA have been implicated in about a dozen clinical disorders since the end of the 20th century. These can be classified as diseases that predominantly affect (1) striated muscle, (2) adipose tissue, (3) peripheral nerves, or (4) multiple tissues (Figure 7A). Lamin C, which is widely expressed in most differentiated somatic cells and some undifferentiated cells, but not in early embryos, is encoded by exons 1–9 and part of exon 10 (Figure 7B). Lamin A is the result of alternative splicing, which adds exons 11 and 12 and removes the lamin C-specific portion from exon 10.

3.4.1. Striated Muscle Diseases

Numerous mutations located throughout the entire LMNA gene have been implicated in autosomal dominant, autosomal recessive, and sporadic cases of Emery-Dreifuss muscular dystrophy 2 and 3 [67,68,69]. Patients with this disorder develop early contractures of the elbows, Achilles tendons, and neck, spinal rigidity, muscle weakness that affects the upper arms and lower legs and worsens over time, and dilated cardiomyopathy with atrioventricular conduction block of early onset. Most of these cases are caused by missense mutations in exons that encode the central rod domain common to both lamins A and C. These mutations occur at evolutionarily conserved residues that likely have essential structural or functional roles. The resulting protein misfolding or assembly failure leads to partial or complete loss of function [70]. LMNA mutations have also been implicated in other myopathies, including limb girdle muscular dystrophy type 1B (LGMD1B) [71,72,73] and dilated cardiomyopathy type 1A (DCM1A) [74].
In dilated cardiomyopathy 1A, little or no skeletal muscle involvement is observed, while limb-girdle muscular dystrophy skeletal muscle around the shoulders and hips is predominantly affected, with sparing of the distal extremities and an absence of the joint contractures typical of classical Emery-Dreifuss muscular dystrophy. It was originally proposed that Emery-Dreifuss muscular dystrophy, limb girdle muscular dystrophy type 1B, and dilated cardiomyopathy 1A resulted from distinct LMNA mutations. However, environmental factors or the influence of other genes are more plausible explanations for this phenotypic variability. These three disorders (with overlapping phenotypes) could be considered different manifestations of the same disease. This hypothesis is supported by the results of a study [75] in which different members of the same family displayed the three distinct muscular phenotypes caused by a single mutation, suggesting that the phenotype is influenced by genetic background as well as environmental and epigenetic factors. Although most LMNA mutations that cause muscle disorders present during childhood or early adulthood, in rare cases patients present with congenital muscular dystrophy [76] of an earlier onset and more severe phenotype. While most cases of LMNA-associated congenital muscular dystrophy are caused by de novo mutations, cases caused by germinal mosaicism have been described [77].

3.4.2. Heart-Hand-Foot Involvement

In 2008, heart-hand syndrome of Slovenian type was described as an adult-onset progressive sinoatrial and atrioventricular conduction disease, which results in dilated cardiomyopathy, a peculiar form of brachydactyly (mild hand involvement and more severe foot involvement), and sudden death caused by ventricular tachyarrhythmia. Alterations of the hands include short distal, middle, and proximal phalanges and clinodactyly, while foot alterations include short distal and proximal phalanges and metatarsal bones, short or absent middle phalanges, extra ossicles, syndactyly, terminal symphalangism, and duplication of the bases of the second metatarsals [78]. One LMNA mutation has been linked to this phenotype.

3.4.3. Adipose Tissue Involvement

LMNA mutations also cause defects that affect fat storage and metabolism. Lipodystrophies are characterized by complete or partial loss of subcutaneous fat. Patients with Dunnigan-type familial partial lipodystrophy, a dominantly inherited disorder, do not exhibit any alterations of the subcutaneous adipose tissue until puberty, when they experience a regional loss of fat from the extremities associated with insulin-resistant diabetes mellitus with acanthosis nigricans and hypertriglyceridemia [76]. In some cases, the accumulation of subcutaneous fat on the face and neck can lead to a moon-shaped face, as well as a double chin or fat neck, in affected individuals. This phenotype is due almost exclusively to autosomal dominant missense mutations in exons 7–10 of LMNA [79,80,81,82] (Figure 7B). These mutations lie in the C-terminal globular tail region and may alter its interactions with protein targets [83,84]. At the cellular level, some mutations have been shown to cause structural defects in the nuclear envelope, fragile nuclei, and chromatin detachment from the lamina [82].

3.4.4. Peripheral Nerve Involvement

By 2000, it was clear that both dilated cardiomyopathy and partial lipodystrophy were caused by LMNA mutations. However, the situation was further complicated when just a few years later, a homozygous amino-acid substitution (R298C) in this gene was linked to Charcot-Marie-Tooth disease type 2 [85]. This mutation lies in the conserved rod domain and is predicted to interfere with lamin binding. Again, phenotypic variability was demonstrated, indicating the influence of genetic/epigenetic factors in the resulting phenotype [86]. This finding suggested that nerve degeneration could account for the muscle wasting and degeneration observed in other laminopathies. Charcot-Marie-Tooth disease type 2, including the subtype caused by LMNA mutation, features axonal degeneration and the loss of large myelinated fibers, while decreases in nerve conduction velocity are mild or absent [87]. More LMNA mutations linked to peripheral nerve disorders were subsequently detected, most of which were truncating and located in the rod domain.

3.4.5. Mandibuloacral Dysplasia: Bone and Adipose Tissue Involvement

In 2002, a link between mandibuloacral dysplasia (MAD) and LMNA mutations was demonstrated [88]. MAD is a rare autosomal recessive disorder. Affected individuals have an undersized jaw, underdeveloped clavicles, and exhibit other congenital bone abnormalities combined with partial lipodystrophy [89,90]. MAD-associated mutations are located in the same exons as lipodystrophy-causing variants, indicating that MAD is a more severe phenotype that affects bone development in addition to fat distribution. Mutations in ZMPSTE24, which encodes the lamin-A-processing enzyme, have also been associated with a similar phenotype, albeit more severe and with an earlier onset [91]. Consistent with the effects on protein localization predicted for these mutations, alterations observed in MAD patients include nuclear accumulation of prelamin A, dysmorphic nuclei, and chromatin disorganization, all of which become more severe with increasing age [92].

3.4.6. Multiple Tissue Involvement (Progeroid Syndromes)

Hutchinson–Gilford Progeria Syndrome

Hutchinson–Gilford progeria syndrome is a rare disease characterized by rapid apparent aging, beginning in childhood [93,94]. Patients with this syndrome do not usually survive beyond the second decade of life, and typically die from myocardial infarction or stroke [95,96]. Notable features of this syndrome include growth impairment, sclerotic skin, prominent eyes, joint contractures, small jaw size, reduced levels of subcutaneous fat, hair loss, dimpling and mottling of the skin, fingertip tufting, and prominent cutaneous vasculature [96]. In 2003, Francis Collins and colleagues identified the gene responsible [97]. De novo splicing mutations, most located in exon 11 of LMNA, were found to underlie this severe disorder. These mutations result in deletion of the carboxyl terminus of prelamin A, giving rise to a truncated prelamin A variant that is not appropriately processed to lamin A. Other LMNA missense mutations located in the rod domain that result in abnormal RNA splicing within exon 11 have also been reported in variant progeroid syndromes [98,99,100]. Progeroid features are also observed in mandibuloacral dysplasia caused by LMNA mutations, as discussed above.

Malouf Syndrome

Two heterozygous missense mutations in the LMNA gene, A57P [98] and L59R [101,102], were found in 3 patients with dilated cardiomyopathy and hypergonadotropic hypogonadism [103]. Premature ovarian failure, dilated cardiomyopathy, lipodystrophy, and progressive facial and skeletal alterations (micrognathia and sloping shoulders, but not acroosteolysis) were observed in all three patients. Despite a progeroid-like appearance, none of the patients experienced severe growth failure, alopecia, or progressive atherosclerosis.

Restrictive Dermopathy

The most recently identified laminopathy is restrictive dermopathy (RD), which causes death shortly after birth and is characterized by intrauterine growth retardation, defects of the skin and skull, pulmonary hypoplasia, and microstomia. This syndrome is caused by recessive null ZMPSTE24 mutations and, less commonly, dominant de novo LMNA mutations. The accumulation prelamin A (either truncated or normal-length) results in the formation of lamin A and lamin C aggregates and alterations in nuclear architecture [104,105].

3.4.7. Combination of Phenotypes in Isolated Patients

Combinations of different phenotypes have also been reported. These include an individual who was a compound heterozygote for the R527H and V440M LMNA mutations, and showed some signs of mandibuloacral dysplasia as well as muscular involvement [106]. These two LMNA mutations could explain the patient’s two apparently unrelated phenotypes [107]; and that of a 65-year-old man with the novel nonsense mutation p.Q353X, who presented with amyotrophy of the lower limbs, arrhythmia and cardiac hypofunction, and neurological and electrophysiological alterations, suggesting spinal muscular atrophy type 3 [108].

3.4.8. Mutational Architecture of LMNA

Some LMNA-related phenotypes (e.g., restrictive dermopathy, mandibuloacral dysplasia, Hutchinson–Gilford progeria syndrome (HGPS), and familial partial lipodystrophy) are associated with mutations located in specific sites of the gene. For other phenotypes, such as those involving skeletal and cardiac muscle, no specific mutation site within the protein has been identified. Various disease phenotypes are the result of the regulatory role of lamin A/C in a variety of cellular processes, including transcription, intracellular signaling, the maintenance of nuclear shape, nuclear pore spacing, and chromatin organization [109,110,111,112]. We suspect that the complex spectrum of these diseases is associated with developmental alterations that influence particular tissues, depending on the mutation type. These disorders include muscular, peripheral neurogenic, lipodystrophy, and premature aging syndromes, and are characterized by the involvement of tissues of mesenchymal origin.

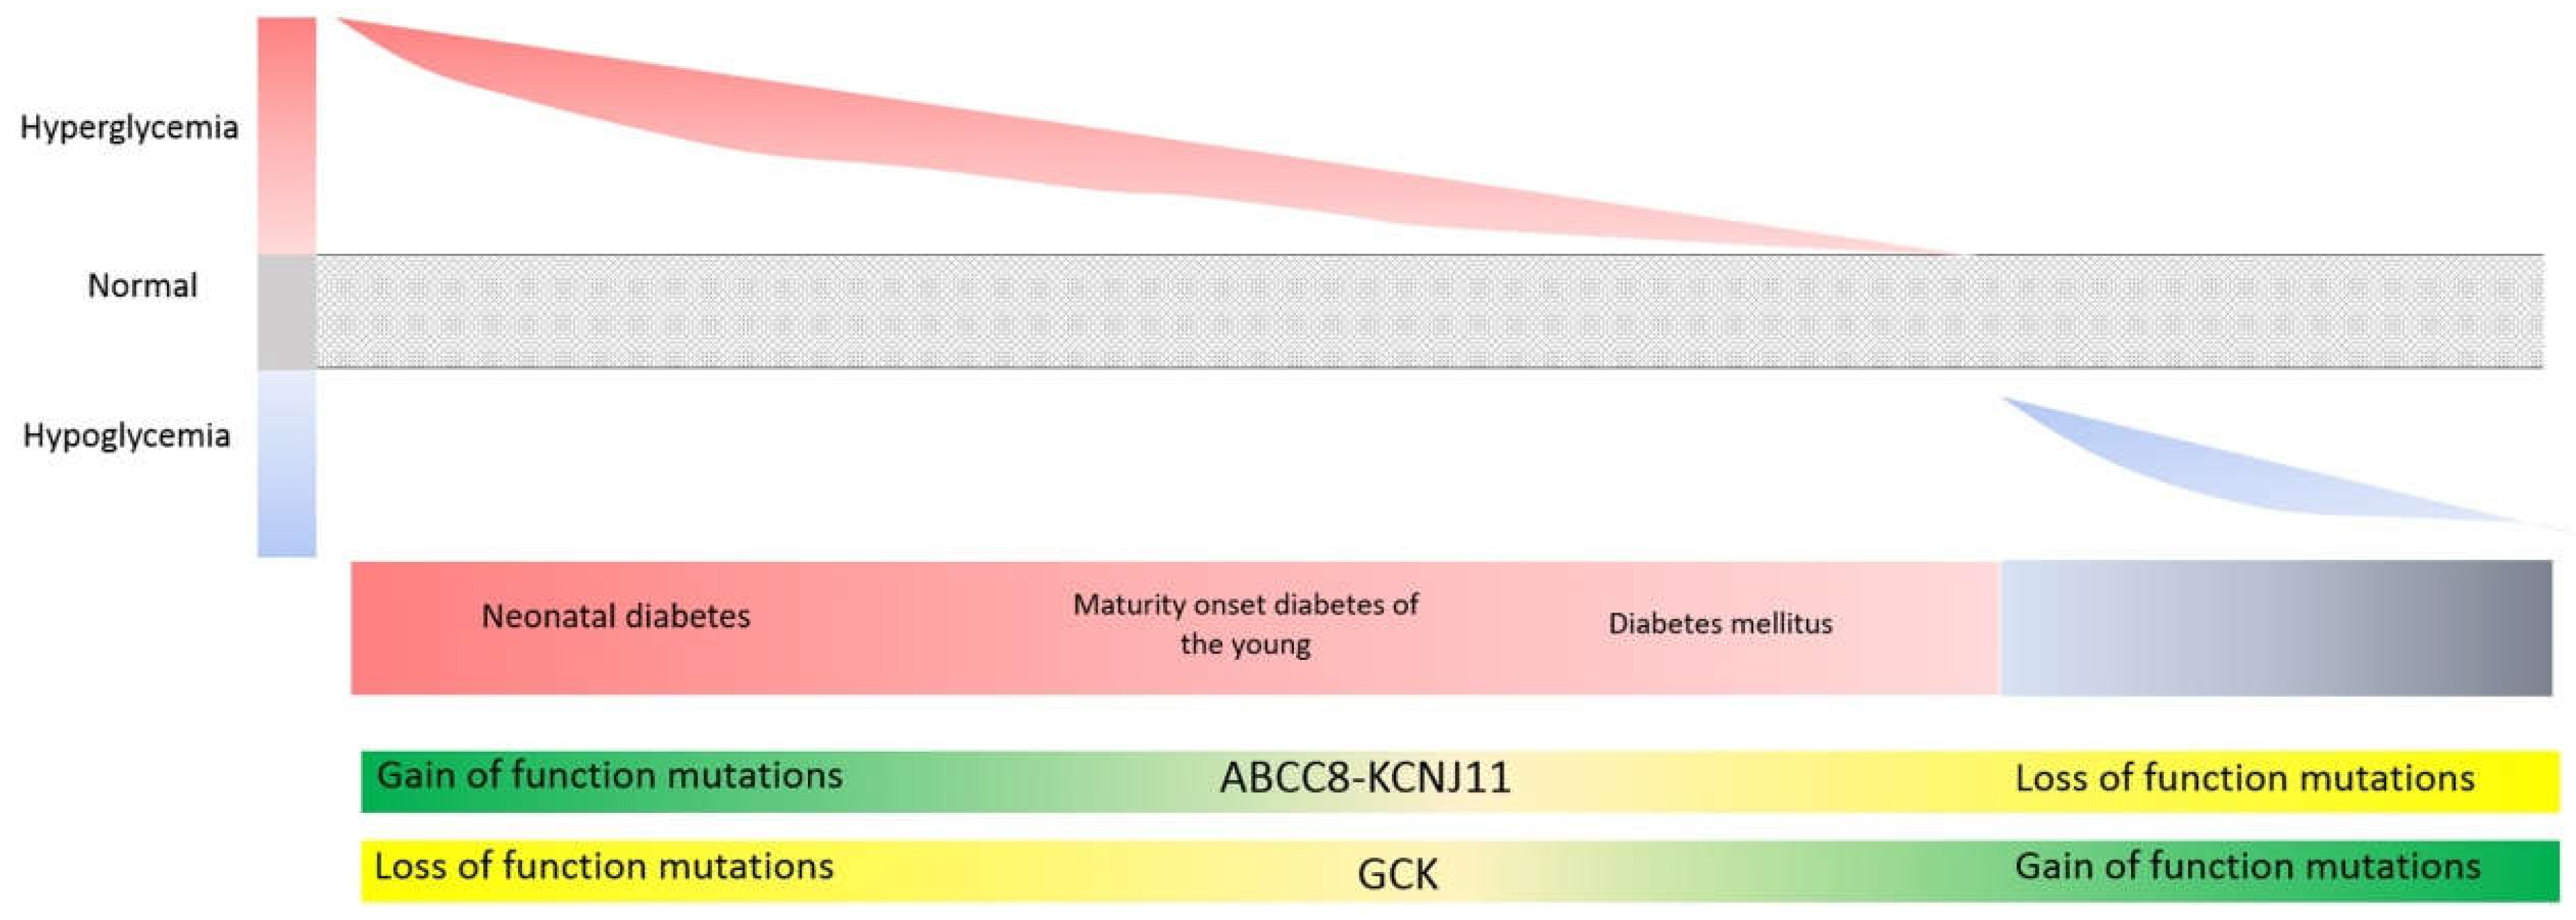
3.5. Genes Involved in Glycemic Control (ABCC8, KCNJ11, GCK, HNF1A, HNF4A): Different Mutation Types (Loss vs. Gain-of-Function) Can Give Rise to Opposing Phenotypes, While Identical Mutations Can Give Rise to Opposing Phenotypes at Different Stages of Life

Here we will discuss a set of genes common to two completely opposing clinical entities: persistent hypoglycemia of infancy, and diabetes of varying severity (ranging from neonatal diabetes to non-insulin dependent diabetes mellitus) (Figure 8). Alterations in the genes ABCC8, KCNJ11, and GCK can result in phenotypes at opposite ends of the glycemic control spectrum (hypoglycemia or hyperglycemia), or alternatively a phenotype corresponding to the middle of the spectrum, resulting in maturity onset diabetes of the young (MODY), transient neonatal diabetes, or diabetes mellitus type II. These genes are involved different aspects of the regulation of glucose or insulin secretion. In the case of HNF1A and HNF4A, the same mutations give rise to hypoglycemia in the neonatal period and hyperglycemia in adulthood.

KATP Potassium Channel

The genes ABCC8 and KCNJ11 encode the two subunits of the ATP-dependent potassium channel (KATP) of pancreatic β cells. This channel couples β-cell metabolism to membrane electrical events, regulating insulin secretion of β cells. Insulin secretion is stimulated by closure of KATP channels, and inhibited by channel opening. Loss-of-function mutations in either of these two genes result in either absence of these channels or in channel closure for longer than normal, causing a pernicious increase in insulin secretion and leading to states of persistent hypoglycemia that are very difficult to control. However, gain-of-function mutations result in opening of the channel for longer than normal, leading to decreased insulin secretion and hyperglycemia.
GCK encodes glucokinase, which catalyzes the first step of glycolysis and is expressed only in the mammalian liver and in the β cells of pancreatic islets. The activity of this enzyme determines the rate of glucose metabolism in the liver and pancreas. The higher the metabolic rate, the greater the increase in intracellular ATP and therefore the higher the level of insulin secretion (via the KATP channel). Decreases in enzyme activity result in corresponding decreases in intracellular ATP levels and insulin secretion. In 1992, loss-of-function variants in this gene were linked to the more frequent and less severe form of MODY-type diabetes [113]. Depending on the extent of loss of function and whether one or two of the alleles are affected, the resulting phenotype can range from severe diabetes that is present from birth to adult-type non-insulin-dependent diabetes mellitus [114,115,116]. A 1998 study [117] first described a gain-of-function variant in GCK in a patient with neonatal hypoglycemia associated with metabolic crisis and loss of consciousness. Other hypoglycemia-associated mutations were subsequently described.
Dominant inactivating mutations in HNF1A and HNF4A have long been associated with MODY3 and MODY1. Recent studies have shown that the phenotype in individuals with these mutations is characterized by hyperinsulinism (HI) early in life that evolves to diabetes in later life [117,118,119]. Cases of diazoxide-responsive HI caused by mutations in HNF1A and HNF4A have been described, with resolution of HI during infancy or in childhood in some cases [120]. The clinical phenotypes were extremely variable. Two children showed evidence of ketone production during hypoglycemia, a biochemical profile atypical for hyperinsulinism. Given the heterogeneous clinical phenotypes of HNF1A-HI and HNF4A-HI, all children with transient, diazoxide-responsive HI without a clear history of perinatal stress should be screened for HNF1A and HNF4A mutations, as the results will help predict the clinical course and determine the subsequent management plan [120].

4. Inheritance

New mutations arise in heterozygotes and, depending on the strength of selection and the demographic history of the population in question, either increase in frequency or are rapidly eliminated [121,122,123,124,125]. Elucidating the relative contributions of the mutation type, natural selection, and genetic drift will help to explain why disease alleles persist in human populations. Answers to these questions are also of practical importance and facilitate the use of genetic variation data to identify additional disease mutations [126].
Knowledge of the mode of inheritance of variants is important when assessing their involvement in a patient’s clinical phenotype. In cases of dominant severe diseases, it is essential to determine whether the detected variant is an inherited or de novo mutation. Similarly, it is essential to determine whether variants detected in a recessive gene are located in opposite alleles before associating them with the disease.
Family-based WGS studies have shown that, on average, 74 germline SNVs occur de novo in an individual’s genome and one de novo mutation per exome [127]. The combination of WES with a patient-parent trio design allows detection of an average of 1.68 de novo mutations per patient, often enabling rapid identification of the gene underlying the patient’s condition [20].
De novo mutations are the most extreme form of rare genetic variation. In general, they are more deleterious than inherited variations; because they have been subjected to less stringent evolutionary selection [128,129]; these mutations are prime candidate causative genes underlying genetic diseases that occur sporadically.
Intolerant dominant genes are those that are most likely to be affected by de novo mutations. Any alterations in a mutation-intolerant gene result in such damage that it cannot perpetuate at the population level; the individual cannot pass it to their offspring because its effects prevent them from reproducing. Therefore, in the most conserved dominant genes, only de novo mutations are associated with pathologies. In fact, in the most extreme cases, only de novo mosaic mutations are allowed. This is because constitutive mutations in certain genes are incompatible with embryonic development, whereas in cases of mosaicism development can occur but is accompanied by very serious diseases, the etiology of which is hard to discern. Examples include McCune-Albright and Maffucci syndrome, and various chromosomal aneuploidy syndromes.
The prominent role of de novo mutations in rare diseases has been revealed in recent years thanks to the use of WES in trios [130]. Sequencing of parent-proband trios with ID [131,132], autism spectrum disorder (ASD) [133,134,135,136,137], schizophrenia (SCZ) [138,139], and epilepsy [21,140,141] suggests that de novo point mutations play an important role in pediatric and adult disorders of brain development.

5. Conclusions

To prioritize any variants detected by NGS analysis of patients with rare diseases, it is important
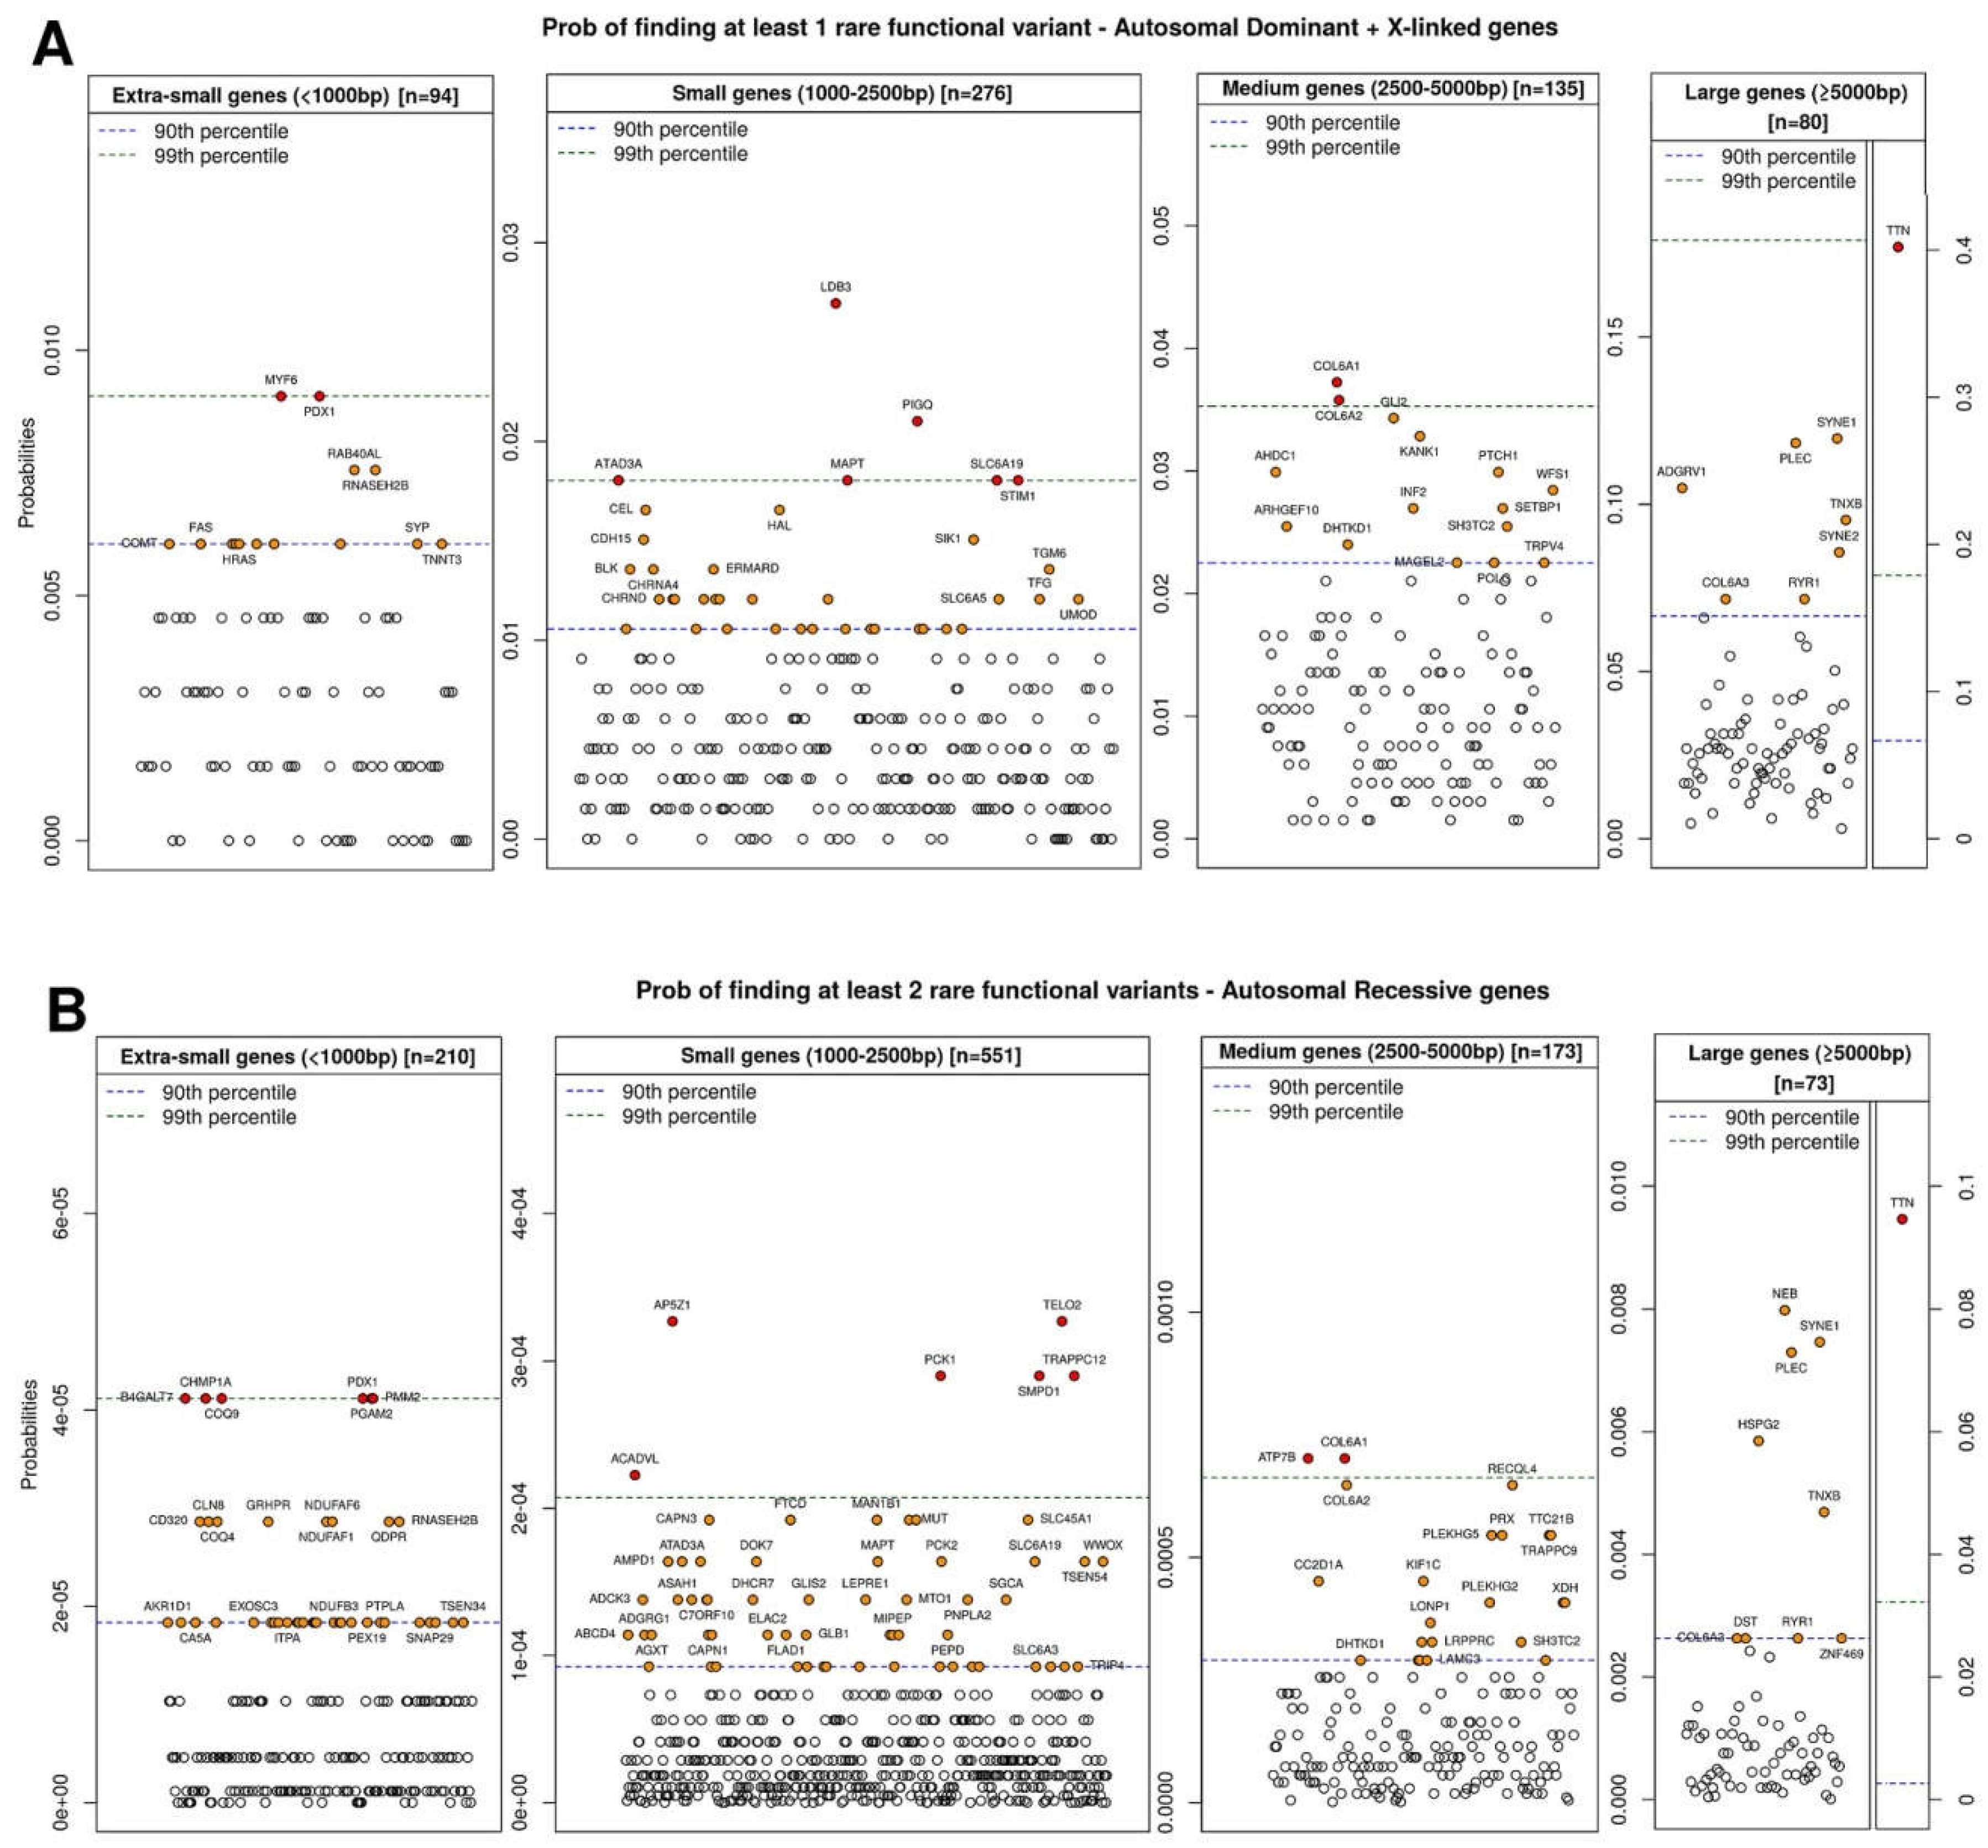
  • to first prioritize genes based on their tolerance to the mutation (z-score) and the a priori probability of finding one (for dominant) or two (for recessive) variants in this gene by chance (proportional to its length);
  • to characterize the mutational architecture of the gene in which the variants are located, i.e., how a given gene behaves in response to damage of different types (loss vs. gain-of-function mutations) or in different locations (e.g., protein domains);
  • to perform familial analyses after variant prioritization in order to determine the mode of inheritance of the variants and assess their pathogenicity.
By following these steps, the list of rare variants detected can be restricted to those most likely to be implicated in the clinical phenotype described, in some cases circumventing the need to perform functional studies.

Acknowledgments

This work was supported by grants from Instituto de Salud Carlos III (PI13/02177; PI17/01294).

Conflicts of Interest

The authors declare no conflict of interest.

References

  1. Tennessen, J.A.; Bigham, A.W.; O’Connor, T.D.; Fu, W.; Kenny, E.E.; Gravel, S.; McGee, S.; Do, R.; Liu, X.; Jun, G.; et al. Exome Sequencing Project Evolution and functional impact of rare coding variation from deep sequencing of human exomes. Science 2012, 337, 64–69. [Google Scholar] [CrossRef] [PubMed]
  2. Kumar, P.; Henikoff, S.; Ng, P.C. Predicting the effects of coding non-synonymous variants on protein function using the SIFT algorithm. Nat. Protoc. 2009, 4, 1073–1081. [Google Scholar] [CrossRef] [PubMed]
  3. Davydov, E.V.; Goode, D.L.; Sirota, M.; Cooper, G.M.; Sidow, A.; Batzoglou, S. Identifying a high fraction of the human genome to be under selective constraint using GERP++. PLoS Comput. Biol. 2010, 6, e1001025. [Google Scholar] [CrossRef] [PubMed]
  4. Adzhubei, I.; Jordan, D.M.; Sunyaev, S.R. Predicting functional effect of human missense mutations using PolyPhen-2. Curr. Protoc. Hum. Genet. 2013. [Google Scholar] [CrossRef] [PubMed]
  5. Shihab, H.A.; Gough, J.; Cooper, D.N.; Stenson, P.D.; Barker, G.L.A.; Edwards, K.J.; Day, I.N.M.; Gaunt, T.R. Predicting the functional, molecular, and phenotypic consequences of amino acid substitutions using hidden Markov models. Hum. Mutat. 2013, 34, 57–65. [Google Scholar] [CrossRef] [PubMed]
  6. Chun, S.; Fay, J.C. Identification of deleterious mutations within three human genomes. Genome Res. 2009, 19, 1553–1561. [Google Scholar] [CrossRef] [PubMed]
  7. Reva, B.; Antipin, Y.; Sander, C. Predicting the functional impact of protein mutations: Application to cancer genomics. Nucleic Acids Res. 2011, 39, e118. [Google Scholar] [CrossRef] [PubMed]
  8. González-Pérez, A.; López-Bigas, N. Improving the assessment of the outcome of nonsynonymous SNVs with a consensus deleteriousness score, Condel. Am. J. Hum. Genet. 2011, 88, 440–449. [Google Scholar] [CrossRef] [PubMed]
  9. Li, M.-X.; Gui, H.-S.; Kwan, J.S.H.; Bao, S.-Y.; Sham, P.C. A comprehensive framework for prioritizing variants in exome sequencing studies of Mendelian diseases. Nucleic Acids Res. 2012, 40, e53. [Google Scholar] [CrossRef] [PubMed]
  10. Kircher, M.; Witten, D.M.; Jain, P.; O’Roak, B.J.; Cooper, G.M.; Shendure, J. A general framework for estimating the relative pathogenicity of human genetic variants. Nat. Genet. 2014, 46, 310–315. [Google Scholar] [CrossRef] [PubMed]
  11. Knecht, C.; Mort, M.; Junge, O.; Cooper, D.N.; Krawczak, M.; Caliebe, A. IMHOTEP-a composite score integrating popular tools for predicting the functional consequences of non-synonymous sequence variants. Nucleic Acids Res. 2017, 45, e13. [Google Scholar] [CrossRef] [PubMed]
  12. Yeo, G.; Burge, C.B. Maximum entropy modeling of short sequence motifs with applications to RNA splicing signals. J. Comput. Biol. 2004, 11, 377–394. [Google Scholar] [CrossRef] [PubMed]
  13. Desmet, F.-O.; Hamroun, D.; Lalande, M.; Collod-Béroud, G.; Claustres, M.; Béroud, C. Human Splicing Finder: An online bioinformatics tool to predict splicing signals. Nucleic Acids Res. 2009, 37, e67. [Google Scholar] [CrossRef] [PubMed]
  14. 1000 Genomes Project Consortium; Abecasis, G.R.; Auton, A.; Brooks, L.D.; DePristo, M.A.; Durbin, R.M.; Handsaker, R.E.; Kang, H.M.; Marth, G.T.; McVean, G.A. An integrated map of genetic variation from 1092 human genomes. Nature 2012, 491, 56–65. [Google Scholar] [CrossRef] [PubMed] [Green Version]
  15. Smith, N.G.C.; Webster, M.T.; Ellegren, H. Deterministic mutation rate variation in the human genome. Genome Res. 2002, 12, 1350–1356. [Google Scholar] [CrossRef] [PubMed]
  16. Nachman, M.W.; Crowell, S.L. Estimate of the mutation rate per nucleotide in humans. Genetics 2000, 156, 297–304. [Google Scholar] [PubMed]
  17. Petrovski, S.; Wang, Q.; Heinzen, E.L.; Allen, A.S.; Goldstein, D.B. Genic intolerance to functional variation and the interpretation of personal genomes. PLoS Genet. 2013, 9, e1003709. [Google Scholar] [CrossRef]
  18. Feng, B.-J. PERCH: A Unified Framework for Disease Gene Prioritization. Hum. Mutat. 2017, 38, 243–251. [Google Scholar] [CrossRef] [PubMed]
  19. Kennedy, B.; Kronenberg, Z.; Hu, H.; Moore, B.; Flygare, S.; Reese, M.G.; Jorde, L.B.; Yandell, M.; Huff, C. Using VAAST to Identify Disease-Associated Variants in Next-Generation Sequencing Data. Curr. Protoc. Hum. Genet. 2014, 81, 6.14.1–6.14.25. [Google Scholar] [CrossRef] [PubMed]
  20. Rauch, A.; Wieczorek, D.; Graf, E.; Wieland, T.; Endele, S.; Schwarzmayr, T.; Albrecht, B.; Bartholdi, D.; Beygo, J.; Di Donato, N.; et al. Range of genetic mutations associated with severe non-syndromic sporadic intellectual disability: An exome sequencing study. Lancet 2012, 380, 1674–1682. [Google Scholar] [CrossRef]
  21. Epi4K Consortium; Epilepsy Phenome/Genome Project; Allen, A.S.; Berkovic, S.F.; Cossette, P.; Delanty, N.; Dlugos, D.; Eichler, E.E.; Epstein, M.P.; Glauser, T.; et al. De novo mutations in epileptic encephalopathies. Nature 2013, 501, 217–221. [Google Scholar] [CrossRef] [PubMed]
  22. LeWinter, M.M.; Granzier, H.L. Titin is a major human disease gene. Circulation 2013, 127, 938–944. [Google Scholar] [CrossRef] [PubMed]
  23. Chauveau, C.; Rowell, J.; Ferreiro, A. A rising titan: TTN review and mutation update. Hum. Mutat. 2014, 35, 1046–1059. [Google Scholar] [CrossRef] [PubMed]
  24. Hackman, P.; Vihola, A.; Haravuori, H.; Marchand, S.; Sarparanta, J.; De Seze, J.; Labeit, S.; Witt, C.; Peltonen, L.; Richard, I.; et al. Tibial muscular dystrophy is a titinopathy caused by mutations in TTN, the gene encoding the giant skeletal-muscle protein titin. Am. J. Hum. Genet. 2002, 71, 492–500. [Google Scholar] [CrossRef] [PubMed]
  25. Pfeffer, G.; Elliott, H.R.; Griffin, H.; Barresi, R.; Miller, J.; Marsh, J.; Evilä, A.; Vihola, A.; Hackman, P.; Straub, V.; et al. Titin mutation segregates with hereditary myopathy with early respiratory failure. Brain 2012, 135, 1695–1713. [Google Scholar] [CrossRef] [PubMed]
  26. Pénisson-Besnier, I.; Hackman, P.; Suominen, T.; Sarparanta, J.; Huovinen, S.; Richard-Crémieux, I.; Udd, B. Myopathies caused by homozygous titin mutations: Limb-girdle muscular dystrophy 2J and variations of phenotype. J. Neurol. Neurosurg. Psychiatry 2010, 81, 1200–1202. [Google Scholar] [CrossRef] [PubMed]
  27. Ceyhan-Birsoy, O.; Agrawal, P.B.; Hidalgo, C.; Schmitz-Abe, K.; DeChene, E.T.; Swanson, L.C.; Soemedi, R.; Vasli, N.; Iannaccone, S.T.; Shieh, P.B.; et al. Recessive truncating titin gene, TTN, mutations presenting as centronuclear myopathy. Neurology 2013, 81, 1205–1214. [Google Scholar] [CrossRef] [PubMed]
  28. Herman, D.S.; Lam, L.; Taylor, M.R.G.; Wang, L.; Teekakirikul, P.; Christodoulou, D.; Conner, L.; DePalma, S.R.; McDonough, B.; Sparks, E.; et al. Truncations of titin causing dilated cardiomyopathy. N. Engl. J. Med. 2012, 366, 619–628. [Google Scholar] [CrossRef] [PubMed]
  29. Chauveau, C.; Bonnemann, C.G.; Julien, C.; Kho, A.L.; Marks, H.; Talim, B.; Maury, P.; Arne-Bes, M.C.; Uro-Coste, E.; Alexandrovich, A.; et al. Recessive TTN truncating mutations define novel forms of core myopathy with heart disease. Hum. Mol. Genet. 2014, 23, 980–991. [Google Scholar] [CrossRef] [PubMed]
  30. Fernández-Marmiesse, A.; Carrascosa-Romero, M.C.; Alfaro Ponce, B.; Nascimento, A.; Ortez, C.; Romero, N.; Palacios, L.; Jimenez-Mallebrera, C.; Jou, C.; Gouveia, S.; et al. Homozygous truncating mutation in prenatally expressed skeletal isoform of TTN gene results in arthrogryposis multiplex congenita and myopathy without cardiac involvement. Neuromuscul. Disord. 2017, 27, 188–192. [Google Scholar] [CrossRef] [PubMed]
  31. Gussow, A.B.; Petrovski, S.; Wang, Q.; Allen, A.S.; Goldstein, D.B. The intolerance to functional genetic variation of protein domains predicts the localization of pathogenic mutations within genes. Genome Biol. 2016, 17, 9. [Google Scholar] [CrossRef] [PubMed]
  32. Wang, H.S.; Pan, Z.; Shi, W.; Brown, B.S.; Wymore, R.S.; Cohen, I.S.; Dixon, J.E.; McKinnon, D. KCNQ2 and KCNQ3 potassium channel subunits: Molecular correlates of the M-channel. Science 1998, 282, 1890–1893. [Google Scholar] [CrossRef] [PubMed]
  33. Biervert, C.; Schroeder, B.C.; Kubisch, C.; Berkovic, S.F.; Propping, P.; Jentsch, T.J.; Steinlein, O.K. A potassium channel mutation in neonatal human epilepsy. Science 1998, 279, 403–406. [Google Scholar] [CrossRef] [PubMed]
  34. Charlier, C.; Singh, N.A.; Ryan, S.G.; Lewis, T.B.; Reus, B.E.; Leach, R.J.; Leppert, M. A pore mutation in a novel KQT-like potassium channel gene in an idiopathic epilepsy family. Nat. Genet. 1998, 18, 53–55. [Google Scholar] [CrossRef] [PubMed]
  35. Singh, N.A.; Charlier, C.; Stauffer, D.; DuPont, B.R.; Leach, R.J.; Melis, R.; Ronen, G.M.; Bjerre, I.; Quattlebaum, T.; Murphy, J.V.; et al. A novel potassium channel gene, KCNQ2, is mutated in an inherited epilepsy of newborns. Nat. Genet. 1998, 18, 25–29. [Google Scholar] [CrossRef] [PubMed]
  36. Kato, M.; Yamagata, T.; Kubota, M.; Arai, H.; Yamashita, S.; Nakagawa, T.; Fujii, T.; Sugai, K.; Imai, K.; Uster, T.; et al. Clinical spectrum of early onset epileptic encephalopathies caused by KCNQ2 mutation. Epilepsia 2013, 54, 1282–1287. [Google Scholar] [CrossRef] [PubMed]
  37. Serino, D.; Specchio, N.; Pontrelli, G.; Vigevano, F.; Fusco, L. Video/EEG findings in a KCNQ2 epileptic encephalopathy: A case report and revision of literature data. Epileptic Disord. 2013, 15, 158–165. [Google Scholar] [CrossRef] [PubMed]
  38. Saitsu, H.; Kato, M.; Koide, A.; Goto, T.; Fujita, T.; Nishiyama, K.; Tsurusaki, Y.; Doi, H.; Miyake, N.; Hayasaka, K.; et al. Whole exome sequencing identifies KCNQ2 mutations in Ohtahara syndrome. Ann. Neurol. 2012, 72, 298–300. [Google Scholar] [CrossRef] [PubMed]
  39. Weckhuysen, S.; Mandelstam, S.; Suls, A.; Audenaert, D.; Deconinck, T.; Claes, L.R.F.; Deprez, L.; Smets, K.; Hristova, D.; Yordanova, I.; et al. KCNQ2 encephalopathy: Emerging phenotype of a neonatal epileptic encephalopathy. Ann. Neurol. 2012, 71, 15–25. [Google Scholar] [CrossRef] [PubMed]
  40. Weckhuysen, S.; Ivanovic, V.; Hendrickx, R.; Van Coster, R.; Hjalgrim, H.; Møller, R.S.; Grønborg, S.; Schoonjans, A.-S.; Ceulemans, B.; Heavin, S.B.; et al. Extending the KCNQ2 encephalopathy spectrum: Clinical and neuroimaging findings in 17 patients. Neurology 2013, 81, 1697–1703. [Google Scholar] [CrossRef] [PubMed]
  41. Filges, I.; Shimojima, K.; Okamoto, N.; Röthlisberger, B.; Weber, P.; Huber, A.R.; Nishizawa, T.; Datta, A.N.; Miny, P.; Yamamoto, T. Reduced expression by SETBP1 haploinsufficiency causes developmental and expressive language delay indicating a phenotype distinct from Schinzel-Giedion syndrome. J. Med. Genet. 2011, 48, 117–122. [Google Scholar] [CrossRef] [PubMed]
  42. Marseglia, G.; Scordo, M.R.; Pescucci, C.; Nannetti, G.; Biagini, E.; Scandurra, V.; Gerundino, F.; Magi, A.; Benelli, M.; Torricelli, F. 372 kb microdeletion in 18q12.3 causing SETBP1 haploinsufficiency associated with mild mental retardation and expressive speech impairment. Eur. J. Med. Genet. 2012, 55, 216–221. [Google Scholar] [CrossRef] [PubMed]
  43. Coe, B.P.; Witherspoon, K.; Rosenfeld, J.A.; van Bon, B.W.M.; Vulto-van Silfhout, A.T.; Bosco, P.; Friend, K.L.; Baker, C.; Buono, S.; Vissers, L.E.L.M.; et al. Refining analyses of copy number variation identifies specific genes associated with developmental delay. Nat. Genet. 2014, 46, 1063–1071. [Google Scholar] [CrossRef] [PubMed]
  44. Hamdan, F.F.; Srour, M.; Capo-Chichi, J.-M.; Daoud, H.; Nassif, C.; Patry, L.; Massicotte, C.; Ambalavanan, A.; Spiegelman, D.; Diallo, O.; et al. De novo mutations in moderate or severe intellectual disability. PLoS Genet. 2014, 10, e1004772. [Google Scholar] [CrossRef] [PubMed]
  45. Hoischen, A.; van Bon, B.W.M.; Gilissen, C.; Arts, P.; van Lier, B.; Steehouwer, M.; de Vries, P.; de Reuver, R.; Wieskamp, N.; Mortier, G.; et al. De novo mutations of SETBP1 cause Schinzel-Giedion syndrome. Nat. Genet. 2010, 42, 483–485. [Google Scholar] [CrossRef] [PubMed]
  46. Piazza, R.; Valletta, S.; Winkelmann, N.; Redaelli, S.; Spinelli, R.; Pirola, A.; Antolini, L.; Mologni, L.; Donadoni, C.; Papaemmanuil, E.; et al. Recurrent SETBP1 mutations in atypical chronic myeloid leukemia. Nat. Genet. 2013, 45, 18–24. [Google Scholar] [CrossRef] [PubMed]
  47. Sakaguchi, H.; Okuno, Y.; Muramatsu, H.; Yoshida, K.; Shiraishi, Y.; Takahashi, M.; Kon, A.; Sanada, M.; Chiba, K.; Tanaka, H.; et al. Exome sequencing identifies secondary mutations of SETBP1 and JAK3 in juvenile myelomonocytic leukemia. Nat. Genet. 2013, 45, 937–941. [Google Scholar] [CrossRef] [PubMed]
  48. Makishima, H.; Yoshida, K.; Nguyen, N.; Przychodzen, B.; Sanada, M.; Okuno, Y.; Ng, K.P.; Gudmundsson, K.O.; Vishwakarma, B.A.; Jerez, A.; et al. Somatic SETBP1 mutations in myeloid malignancies. Nat. Genet. 2013, 45, 942–946. [Google Scholar] [CrossRef] [PubMed]
  49. Hoischen, A.; Krumm, N.; Eichler, E.E. Prioritization of neurodevelopmental disease genes by discovery of new mutations. Nat. Neurosci. 2014, 17, 764–772. [Google Scholar] [CrossRef] [PubMed]
  50. Agha, M.M.; Williams, J.I.; Marrett, L.; To, T.; Zipursky, A.; Dodds, L. Congenital abnormalities and childhood cancer. Cancer 2005, 103, 1939–1948. [Google Scholar] [CrossRef] [PubMed]
  51. Bjørge, T.; Cnattingius, S.; Lie, R.T.; Tretli, S.; Engeland, A. Cancer risk in children with birth defects and in their families: A population based cohort study of 5.2 million children from Norway and Sweden. Cancer Epidemiol. Biomark. Prev. 2008, 17, 500–506. [Google Scholar] [CrossRef] [PubMed]
  52. Merks, J.H.M.; Ozgen, H.M.; Koster, J.; Zwinderman, A.H.; Caron, H.N.; Hennekam, R.C.M. Prevalence and patterns of morphological abnormalities in patients with childhood cancer. JAMA 2008, 299, 61–69. [Google Scholar] [CrossRef] [PubMed]
  53. Durmaz, A.; Durmaz, B.; Kadioglu, B.; Aksoylar, S.; Karapinar, D.; Koturoglu, G.; Orman, M.N.; Ozkinay, F.; Cogulu, O. The Association of minor congenital anomalies and childhood cancer. Pediatr. Blood Cancer 2011, 56, 1098–1102. [Google Scholar] [CrossRef] [PubMed]
  54. Kelleher, F.C.; Fennelly, D.; Rafferty, M. Common critical pathways in embryogenesis and cancer. Acta Oncol. 2006, 45, 375–388. [Google Scholar] [CrossRef] [PubMed]
  55. Acuna-Hidalgo, R.; Sengul, H.; Steehouwer, M.; van de Vorst, M.; Vermeulen, S.H.; Kiemeney, L.A.L.M.; Veltman, J.A.; Gilissen, C.; Hoischen, A. Ultra-sensitive Sequencing Identifies High Prevalence of Clonal Hematopoiesis-Associated Mutations throughout Adult Life. Am. J. Hum. Genet. 2017, 101, 50–64. [Google Scholar] [CrossRef] [PubMed]
  56. Marangi, G.; Ricciardi, S.; Orteschi, D.; Lattante, S.; Murdolo, M.; Dallapiccola, B.; Biscione, C.; Lecce, R.; Chiurazzi, P.; Romano, C.; et al. The Pitt-Hopkins syndrome: Report of 16 new patients and clinical diagnostic criteria. Am. J. Med. Genet. A 2011, 155, 1536–1545. [Google Scholar] [CrossRef] [PubMed]
  57. Whalen, S.; Héron, D.; Gaillon, T.; Moldovan, O.; Rossi, M.; Devillard, F.; Giuliano, F.; Soares, G.; Mathieu-Dramard, M.; Afenjar, A.; et al. Novel comprehensive diagnostic strategy in Pitt-Hopkins syndrome: Clinical score and further delineation of the TCF4 mutational spectrum. Hum. Mutat. 2012, 33, 64–72. [Google Scholar] [CrossRef] [PubMed]
  58. Van Balkom, I.D.C.; Vuijk, P.J.; Franssens, M.; Hoek, H.W.; Hennekam, R.C.M. Development, cognition, and behaviour in Pitt-Hopkins syndrome. Dev. Med. Child Neurol. 2012, 54, 925–931. [Google Scholar] [CrossRef] [PubMed]
  59. Sweatt, J.D. Pitt-Hopkins Syndrome: Intellectual disability due to loss of TCF4-regulated gene transcription. Exp. Mol. Med. 2013, 45, e21. [Google Scholar] [CrossRef] [PubMed]
  60. De Winter, C.F.; Baas, M.; Bijlsma, E.K.; van Heukelingen, J.; Routledge, S.; Hennekam, R.C.M. Phenotype and natural history in 101 individuals with Pitt-Hopkins syndrome through an internet questionnaire system. Orphanet J. Rare Dis. 2016, 11, 37. [Google Scholar] [CrossRef] [PubMed]
  61. Bedeschi, M.F.; Marangi, G.; Calvello, M.R.; Ricciardi, S.; Leone, F.P.C.; Baccarin, M.; Guerneri, S.; Orteschi, D.; Murdolo, M.; Lattante, S.; et al. Impairment of different protein domains causes variable clinical presentation within Pitt-Hopkins syndrome and suggests intragenic molecular syndromology of TCF4. Eur. J. Med. Genet. 2017, 60, 565–571. [Google Scholar] [CrossRef] [PubMed]
  62. Sepp, M.; Kannike, K.; Eesmaa, A.; Urb, M.; Timmusk, T. Functional diversity of human basic helix-loop-helix transcription factor TCF4 isoforms generated by alternative 5′ exon usage and splicing. PLoS ONE 2011, 6, e22138. [Google Scholar] [CrossRef] [PubMed]
  63. Forrest, M.P.; Hill, M.J.; Quantock, A.J.; Martin-Rendon, E.; Blake, D.J. The emerging roles of TCF4 in disease and development. Trends Mol. Med. 2014, 20, 322–331. [Google Scholar] [CrossRef] [PubMed]
  64. Kalscheuer, V.M.; Feenstra, I.; Van Ravenswaaij-Arts, C.M.A.; Smeets, D.F.C.M.; Menzel, C.; Ullmann, R.; Musante, L.; Ropers, H.-H. Disruption of the TCF4 gene in a girl with mental retardation but without the classical Pitt-Hopkins syndrome. Am. J. Med. Genet. A 2008, 146, 2053–2059. [Google Scholar] [CrossRef] [PubMed]
  65. Maduro, V.; Pusey, B.N.; Cherukuri, P.F.; Atkins, P.; du Souich, C.; Rupps, R.; Limbos, M.; Adams, D.R.; Bhatt, S.S.; Eydoux, P.; et al. Complex translocation disrupting TCF4 and altering TCF4 isoform expression segregates as mild autosomal dominant intellectual disability. Orphanet J. Rare Dis. 2016, 11, 62. [Google Scholar] [CrossRef] [PubMed]
  66. Kharbanda, M.; Kannike, K.; Lampe, A.; Berg, J.; Timmusk, T.; Sepp, M. Partial deletion of TCF4 in three generation family with non-syndromic intellectual disability, without features of Pitt-Hopkins syndrome. Eur. J. Med. Genet. 2016, 59, 310–314. [Google Scholar] [CrossRef] [PubMed]
  67. Raffaele Di Barletta, M.; Ricci, E.; Galluzzi, G.; Tonali, P.; Mora, M.; Morandi, L.; Romorini, A.; Voit, T.; Orstavik, K.H.; Merlini, L.; et al. Different mutations in the LMNA gene cause autosomal dominant and autosomal recessive Emery-Dreifuss muscular dystrophy. Am. J. Hum. Genet. 2000, 66, 1407–1412. [Google Scholar] [CrossRef] [PubMed]
  68. Manilal, S.; Recan, D.; Sewry, C.A.; Hoeltzenbein, M.; Llense, S.; Leturcq, F.; Deburgrave, N.; Barbot, J.; Man, N.; Muntoni, F.; et al. Mutations in Emery-Dreifuss muscular dystrophy and their effects on emerin protein expression. Hum. Mol. Genet. 1998, 7, 855–864. [Google Scholar] [CrossRef] [PubMed]
  69. Yates, J.R.; Wehnert, M. The Emery-Dreifuss Muscular Dystrophy Mutation Database. Neuromuscul. Disord. 1999, 9, 199. [Google Scholar] [PubMed]
  70. Brown, C.A.; Lanning, R.W.; McKinney, K.Q.; Salvino, A.R.; Cherniske, E.; Crowe, C.A.; Darras, B.T.; Gominak, S.; Greenberg, C.R.; Grosmann, C.; et al. Novel and recurrent mutations in lamin A/C in patients with Emery-Dreifuss muscular dystrophy. Am. J. Med. Genet. 2001, 102, 359–367. [Google Scholar] [CrossRef] [PubMed]
  71. Muchir, A.; Bonne, G.; van der Kooi, A.J.; van Meegen, M.; Baas, F.; Bolhuis, P.A.; de Visser, M.; Schwartz, K. Identification of mutations in the gene encoding lamins A/C in autosomal dominant limb girdle muscular dystrophy with atrioventricular conduction disturbances (LGMD1B). Hum. Mol. Genet. 2000, 9, 1453–1459. [Google Scholar] [CrossRef] [PubMed]
  72. Jacob, K.N.; Garg, A. Laminopathies: Multisystem dystrophy syndromes. Mol. Genet. Metab. 2006, 87, 289–302. [Google Scholar] [CrossRef] [PubMed]
  73. Todorova, A.; Halliger-Keller, B.; Walter, M.C.; Dabauvalle, M.-C.; Lochmüller, H.; Müller, C.R. A synonymous codon change in the LMNA gene alters mRNA splicing and causes limb girdle muscular dystrophy type 1B. J. Med. Genet. 2003, 40, e115. [Google Scholar] [CrossRef] [PubMed]
  74. Fatkin, D.; MacRae, C.; Sasaki, T.; Wolff, M.R.; Porcu, M.; Frenneaux, M.; Atherton, J.; Vidaillet, H.J.; Spudich, S.; De Girolami, U.; et al. Missense mutations in the rod domain of the lamin A/C gene as causes of dilated cardiomyopathy and conduction-system disease. N. Engl. J. Med. 1999, 341, 1715–1724. [Google Scholar] [CrossRef] [PubMed]
  75. Brodsky, G.L.; Muntoni, F.; Miocic, S.; Sinagra, G.; Sewry, C.; Mestroni, L. Lamin A/C gene mutation associated with dilated cardiomyopathy with variable skeletal muscle involvement. Circulation 2000, 101, 473–476. [Google Scholar] [CrossRef] [PubMed]
  76. Quijano-Roy, S.; Mbieleu, B.; Bönnemann, C.G.; Jeannet, P.-Y.; Colomer, J.; Clarke, N.F.; Cuisset, J.-M.; Roper, H.; De Meirleir, L.; D’Amico, A.; et al. De novo LMNA mutations cause a new form of congenital muscular dystrophy. Ann. Neurol. 2008, 64, 177–186. [Google Scholar] [CrossRef] [PubMed]
  77. Makri, S.; Clarke, N.F.; Richard, P.; Maugenre, S.; Demay, L.; Bonne, G.; Guicheney, P. Germinal mosaicism for LMNA mimics autosomal recessive congenital muscular dystrophy. Neuromuscul. Disord. 2009, 19, 26–28. [Google Scholar] [CrossRef] [PubMed]
  78. Renou, L.; Stora, S.; Yaou, R.B.; Volk, M.; Sinkovec, M.; Demay, L.; Richard, P.; Peterlin, B.; Bonne, G. Heart-hand syndrome of Slovenian type: A new kind of laminopathy. J. Med. Genet. 2008, 45, 666–671. [Google Scholar] [CrossRef] [PubMed]
  79. Dunnigan, M.G.; Cochrane, M.A.; Kelly, A.; Scott, J.W. Familial lipoatrophic diabetes with dominant transmission. A new syndrome. Q. J. Med. 1974, 43, 33–48. [Google Scholar] [PubMed]
  80. Cao, H.; Hegele, R.A. Nuclear lamin A/C R482Q mutation in canadian kindreds with Dunnigan-type familial partial lipodystrophy. Hum. Mol. Genet. 2000, 9, 109–112. [Google Scholar] [CrossRef] [PubMed]
  81. Shackleton, S.; Lloyd, D.J.; Jackson, S.N.; Evans, R.; Niermeijer, M.F.; Singh, B.M.; Schmidt, H.; Brabant, G.; Kumar, S.; Durrington, P.N.; et al. LMNA, encoding lamin A/C, is mutated in partial lipodystrophy. Nat. Genet. 2000, 24, 153–156. [Google Scholar] [CrossRef] [PubMed]
  82. Speckman, R.A.; Garg, A.; Du, F.; Bennett, L.; Veile, R.; Arioglu, E.; Taylor, S.I.; Lovett, M.; Bowcock, A.M. Mutational and haplotype analyses of families with familial partial lipodystrophy (Dunnigan variety) reveal recurrent missense mutations in the globular C-terminal domain of lamin A/C. Am. J. Hum. Genet. 2000, 66, 1192–1198. [Google Scholar] [CrossRef] [PubMed]
  83. Dhe-Paganon, S.; Werner, E.D.; Chi, Y.-I.; Shoelson, S.E. Structure of the globular tail of nuclear lamin. J. Biol. Chem. 2002, 277, 17381–17384. [Google Scholar] [CrossRef] [PubMed]
  84. Krimm, I.; Ostlund, C.; Gilquin, B.; Couprie, J.; Hossenlopp, P.; Mornon, J.-P.; Bonne, G.; Courvalin, J.-C.; Worman, H.J.; Zinn-Justin, S. The Ig-like structure of the C-terminal domain of lamin A/C, mutated in muscular dystrophies, cardiomyopathy, and partial lipodystrophy. Structure 2002, 10, 811–823. [Google Scholar] [CrossRef]
  85. De Sandre-Giovannoli, A.; Chaouch, M.; Kozlov, S.; Vallat, J.-M.; Tazir, M.; Kassouri, N.; Szepetowski, P.; Hammadouche, T.; Vandenberghe, A.; Stewart, C.L.; et al. Homozygous defects in LMNA, encoding lamin A/C nuclear-envelope proteins, cause autosomal recessive axonal neuropathy in human (Charcot-Marie-Tooth disorder type 2) and mouse. Am. J. Hum. Genet. 2002, 70, 726–736. [Google Scholar] [CrossRef] [PubMed]
  86. Tazir, M.; Azzedine, H.; Assami, S.; Sindou, P.; Nouioua, S.; Zemmouri, R.; Hamadouche, T.; Chaouch, M.; Feingold, J.; Vallat, J.M.; et al. Phenotypic variability in autosomal recessive axonal Charcot-Marie-Tooth disease due to the R298C mutation in lamin A/C. Brain 2004, 127, 154–163. [Google Scholar] [CrossRef] [PubMed]
  87. Chaouch, M.; Allal, Y.; De Sandre-Giovannoli, A.; Vallat, J.M.; Amer-el-Khedoud, A.; Kassouri, N.; Chaouch, A.; Sindou, P.; Hammadouche, T.; Tazir, M.; et al. The phenotypic manifestations of autosomal recessive axonal Charcot-Marie-Tooth due to a mutation in Lamin A/C gene. Neuromuscul. Disord. 2003, 13, 60–67. [Google Scholar] [CrossRef]
  88. Novelli, G.; Muchir, A.; Sangiuolo, F.; Helbling-Leclerc, A.; D’Apice, M.R.; Massart, C.; Capon, F.; Sbraccia, P.; Federici, M.; Lauro, R.; et al. Mandibuloacral dysplasia is caused by a mutation in LMNA-encoding lamin A/C. Am. J. Hum. Genet. 2002, 71, 426–431. [Google Scholar] [CrossRef] [PubMed]
  89. Garg, A.; Cogulu, O.; Ozkinay, F.; Onay, H.; Agarwal, A.K. A novel homozygous Ala529Val LMNA mutation in Turkish patients with mandibuloacral dysplasia. J. Clin. Endocrinol. Metab. 2005, 90, 5259–5264. [Google Scholar] [CrossRef] [PubMed]
  90. Agarwal, A.K.; Kazachkova, I.; Ten, S.; Garg, A. Severe mandibuloacral dysplasia-associated lipodystrophy and progeria in a young girl with a novel homozygous Arg527Cys LMNA mutation. J. Clin. Endocrinol. Metab. 2008, 93, 4617–4623. [Google Scholar] [CrossRef] [PubMed]
  91. Agarwal, A.K.; Fryns, J.-P.; Auchus, R.J.; Garg, A. Zinc metalloproteinase, ZMPSTE24, is mutated in mandibuloacral dysplasia. Hum. Mol. Genet. 2003, 12, 1995–2001. [Google Scholar] [CrossRef] [PubMed]
  92. Filesi, I.; Gullotta, F.; Lattanzi, G.; D’Apice, M.R.; Capanni, C.; Nardone, A.M.; Columbaro, M.; Scarano, G.; Mattioli, E.; Sabatelli, P.; et al. Alterations of nuclear envelope and chromatin organization in mandibuloacral dysplasia, a rare form of laminopathy. Physiol. Genom. 2005, 23, 150–158. [Google Scholar] [CrossRef] [PubMed]
  93. Hutchinson, J. Illustrations of Exceptional Symptoms and Examples of Rare Forms of Disease. Br. Med. J. 1886, 2, 148–149. [Google Scholar] [CrossRef] [PubMed]
  94. McKusick, V.A. The clinical observations of Jonathan Hutchinson. Am. J. Syph. Gonorrhea Vener. Dis. 1952, 36, 101–126. [Google Scholar] [PubMed]
  95. DeBusk, F.L. The Hutchinson-Gilford progeria syndrome. Report of 4 cases and review of the literature. J. Pediatr. 1972, 80, 697–724. [Google Scholar] [CrossRef]
  96. Merideth, M.A.; Gordon, L.B.; Clauss, S.; Sachdev, V.; Smith, A.C.M.; Perry, M.B.; Brewer, C.C.; Zalewski, C.; Kim, H.J.; Solomon, B.; et al. Phenotype and course of Hutchinson-Gilford progeria syndrome. N. Engl. J. Med. 2008, 358, 592–604. [Google Scholar] [CrossRef] [PubMed]
  97. Eriksson, M.; Brown, W.T.; Gordon, L.B.; Glynn, M.W.; Singer, J.; Scott, L.; Erdos, M.R.; Robbins, C.M.; Moses, T.Y.; Berglund, P.; et al. Recurrent de novo point mutations in lamin A cause Hutchinson-Gilford progeria syndrome. Nature 2003, 423, 293–298. [Google Scholar] [CrossRef] [PubMed]
  98. Chen, L.; Lee, L.; Kudlow, B.A.; Dos Santos, H.G.; Sletvold, O.; Shafeghati, Y.; Botha, E.G.; Garg, A.; Hanson, N.B.; Martin, G.M.; et al. LMNA mutations in atypical Werner’s syndrome. Lancet 2003, 362, 440–445. [Google Scholar] [CrossRef]
  99. Csoka, A.B.; English, S.B.; Simkevich, C.P.; Ginzinger, D.G.; Butte, A.J.; Schatten, G.P.; Rothman, F.G.; Sedivy, J.M. Genome-scale expression profiling of Hutchinson-Gilford progeria syndrome reveals widespread transcriptional misregulation leading to mesodermal/mesenchymal defects and accelerated atherosclerosis. Aging Cell 2004, 3, 235–243. [Google Scholar] [CrossRef] [PubMed]
  100. Verstraeten, V.L.R.M.; Broers, J.L.V.; van Steensel, M.A.M.; Zinn-Justin, S.; Ramaekers, F.C.S.; Steijlen, P.M.; Kamps, M.; Kuijpers, H.J.H.; Merckx, D.; Smeets, H.J.M.; et al. Compound heterozygosity for mutations in LMNA causes a progeria syndrome without prelamin A accumulation. Hum. Mol. Genet. 2006, 15, 2509–2522. [Google Scholar] [CrossRef] [PubMed]
  101. Nguyen, D.; Leistritz, D.F.; Turner, L.; MacGregor, D.; Ohson, K.; Dancey, P.; Martin, G.M.; Oshima, J. Collagen expression in fibroblasts with a novel LMNA mutation. Biochem. Biophys. Res. Commun. 2007, 352, 603–608. [Google Scholar] [CrossRef] [PubMed]
  102. McPherson, E.; Turner, L.; Zador, I.; Reynolds, K.; Macgregor, D.; Giampietro, P.F. Ovarian failure and dilated cardiomyopathy due to a novel lamin mutation. Am. J. Med. Genet. A 2009, 149, 567–572. [Google Scholar] [CrossRef] [PubMed]
  103. Malouf, J.; Alam, S.; Kanj, H.; Mufarrij, A.; Der Kaloustian, V.M. Hypergonadotropic hypogonadism with congestive cardiomyopathy: An autosomal-recessive disorder? Am. J. Med. Genet. 1985, 20, 483–489. [Google Scholar] [CrossRef] [PubMed]
  104. Navarro, C.L.; De Sandre-Giovannoli, A.; Bernard, R.; Boccaccio, I.; Boyer, A.; Geneviève, D.; Hadj-Rabia, S.; Gaudy-Marqueste, C.; Smitt, H.S.; Vabres, P.; et al. Lamin A and ZMPSTE24 (FACE-1) defects cause nuclear disorganization and identify restrictive dermopathy as a lethal neonatal laminopathy. Hum. Mol. Genet. 2004, 13, 2493–2503. [Google Scholar] [CrossRef] [PubMed]
  105. Navarro, C.L.; Cadiñanos, J.; De Sandre-Giovannoli, A.; Bernard, R.; Courrier, S.; Boccaccio, I.; Boyer, A.; Kleijer, W.J.; Wagner, A.; Giuliano, F.; et al. Loss of ZMPSTE24 (FACE-1) causes autosomal recessive restrictive dermopathy and accumulation of Lamin A precursors. Hum. Mol. Genet. 2005, 14, 1503–1513. [Google Scholar] [CrossRef] [PubMed]
  106. Lombardi, F.; Gullotta, F.; Columbaro, M.; Filareto, A.; D’Adamo, M.; Vielle, A.; Guglielmi, V.; Nardone, A.M.; Azzolini, V.; Grosso, E.; et al. Compound heterozygosity for mutations in LMNA in a patient with a myopathic and lipodystrophic mandibuloacral dysplasia type A phenotype. J. Clin. Endocrinol. Metab. 2007, 92, 4467–4471. [Google Scholar] [CrossRef] [PubMed]
  107. Liang, J.J.; Grogan, M.; Ackerman, M.J. LMNA-Mediated Arrhythmogenic Right Ventricular Cardiomyopathy and Charcot-Marie-Tooth Type 2B1: A Patient-Discovered Unifying Diagnosis. J. Cardiovasc. Electrophysiol. 2016, 27, 868–871. [Google Scholar] [CrossRef] [PubMed]
  108. Iwahara, N.; Hisahara, S.; Hayashi, T.; Kawamata, J.; Shimohama, S. A novel lamin A/C gene mutation causing spinal muscular atrophy phenotype with cardiac involvement: Report of one case. BMC Neurol. 2015, 15, 13. [Google Scholar] [CrossRef] [PubMed]
  109. Worman, H.J.; Bonne, G. “Laminopathies”: A wide spectrum of human diseases. Exp. Cell Res. 2007, 313, 2121–2133. [Google Scholar] [CrossRef] [PubMed]
  110. Wiesel, N.; Mattout, A.; Melcer, S.; Melamed-Book, N.; Herrmann, H.; Medalia, O.; Aebi, U.; Gruenbaum, Y. Laminopathic mutations interfere with the assembly, localization, and dynamics of nuclear lamins. Proc. Natl. Acad. Sci. USA 2008, 105, 180–185. [Google Scholar] [CrossRef] [PubMed]
  111. Shimi, T.; Butin-Israeli, V.; Adam, S.A.; Goldman, R.D. Nuclear lamins in cell regulation and disease. Cold Spring Harb. Symp. Quant. Biol. 2010, 75, 525–531. [Google Scholar] [CrossRef] [PubMed]
  112. Dubinska-Magiera, M.; Zaremba-Czogalla, M.; Rzepecki, R. Muscle development, regeneration and laminopathies: How lamins or lamina-associated proteins can contribute to muscle development, regeneration and disease. Cell. Mol. Life Sci. 2013, 70, 2713–2741. [Google Scholar] [CrossRef] [PubMed]
  113. Stoffel, M.; Froguel, P.; Takeda, J.; Zouali, H.; Vionnet, N.; Nishi, S.; Weber, I.T.; Harrison, R.W.; Pilkis, S.J.; Lesage, S. Human glucokinase gene: Isolation, characterization, and identification of two missense mutations linked to early-onset non-insulin-dependent (type 2) diabetes mellitus. Proc. Natl. Acad. Sci. USA 1992, 89, 7698–7702. [Google Scholar] [CrossRef] [PubMed]
  114. Thornton, P.S.; Satin-Smith, M.S.; Herold, K.; Glaser, B.; Chiu, K.C.; Nestorowicz, A.; Permutt, M.A.; Baker, L.; Stanley, C.A. Familial hyperinsulinism with apparent autosomal dominant inheritance: Clinical and genetic differences from the autosomal recessive variant. J. Pediatr. 1998, 132, 9–14. [Google Scholar] [CrossRef]
  115. Glaser, B.; Kesavan, P.; Heyman, M.; Davis, E.; Cuesta, A.; Buchs, A.; Stanley, C.A.; Thornton, P.S.; Permutt, M.A.; Matschinsky, F.M.; et al. Familial hyperinsulinism caused by an activating glucokinase mutation. N. Engl. J. Med. 1998, 338, 226–230. [Google Scholar] [CrossRef] [PubMed]
  116. Njølstad, P.R.; Søvik, O.; Cuesta-Muñoz, A.; Bjørkhaug, L.; Massa, O.; Barbetti, F.; Undlien, D.E.; Shiota, C.; Magnuson, M.A.; Molven, A.; et al. Neonatal diabetes mellitus due to complete glucokinase deficiency. N. Engl. J. Med. 2001, 344, 1588–1592. [Google Scholar] [CrossRef] [PubMed]
  117. Pearson, E.R.; Boj, S.F.; Steele, A.M.; Barrett, T.; Stals, K.; Shield, J.P.; Ellard, S.; Ferrer, J.; Hattersley, A.T. Macrosomia and hyperinsulinaemic hypoglycaemia in patients with heterozygous mutations in the HNF4A gene. PLoS Med. 2007, 4, e118. [Google Scholar] [CrossRef] [PubMed]
  118. Kapoor, R.R.; Locke, J.; Colclough, K.; Wales, J.; Conn, J.J.; Hattersley, A.T.; Ellard, S.; Hussain, K. Persistent hyperinsulinemic hypoglycemia and maturity-onset diabetes of the young due to heterozygous HNF4A mutations. Diabetes 2008, 57, 1659–1663. [Google Scholar] [CrossRef] [PubMed]
  119. Stanescu, D.E.; Hughes, N.; Kaplan, B.; Stanley, C.A.; De León, D.D. Novel presentations of congenital hyperinsulinism due to mutations in the MODY genes: HNF1A and HNF4A. J. Clin. Endocrinol. Metab. 2012, 97, E2026–E2030. [Google Scholar] [CrossRef] [PubMed]
  120. Tung, J.Y.-L.; Boodhansingh, K.; Stanley, C.A.; De León, D.D. Clinical heterogeneity of hyperinsulinism due to HNF1A and HNF4A mutations. Pediatr. Diabetes 2018. [Google Scholar] [CrossRef] [PubMed]
  121. Simons, Y.B.; Turchin, M.C.; Pritchard, J.K.; Sella, G. The deleterious mutation load is insensitive to recent population history. Nat. Genet. 2014, 46, 220–224. [Google Scholar] [CrossRef] [PubMed]
  122. Simons, Y.B.; Sella, G. The impact of recent population history on the deleterious mutation load in humans and close evolutionary relatives. Curr. Opin. Genet. Dev. 2016, 41, 150–158. [Google Scholar] [CrossRef] [PubMed]
  123. Nei, M. The frequency distribution of lethal chromosomes in finite populations. Proc. Natl. Acad. Sci. USA 1968, 60, 517–524. [Google Scholar] [CrossRef] [PubMed]
  124. Brandvain, Y.; Wright, S.I. The Limits of Natural Selection in a Nonequilibrium World. Trends Genet. 2016, 32, 201–210. [Google Scholar] [CrossRef] [PubMed]
  125. Balick, D.J.; Do, R.; Cassa, C.A.; Reich, D.; Sunyaev, S.R. Dominance of Deleterious Alleles Controls the Response to a Population Bottleneck. PLoS Genet. 2015, 11, e1005436. [Google Scholar] [CrossRef] [PubMed]
  126. Beauchamp, K.A.; Muzzey, D.; Wong, K.K.; Hogan, G.J.; Karimi, K.; Candille, S.I.; Mehta, N.; Mar-Heyming, R.; Kaseniit, K.E.; Kang, H.P.; et al. Systematic design and comparison of expanded carrier screening panels. Genet. Med. 2018, 20, 55–63. [Google Scholar] [CrossRef] [PubMed]
  127. Conrad, D.F.; Keebler, J.E.M.; DePristo, M.A.; Lindsay, S.J.; Zhang, Y.; Casals, F.; Idaghdour, Y.; Hartl, C.L.; Torroja, C.; Garimella, K.V.; et al. Variation in genome-wide mutation rates within and between human families. Nat. Genet. 2011, 43, 712–714. [Google Scholar] [CrossRef] [PubMed]
  128. Crow, J.F. The origins, patterns and implications of human spontaneous mutation. Nat. Rev. Genet. 2000, 1, 40–47. [Google Scholar] [CrossRef] [PubMed]
  129. Eyre-Walker, A.; Keightley, P.D. The distribution of fitness effects of new mutations. Nat. Rev. Genet. 2007, 8, 610–618. [Google Scholar] [CrossRef] [PubMed]
  130. Veltman, J.A.; Brunner, H.G. De novo mutations in human genetic disease. Nat. Rev. Genet. 2012, 13, 565–575. [Google Scholar] [CrossRef] [PubMed]
  131. Vissers, L.E.L.M.; de Ligt, J.; Gilissen, C.; Janssen, I.; Steehouwer, M.; de Vries, P.; van Lier, B.; Arts, P.; Wieskamp, N.; del Rosario, M.; et al. A de novo paradigm for mental retardation. Nat. Genet. 2010, 42, 1109–1112. [Google Scholar] [CrossRef] [PubMed]
  132. De Ligt, J.; Willemsen, M.H.; van Bon, B.W.M.; Kleefstra, T.; Yntema, H.G.; Kroes, T.; Vulto-van Silfhout, A.T.; Koolen, D.A.; de Vries, P.; Gilissen, C.; et al. Diagnostic exome sequencing in persons with severe intellectual disability. N. Engl. J. Med. 2012, 367, 1921–1929. [Google Scholar] [CrossRef] [PubMed]
  133. O’Roak, B.J.; Deriziotis, P.; Lee, C.; Vives, L.; Schwartz, J.J.; Girirajan, S.; Karakoc, E.; Mackenzie, A.P.; Ng, S.B.; Baker, C.; et al. Exome sequencing in sporadic autism spectrum disorders identifies severe de novo mutations. Nat. Genet. 2011, 43, 585–589. [Google Scholar] [CrossRef] [PubMed]
  134. Jiang, Y.; Yuen, R.K.C.; Jin, X.; Wang, M.; Chen, N.; Wu, X.; Ju, J.; Mei, J.; Shi, Y.; He, M.; et al. Detection of clinically relevant genetic variants in autism spectrum disorder by whole-genome sequencing. Am. J. Hum. Genet. 2013, 93, 249–263. [Google Scholar] [CrossRef] [PubMed]
  135. O’Roak, B.J.; Stessman, H.A.; Boyle, E.A.; Witherspoon, K.T.; Martin, B.; Lee, C.; Vives, L.; Baker, C.; Hiatt, J.B.; Nickerson, D.A.; et al. Recurrent de novo mutations implicate novel genes underlying simplex autism risk. Nat. Commun. 2014, 5, 5595. [Google Scholar] [CrossRef] [PubMed]
  136. Sanders, S.J.; Murtha, M.T.; Gupta, A.R.; Murdoch, J.D.; Raubeson, M.J.; Willsey, A.J.; Ercan-Sencicek, A.G.; DiLullo, N.M.; Parikshak, N.N.; Stein, J.L.; et al. De novo mutations revealed by whole-exome sequencing are strongly associated with autism. Nature 2012, 485, 237–241. [Google Scholar] [CrossRef] [PubMed]
  137. Neale, B.M.; Kou, Y.; Liu, L.; Ma’ayan, A.; Samocha, K.E.; Sabo, A.; Lin, C.-F.; Stevens, C.; Wang, L.-S.; Makarov, V.; et al. Patterns and rates of exonic de novo mutations in autism spectrum disorders. Nature 2012, 485, 242–245. [Google Scholar] [CrossRef] [PubMed] [Green Version]
  138. Xu, B.; Roos, J.L.; Dexheimer, P.; Boone, B.; Plummer, B.; Levy, S.; Gogos, J.A.; Karayiorgou, M. Exome sequencing supports a de novo mutational paradigm for schizophrenia. Nat. Genet. 2011, 43, 864–868. [Google Scholar] [CrossRef] [PubMed]
  139. Girard, S.L.; Gauthier, J.; Noreau, A.; Xiong, L.; Zhou, S.; Jouan, L.; Dionne-Laporte, A.; Spiegelman, D.; Henrion, E.; Diallo, O.; et al. Increased exonic de novo mutation rate in individuals with schizophrenia. Nat. Genet. 2011, 43, 860–863. [Google Scholar] [CrossRef] [PubMed]
  140. EuroEPINOMICS-RES Consortium; Epilepsy Phenome/Genome Project; Epi4K Consortium. De novo mutations in synaptic transmission genes including DNM1 cause epileptic encephalopathies. Am. J. Hum. Genet. 2014, 95, 360–370. [Google Scholar] [CrossRef]
  141. Hamdan, F.F.; Myers, C.T.; Cossette, P.; Lemay, P.; Spiegelman, D.; Laporte, A.D.; Nassif, C.; Diallo, O.; Monlong, J.; Cadieux-Dion, M.; et al. High Rate of Recurrent De Novo Mutations in Developmental and Epileptic Encephalopathies. Am. J. Hum. Genet. 2017, 101, 664–685. [Google Scholar] [CrossRef] [PubMed]
Figure 1. (A) Regression of number of common exonic variants (GMAF > 0.5%) against gene length for each of the 1670 genes analyzed; (B) Regression of number of common functional variants (all but synonymous, GMAF > 0.5%) against gene length for each gene; (C) Regression of number of non-synonymous common variants against number of non-synonymous and synonymous common variants (GMAF > 0.5%) for each gene; (D) z-score values for all analyzed genes.
Ijms 19 01584 g001aIjms 19 01584 g001b
Figure 2. Boxplot (without outliers) of z-score values according to gene inheritance. AD: autosomal dominant; AR: autosomal recessive; X-linked.
Ijms 19 01584 g002
Figure 3. (A) Probability of finding at least one rare functional variant (all but synonymous, GMAF < 0.5%) in autosomal dominant and X-linked genes, grouped by gene length: extra-small genes (<1000 bp), small genes (1000–2500 bp), medium genes (2500–5000 bp), and large genes (>5000 bp). (B) Probability of finding at least two rare functional variants (all but synonymous, GMAF < 0.5%) in autosomal recessive genes, grouped by gene length.
Ijms 19 01584 g003
Figure 4. (A) Boxplot of GERP (Genomic Evolutionary Rate Profiling) values according to common (GMAF > 0.5%) and rare (GMAF < 0.5%) exonic variants. (B) Boxplot of non-synonymous/synonymous ratio values of each gene according to: common (GMAF > 0.5%), rare (GMAF < 0.5%), and highly conserved rare variants (GMAF < 0.5%, GERP > 2).
Ijms 19 01584 g004
Figure 5. Structure of SETBP1 and sites of pathogenic mutations associated with Schinzel-Giedion syndrome and mental retardation.
Ijms 19 01584 g005
Figure 6. Structure of TCF4 and locations of pathogenic mutations registered in ClinVar. AD1, first activation domain; AD2, second activation domain (AD1 and AD2 modulate transcriptional activity); NLS, nuclear localization signal (controls subcellular localization); bHLH, basic helix-loop-helix.
Ijms 19 01584 g006
Figure 7. (A) Phenotypic spectrum of laminopathies and the different tissues affected. (B) Location of pathogenic mutations associated with different LMNA phenotypes.
Ijms 19 01584 g007
Figure 8. Phenotypic spectrum associated with mutations in genes involved in insulin secretion; ABCC8, KCNJ11, and GCK.
Ijms 19 01584 g008
Table 1. List of the five most mutation-tolerant (>z-score) and mutation-intolerant (<z-score) of the 1670 genes associated with metabolic and neurological disorders for the four gene length ranges.
Most Intolerant GenesMost Tolerant Genes
Genez-ScoreGenez-Score
<1000 bp<1000 bp
COLEC11−1.377098TM4SF202.215303
CAV3−1.024795TMEM702.215303
CHCHD10−1.024795COQ41.797098
FAS−1.024795HACD11.797098
MRTO4−1.024795NDUFAF11.41199
1000–2500 bp1000–2500 bp
ACTG1−2.953587TSEN543.541998
CHRNA4−2.953587CHAT3.120652
SDHA−2.889489WWOX2.700392
ADCK3−2.566604TCN22.667196
BRF1−2.180352ASAH12.634213
2500–5000 bp2500–5000 bp
INSR−4.872409KIAA05563.154369
TRAPPC9−4.51124VWA3B2.667196
GRIN2B−3.730224MOGS2.634213
HECW2−2.953587CNTN22.347576
MAGI2−2.953587RECQL42.347576
>5000 bp>5000 bp
RYR1−10.002224TTN24.20914
COL6A3−4.54985SYNE28.331247
FLNC−4.448544TNXB7.571299
WDR81−4.025886ADGRV16.627985
PLEC−3.909057CENPF6.455138
Table 2. Dominant (left) and recessive (right) genes for which the probability of finding one or two variants, respectively, was the lowest for the four different gene length sections. Red, genes associated with metabolism; green, genes associated with epileptic encephalopathy.
Dominant GenesRecessive Genes
<1000 bpp1000–2500 bpp2500–5000 bpp<1000 bpp1000–2500 bpp2500–5000 bpp
HBA10ACTB0ATP1A30.0015ARL6IP10ADK0HK11.15 × 10−6
HSPB30BRAF0CNNM20.0015ATP5E0ALG60ZC3H144.59 × 10−6
NRAS0EEF1A20EEF20.0015BBIP10CHST140GRM11.03 × 10−5
PURA0GABRG20KIF5C0.0015BOLA30CLP10ZAK1.03 × 10−5
SDHD0GJC20GRIN10.0030C11ORF730DNAJC30DDHD11.83 × 10−5
SNAP250GNB10GRIN2D0.0030CLPP0ERLIN10HACE11.83 × 10−5
STX1B0HSPD10LZTR10.0030COA50GMPPB0MAGI21.83 × 10−5
THAP10KIF2A0MYT1L0.0030COX140MARS20NDST11.83 × 10−5
VAMP10LGI10DNM10.0045COX6B10NEU10OGDH1.83 × 10−5
YWHAG0MAT1A0EFTUD20.0045DNAJB20NHLRC10RAB3GAP11.83 × 10−5
PPP3CA0>5000 bppGM2A0POGLUT10>5000 bpp
RAF10CHD20.0075MRPL440SAMHD10CAD4.11 × 10−5
TPM20SCN2A0.0075NDUFA120SLC39A140CCDC88A5.60 × 10−5
TPM30SCN1A0.0105PARK70ST3GAL50TRIO7.30 × 10−5
TREX10SMARCA40.0120PCBD10TRMT10C0ARFGEF21.37 × 10−4
TUBA1A0CACNA1B0.0135PCNA0WDR730CC2D2A1.92 × 10−4
TUBB0SCN8A0.0135PDE6D0YME1L10DOCK71.92 × 10−4
TUBB2B0NALCN0.0150RPIA0 LAMB21.92 × 10−4
ZIC20ARID1A0.0165TMEM1380 ATR2.22 × 10−4
ZMYND110DYNC1H10.0165TXN20 CIT2.22 × 10−4
ITPR10.0165UQCC30 ALS22.90 × 10−4

