Article

Evolutionary History of the Glycoside Hydrolase 3 (GH3) Family Based on the Sequenced Genomes of 48 Plants and Identification of Jasmonic Acid-Related GH3 Proteins in Solanum tuberosum

1
State Key Laboratory of Crop Stress Biology for Arid Areas, College of Agronomy, Northwest A&F University, Yangling 712100, Shaanxi, China
2
College of Agronomy, Liaocheng University, Liaocheng 252059, Shandong, China
*
Authors to whom correspondence should be addressed.
These authors contributed equally to this work.
Int. J. Mol. Sci. 2018, 19(7), 1850; https://doi.org/10.3390/ijms19071850
Submission received: 25 April 2018 / Revised: 1 June 2018 / Accepted: 19 June 2018 / Published: 23 June 2018
(This article belongs to the Section Molecular Plant Sciences)

Abstract

:
Glycoside Hydrolase 3 (GH3) is a phytohormone-responsive family of proteins found in many plant species. These proteins contribute to the biological activity of indolacetic acid (IAA), jasmonic acid (JA), and salicylic acid (SA). They also affect plant growth and developmental processes as well as some types of stress. In this study, GH3 genes were identified in 48 plant species, including algae, mosses, ferns, gymnosperms, and angiosperms. No GH3 representative protein was found in algae, but we identified 4 genes in mosses, 19 in ferns, 7 in gymnosperms, and several in angiosperms. The results showed that GH3 proteins are mainly present in seed plants. Phylogenetic analysis of all GH3 proteins showed three separate clades. Group I was related to JA adenylation, group II was related to IAA adenylation, and group III was separated from group II, but its function was not clear. The structure of the GH3 proteins indicated highly conserved sequences in the plant kingdom. The analysis of JA adenylation in relation to gene expression of GH3 in potato (Solanum tuberosum) showed that StGH3.12 greatly responded to methyl jasmonate (MeJA) treatment. The expression levels of StGH3.1, StGH3.11, and StGH3.12 were higher in the potato flowers, and StGH3.11 expression was also higher in the stolon. Our research revealed the evolution of the GH3 family, which is useful for studying the precise function of GH3 proteins related to JA adenylation in S. tuberosum when the plants are developing and under biotic stress.

1. Introduction

Glycoside Hydrolase 3 (GH3) proteins are widespread in plants. In Hagen et al. research, differential hybridization screening was used to first isolate GH3 proteins in an auxin-induced cDNA clone from etiolated soybean hypocotyls [1]. Afterward, GH3 proteins were identified from Nicotiana tabacum L. [2], Arabidopsis [3], Oryza sativa [4], and other plants [5,6,7,8]. The GH3 proteins were identified in mosses, Physcomitrella patens [9], and Marchantia polymorpha L. [10], which were present on earth earlier than land plants by nearly 400 million years. The analysis of promotor sequences showed that some plant hormone elements exist in GH3 promotor sequences [11]. Subsequent research proved that these proteins adjust to phytohormone signaling pathways. A two-step mechanism showed that the GH3 family conjugates amino acids to form diverse acyl acid substrates. The first step indicates adenylation of an acyl acid hormone and the release of pyrophosphate. In the second transfer step, the amine group of an amino acid nucleophilically displaces AMP, which creates the conjugated acyl acid [12]. Only the AtGH3.11 (JAR1) response requires ATP. The rest of the GH3 proteins can be developed in the absence of ATP [13]. The GH3 proteins regulate the levels of phytohormones, including SA, JA, and IAA [14]. Group I GH3 proteins catalyze the conjugation of additional amino acids to form jasmonoyl-isoleucine (JA-Ile), and Group II GH3 proteins catalyze the conjugation of additional amino acids to form IAA complexes. Jagadeeswaran et al. inferred that Arabidopsis GH3.12 (PBS3) may work upstream of SA [15]. In published phylogenetic trees of Arabidopsis, the GH3 proteins are divided into three major groups on the basis of sequence similarity and acyl substrate specificity [16]. Group I proteins use JA as a substrate, which promotes the formation of JA-Ile and boosts JA-mediated responses [8]. JA has been recognized as vital for defense. It is synthesized within minutes to regulate the expression of many genes and affects the resistance to herbivory and disease through the JA biological pathway [17]. The research of Havko et al. showed that JA regulates plant growth and defense through JAZ-DELLA interaction, which influences the ability of DELLAs to repress phytochrome-interacting factor (PIF) transcription factors in plant growth. JAZ-DELLA interaction could also interfere with MYC transcription factors in plant defenses. However, the photoreceptor phytochrome B (phyB) is able to prevent PIFs expression, which influences growth and JA effects on photosynthesis. Therefore, JA plays an important role in growth-defense mechanisms [18]. However, Compos et al. pointed out that the balance between growth and defense is orchestrated by a hormone-based transcriptional network that is hardwired to restrict growth when activating the JA pathway but was not activated by the diversion of photo-assimilates from growth to defense [19]. AtGH3.11/JAR1 was identified as a pre-receptor in jasmonate responses [14]. At the same time, a JAR1 mutant was involved in the resistance triggered by non-pathogenic bacteria and was able to reduce the damage of ozone to Arabidopsis [20,21]. Heitz et al. pointed out that the JA-Ile derivatives 12OH-JA-Ile and 12COOH-JA-Ile accumulated in injured Arabidopsis leaves and were regulated by Cytochromes P450, CYP94C1, and CYP94B3. The elucidation of CYP94-mediated JA-Ile oxidation opens new avenues for understanding JA metabolism and signaling [22].
Group II proteins can conjugate IAA to the free IAA and store phytohormones in an inactive form [23]. AtGH3.12/PBS3 belongs to Group III and uses 4-hydroxybenzoate (4HBA) with a higher efficiency than SA [24]. Until recently, the functions of GH3 proteins had been reported primarily in Arabidopsis. AtGH3.2/Ydk1-D can promote short primary roots and reduce lateral root numbers [25]. Additionally, AtGH3.6/dfl1 restrains shoot elongation and lateral root formation [26], and AtGH3.9 seems to be specifically active in roots [27].
The phytohormone IAA is responsible for growth and development in flowering plants. It influences cell division, expansion, and differentiation [28,29]. Group II genes of the GH3 family are involved in IAA regulation. Similarly, JA is one of the major plant hormones involved in regulating growth and biotic defense [30]. Many research studies state that JA participates in biotic stresses in plants. Therefore, group I genes not only take part in growth but also have key roles in biotic stress on the basis of JA biological function in plants.
With the continuous improvement of gene sequencing technology, genetic data have been generated for more species. The GH3 family could be identified in several plants, but no researchers have described a detailed and complete evolutionary history. Terol et al. displayed the GH3 evolutionary history in 20 plant species through EST (Expressed Sequence Tag) analysis [31]. Sequences of complete genomes were found for at least 48 plants which covered stages from lower to higher plants. Therefore, the evolution of GH3 proteins may be studied more accurately on the basis of these sequenced plant species. We also analyzed the GH3 family in 48 species, which included algae, mosses, ferns, gymnosperms, and angiosperms. We used bioinformatics methods. Furthermore, we analyzed the gene characteristics, structures, phylogenetic relationships, gene ontology (GO) annotations, and expression patterns of the GH3 proteins in Solanum tuberosum. Therefore, the results of this study not only reveal the evolution of the GH3 family but also provide some useful information for further research on the potato.

2. Results and Discussion

2.1. The GH3 Family Identified in 48 Plant Species

To study the evolution of the GH3 family, we surveyed the sequences of GH3 family members in sequenced plant species. We used the GH3 full-length protein sequence of Arabidopsis thaliana [16] as a query to search the available genome sequences from 48 plant species including algae, mosses, ferns, gymnosperms, and angiosperms. We found a total of 579 proteins in 48 plants. The number of GH3 proteins ranged from 0 to 38 (Table 1). According to the evolutionary relationships in plants, no GH3 proteins were acquired in algae. Only two proteins were identified in each moss known as Marchantia polymorpha L. and Physcomitrella patens. The fern species Selaginella moellendorffii contained 19 GH3 proteins, which was a large group compared with some other plants. We could not find genomic information for the gymnosperm Picea abies in the NCBI Genome, but it was reported by Nystedt et al. [32], and seven GH3 proteins were identified in it. Numerous angiosperms have been sequenced, which makes it easier to determine how many GH3 genes they have acquired. The highest number of GH3 proteins was found in Brassica rapa but it does not have the largest genome. Different plants had different GH3 proteins, but these numbers were not correlated with the genome length. According to the general trend, the GH3 protein appeared first in mosses and, as plants continued to evolve, more GH3 genes were found. We found that the number of GH3 family proteins increased with the emergence of seed plants (ferns, gymnosperms, and angiosperms).
By analyzing the number of each GH3 protein group among the 48 plants, we found that group II was largely present, while group III existed only in a few plant species. Although there were two proteins belonging to group I in P. patens, Stumpe et al. indicated that they do not have the function of JAR1, which means they do not take part in the JA biological pathway [33]. Similarly, Bierfreund et al. showed that the defense against Botrytis infection involved SA and 12-oxo-phytodienoic acid, which promote the reinforcement of the cell wall, programmed cell death, and accumulation of evolutionary conserved defense signals. JA did not play any role in these processes [9]. Bowman et al. indicated that M. polymorpha could synthesize the JA precursor 12-oxo-phytodienoic acid (OPDA) but it lacks the OPDA reductase (OPR3) that produces the vascular plant hormone JA-Ile. The GH3 protein involved belongs to group I, which had no function [10,34]. In summary, mosses contained GH3 proteins and some of these proteins belonged to group I, but they did not play roles in the JA biological pathway. Therefore, the classification of the GH3 family through protein sequence comparison only served as a reference. Gene detail function in each plant, especially in ancient plant species, needed to be verified by gene function analysis.

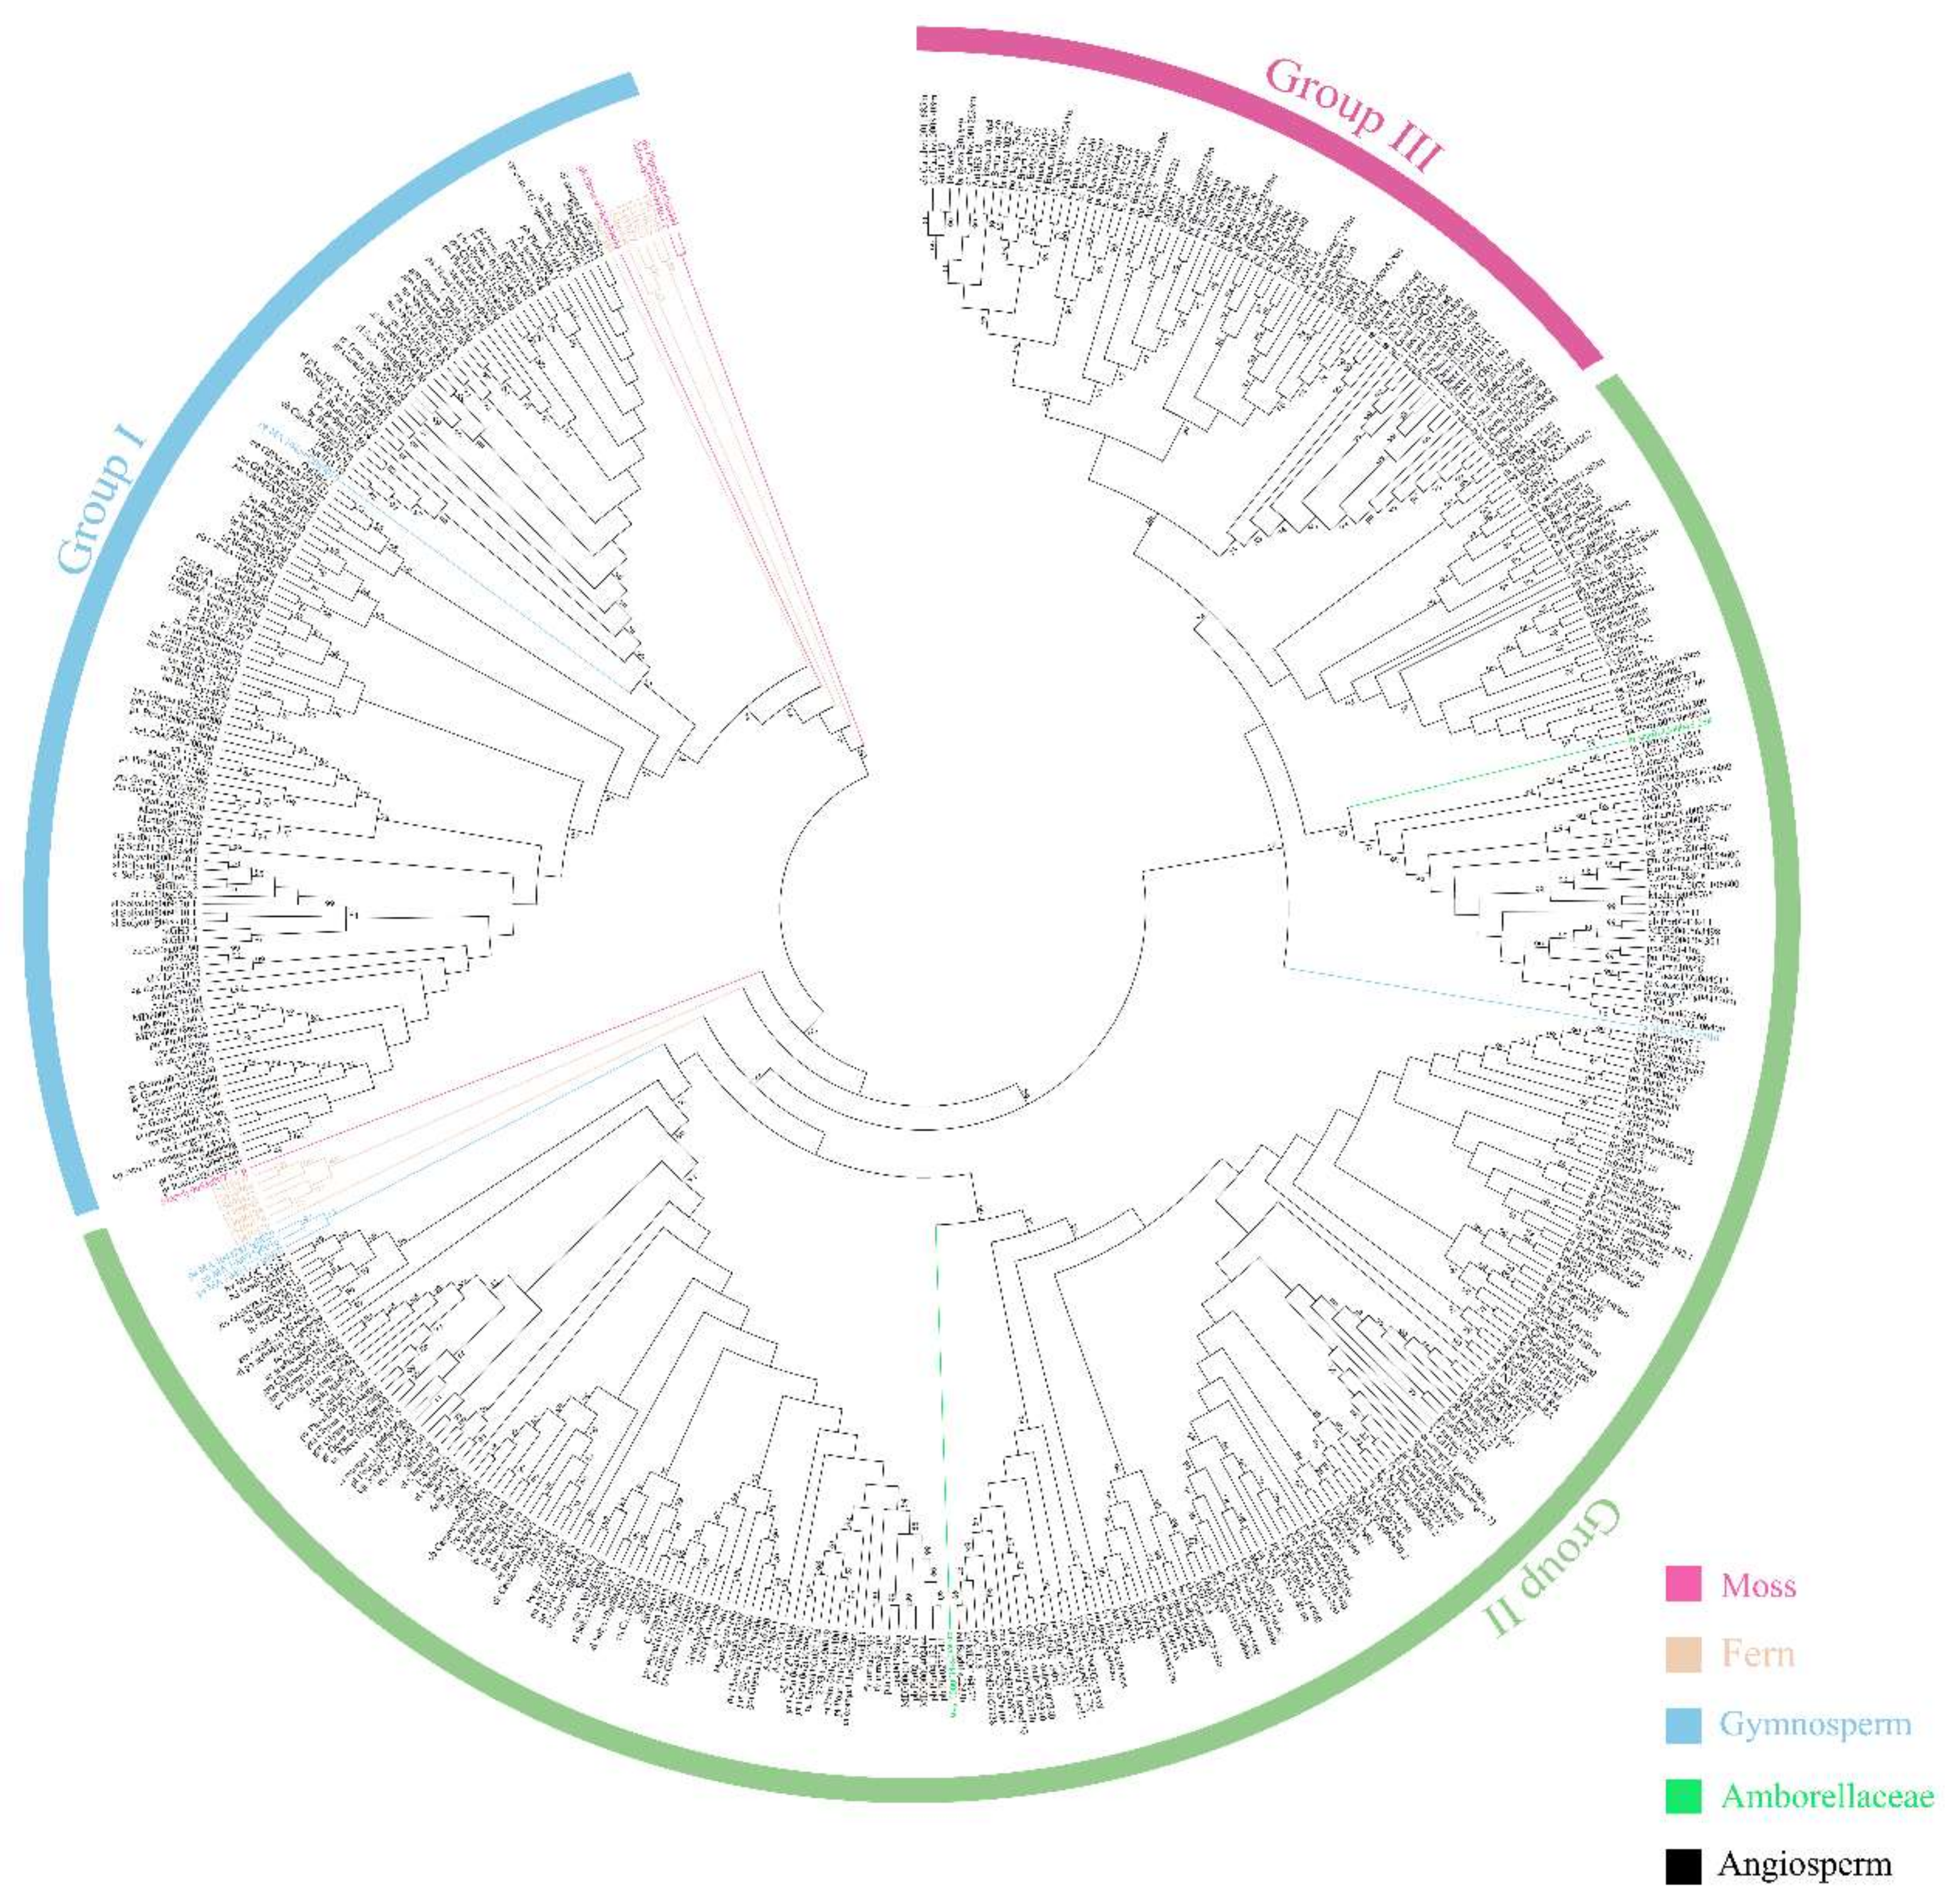
2.2. Analysis of the Phylogenetic Tree and Duplication Patterns

The phylogenetic tree of the GH3 members in 48 plant species was constructed on the basis of the similarities of the protein sequences (Figure 1 and Table S1). The tree contained three clades, which is consistent with previous studies [4,5,38]. The functional groups known as group I and group II, which are related to JA and IAA, respectively, were present in all major plant lineages, including the mosses. Three genes from mosses could be assigned to group I, which contained the most ancient genes. The GH3 proteins may have played important roles in environmental adaptation in mosses. This gene group was present in all seed plants. It could be inferred that the function of group I was indispensable to all plants. One GH3 protein belonged to group II in mosses, but more group II proteins appeared in seed plants. This suggests that group II had a key role in plant evolution. Group III proteins were only present in eudicots. From the phylogenetic tree analysis, group III was closer to group II and belonged to one of the branches. Moreover, group II and III had the same plant lineages and evolved from the moss M. polymorpha L. (Mapoly0053s0073.1.p). Group III members were found in eudicots, including all Brassicaceaes (A. thaliana, Brassica oleracea, B. rapa, Capsella rubella, and Arabidopsis lyrata), Gossypium raimondii, Brachypodium distachyon, and Theobroma cacao. This result is consistent with those of Singh et al. [39]. Therefore, we speculated that group III contains the most recent evolutionary members. Okrent et al. suggested that group III proteins play a role in the response to biotic and abiotic stress [14].
Group I and II GH3 proteins have the same ancient origin, and the evolutionary explosion of these groups was caused by many duplication events. Early duplication events were identified in group I and II of ferns (Figure 1).
For a further understanding of the GH3 evolutionary relationships, the prediction of the molecular evolution rates could clarify the gene evolution process. The selective pressure was estimated by calculating the ratio of the nonsynonymous substitution rate to the synonymous substitution rate (Ka/Ks value), which allowed us to analyze the molecular evolutionary rates (Table S2). Ka/Ks values were calculated for each duplication event and showed that almost every gene pair evolved at a Ka/Ks value lower than one, except the ta__Thecc1EG031553/ta__Thecc1EG031554 gene pair in T. cacao (the Ka/Ks value is 1.638). This gene pair experienced a positive selection pressure in evolution. The other gene pairs indicated that the gene was subject to purification selection. Compared with each stage duplication event, the angiosperms showed extensive duplication. We first determined the duplication event in ferns. That Ka/Ks Values were <1, and two kinds of duplication features had similar values (0.318 to 0.388) in S. moellendorffii. The number of GH3 duplications in dicots was higher than in monocots. Plenty of tandem and segmental duplications occurred in Brassicaceae. The most segmental duplications were identified in Glycine max, and there were no tandem duplications. The number of GH3 proteins and duplication events suggested that the increase in GH3 proteins was due to numerous duplication events in angiosperms. Plants evolve with changes in the environment, and positive selection promoted the exchange of gene functions to survive. Therefore, the selective patterns can partly explain the evolutionary patterns of the genes.

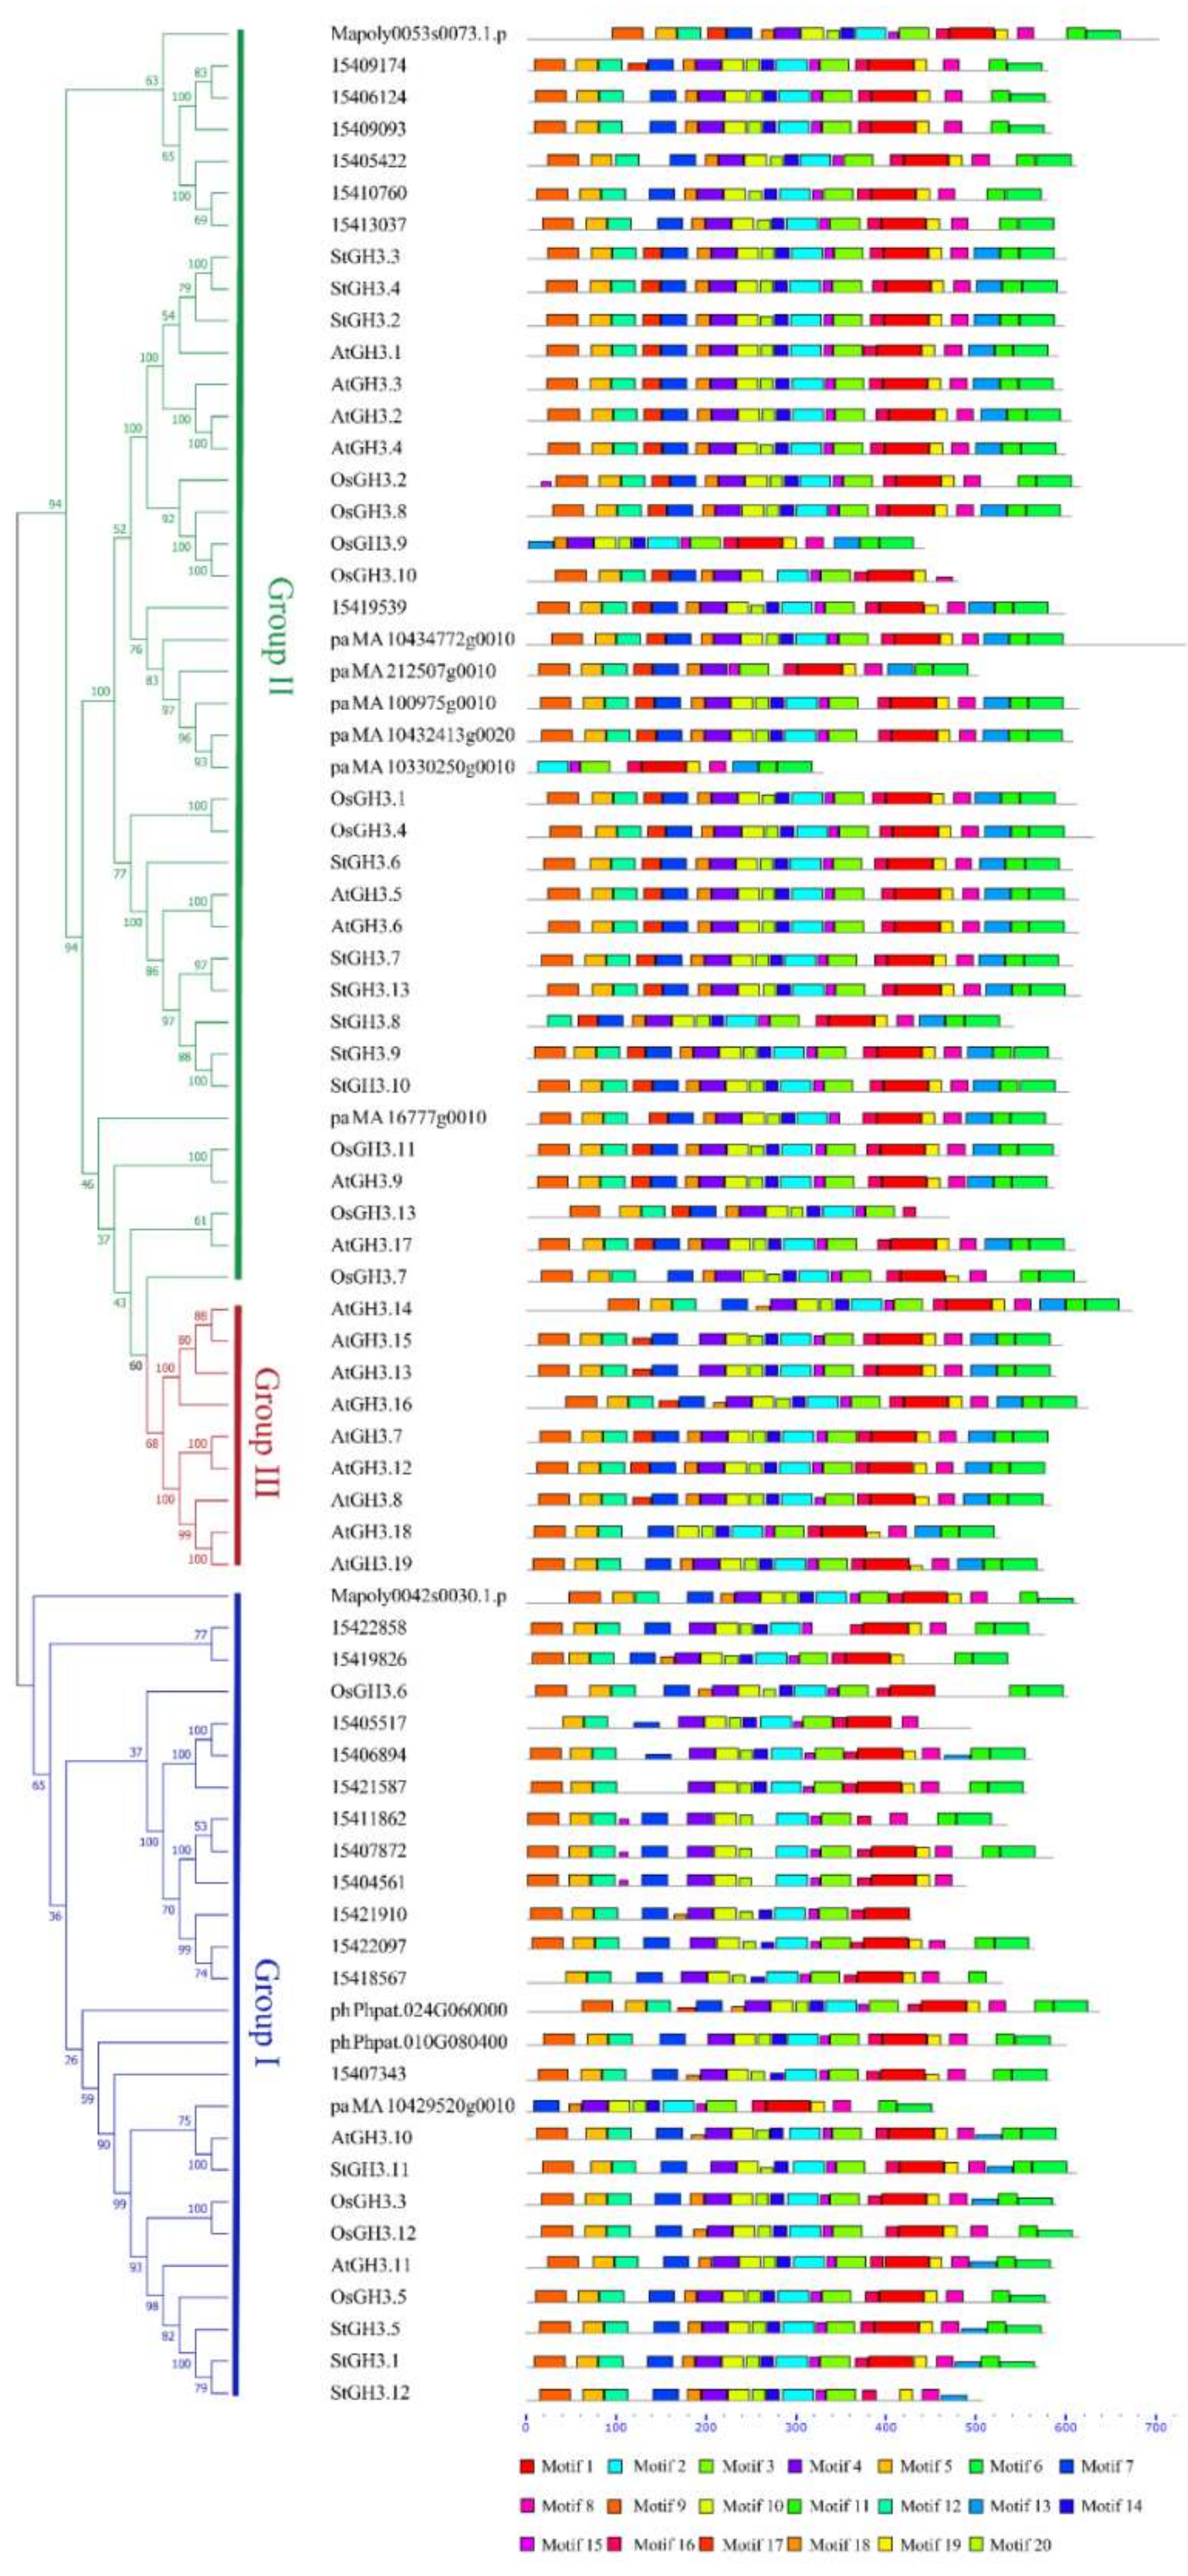
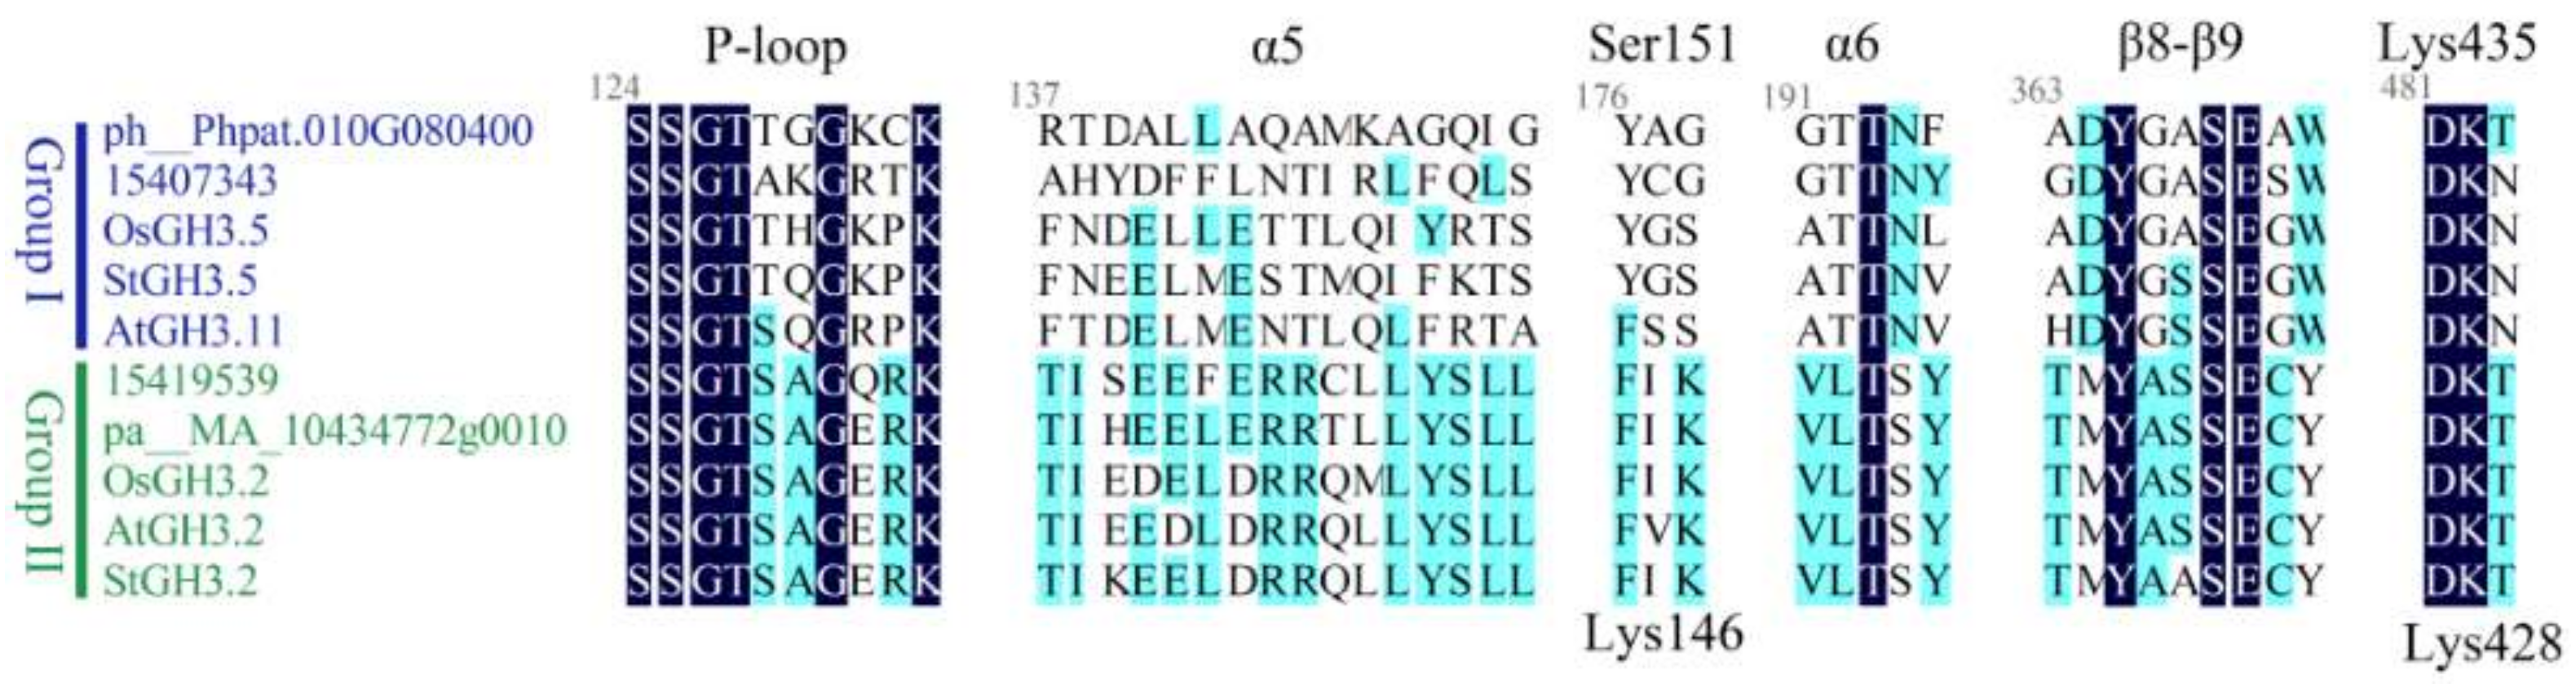
2.3. Structural Analysis of GH3 Proteins

Seven species from different stages, from moss to angiosperm, were selected as the candidates to analyze their structures. The prediction of protein motifs was an essential method for protein analysis. The motifs of GH3 proteins were identified using the MEME website. Twenty motifs were analyzed in these proteins (Figure 2). The GH3 protein family members have highly conserved motifs. The vast majority of proteins contained about 20 motifs and they were in the same order. The moss and fern species had 17–19 motifs. Motif 17 did not exist and was analyzed by the MEME program. The PaGH3 protein (pa__MA_10330250g0010) only had 10 motifs, which was the lowest number of motifs in all proteins. Correspondingly, it also had the shortest length. In comparison to other gene families such as the WRKY family [40], the motifs of subgroup proteins showed no significant differences.
The GH3 family conjugates amino acids to diverse acyl acid substrates. We analyzed the protein sequences, which showed that the auxin-responsive and JA-responsive proteins had different structures. The prediction of protein secondary structures showed different main structures in each group. We took 10 proteins as candidates to analyze the information from Westfall et al. [8]. These 10 proteins belonged to four different evolutionary stages and contained α5 and α6, which provide a hydrophobic pocket for the pentenyl tail, β8-9, and P-loop. These were conserved structures in each protein (Figure 3). The alignment of proteins from each group showed highly conserved lysine residues, Lys428/Lys435, existing in each protein. These residues may interact with amino acid substrates. Lys146 accepts acidic amino acids, while Ser151 is specifically conjugated to isoleucine.

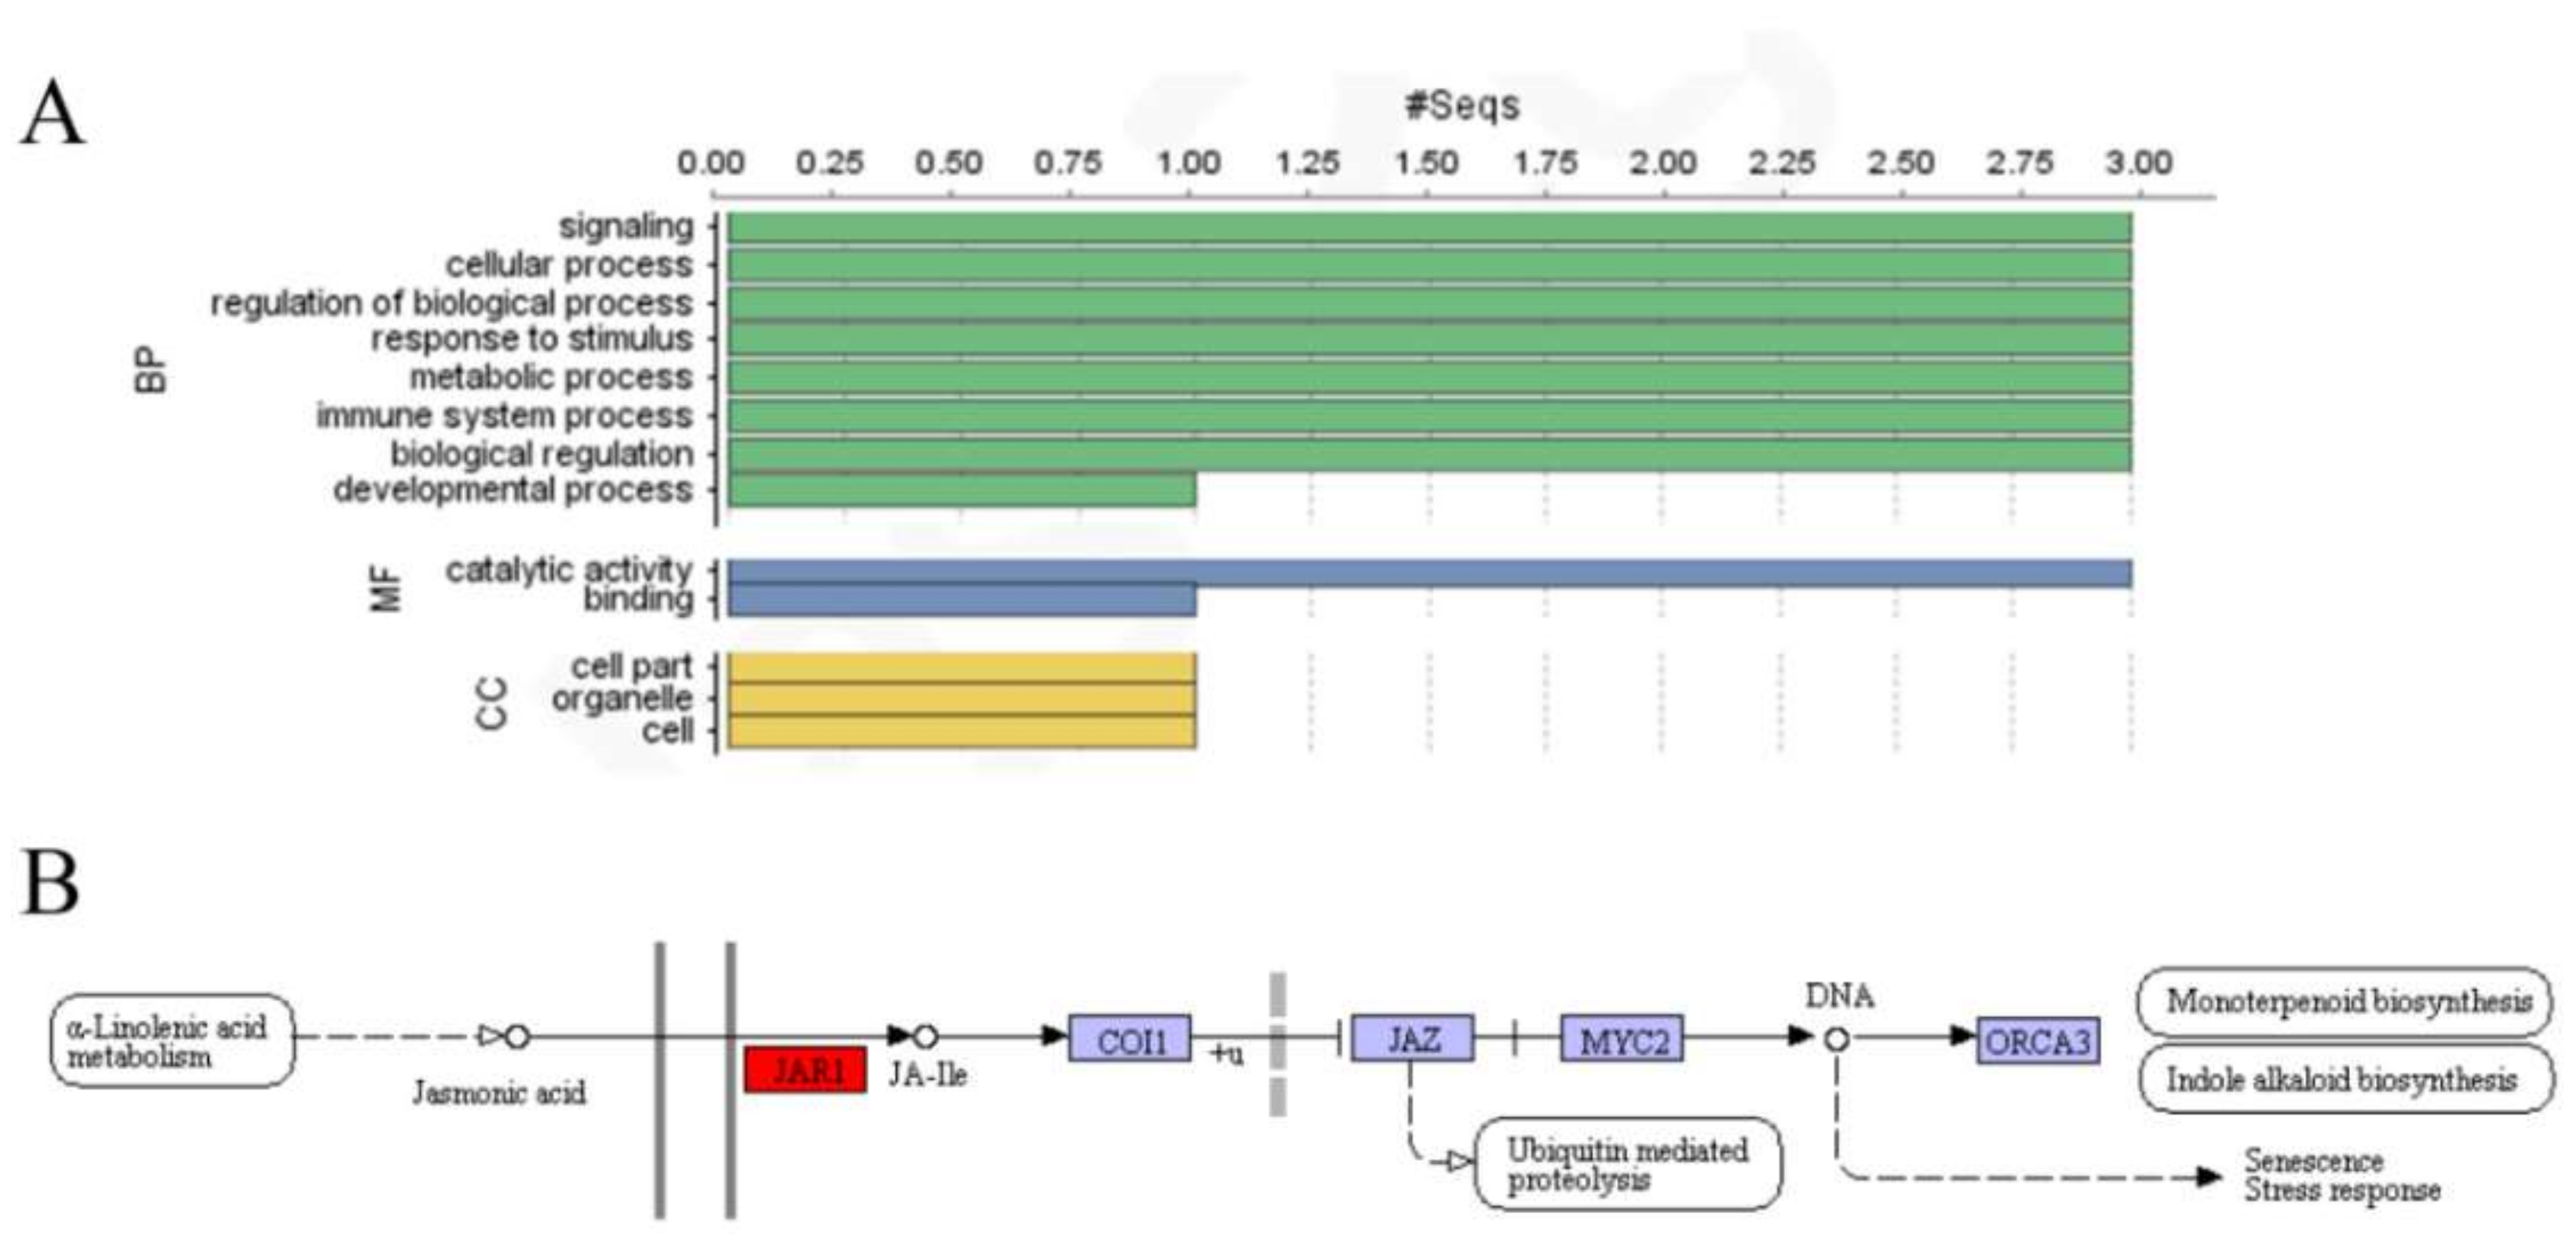
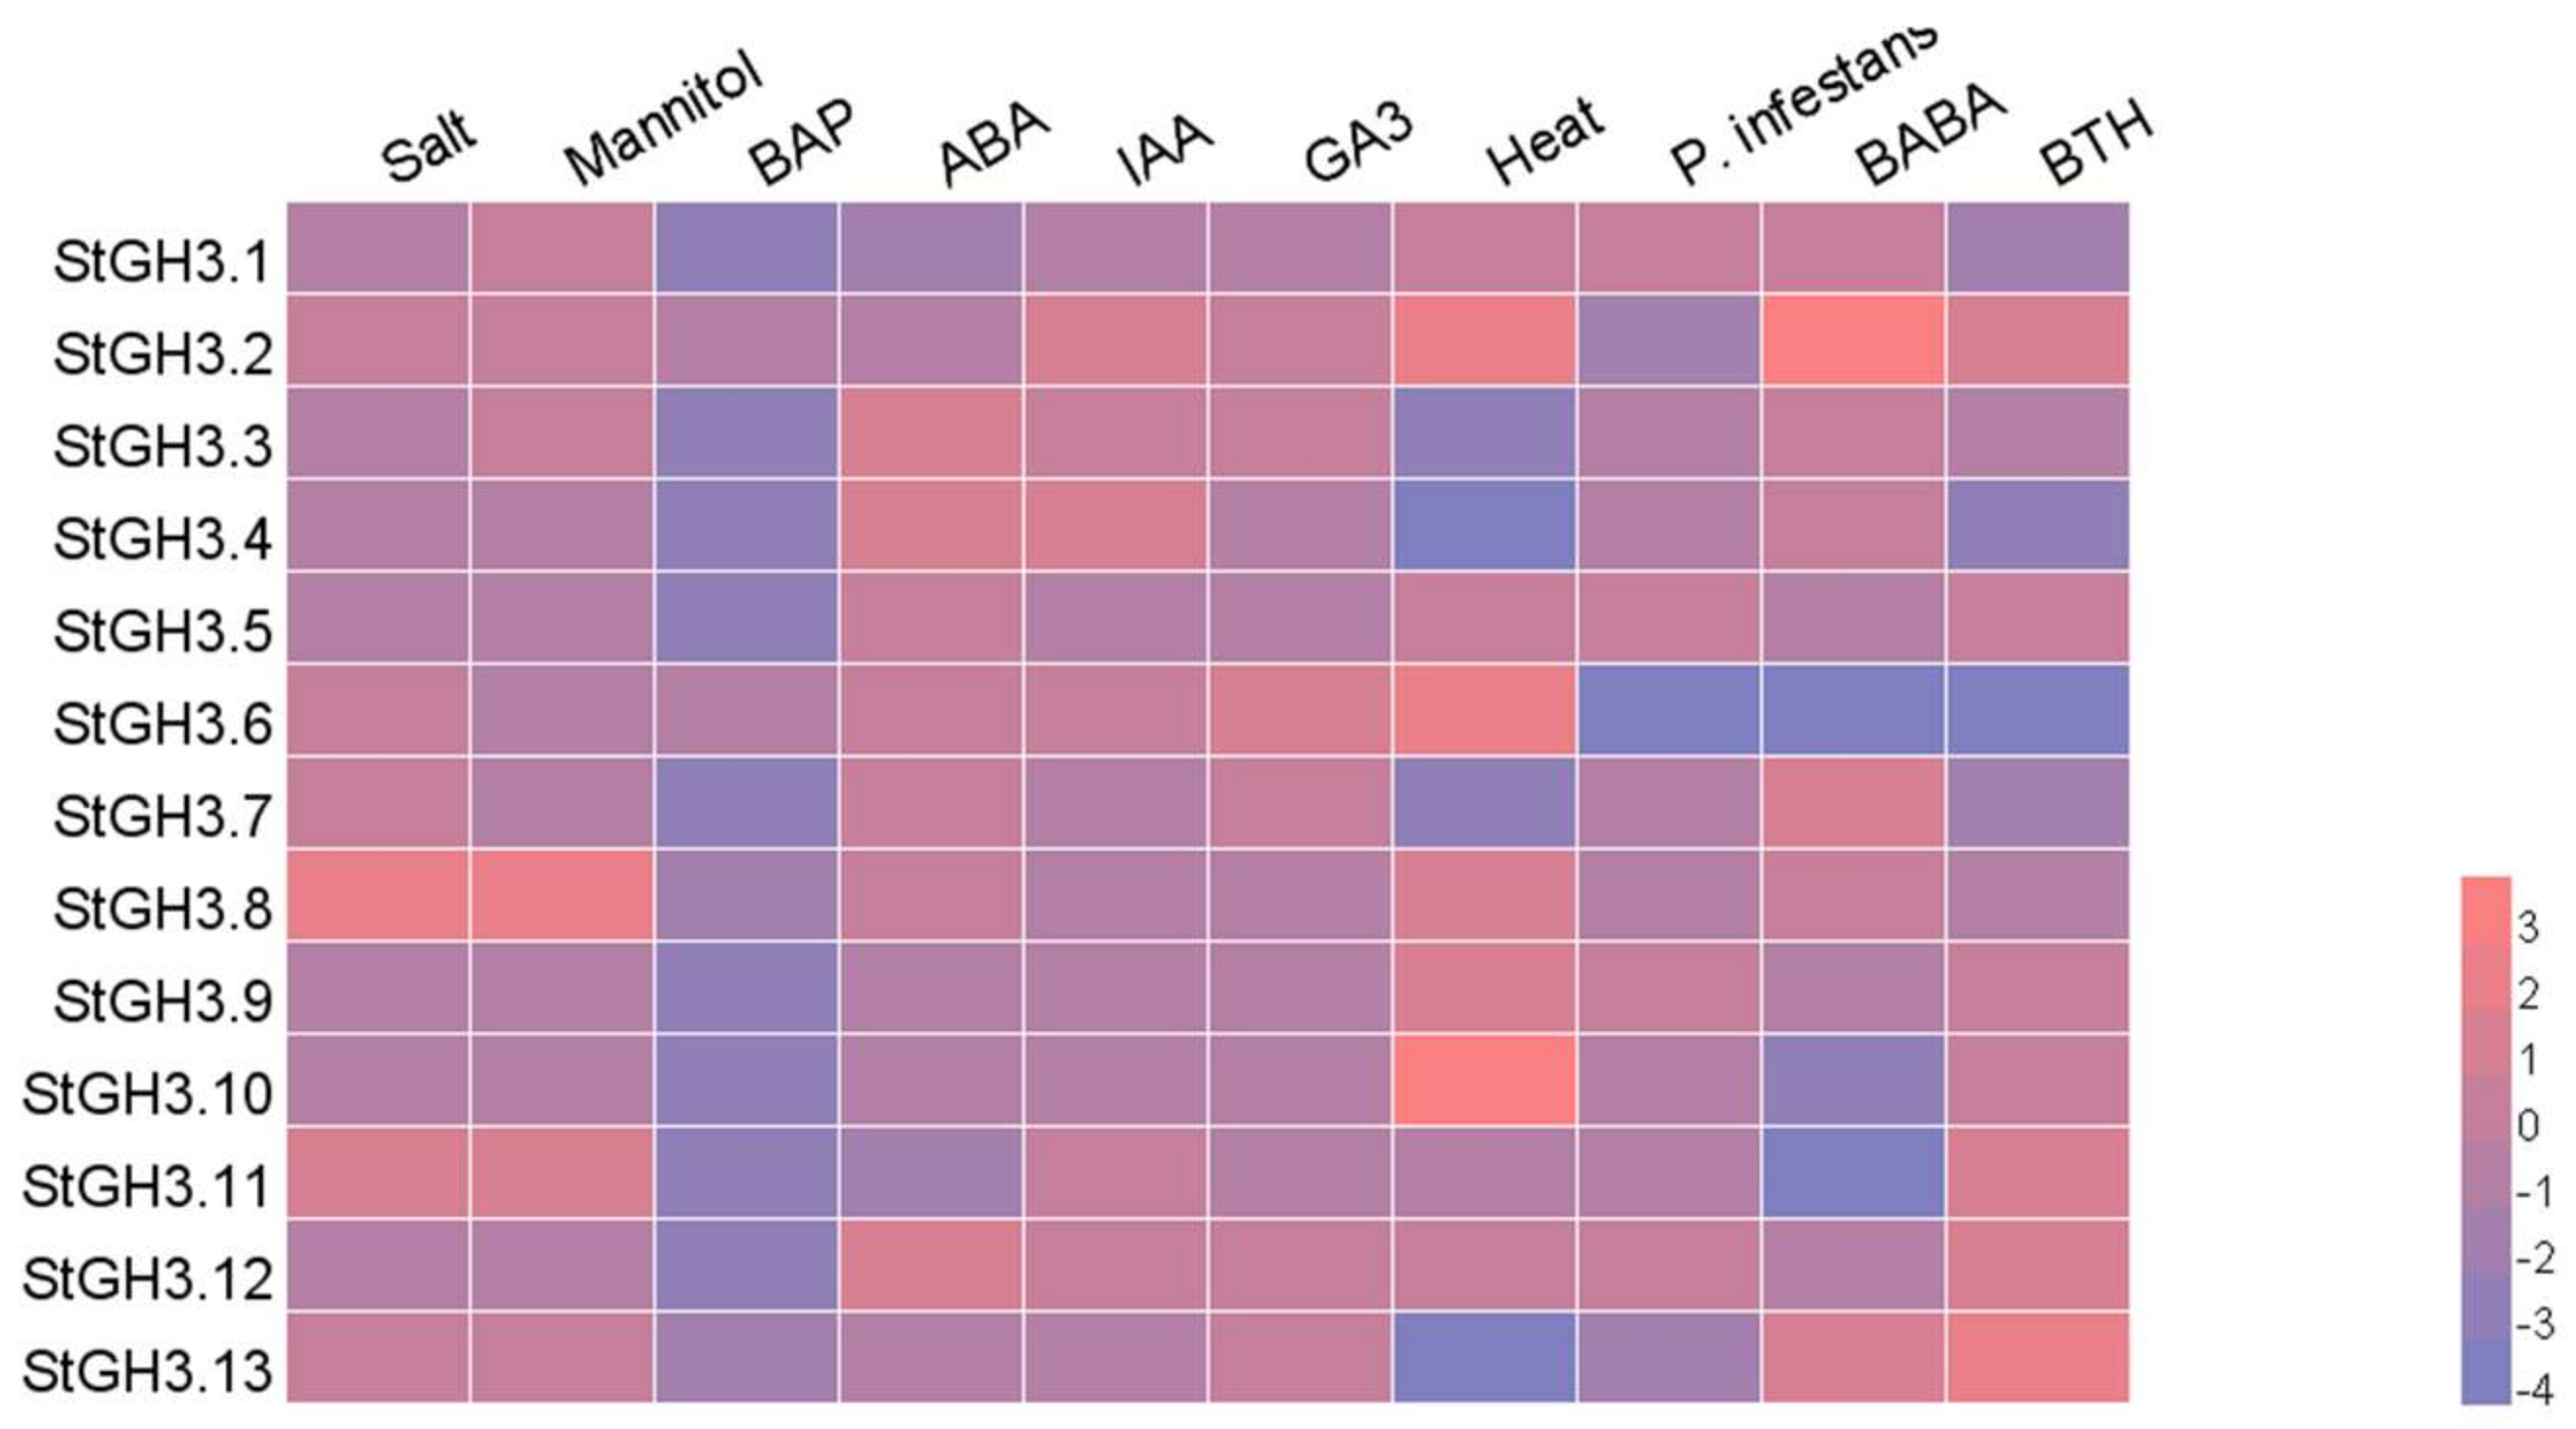
2.4. Gene Ontology Annotations and RNA-Sequence Data Analysis of StGH3 Proteins

To better understand the biological processes affected by the GH3 proteins, we selected potato GH3 proteins for GO analysis using the NCBI database. Three StGH3 proteins (StGH3.1, StGH3.5, and StGH3.12) appeared to participate in multiple signal transduction pathways (signal transduction, response to stress, small molecule metabolic process, and immune system process). Moreover, these three proteins had predicted ligase activity. StGH3.5 appeared to participate in enzyme binding and nucleotidyl transferase activity. The prediction of genes’ cellular component showed that StGH3–5 participate in the component development of the vacuole (Figure 4A). Compared with the databases in the KEGG website, proteins encoded by the StGH3 group I genes (except StGH3.11) participate in the JA pathway (Figure 4B, Table S3). Therefore, these three proteins had important roles in JA adenylation.
The potato expression database was downloaded from the PGSC website which contains transcription sequence expression changes under biotics, abiotics, and hormone treatments [45]. We selected StGH3 transcriptional sequences to analyze their expression patterns upon various treatments (Table S4 [45]). We processed the RNA-seq database and generated a heatmap (Figure 5). Ten different treatments were part of this analysis. All StGH3 genes were downregulated upon 6-Benzylaminopurine (BAP) treatment and slightly enhanced or reduced in the presence of the Phytophthora infestans. The StGH3.2 sequence was upregulated by seven stressors, and three treatments increased its expression. The StGH3.10 sequence was strongly upregulated, and the StGH3.13 sequence was downregulated to the point of no signal upon heat treatment. Combined GO annotation and RNA-seq data analysis showed that StGH3.1, StGH3.5, and StGH3.12 participated in stress regulation. These genes were all upregulated under heat and biotic stresses. The change of StGH3 protein expression regulated by JA has not been reported, and these results should be analyzed following treatment with JA or MeJA.

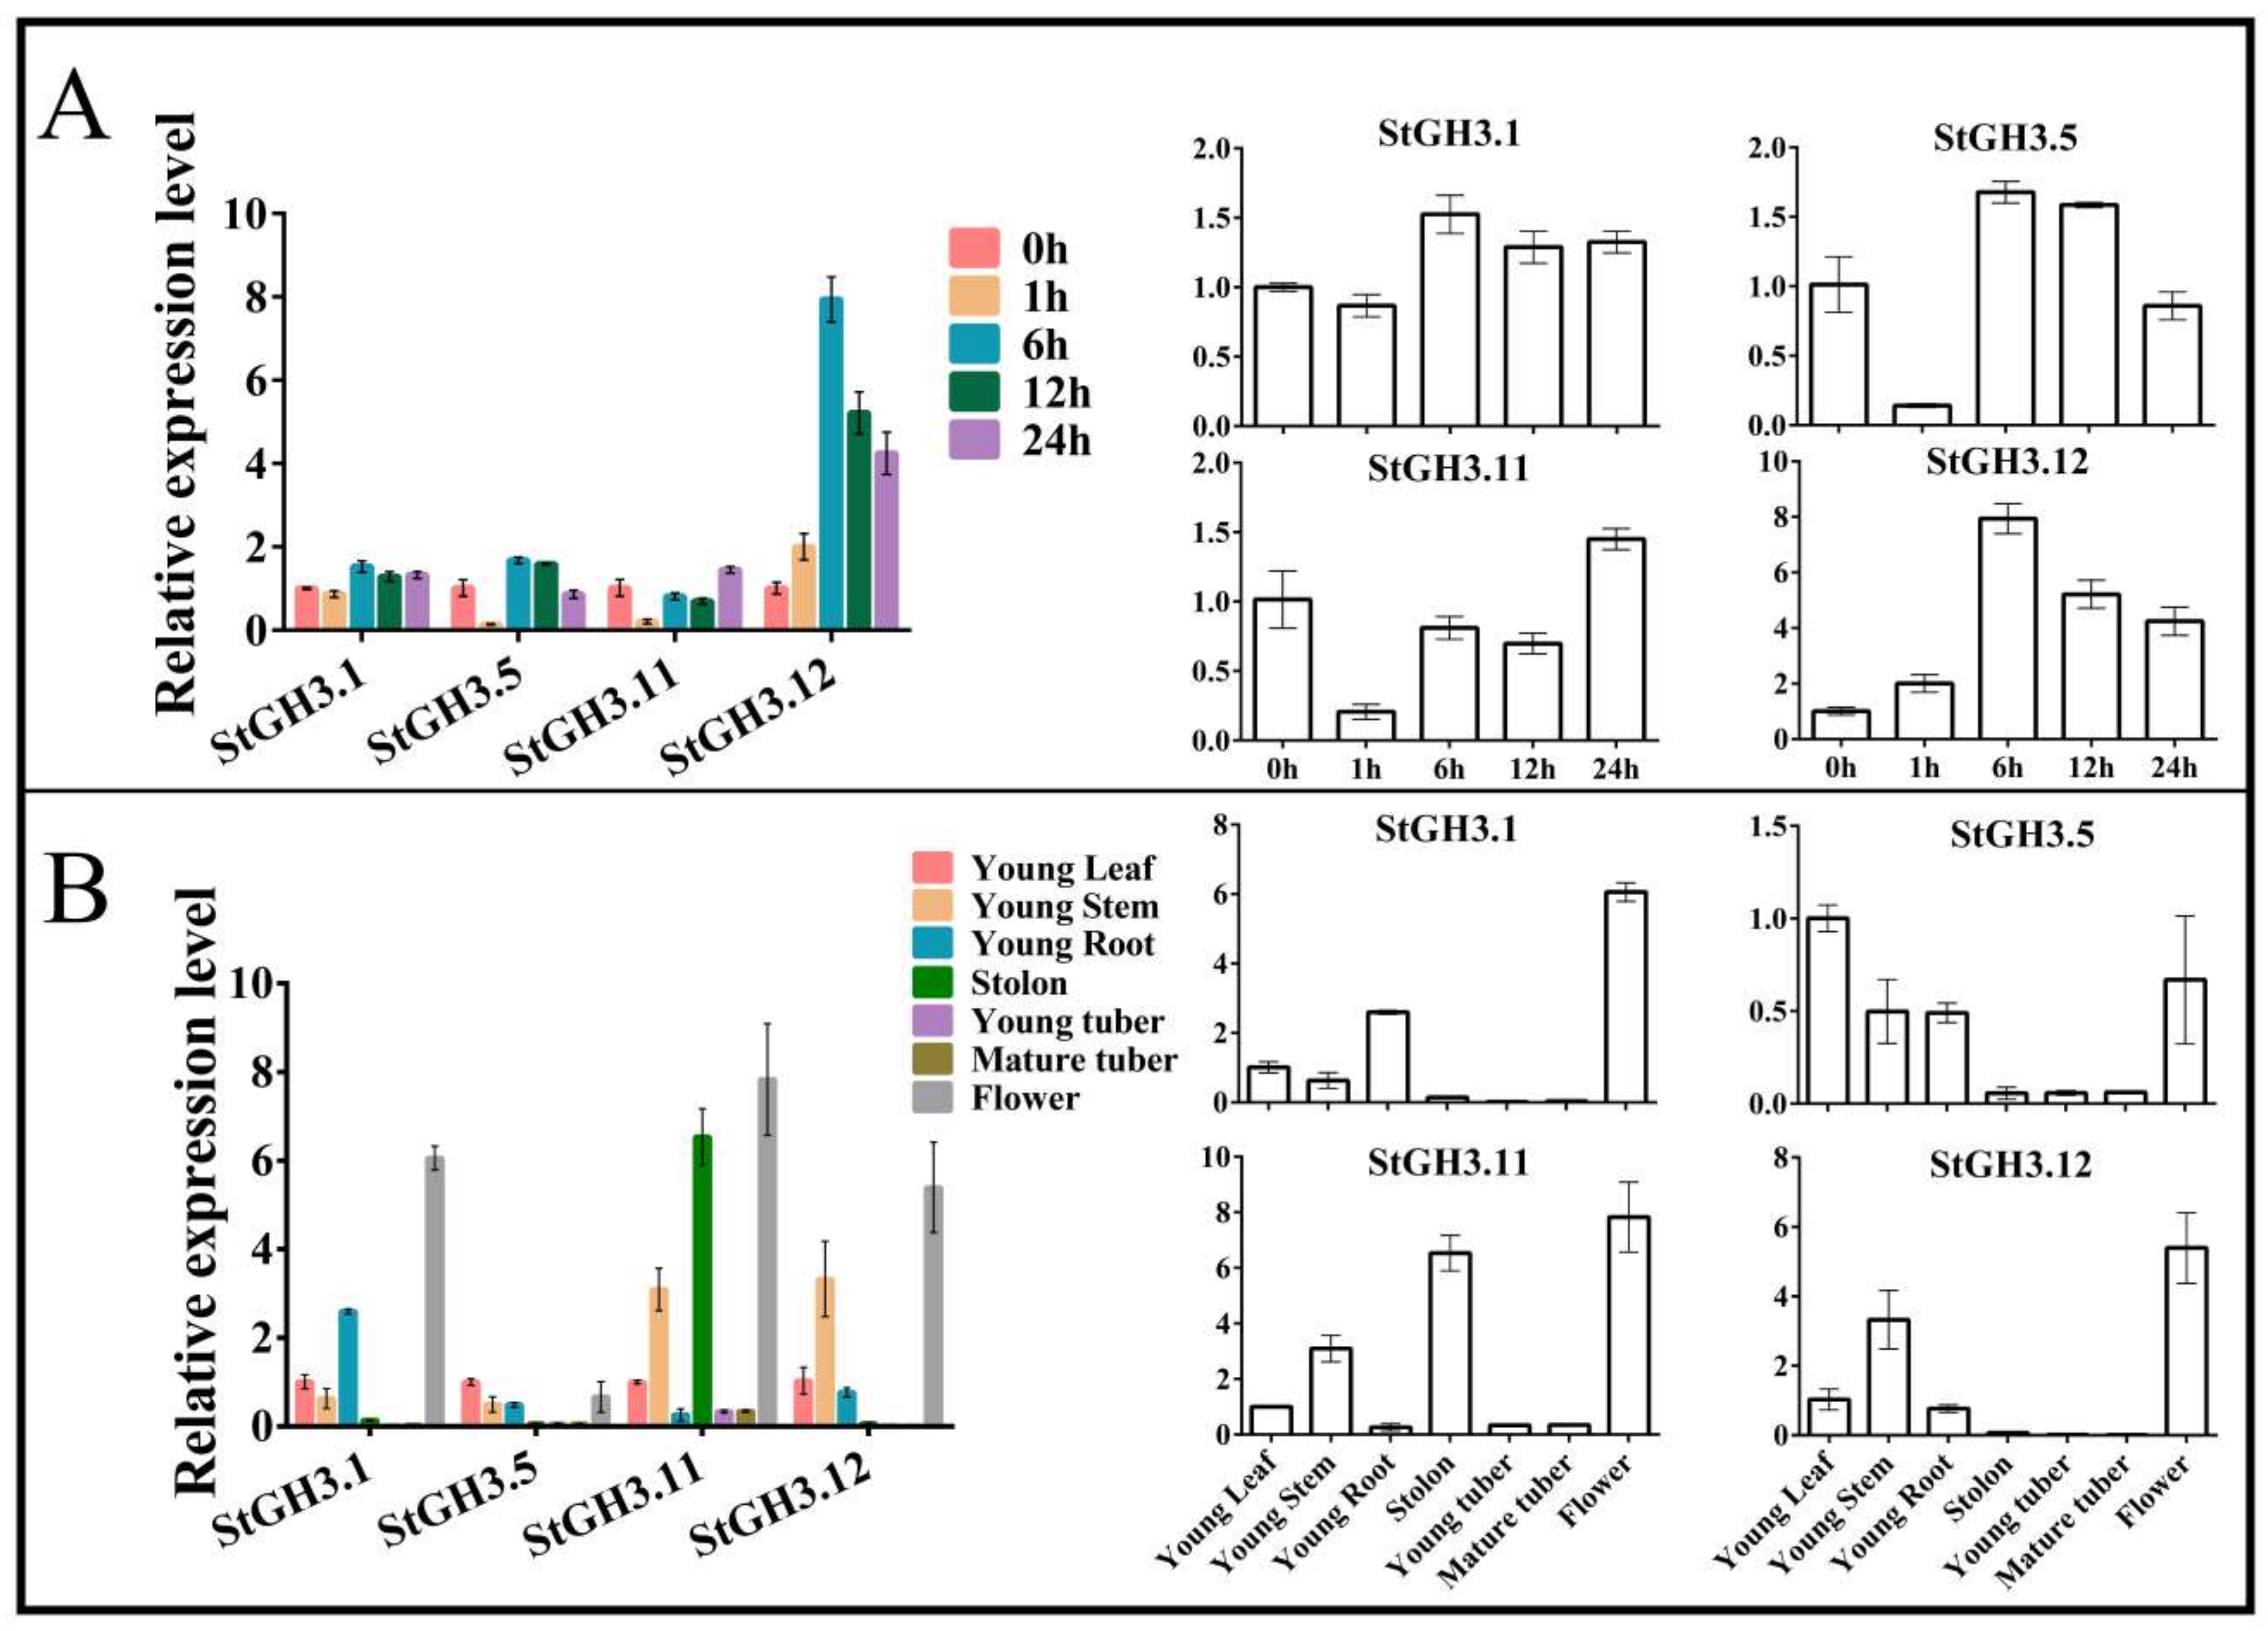
2.5. Expression Analysis of StGH3 Group I Genes

To demonstrate the change of GH3 proteins in plant tissues and under MeJA treatment, qRT-PCR analysis was used to conduct expression analysis. We mainly focused on the group I genes which were related to the JA pathway by prediction. Some researchers used MeJA to treat potato tuber slices and tissue culture seedling. Results showed that JA and MeJA induced dilation of the potato tuber cells and that a single treated stalk of potato could promote tuber formation [46,47]. However, according to Hannapel et al., StBEL5 is the main gene responsible for regulating potato tuber formation, and JA only has an indirect role in tuber formation [48]. Therefore, we verified that these candidate proteins respond to JA and analyzed their function in different plant tissues by using qRT-PCR.
The tissue culture seedling was treated by 10−5 M MeJA [49,50], and the collected materials were treated for different time periods. The expression of the StGH3 group I genes was studied during these treatments (Figure 6A, Table S5). These four genes were all upregulated at different times. Compared with an untreated sample, StGH3.1, StGH3.5, and StGH3.12 were upregulated 6 hours after treatment. The expression level gradually decreased from 6 hours to 24 h. The highest change in expression occurred in StGH3.12: expression was eight-fold higher than in the control after 6 hours of treatment. Overall, the response time of genes to MeJA treatment was about 6 h. The most responsive gene was StGH3.12, and other proteins typically had no obvious response, especially StGH3.11, which was downregulated by MeJA treatment. However, if a gene was downregulated in one hour, it might be due to MeJA concentration because the JA compound was poorly soluble in MS liquid medium.
In addition, we studied the expression of these four genes in seven different tissues to verify whether if there was a specific expression in a particular potato tissue (Figure 6B, Table S5). We selected the young leaf as the standard to process the qRT-PCR data by using the 2−∆∆Ct method. Three genes had greater expression in flowers. Only StGH3.5 had lower expression in each tissue. The expression level of StGH3.11 was also high in the stolon and the other genes only had low expression. None of these genes had high expression levels in young tubers or mature tubers. Some researchers showed that JA and MeJA could expand the tuber cells, which leads to potato disks becoming extremely swollen [46,47]. However, the expressions of the StGH3 genes were much lower in the tubers. This may prove that StGH3 proteins from group I could not regulate the tuberization, but they do participate in the JA biological processes of growth regulation.

3. Materials and Methods

3.1. Mining GH3 Genes from Various Species

Genes, proteins, and transcript sequences from 48 species of algae, mosses, ferns, gymnosperms, and angiosperms were downloaded from the NCBI. Blast 2.6.0 was used to search for homologous sequences based on AtGH3 [16] as query with E-value ≤ 10−10. The acquired data were uploaded to the NCBI-CDD website (http://www.ncbi.nlm.nih.gov/cdd) and Pfam website (http://pfam.xfam.org/) to search the domain. All identified GH3 genes were aligned using the multiple sequence alignment tool ClustalX2 (http://www.clustal.org/clustal2/). After excluding small portions of genes with divergent sequences, the others were considered putative genes.

3.2. Structure Analysis of GH3 Proteins

To better understand the GH3 proteins, a portion of the structure of GH3 proteins was analyzed. The structure of these proteins was predicted from protein motifs using MEME (http://meme-suite.org/tools/meme), with the parameters set to default, only selecting the number of motifs (20). Predictions of proteins’ secondary structure came from PHDsec server, which could upload the data onto PRABI Lyon Gerland website (https://prabi.ibcp.fr/htm/site/web/home), and DNAMAN software (https://www.lynnon.com/pc/framepc.html) was used to analyze multiple sequence alignment.

3.3. Construction of the Phylogenetic Tree

Phylogenetic analysis of the GH3 family was conducted using MEGA7 software (https://www.megasoftware.net/). Seventeen species of plants were included in the phylogenetic tree. Phylogenetic trees were produced using the Neighbor-Joining (NJ) method [39] with the following parameters: 1000 bootstrap replications, Poisson model, and pairwise deletions.

3.4. Analysis of Gene Duplications

Tandemly duplicated gene pairs were identified by comparing their physical locations on chromosomes and their homology (more than 50%). We defined paralogous genes as those existing in the same chromosome within a 50 kb physical distance, indicating tandem duplicated pairs [40,51]. The segmental duplication of each gene was ensured through the Plant Genome Duplication Database (PGDD) website (http://chibba.agtec.uga.edu/duplication/). Ka/Ks values were calculated using DnaSP6 software [52].

3.5. GO Annotation and RNA-Seq Data Analysis

Blast2GO software (https://www.blast2go.com/) was used to analyze the gene ontology (GO). The full-length amino acid sequences were uploaded into the program, and the NCBI database was chosen as the reference to analyze the molecular function, cellular components, and biological processes. The KEGG pathway of proteins could be searched on the KEGG website (http://www.kegg.jp/kegg/kegg2.html).
The RNA-seq data [53] were downloaded from the PGSC website (http://solanaceae.plantbiology.msu.edu/pgsc_download.shtml). The selected raw data were transformed by log2, and then HemI software [54] was used to visualize the expression.

3.6. Plant Growth Conditions and Treatments

The potato material (DM1-3-516-R44) was grown with 20 g/L sugar on solid MS medium with vitamins (PhytoTech, Shawnee Mission, MS, USA) as a culture medium for four weeks in a plant incubator at 25 ± 1 °C under 10,000 lx in light for 16 h and 20 ± 1 °C under 0 lx for 8 h. For the MeJA treatment, 10−4 M MeJA was added to liquid MS medium with 20 g/L sugar. After culturing for 1 h, 6 h, 12 h, and 24 h, the samples were taken to analyze GH3 gene expression.
B5141-6 (Lenape) × Wauseon was planted in the greenhouse for 3 months. Seven tissues (young leaf, young stem, young root, stolon, young tuber, mature tuber, and flower) were selected to test gene expression.

3.7. Expression Analysis of the StGH3 Genes

Plant total RNA (Invitrogen, Carlsbad, California, USA) from four plants treated for different times with MeJA and RNA from seven different tissues were used for reverse transcription into cDNA (Takara, Tokyo, Japan). Elongation factor 1-a (ef1-a) was used as a reference gene to quantify the expression of the StGH3 genes [55]. Bio-Rad Real-Quantitative real-time PCR analysis System (CFX96, Hercules, CA, USA) was used to analyze the expression levels. Gene expression analysis upon each treatment was based on three technical replicates. The relative expression levels were calculated using 2−∆∆Ct [56].

4. Conclusions

We performed an evolutionary analysis of the GH3 protein family in the plant kingdom to reveal gene structure, phylogenetic relationships, and the evolution of GH3 proteins in each group. Group I and II genes were found in mosses. Group I contains many ancient genes. Therefore, we conclude that their function was indispensable to all plant species. Multiple group II genes appeared in seed plants. Therefore, we could infer that group II genes play crucial roles in plants. Group III members did not appear until the angiosperm period. We predict that group III is the most recent group and is closely related to group II. This conclusion will provide a reference for the evolutionary relationships of GH3 proteins in plants. Our analysis also revealed that group I genes were related to the JA response, and several genes were also involved in physiological processes of various tissues and responded to some types of stress in the potato. The results of this study increase our understanding of the evolutionary relationships in the GH3 family and also serve as the basis for the functional identification of potato GH3 proteins. In subsequent studies, we will try to reveal the function of GH3 proteins in the JA biological process and improve the response to some stress types through JA regulation in the potato.

Supplementary Materials

Supplementary materials can be found at https://www.mdpi.com/1422-0067/19/7/1850/s1.

Author Contributions

C.Z., Y.C. and Q.C. designed the experiments; C.Z., Q.C, L.Z., and D.W. carried out the experiments; C.Z., Z.S., and X.M. analyzed the experimental results. C.Z., H.M., and B.L analyzed the data and developed the analysis tools. C.Z., L.Z., and B.L. wrote the manuscript.

Funding

This work was supported by the National Natural Science Foundation of China (No. 31601358), the Project of Science and Technology from Shaanxi Province (No. 2017ZDXM-NY-004) and major collaborative innovation projects for production, education and research in Yangling demonstration zone (No. 2016CXY-05).

Conflicts of Interest

The authors declare no conflict of interest.

References

  1. Hagen, G.; Guilfoyle, T.J. Rapid induction of selective transcription by auxins. Mol. Cell. Biol. 1985, 5, 1197–1203. [Google Scholar] [CrossRef] [PubMed]
  2. Roux, C.; Perrot-Rechenmann, C. Isolation by differential display and characterization of a tobacco auxin-responsive cDNA Nt-gh3, related to GH3. FEBS Lett. 1997, 419, 131–136. [Google Scholar] [CrossRef]
  3. Tanaka, S.; Mochizuki, N.; Nagatani, A. Expression of the AtGH3a gene, an Arabidopsis homologue of the soybean GH3 gene, is regulated by phytochrome B. Plant Cell Physiol. 2002, 43, 281–289. [Google Scholar] [CrossRef] [PubMed]
  4. Jain, M.; Kaur, N.; Tyagi, A.K.; Khurana, J.P. The auxin-responsive GH3 gene family in rice (Oryza sativa). Funct. Integr. Genom. 2006, 6, 36–46. [Google Scholar] [CrossRef] [PubMed]
  5. Yuan, H.; Zhao, K.; Lei, H.; Shen, X.; Liu, Y.; Liao, X.; Li, T. Genome-wide analysis of the GH3 family in apple (Malus × domestica). BMC Genom. 2013, 14. [Google Scholar] [CrossRef] [PubMed]
  6. Yang, Y.; Yue, R.; Sun, T.; Zhang, L.; Chen, W.; Zeng, H.; Wang, H.; Shen, C. Genome-wide identification, expression analysis of GH3 family genes in Medicago truncatula under stress-related hormones and Sinorhizobium meliloti infection. Appl. Microbial. Biotechnol. 2015, 99, 841–854. [Google Scholar] [CrossRef] [PubMed]
  7. Liao, D.; Chen, X.; Chen, A.; Wang, H.; Liu, J.; Liu, J.; Gu, M.; Sun, S.; Xu, G. The characterization of six auxin-induced tomato GH3 genes uncovers a member, SlGH3.4, strongly responsive to arbuscular mycorrhizal symbiosis. Plant Cell Physiol. 2015, 56, 674–687. [Google Scholar] [CrossRef] [PubMed]
  8. Westfall, C.S.; Zubieta, C.; Herrmann, J.; Kapp, U.; Nanao, M.H.; Jez, J.M. Structural basis for prereceptor modulation of plant hormones by GH3 proteins. Science 2012, 336, 1708–1711. [Google Scholar] [CrossRef] [PubMed]
  9. Bierfreund, N.M.; Tintelnot, S.; Reski, R.; Decker, E.L. Loss of GH3 function does not affect phytochrome-mediated development in a moss, Physcomitrella patens. J. Plant Physiol. 2004, 161, 823–835. [Google Scholar] [CrossRef] [PubMed]
  10. Bowman, J.L.; Kohchi, T.; Yamato, K.T.; Jenkins, J.; Shu, S.; Ishizaki, K.; Yamaoka, S.; Nishihama, R.; Nakamura, Y.; Berger, F. Insights into land plant evolution garnered from the Marchantia polymorpha genome. Cell 2017, 171, 287–304. [Google Scholar] [CrossRef] [PubMed]
  11. Nishiyama, T.; Fujita, T.; Shin, T.; Seki, M.; Nishide, H.; Uchiyama, I.; Kamiya, A.; Carninci, P.; Hayashizaki, Y.; Shinozaki, K.; et al. Comparative genomics of Physcomitrella patens gametophytic transcriptome and Arabidopsis thaliana: Implication for land plant evolution. Proc. Natl. Acad. Sci. USA 2003, 100, 8007–8012. [Google Scholar] [CrossRef] [PubMed] [Green Version]
  12. Mellor, N.; Band, L.R.; Pencik, A.; Novak, O.; Rashed, A.; Holman, T.; Wilson, M.H.; Voss, U.; Bishopp, A.; King, J.R.; et al. Dynamic regulation of auxin oxidase and conjugating enzymes AtDAO1 and GH3 modulates auxin homeostasis. Proc. Natl. Acad. Sci. USA 2016, 113, 11022–11027. [Google Scholar] [CrossRef] [PubMed]
  13. Staswick, P.E.; Tiryaki, I.; Rowe, M.L. Jasmonate response locus JAR1 and several related Arabidopsis genes encode enzymes of the firefly luciferase superfamily that show activity on jasmonic, salicylic, and indole-3-acetic acids in an assay for adenylation. Plant Cell 2002, 14, 1405–1415. [Google Scholar] [CrossRef] [PubMed]
  14. Okrent, R.A.; Wildermuth, M.C. Evolutionary history of the GH3 family of acyl adenylases in rosids. Plant Mol. Biol. 2011, 76, 489–505. [Google Scholar] [CrossRef] [PubMed]
  15. Jagadeeswaran, G.; Raina, S.; Acharya, B.R.; Maqbool, S.B.; Mosher, S.L.; Appel, H.M.; Schultz, J.C.; Klessig, D.F.; Raina, R. Arabidopsis GH3-LIKE DEFENSE GENE 1 is required for accumulation of salicylic acid, activation of defense responses and resistance to Pseudomonas syringae. Plant J. 2007, 51, 234–246. [Google Scholar] [CrossRef] [PubMed] [Green Version]
  16. Westfall, C.S.; Herrmann, J.; Chen, Q.; Wang, S.; Jez, J.M. Modulating plant hormones by enzyme action: The GH3 family of acyl acid amido synthetases. Plant Signal Behav. 2010, 5, 1607–1612. [Google Scholar] [CrossRef] [PubMed]
  17. Koo, A.J.; Gao, X.; Jones, A.D.; Howe, G.A. A rapid wound signal activates the systemic synthesis of bioactive jasmonates in Arabidopsis. Plant J. 2009, 59, 974–986. [Google Scholar] [CrossRef] [PubMed]
  18. Havko, N.E.; Major, I.T.; Jewell, J.B.; Attaran, E.; Browse, J.; Howe, G.A. Control of carbon assimilation and partitioning by jasmonate: An accounting of growth–defense tradeoffs. Plants 2016, 5. [Google Scholar] [CrossRef] [PubMed]
  19. Campos, M.L.; Yoshida, Y.; Major, I.T.; De, D.O.F.; Weraduwage, S.M.; Froehlich, J.E.; Johnson, B.F.; Kramer, D.M.; Jander, G.; Sharkey, T.D. Rewiring of jasmonate and phytochrome B signalling uncouples plant growth-defense tradeoffs. Nat. Commun. 2016, 7. [Google Scholar] [CrossRef] [PubMed]
  20. Van Loon, L.C.; Bakker, P.A.; Pieterse, C.M. Systemic resistance induced by rhizosphere bacteria. Ann. Rev. Phytopathol. 1998, 36, 453–483. [Google Scholar] [CrossRef] [PubMed]
  21. Rao, M.V.; Hyungil, L.; Creelman, R.A.; Mullet, J.E.; Davis, K.R. Jasmonic acid signaling modulates ozone-induced hypersensitive cell death. Plant Cell 2000, 12, 1633–1646. [Google Scholar] [CrossRef] [PubMed]
  22. Heitz, T.; Widemann, E.; Lugan, R.; Miesch, L.; Ullmann, P.; Désaubry, L.; Holder, E.; Grausem, B.; Kandel, S.; Miesch, M. Cytochromes P450 CYP94C1 and CYP94B3 catalyze two successive oxidation steps of plant hormone Jasmonoyl-isoleucine for catabolic turnover. J. Biol. Chem. 2012, 287, 6296–6306. [Google Scholar] [CrossRef] [PubMed]
  23. Westfall, C.S.; Sherp, A.M.; Zubieta, C.; Alvarez, S.; Schraft, E.; Marcellin, R.; Ramirez, L.; Jez, J.M. Arabidopsis thaliana GH3.5 acyl acid amido synthetase mediates metabolic crosstalk in auxin and salicylic acid homeostasis. Proc. Natl. Acad. Sci. USA 2016, 113, 13917–13922. [Google Scholar] [CrossRef] [PubMed]
  24. Okrent, R.A.; Brooks, M.D.; Wildermuth, M.C. Arabidopsis GH3.12 (PBS3) conjugates amino acids to 4-substituted benzoates and is inhibited by salicylate. J. Biol. Chem. 2009, 284, 9742–9754. [Google Scholar] [CrossRef] [PubMed]
  25. Takase, T.; Nakazawa, M.; Ishikawa, A.; Kawashima, M.; Ichikawa, T.; Takahashi, N.; Shimada, H.; Manabe, K.; Matsui, M. ydk1-D, an auxin-responsive GH3 mutant that is involved in hypocotyl and root elongation. Plant J. 2004, 37, 471–483. [Google Scholar] [CrossRef] [PubMed]
  26. Nakazawa, M.; Yabe, N.; Ichikawa, T.; Yamamoto, Y.Y.; Yoshizumi, T.; Hasunuma, K.; Matsui, M. DFL1, an auxin-responsive GH3 gene homologue, negatively regulates shoot cell elongation and lateral root formation, and positively regulates the light response of hypocotyl length. Plant J. 2001, 25, 213–221. [Google Scholar] [CrossRef] [PubMed]
  27. Khan, S.; Stone, J.M. Arabidopsis thaliana GH3.9 influences primary root growth. Planta 2007, 226, 21–34. [Google Scholar] [CrossRef] [PubMed]
  28. Paponov, I.A.; Teale, W.; Lang, D.; Paponov, M.; Reski, R.; Rensing, S.A.; Palme, K. The evolution of nuclear auxin signalling. BMC Evol. Biol. 2009, 9. [Google Scholar] [CrossRef] [PubMed]
  29. Ren, H.; Gray, W.M. SAUR proteins as effectors of hormonal and environmental signals in plant growth. Mol. Plant 2015, 8, 1153–1164. [Google Scholar] [CrossRef] [PubMed]
  30. Withers, J.; Yao, J.; Mecey, C.; Howe, G.A.; Melotto, M.; He, S.Y. Transcription factor-dependent nuclear localization of a transcriptional repressor in jasmonate hormone signaling. Proc. Natl. Acad. Sci. USA 2012, 109, 20148–20153. [Google Scholar] [CrossRef] [PubMed] [Green Version]
  31. Terol, J.; Domingo, C.; Talon, M. The GH3 family in plants: Genome wide analysis in rice and evolutionary history based on EST analysis. Gene 2006, 371, 279–290. [Google Scholar] [CrossRef] [PubMed]
  32. Nystedt, B.; Street, N.R.; Wetterbom, A.; Zuccolo, A.; Lin, Y.C.; Scofield, D.G.; Vezzi, F.; Delhomme, N.; Giacomello, S.; Alexeyenko, A. The Norway spruce genome sequence and conifer genome evolution. Nature 2013, 497, 579. [Google Scholar] [CrossRef] [PubMed] [Green Version]
  33. Stumpe, M.; Göbel, C.; Faltin, B.; Beike, A.K.; Hause, B.; Himmelsbach, K.; Bode, J.; Kramell, R.; Wasternack, C.; Frank, W. The moss Physcomitrella patens contains cyclopentenones but no jasmonates: Mutations in allene oxide cyclase lead to reduced fertility and altered sporophyte morphology. New Phytol. 2010, 188, 740–749. [Google Scholar] [CrossRef] [PubMed]
  34. Yamamoto, Y.; Ohshika, J.; Takahashi, T.; Ishizaki, K.; Kohchi, T.; Matusuura, H.; Takahashi, K. Functional analysis of allene oxide cyclase, MpAOC, in the liverwort Marchantia polymorpha. Phytochemistry 2015, 116, 48–56. [Google Scholar] [CrossRef] [PubMed]
  35. Böttcher, C.; Boss, P.K.; Davies, C. Acyl substrate preferences of an IAA-amido synthetase account for variations in grape (Vitis vinifera L.) berry ripening caused by different auxinic compounds indicating the importance of auxin conjugation in plant development. J. Exp. Bot. 2011, 62, 4267–4280. [Google Scholar] [CrossRef] [PubMed]
  36. Feng, S.; Yue, R.; Tao, S.; Yang, Y.; Zhang, L.; Xu, M.; Wang, H.; Shen, C. Genome-wide identification, expression analysis of auxin-responsive GH3 family genes in maize (Zea mays L.) under abiotic stresses. J. Integr. Plant Biol. 2015, 57, 783–795. [Google Scholar] [CrossRef] [PubMed]
  37. Große-Veldmann, B.; Korotkova, T.; Reinken, J.A.; Lobin, H.; Barthlott, W. Amborella trichopoda—Cultivation of the most ancestral angiosperm in Botanic Gardens. Veldmann 2011, 19, 143–155. [Google Scholar]
  38. Kuang, J.F.; Zhang, Y.; Chen, J.Y.; Chen, Q.J.; Jiang, Y.M.; Lin, H.T.; Xu, S.J.; Lu, W.J. Two GH3 genes from longan are differentially regulated during fruit growth and development. Gene 2011, 485, 1–6. [Google Scholar] [CrossRef] [PubMed]
  39. Singh, V.K.; Jain, M.; Garg, R. Genome-wide analysis and expression profiling suggest diverse roles of GH3 genes during development and abiotic stress responses in legumes. Front. Plant Sci. 2014, 5. [Google Scholar] [CrossRef] [PubMed]
  40. Zhang, C.; Wang, D.; Yang, C.; Kong, N.; Shi, Z.; Zhao, P.; Nan, Y.; Nie, T.; Wang, R.; Ma, H.; et al. Genome-wide identification of the potato WRKY transcription factor family. PLoS ONE 2017, 12. [Google Scholar] [CrossRef] [PubMed]
  41. Yan, J.; Zhang, C.; Gu, M.; Bai, Z.; Zhang, W.; Qi, T.; Cheng, Z.; Peng, W.; Luo, H.; Nan, F. The Arabidopsis CORONATINE INSENSITIVE1 Protein Is a Jasmonate Receptor. Plant Cell 2009, 21, 2220–2236. [Google Scholar] [CrossRef] [PubMed] [Green Version]
  42. Xu, L.; Liu, F.; Lechner, E.; Genschik, P.; Crosby, W.L.; Ma, H.; Peng, W.; Huang, D.; Xie, D. The SCF( COI1) ubiquitin-ligase complexes are required for jasmonate response in Arabidopsis. Plant Cell 2002, 14, 1919–1935. [Google Scholar] [CrossRef] [PubMed]
  43. Goossens, J.; Swinnen, G.; Vanden Bossche, R.; Pauwels, L.; Goossens, A. Change of a conserved amino acid in the MYC2 and MYC3 transcription factors leads to release of JAZ repression and increased activity. New Phytol. 2015, 206, 1229–1237. [Google Scholar] [CrossRef] [PubMed] [Green Version]
  44. Van der Fits, L.; Memelink, J. ORCA3, a jasmonate-responsive transcriptional regulator of plant primary and secondary metabolism. Science 2000, 289, 295–297. [Google Scholar]
  45. Massa, A.N.; Childs, K.L.; Buell, C.R. Abiotic and biotic stress responses in Solanum tuberosum group Phureja DM1-3 516 R44 as measured through whole transcriptome sequencing. Plant Genome 2013. [Google Scholar] [CrossRef]
  46. Takahashi, K.; Fujino, K.; Kikuta, Y.; Koda, Y. Expansion of potato cells in response to jasmonic acid. Plant Sci. 1994, 100, 3–8. [Google Scholar] [CrossRef]
  47. Koda, Y.; Kikuta, Y.; Tazaki, H.; Tsujino, Y.; Sakamura, S.; Yoshihara, T. Potato tuber-inducing activities of jasmonic acid and related compounds. Phytochemistry 1991, 30, 1435–1438. [Google Scholar] [CrossRef]
  48. Hannapel, D.J. A model system of development regulated by the long-distance transport of mRNA. J. Integr. Plant Biol. 2010, 52, 40–52. [Google Scholar] [CrossRef] [PubMed]
  49. Ulloa, R.M.; Raíces, M.; Macintosh, G.C.; Maldonado, S.; Télleziñón, M.T. Jasmonic acid affects plant morphology and calcium-dependent protein kinase expression and activity in Solanum tuberosum. Physiol. Plant 2002, 115. [Google Scholar] [CrossRef]
  50. Sarkar, D.; Pandey, S.K.; Sharma, S. Cytokinins antagonize the jasmonates action on the regulation of potato (Solanum tuberosum) tuber formation in vitro. Plant Cell Tissue Organ. C. 2006, 87. [Google Scholar] [CrossRef]
  51. Kong, H.; Landherr, L.L.; Frohlich, M.W.; Leebens-Mack, J.; Ma, H.; DePamphilis, C.W. Patterns of gene duplication in the plant SKP1 gene family in angiosperms: Evidence for multiple mechanisms of rapid gene birth. Plant J. 2007, 50, 873–885. [Google Scholar] [CrossRef] [PubMed]
  52. Rozas, J.; Ferrermata, A.; Sánchezdelbarrio, J.C.; Guiraorico, S.; Librado, P.; Ramosonsins, S.E.; Sánchezgracia, A. DnaSP 6: DNA sequence polymorphism analysis of large datasets. Mol. Biol. Evol. 2017, 34, 3299–3302. [Google Scholar] [CrossRef] [PubMed]
  53. Xu, X.; Pan, S.; Cheng, S.; Zhang, B.; Mu, D.; Ni, P.; Zhang, G.; Yang, S.; Li, R.; Wang, J.; et al. Genome sequence and analysis of the tuber crop potato. Nature 2011, 475, 189–195. [Google Scholar] [CrossRef] [PubMed] [Green Version]
  54. Liu, C.; Wang, X.; Xu, Y.; Deng, X.; Xu, Q. Genome-wide analysis of the R2R3-MYB transcription factor gene family in sweet orange (Citrus sinensis). Mol. Biol. Rep. 2014, 41, 6769–6785. [Google Scholar] [CrossRef] [PubMed]
  55. Nicot, N.; Hausman, J.F.; Hoffmann, L.; Evers, D. Housekeeping gene selection for real-time RT-PCR normalization in potato during biotic and abiotic stress. J. Exp. Bot. 2005, 56, 2907–2914. [Google Scholar] [CrossRef] [PubMed] [Green Version]
  56. Liu, B.; Zhang, G.; Murphy, A.; De, K.D.; Tai, H.; Bizimungu, B.; Si, H.; Li, X.Q. Differences between the bud end and stem end of potatoes in dry matter content, starch granule size, and carbohydrate metabolic gene expression at the growing and sprouting stages. J. Agric. Food Chem. 2016, 64, 1176–1185. [Google Scholar] [CrossRef] [PubMed]
Figure 1. Unrooted Neighbor-Joining tree constructs from GH3 proteins of 48 plant species. The protein names and lines having different colors in the phylogenetic tree represent the proteins belonging to different lineages. Information for each color is displayed in the lower right corner of the figure. Subfamilies are distinguished by three curves with different colors. Blue, green, and purple indicate group I, II, and III, respectively.
Ijms 19 01850 g001
Figure 2. Gene motifs of seven plant species. The species belong to different lineages, including M.a polymorpha L., P. patens, S. moellendorffii, P. abies, S. tuberosum, A. thaliana and O. sativa. On the left, the protein name and phylogenetic tree are shown. The different color boxes indicate 20 motifs, which were found by using the MEME program.
Ijms 19 01850 g002
Figure 3. Predictions of protein structure by analyzing 10 GH3 proteins. The selected proteins belonged to groups I and II. AtGH3.11 plays a key role in the JA pathway, and its mutant is named JAR1 [13]. YDK1-D is an AtGH3.2 mutant and responds to auxin [25]. The grey numbers (124, 137, 176, and so on) stand for the location of amino acids. The black annotates symbolize the secondary structure of the protein.
Ijms 19 01850 g003
Figure 4. Information from gene ontology annotations and the KEGG pathway. (A) GO annotation for StGH3 proteins. BP, MF, and CC indicate Biological Process, Molecular Function, and Cellular Component, respectively. The numbers on the abscissa indicate the number of predicted proteins; and (B) the GH3 proteins are related to the KEGG pathway. StGH3.1, StGH3.5, and StGH3.12 are predicted to be part of the JA pathway. The red box is a functional site for of these three proteins according to prediction. COI1 is a receptor [41] which can combine with ASK (Arabidopsis Skp-like protein) and AtRbx (Arabidopsis ring-box protein) to form the complex SCFCOI1 [42]. Jasmonate ZIM (JAZ) is a JA pathway suppressor. In the absence of JA, these proteins interact with MYC proteins to block their activity. The bHLH transcription factor MYC is a master regulator of the response to the JA pathway [43]. ORCA3 regulates basic and secondary metabolism of plants by JA induction [44].
Ijms 19 01850 g004
Figure 5. The heatmap based on the RNA-seq database under 10 treatments, which include biotics, abiotics, and hormones. The RNA-seq database was processed by log2 and stress, and hormonal data were compared with the control data. In the heat map, upregulated expression is in red and downregulated expression is in blue.
Ijms 19 01850 g005
Figure 6. StGH3 gene expression in different tissues and expression changes upon MeJA treatment for different time periods. (A) Expression changes upon MeJA treatment for different time periods; and (B) Expression in different tissues.
Ijms 19 01850 g006
Table 1. Glycoside Hydrolase 3 (GH3) genes identified in 48 sequenced plant genomes.
LineageOrganismGenome Total Length (Mb) 1Numbers of GH3 ProteinNumbers of Group I 2Numbers of Group II 3Numbers of Group IIITandem Duplication (Pairs) 4Segmental Duplication (Pairs) 5References
Algae Chlamydomonas reinhardtii120.405000000This study
Volvox carteri137.684000000This study
Mosses
Marchantia polymorpha L.205.718211000Bowman et al. [10]
Physcomitrella patens477.948220000Nicole et al. [9]
Ferns
Selaginella moellendorffii212.5021899021This study
Gymnosperms
Picea abies28354716000This study
Angiosperms
AmborellaceaeAmborella trichopoda #706.495624000This study
Eudicots
ChenopodiaceaeBeta vulgaris482.053514001This study
BrassicaceaeArabidopsis lyrata204.89817287100This study
Arabidopsis thaliana116.84619289112Jain et al. [4]
Brassica oleracea501.69235411201013This study
Brassica rapa284.1293851122813This study
Capsella rubella133.064202810123This study
SolanaceaeCapsicum annuum2935.881147001This study
Solanum lycopersicum760.06717116064This study
Solanum tuberosum705.9341349034This study
Leguminosae sp.Cajanus cajan620.6261248000This study
Cicer arietinum520.885725001This study
Glycine max953.339248160036This study
Lotus japonicus394.455716000This study
Medicago truncatula412.92417 *67072Yang et al. [6]
Phaseolus vulgaris535.4131248007This study
RosidsFragaria vesca214.373826000This study
Malus domestica1288.8715510014Yuan et al. [5]
Prunus mume234.03725001This study
Prunus persica212.767725001This study
Pyrus bretschneideri508.55115213004This study
CucurbitaceaeCitrullus lanatus321.047826010This study
Cucumis sativus323.9861037010This study
ActinidiaceaeActinidia chinensis604.21715411003This study
CaricaceaeCarica papaya370.419624000This study
EuphorbiaceaeRicinus communis350.622725000This study
LentibulariaceaeUtricularia gibba100.689624001This study
MalvaceaeTheobroma cacao335.43719217083This study
Gossypium raimondii767.66732610161211This study
Eucalyptus grandis691.43936002This study
NelumbonaceaeNelumbo nucifera797.4941147004This study
RutaceaeCitrus sinensis323.528927010This study
SalicaceaePopulus trichocarpa417.2871349008This study
VitaceaeVitis vinifera486.197936001Bottcher et al. [35]
Monocots
PoaceaeBrachypodium distachyon218.345926101This study
Hordeum vulgare1825.17514000This study
Oryza sativa374.4231349001Jain et al. [4]
Triticum urartu3747.05936000This study
Zea mays2145.451358013Feng et al. [36]
ArecaceaeElaeis guineensis1017.116511002This study
MusaceaeMusa acuminata472.231188100118This study
OrchidaceaePhalaenopsis equestris1064.2633000This study
Total 57915933985
1 The data are from NCBI (www.ncbi.nlm.nih.gov/genome/); 2 Group I represents proteins that may use jasmonic acid (JA) as a substrate to participate in the JA biological pathway; 3 Group II proteins may participate in the regulation of indolacetic acid (IAA); 4 JGI (https://phytozome.jgi.doe.gov/pz/portal.html) contains hole information; 5 Related information obtained from PGDD (http://chibba.agtec.uga.edu/duplication/); # Amborella trichopoda was known as the sister group of the remaining flowering plants in molecular phylogenetic analyses [37]; * Yang et al. showed that GH3 proteins were four separated subfamilies in Medicago truncatula, but MtGH3.14 was missing [6]. Subfamilies 1 and 3 could be considered as the same family according to the family classification of Arabidopsis [4]. Therefore, six proteins belonged to group I, seven proteins belonged to group II, and no proteins belonged to group III. The remaining three proteins were grouped separately.

