Time Dependent Pathway Activation of Signalling Cascades in Rat Organs after Short-Term Hyperoxia

 , ,
, ,
Abstract
:1. Introduction
2. Results
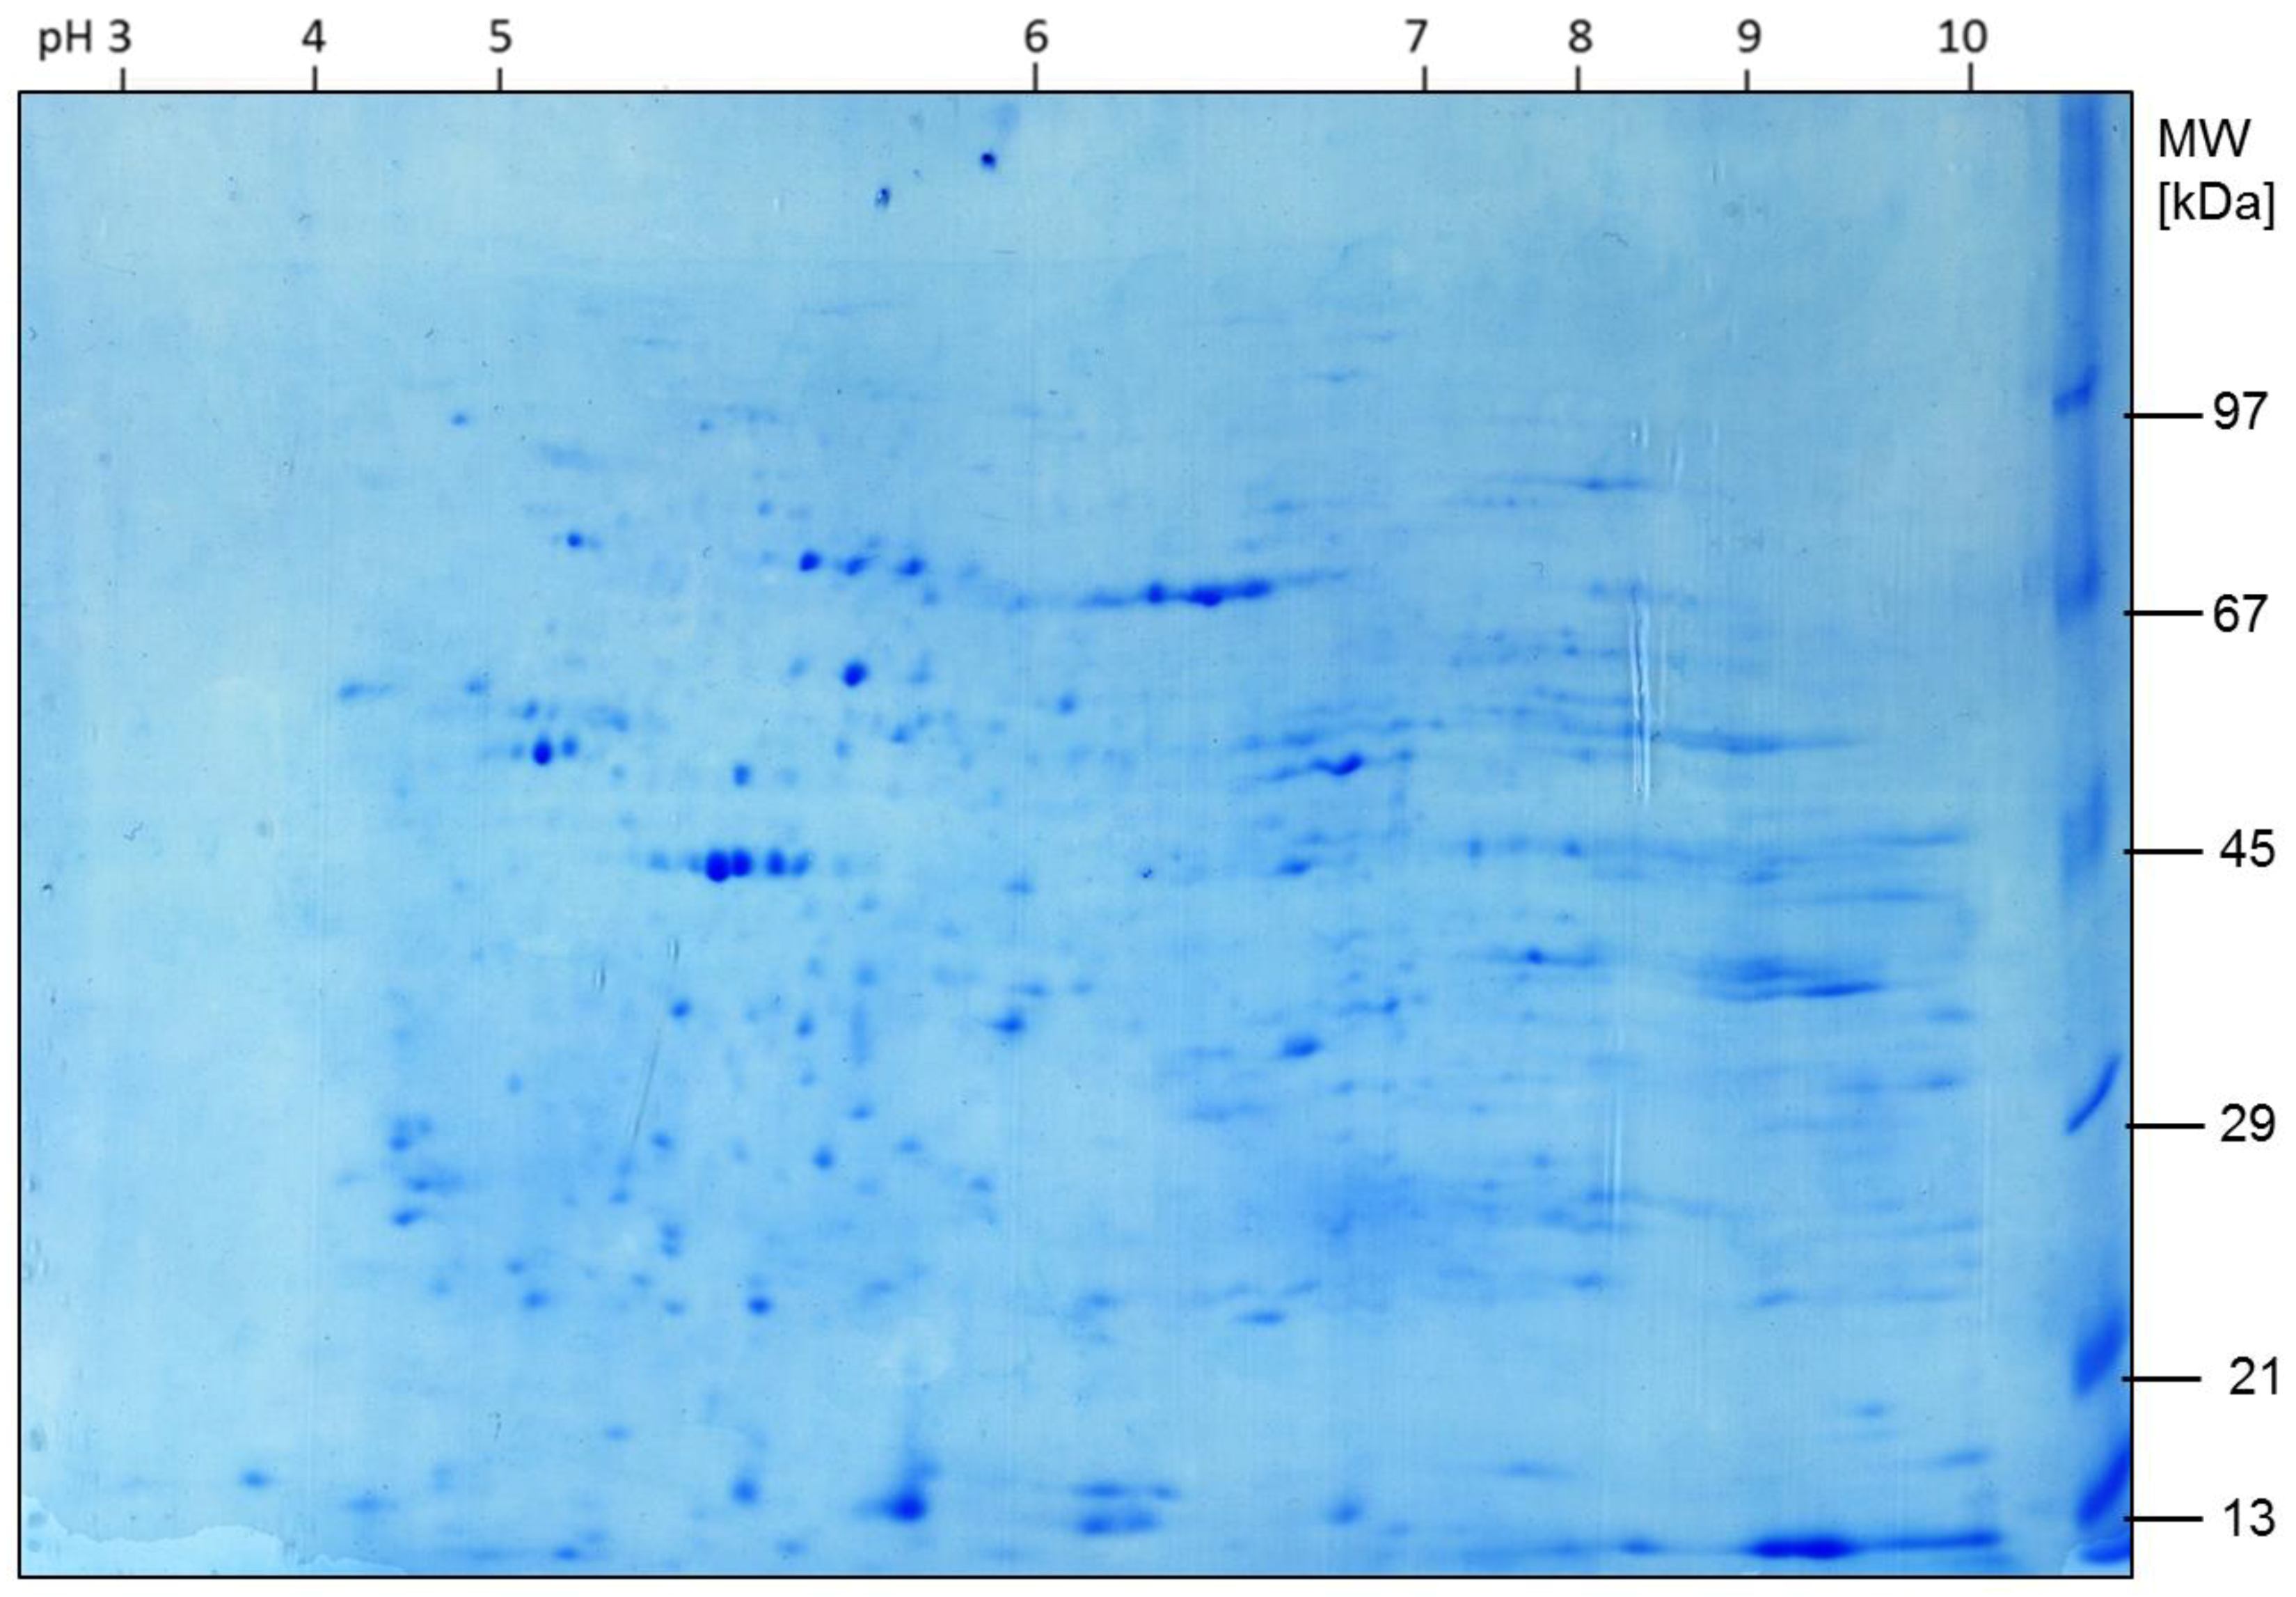
2.1. Expression of Proteins
2.2. Alterations in Protein Expression during Time
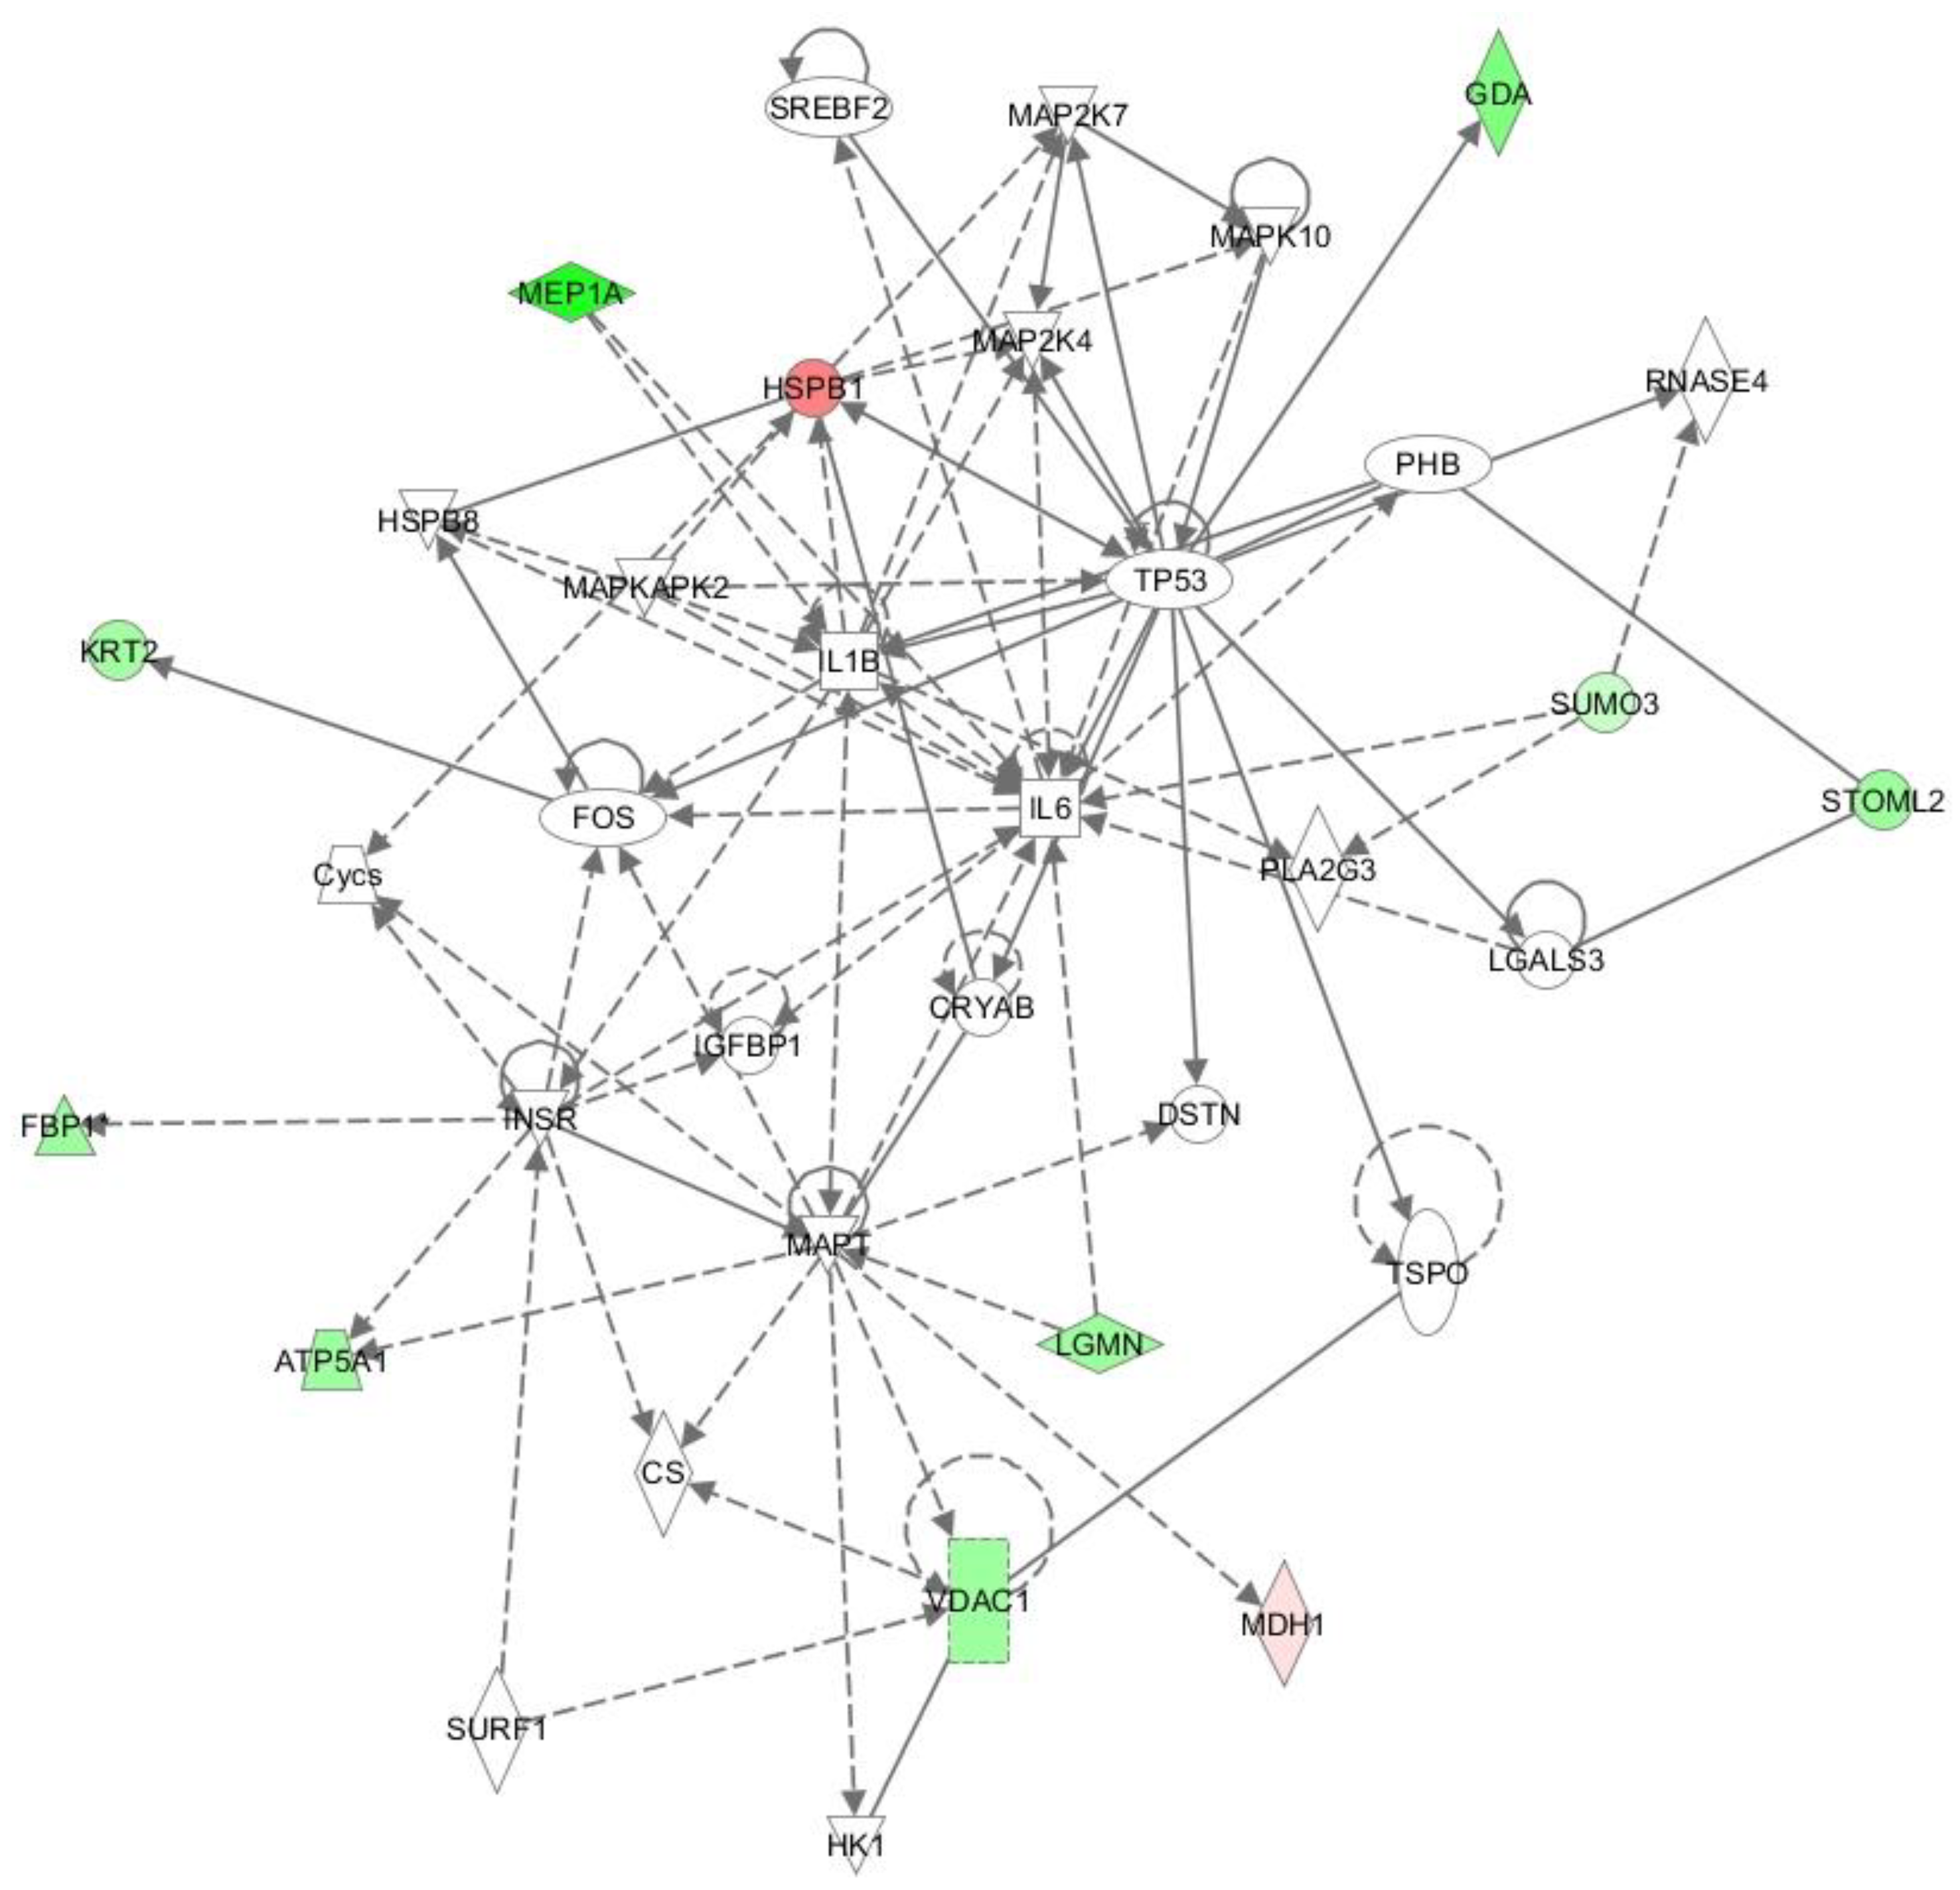
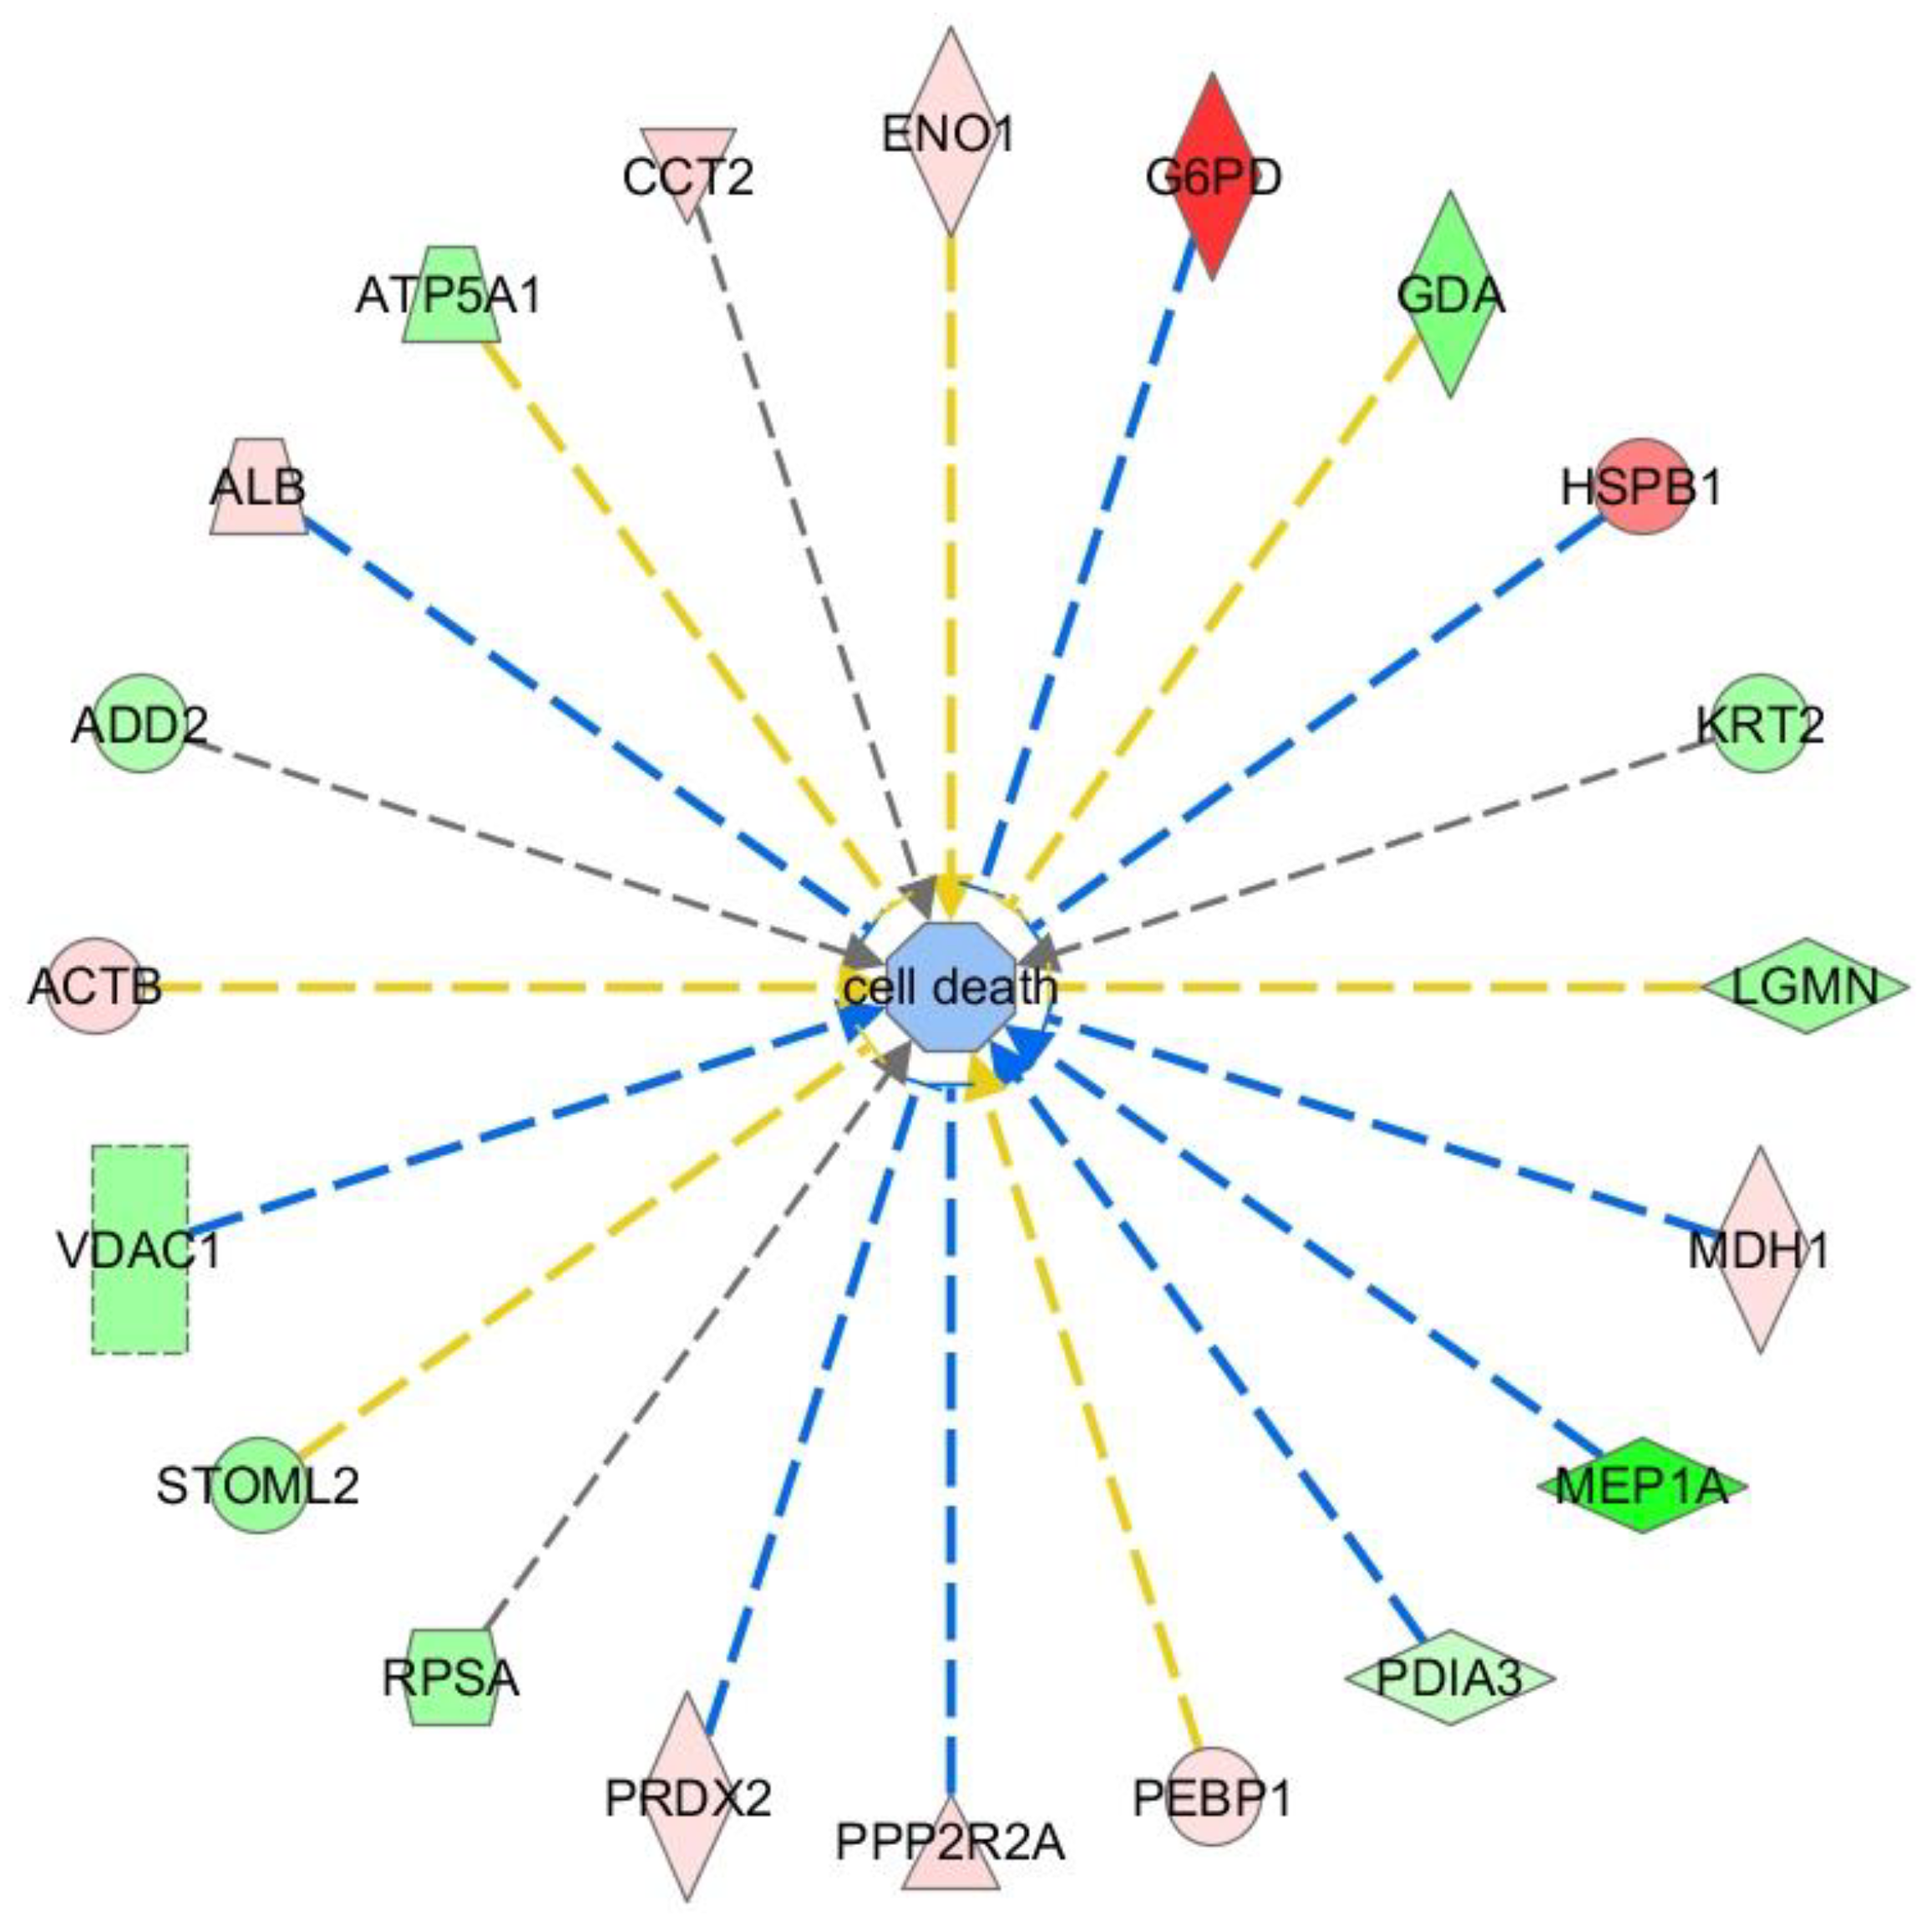
2.3. Ingenuity Pathway Analysis (IPA)
- Inflammation (inflammatory disease; p = 0.000000149; 11 proteins) and inflammatory response (inflammatory response; p = 0.000000149; 9 proteins).
- Apoptosis (cell death and survival; p = 0.000000189; 20 proteins) and cell death (p = 0.00000424; 20 proteins) (Figure 2).
2.4. Pathway Studio
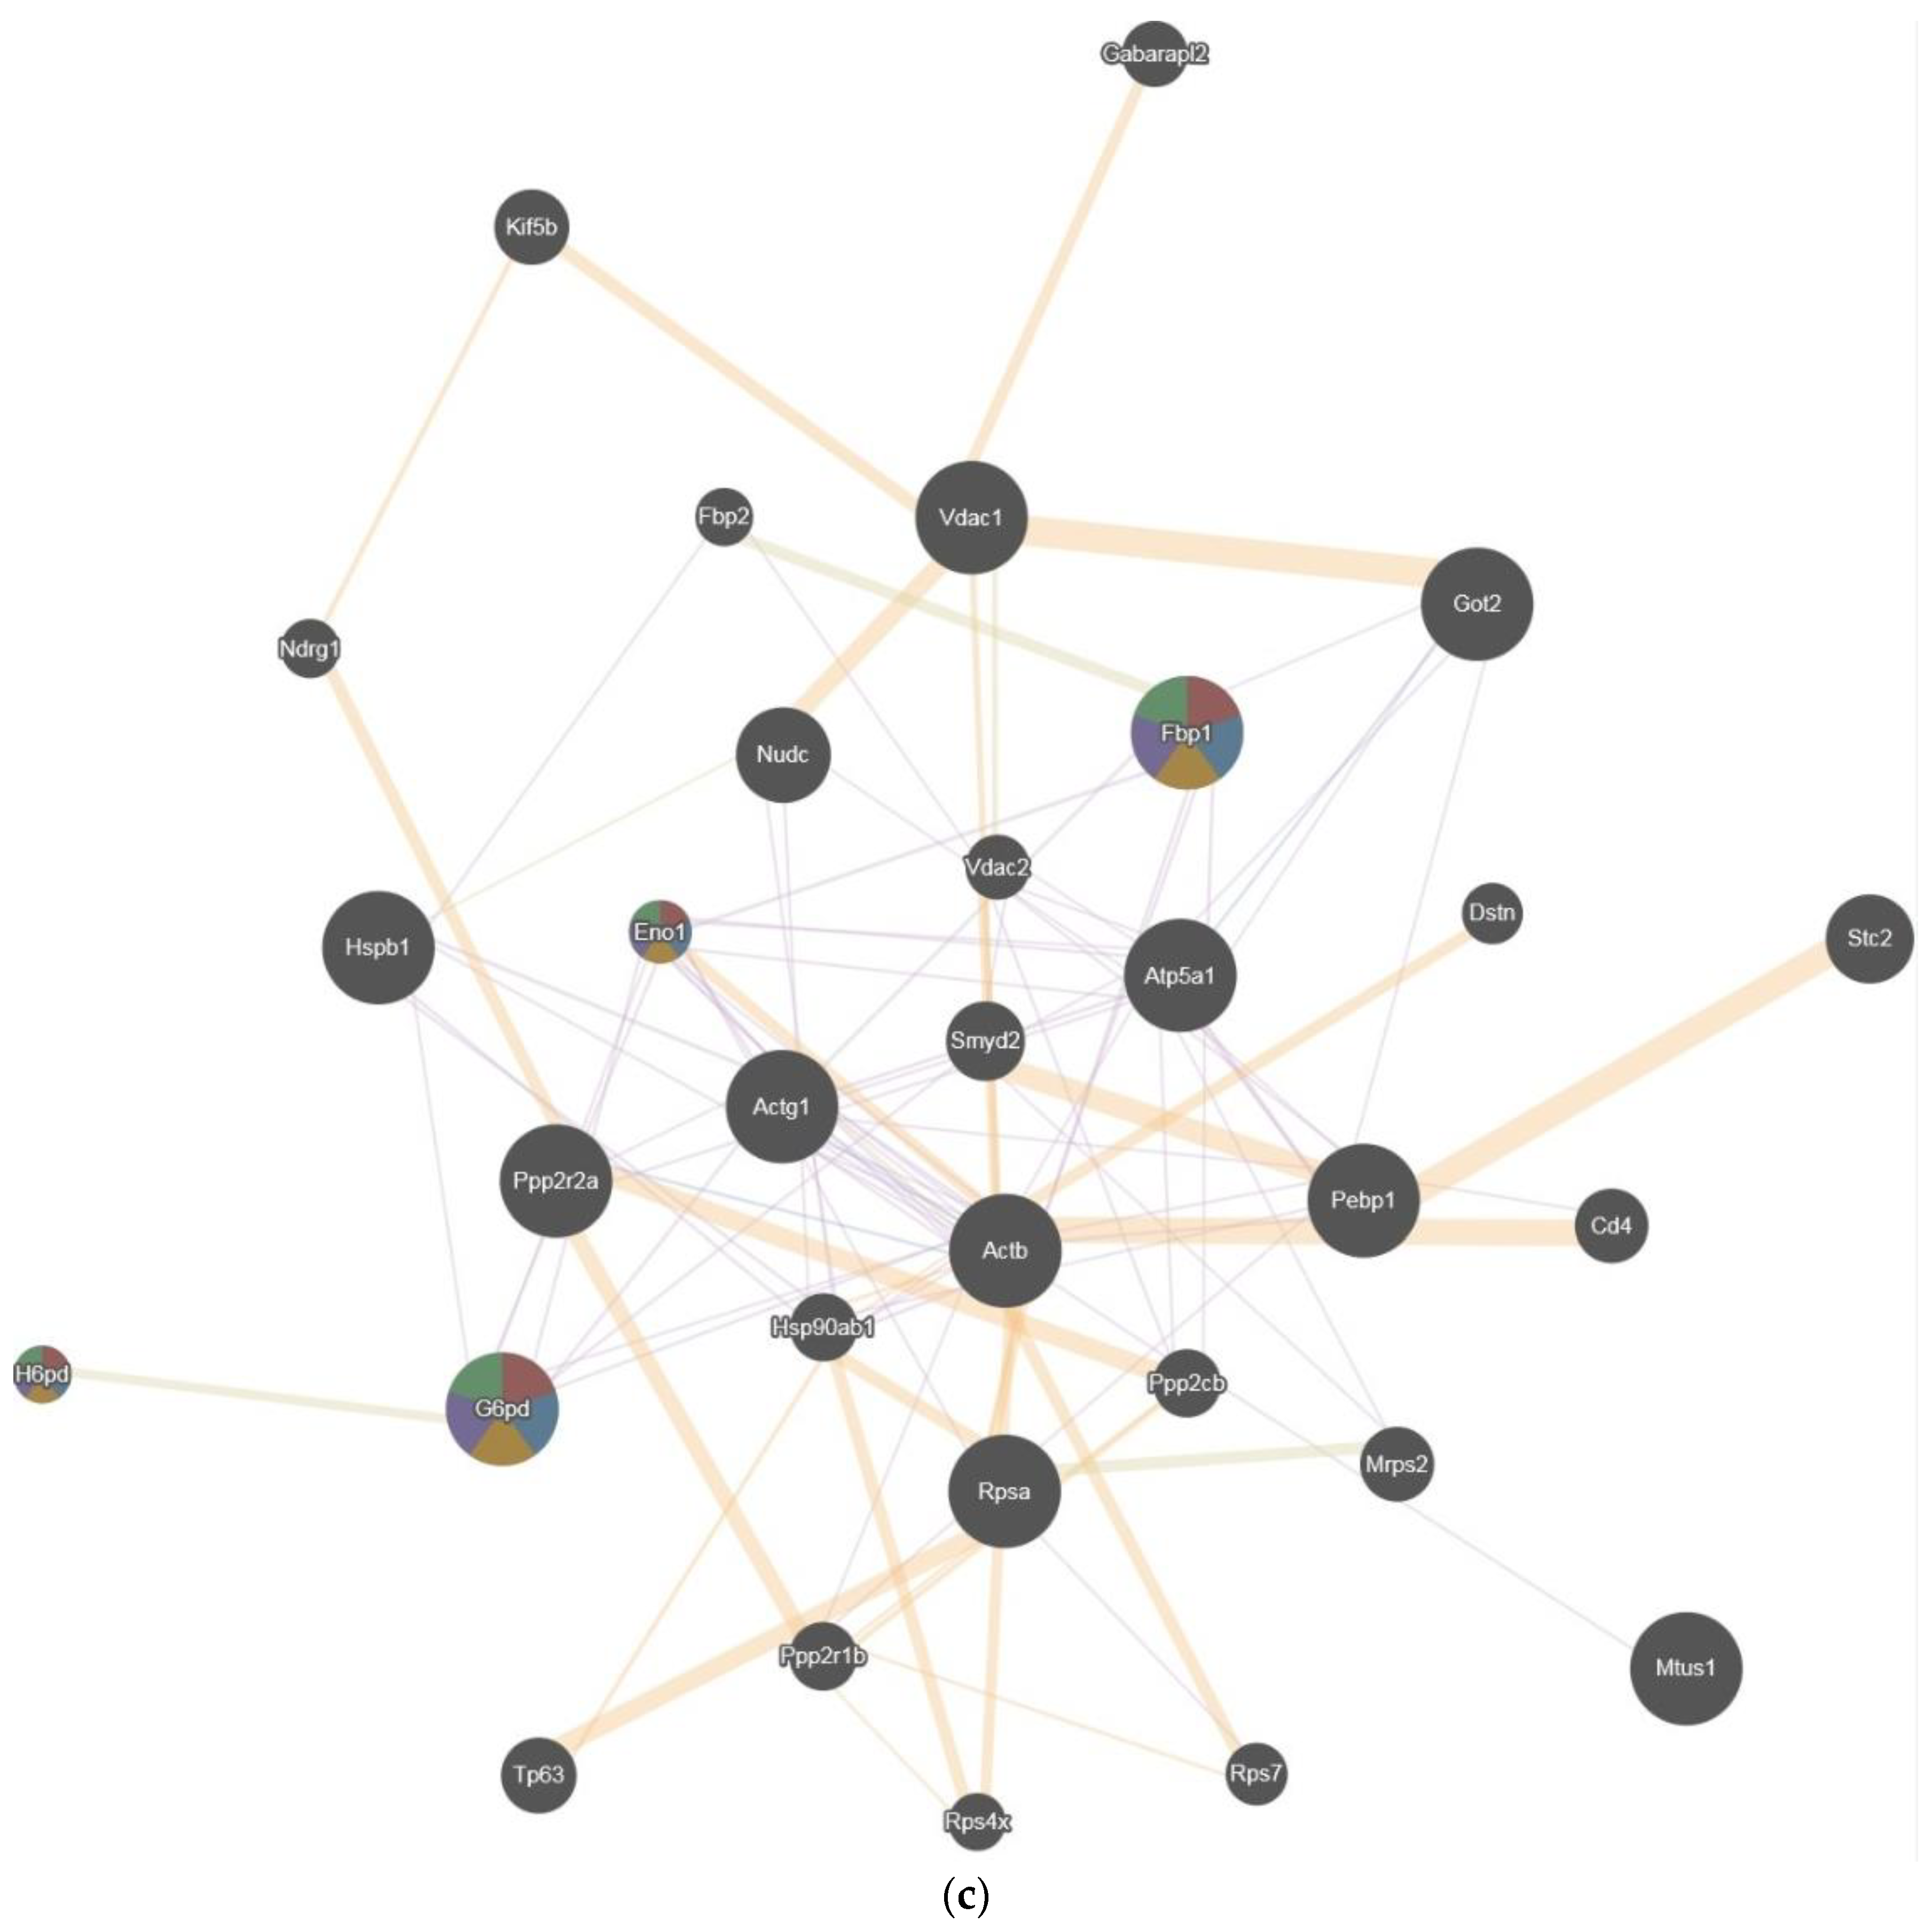
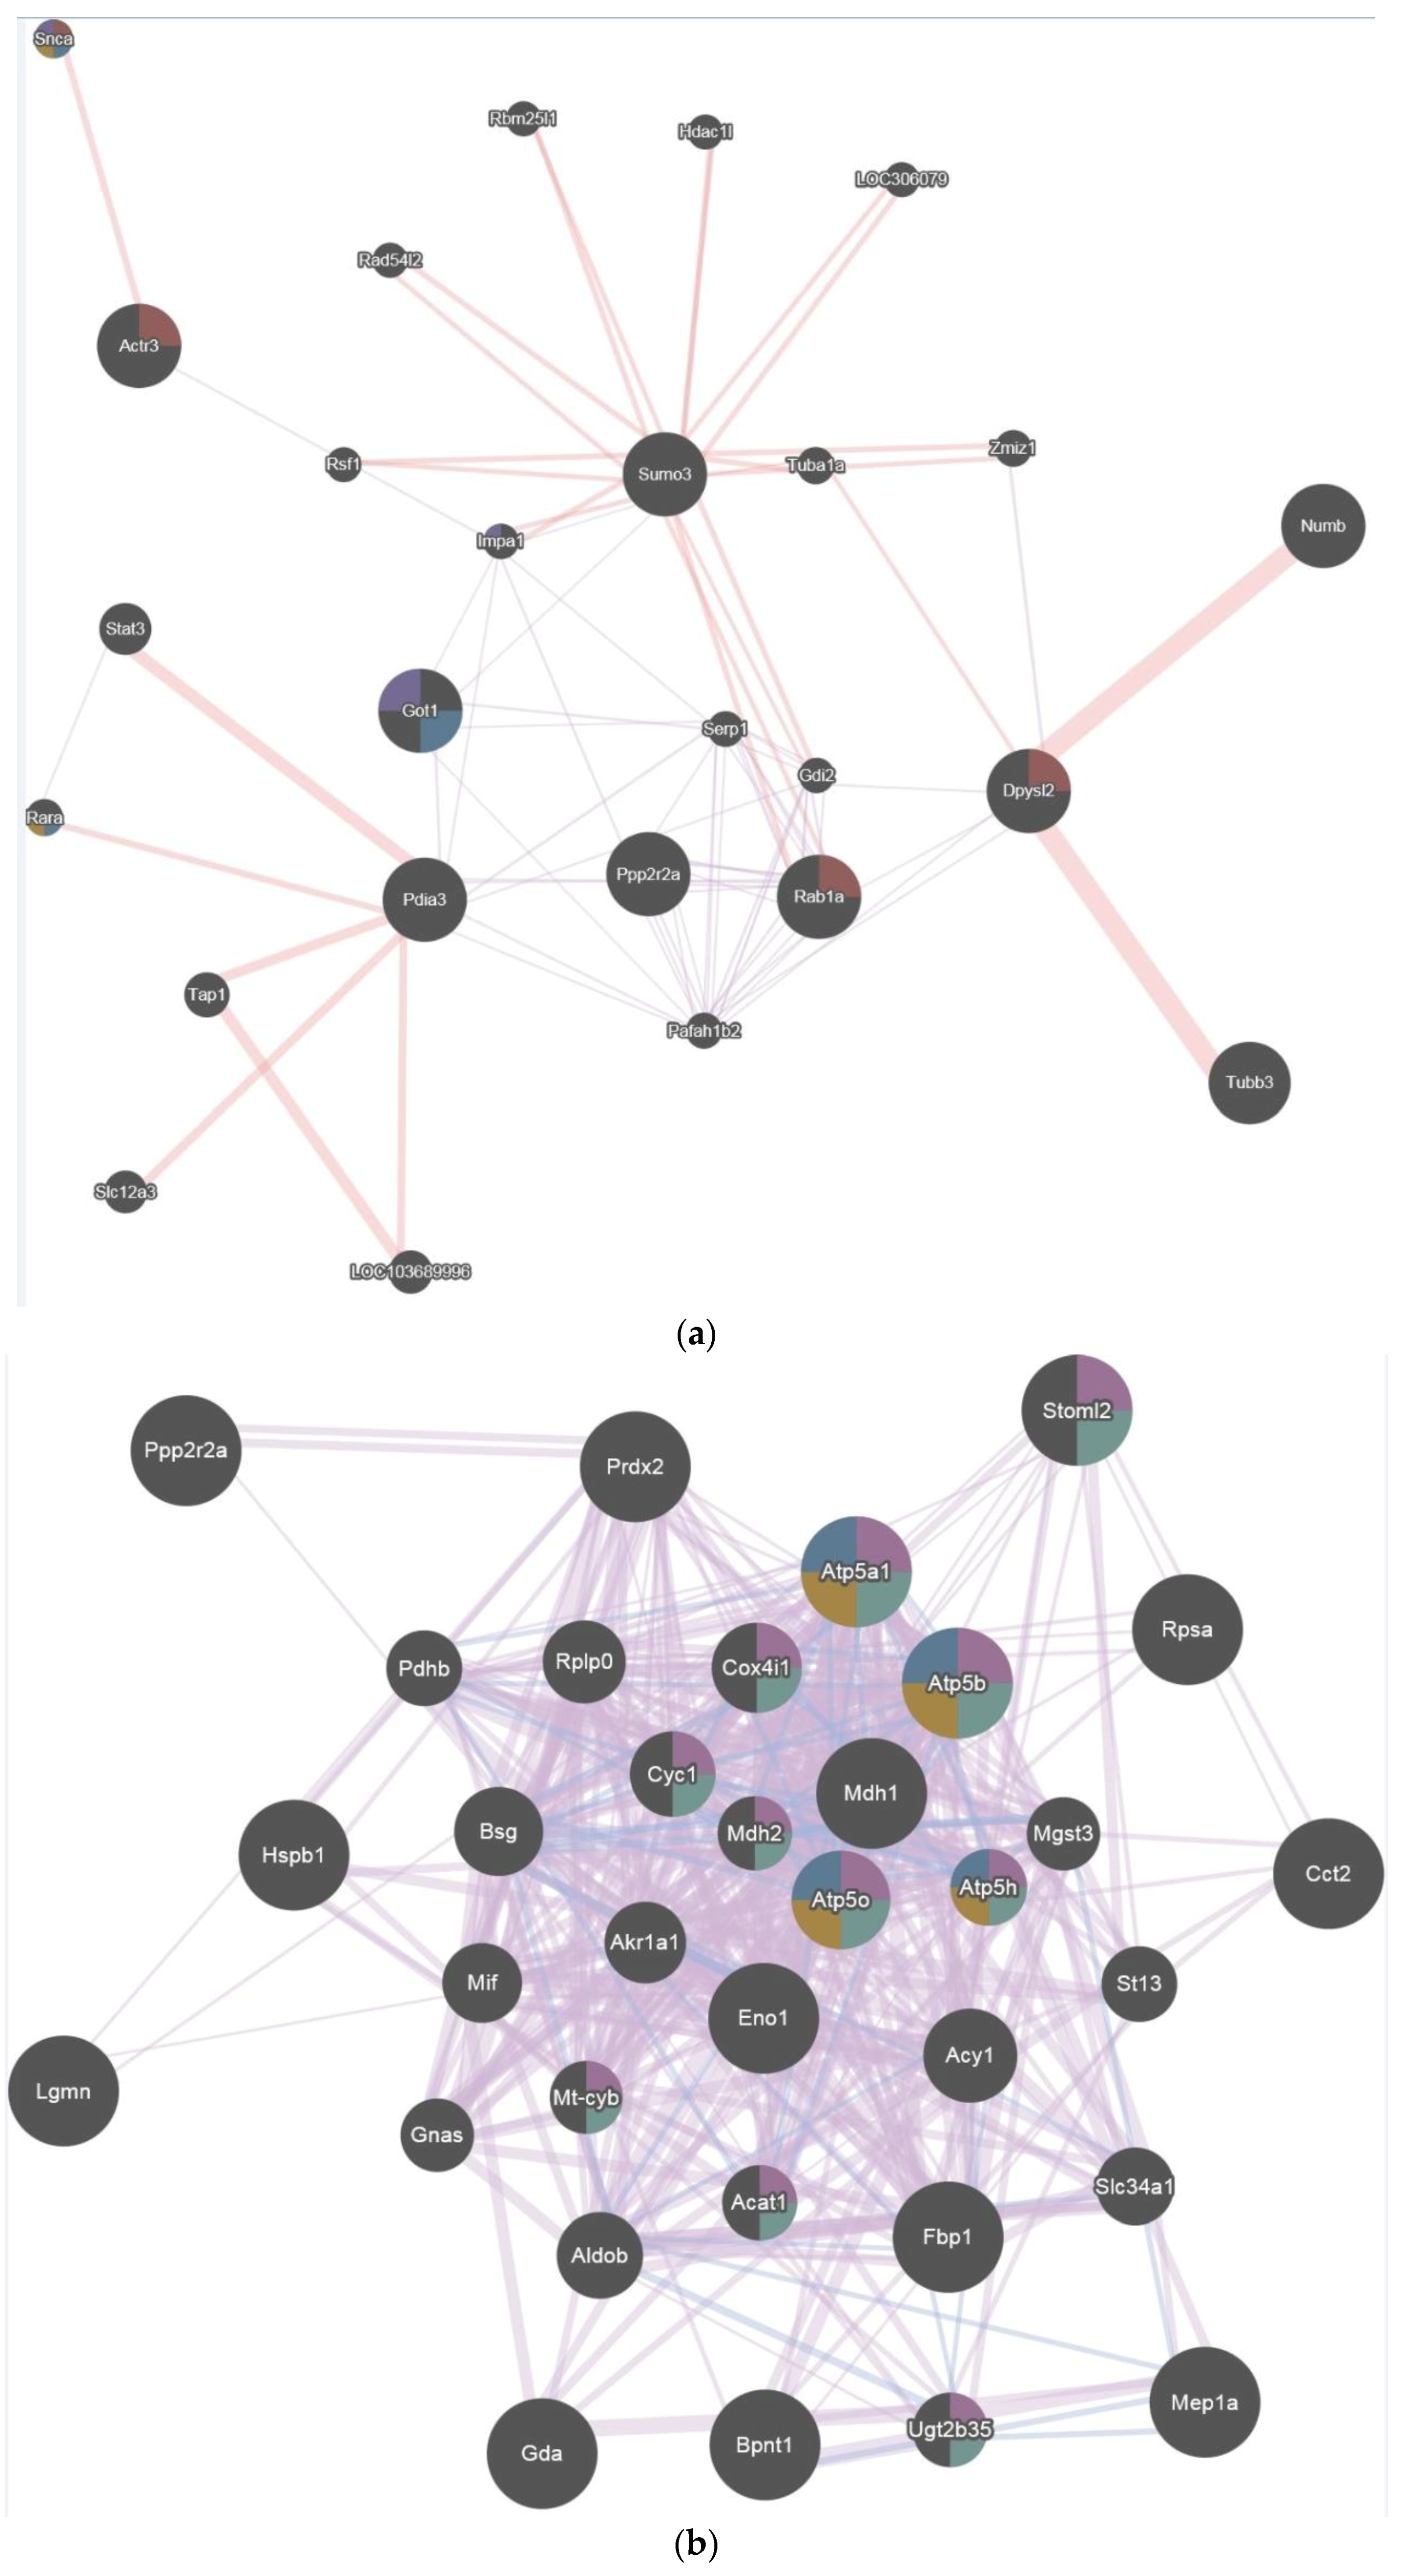
2.5. GENEmania
2.6. Hierarchical Cluster Analysis
3. Discussion
3.1. General Hyperoxia Considerations and Oxygen Toxicity
3.2. Protein Alterations in the Present Study
4. Materials and Methods
4.1. Experimental Hyperoxia Model and Proteomic Data from Previous Studies
4.2. Proteomic Analysis
4.3. Stepwise Bioinformatic Approach
4.4. Ingenuity Pathway Analysis
4.5. Pathway Studio
4.6. Network Analysis of Proteins (GeneMANIA®)
4.7. Hierarchical Cluster Analysis
4.8. Identification of Regulation Pathways and Biomarker Candidates
4.9. Statistical Analysis
5. Specific Proteins Involved
5.1. Meprin A (MEP1A)
5.2. Voltage-Dependent Anionselective Channel Protein 1 (VDAC1)
5.3. Peroxiredoxin 2 (PRDX2)
5.4. Glucose-6-Phosphate Dehydrogenase (G6PD)
5.5. Enolase 1 (ENO1)
5.6. Dihydropyrimidinase 2 (DYPSL2)
5.7. Heat Shock Protein beta-1 (HSPB1)
5.8. Protein Disulfide-Isomerase A3 (PDIA3)
5.9. b-Adducin 2 (ADD2)
5.10. Organ Effects
5.11. Interpretation of Changes in Protein Expression
5.12. Bioinformatic Analyses
5.13. Limitations
6. Conclusions
Author Contributions
Funding
Conflicts of Interest
References
- Damiani, E.; Adrario, E.; Girardis, M.; Romano, R.; Pelaia, P.; Singer, M.; Donati, A. Arterial hyperoxia and mortality in critically ill patients: A systematic review and meta-analysis. Crit. Care 2014, 18. [Google Scholar] [CrossRef] [PubMed]
- Kilgannon, J.H.; Jones, A.E.; Parrillo, J.E.; Dellinger, R.P.; Milcarek, B.; Hunter, K.; Shapiro, N.I.; Trzeciak, S.; Emergency Medicine Shock Research Network (EMShockNet) Investigators. Relationship between supranormal oxygen tension and outcome after resuscitation from cardiac arrest. Circulation 2011, 123, 2717–2722. [Google Scholar] [CrossRef] [PubMed]
- Kilgannon, J.H.; Jones, A.E.; Shapiro, N.I.; Angelos, M.G.; Milcarek, B.; Hunter, K.; Parrillo, J.E.; Trzeciak, S. Emergency Medicine Shock Research Network (EMShockNet) Investigators. Association between arterial hyperoxia following resuscitation from cardiac arrest and in-hospital mortality. J. Am. Med. Assoc. 2010, 303, 2165–2171. [Google Scholar] [CrossRef] [PubMed]
- Monsieurs, K.G.; Nolan, J.P.; Bossaert, L.L.; Greif, R.; Maconochie, I.K.; Nikolaou, N.I.; Perkins, G.D.; Soar, J.; Truhlář, A.; Wyllie, J.; et al. ERC Guidelines 2015 Writing Group. European resuscitation council guidelines for resuscitation 2015: Section 1. Executive summary. Resuscitation 2015, 95, 1–80. [Google Scholar] [CrossRef] [PubMed]
- Smit, B.; Smulders, Y.M.; van der Wouden, J.C.; Oudemans-van Straaten, H.M.; Spoelstra-de Man, A.M.E. Hemodynamic effects of acute hyperoxia: Systematic review and meta-analysis. Crit Care 2018, 22. [Google Scholar] [CrossRef] [PubMed]
- Hinkelbein, J.; Feldmann, R.E., Jr.; Kalenka, A. Time-dependent alterations of cerebral proteins following short-term normobaric hyperoxia. Mol. Cell. Biochem. 2010, 339, 9–21. [Google Scholar] [CrossRef] [PubMed]
- Spelten, O.; Wetsch, W.A.; Wrettos, G.; Kalenka, A.; Hinkelbein, J. Response of rat lung tissue to short-term hyperoxia: A proteomic approach. Mol. Cell. Biochem. 2014, 383, 231–242. [Google Scholar] [CrossRef] [PubMed]
- Gerschman, R.; Nye, S.W.; Gilbert, D.L.; Dwyer, P.; Fenn, W.O. Studies on oxygen poisoning: Protective effect of beta-mercaptoethylamine. Proc. Soc. Exp. Biol. Med. 1954, 85, 75–77. [Google Scholar] [CrossRef] [PubMed]
- Loeb, H.S.; Chuquimia, R.; Sinno, M.Z.; Rahimtoola, S.H.; Rosen, K.M.; Gunnar, R.M. Effects of low-flow oxygen on the hemodynamics and left ventricular function in patients with uncomplicated acute myocardial infarction. Chest 1971, 60, 352–355. [Google Scholar] [CrossRef] [PubMed]
- Hummler, J.K.; Dapaah-Siakwan, F.; Vaidya, R.; Zambrano, R.; Luo, S.; Chen, S.; Kerr, N.; Vaccari, J.P.; Keane, R.W.; Dietrich, W.D.; et al. Inhibition of rac1 signaling downregulates inflammasome activation and attenuates lung injury in neonatal rats exposed to hyperoxia. Neonatology 2017, 111, 280–288. [Google Scholar] [CrossRef] [PubMed]
- Liao, J.; Kapadia, V.S.; Brown, L.S.; Cheong, N.; Longoria, C.; Mija, D.; Ramgopal, M.; Mirpuri, J.; McCurnin, D.C.; Savani, R.C. The NLRP3 inflammasome is critically involved in the development of bronchopulmonary dysplasia. Nat. Commun. 2015, 6. [Google Scholar] [CrossRef] [PubMed]
- Vaidya, R.; Zambrano, R.; Hummler, J.K.; Luo, S.; Duncan, M.R.; Young, K.; Lau, L.F.; Wu, S. Recombinant CCN1 prevents hyperoxia-induced lung injury in neonatal rats. Pediatr. Res. 2017, 82, 863–871. [Google Scholar] [CrossRef] [PubMed] [Green Version]
- Alapati, D.; Rong, M.; Chen, S.; Hehre, D.; Hummler, S.C.; Wu, S. Inhibition of β-catenin signaling improves alveolarization and reduces pulmonary hypertension in experimental bronchopulmonary dysplasia. Am. J. Respir. Cell. Mol. Biol. 2014, 51, 104–113. [Google Scholar] [CrossRef] [PubMed]
- Sifringer, M.; Bendix, I.; Börner, C.; Endesfelder, S.; von Haefen, C.; Kalb, A.; Holifanjaniaina, S.; Prager, S.; Schlager, G.W.; Keller, M.; et al. Prevention of neonatal oxygen-induced brain damage by reduction of intrinsic apoptosis. Cell Death Dis. 2012, 3. [Google Scholar] [CrossRef] [PubMed]
- Dzietko, M.; Boos, V.; Sifringer, M.; Polley, O.; Gerstner, B.; Genz, K.; Endesfelder, S.; Börner, C.; Jacotot, E.; Chauvier, D.; et al. A critical role for Fas/CD-95 dependent signaling pathways in the pathogenesis of hyperoxia-induced brain injury. Ann. Neurol. 2008, 64, 664–673. [Google Scholar] [CrossRef] [PubMed]
- Felderhoff-Mueser, U.; Sifringer, M.; Polley, O.; Dzietko, M.; Leineweber, B.; Mahler, L.; Baier, M.; Bittigau, P.; Obladen, M.; Ikonomidou, C.; et al. Caspase-1-processed interleukins in hyperoxia-induced cell death in the developing brain. Ann. Neurol. 2005, 57, 50–59. [Google Scholar] [CrossRef] [PubMed]
- Rigbolt, K.T.; Vanselow, J.T.; Blagoev, B. GProX, a user-friendly platform for bioinformatics analysis and visualization of quantitative proteomics data. Mol. Cell. Proteom. 2011, 10. [Google Scholar] [CrossRef] [PubMed]
- Atkins, J.H.; Johansson, J.S. Technologies to shape the future: Proteomics applications in anesthesiology and critical care medicine. Anesth. Analg. 2006, 102, 1207–1216. [Google Scholar] [CrossRef] [PubMed]
- Ingenuity Systems Inc. Pathway Analysis Ingenuity. Available online: http://www.ingenuity.com (accessed on 30 September 2006).
- Warde-Farley, D.; Donaldson, S.L.; Comes, O.; Zuberi, K.; Badrawi, R.; Chao, P.; Franz, M.; Grouios, C.; Kazi, F.; Lopes, C.T.; et al. The GeneMANIA prediction server: Biological network integration for gene prioritization and predicting gene function. Nucl. Acids Res. 2010, 38, W214–W220. [Google Scholar] [CrossRef] [PubMed]
- Cerami, E.G.; Gross, B.E.; Demir, E.; Rodchenkov, I.; Babur, Ö.; Anwar, N.; Schultz, N.; Bader, G.D.; Sander, C. Pathway commons, a web resource for biological pathway data. Nucl. Acids Res. 2011, 39, D685–D690. [Google Scholar] [CrossRef] [PubMed]
- Mostafavi, S.; Ray, D.; Warde-Farley, D.; Grouios, C.; Morris, Q. GeneMANIA: A real-time multiple association network integration algorithm for predicting gene function. Genome Biol. 2008, 9. [Google Scholar] [CrossRef] [PubMed]
- Tang, G.; White, J.E.; Gordon, R.J.; Lumb, P.D.; Tsan, M.F. Polyethylene glycol-conjugated superoxide dismutase protects rats against oxygen toxicity. J. Appl. Physiol. 1993, 74, 1425–1431. [Google Scholar] [CrossRef] [PubMed]
- Asikainen, T.M.; White, C.W. Pulmonary antioxidant defenses in the preterm newborn with respiratory distress and bronchopulmonary dysplasia in evolution: Implications for antioxidant therapy. Antioxid. Redox Signal. 2004, 6, 155–167. [Google Scholar] [CrossRef] [PubMed]
- Turrens, J.F. Mitochondrial formation of reactive oxygen species. J. Physiol. 2003, 552, 335–344. [Google Scholar] [CrossRef] [PubMed]
- Sarafian, T.A.; Verity, M.A.; Vinters, H.V.; Shih, C.C.; Shi, L.; Ji, X.D.; Dong, L.; Shau, H. Differential expression of peroxiredoxin subtypes in human brain cell types. J. Neurosci. Res. 1999, 56, 206–212. [Google Scholar] [CrossRef]
- Taglialatela, G.; Perez-Polo, J.R.; Rassin, D.K. Induction of apoptosis in the CNS during development by the combination of hyperoxia and inhibition of glutathione synthesis. Free Radic. Biol. Med. 1998, 25, 936–942. [Google Scholar] [CrossRef]
- Calzia, E.; Asfar, P.; Hauser, B.; Matejovic, M.; Ballestra, C.; Radermacher, P.; Georgieff, M. Hyperoxia may be beneficial. Crit. Care Med. 2010, 38, S559–S568. [Google Scholar] [CrossRef] [PubMed]
- Lee, P.J.; Choi, A.M. Pathways of cell signaling in hyperoxia. Free Radic. Biol. Med. 2003, 35, 341–350. [Google Scholar] [CrossRef]
- Garcia-Nogales, P.; Almeida, A.; Bolanos, J.P. Peroxynitrite protects neurons against nitric oxide-mediated apoptosis. A key role for glucose-6-phosphate dehydrogenase activity in neuroprotection. J. Biol. Chem. 2003, 278, 864–874. [Google Scholar] [CrossRef] [PubMed]
- Zhang, X.; Shan, P.; Sasidhar, M.; Chupp, G.L.; Flavell, R.A.; Choi, A.M.; Lee, P.J. Reactive oxygen species and extracellular signal-regulated kinase 1/2 mitogen-activated protein kinase mediate hyperoxia-induced cell death in lung epithelium. Am. J. Respir. Cell Mol. Biol. 2003, 28, 305–315. [Google Scholar] [CrossRef] [PubMed]
- Lambeth, J.D. NOX enzymes and the biology of reactive oxygen. Nat. Rev. Immunol. 2004, 4, 181–189. [Google Scholar] [CrossRef] [PubMed]
- Torbati, D.; Tan, G.H.; Smith, S.; Frazier, K.S.; Gelvez, J.; Fakioglu, H.; Totapally, B.R. Multiple-organ effect of normobaric hyperoxia in neonatal rats. J. Crit. Care 2006, 21, 85–93. [Google Scholar] [CrossRef] [PubMed]
- Popescu, C.R.; Sutherland, M.R.; Cloutier, A.; Benoît, G.; Bertagnolli, M.; Yzydorczyk, C.; Germain, N.; Phan, V.; Lelièvre-Pegorier, M.; Sartelet, H.; et al. Hyperoxia exposure impairs nephrogenesis in the neonatal rat: Role of HIF-1α. PLoS ONE 2013, 8. [Google Scholar] [CrossRef] [PubMed]
- Sutherland, M.R.; O´Reilly, M.; Kenna, K.; Ong, K.; Harding, R.; Sozo, F.; Black, M.J. Neonatal hyperoxia: Effects on nephrogenesis and long-term glomerular structure. Am. J. Physiol. Renal Physiol. 2013, 304, F1308–F1316. [Google Scholar] [CrossRef] [PubMed]
- Rostami, Z.; Einollahi, B.; Ghadiani, M.H. Does living donor hyperoxia have an impact on kidney graft function after transplantation? Nephrourol. Mon. 2013, 5, 835–839. [Google Scholar] [CrossRef] [PubMed]
- Hinkelbein, J.; Böhm, L.; Spelten, O.; Sander, D.; Soltész, S.; Braunecker, S. Hyperoxia-induced protein alterations in renal rat tissue: A quantitative proteomic approach to identify hyperoxia-induced effects in cellular signaling pathways. Dis. Mark. 2015, 2015. [Google Scholar] [CrossRef] [PubMed]
- Weisthal, S.; Keinan, N.; Ben-Hail, D.; Arif, T.; Shoshan-Barmatz, V. Ca(2+)-mediated regulation of VDAC1 expression levels is associated with cell death induction. Biochim. Biophys. Acta 2014, 1843, 2270–2281. [Google Scholar] [CrossRef] [PubMed]
- Key, M. A tutorial in displaying mass spectrometry-based proteomic data using heat maps. BMC Bioinform. 2012, 113. [Google Scholar] [CrossRef] [PubMed]
- Tyanova, S.; Temu, T.; Sinitcyn, P.; Carlson, A.; Hein, M.Y.; Geiger, T.; Mann, M.; Cox, J. The perseus computational platform for comprehensive analysis of (prote)omics data. Nat. Methods 2016, 13, 731–740. [Google Scholar] [CrossRef] [PubMed]
- Kaushal, G.P.; Haun, R.S.; Herzog, C.; Shah, S.V. Meprin a metalloproteinase and its role in acute kidney injury. Am. J. Physiol. Renal Physiol. 2013, 304, F1150–F1158. [Google Scholar] [CrossRef] [PubMed]
- Bylander, J.; Li, Q.; Ramesh, G.; Zhang, B.; Reeves, W.B.; Bond, J.S. Targeted disruption of the meprin metalloproteinase beta gene protects against renal ischemia-reperfusion injury in mice. Am. J. Physiol. Renal Physiol. 2008, 294, F480–F490. [Google Scholar] [CrossRef] [PubMed]
- Krapfenbauer, K.; Engidawork, E.; Cairns, N.; Shih, C.C.; Shi, L.; Ji, X.D.; Dong, L.; Shau, H. Aberrant expression of peroxiredoxin subtypes in neurodegenerative disorders. Brain Res. 2003, 967, 152–160. [Google Scholar] [CrossRef]
- Ejeskar, K.; Krona, C.; Caren, H.; Zaibak, F.; Li, L.; Martinsson, T.; Ioannou, P.A. Introduction of in vitro transcribed ENO1 mRNA into neuroblastoma cells induces cell death. BMC Cancer 2005, 5. [Google Scholar] [CrossRef] [PubMed]
- Patrakitkomjorn, S.; Kobayashi, D.; Morikawa, T.; Wilson, M.M.; Tsubota, N.; Irie, A.; Ozawa, T.; Aoki, M.; Arimura, N.; Kaibuchi, K.; et al. Neurofibromatosis type 1 (NF1) tumor suppressor, neurofibromin, regulates the neuronal differentiation of PC12 cells via its associating protein, CRMP-2. J. Biol. Chem. 2008, 283, 9399–9413. [Google Scholar] [CrossRef] [PubMed]
- Rogemond, V.; Auger, C.; Giraudon, P.; Becchi, M.; Auvergnon, N.; Belin, M.F.; Honnorat, J.; Moradi-Améli, M. Processing and nuclear localization of CRMP2 during brain development induce neurite outgrowth inhibition. J. Biol. Chem. 2008, 283, 14751–14761. [Google Scholar] [CrossRef] [PubMed]
- Samali, A.; Robertson, J.D.; Peterson, E.; Manero, F.; van Zeijl, L.; Paul, C.; Cotgreave, I.A.; Arrigo, A.P.; Orrenius, S. Hsp27 protects mitochondria of thermotolerant cells against apoptotic stimuli. Cell Stress Chaperones 2001, 6, 49–58. [Google Scholar] [CrossRef]
- Mehlen, P.; Preville, X.; Chareyron, P.; Briolay, J.; Klemenz, R.; Arrigo, A.P. Constitutive expression of human hsp27, Drosophila hsp27, or human alpha B-crystallin confers resistance to TNF- and oxidative stress-induced cytotoxicity in stably transfected murine L929 fibroblasts. J. Immunol. 1995, 154, 363–374. [Google Scholar] [PubMed]
- Ellgaard, L.; Frickel, E.M. Calnexin, calreticulin, and ERp57: Teammates in glycoprotein folding. Cell Biochem. Biophys. 2003, 39, 223–247. [Google Scholar] [CrossRef]
- Xu, D.; Perez, R.E.; Rezaiekhaligh, M.H.; Bourdi, M.; Truog, W.E. Knockdown of ERp57 increases BiP/GRP78 induction and protects against hyperoxia and tunicamycin-induced apoptosis. Am. J. Physiol. 2009, 297, L44–L51. [Google Scholar] [CrossRef] [PubMed] [Green Version]
- Gilligan, D.M.; Lozovatsky, L.; Gwynn, B.; Brugnara, C.; Mohandas, N.; Peters, L.L. Targeted disruption of the beta adducin gene (Add2) causes red blood cell spherocytosis in mice. Proc. Natl. Acad. Sci. USA 1999, 96, 10717–10722. [Google Scholar] [CrossRef] [PubMed] [Green Version]
- Slutsky, A.S. Lung injury caused by mechanical ventilation. Chest 1999, 116, 9S–15S. [Google Scholar] [CrossRef] [PubMed]
- Waxman, A.B.; Einarsson, O.; Seres, T.; Knickelbein, R.G.; Homer, R.; Warshaw, J.B.; Johnston, R.; Elias, J.A. Targeted lung expression of interleukin-11 enhances murine tolerance of 100% oxygen and diminishes hyperoxia-induced DNA fragmentation. Chest 1999, 116, 8S–9S. [Google Scholar] [CrossRef] [PubMed]
- Mantell, L.L.; Horowitz, S.; Davis, J.M.; Kazzaz, J.A. Hyperoxia-induced cell death in the lung—The correlation of apoptosis, necrosis, and inflammation. Ann. N. Y. Acad. Sci. 1999, 887, 171–180. [Google Scholar] [CrossRef] [PubMed]
- O’Reilly, M.A. DNA damage and cell cycle checkpoints in hyperoxic lung injury: Braking to facilitate repair. Am. J. Physiol. Lung Cell. Mol. Physiol. 2001, 281, L291–L305. [Google Scholar] [CrossRef] [PubMed]
- Halliwell, B. Reactive oxygen species and the central nervous system. J. Neurochem. 1992, 5, 1609–1623. [Google Scholar] [CrossRef]
- Schöler, M.; Lenz, C.; Kuschinsky, W.; Waschke, K.F.; Knels, R.; Frietsch, T. Increased arterial oxygen content by artificial haemoglobin induces a decrease in regional cerebral blood flow and decreased regional cerebral oxygen delivery. Eur. J. Anaesthesiol. 2009, 26, 245–252. [Google Scholar] [CrossRef] [PubMed] [Green Version]
- Atochin, D.N.; Demchenko, I.T.; Astern, J.; Boso, A.E.; Piantadosi, C.A.; Huang, P.L. Contributions of endothelial and neuronal nitric oxide synthases to cerebrovascular responses to hyperoxia. J. Cerebr. Blood Flow Metab. 2003, 23, 1219–1226. [Google Scholar] [CrossRef] [PubMed]
- Franckhauser, S.; Elias, I.; Sopasakis, V.R.; Ferré, T.; Nagaev, I.; Andersson, C.X.; Agudo, J.; Ruberte, J.; Bosch, F.; Smith, U. Overexpression of Il6 leads to hyperinsulinaemia, liver inflammation and reduced body weight in mice. Diabetologia 2008, 51, 1306–1316. [Google Scholar] [CrossRef] [PubMed] [Green Version]
- Yanbaeva, D.G.; Dentener, M.A.; Spruit, M.A.; Houwing-Duistermaat, J.J.; Kotz, D.; Passos, V.L.; Wouters, E.F. IL6 and CRP haplotypes are associated with COPD risk and systemic inflammation: A case-control study. BMC Med. Genet. 2009, 10. [Google Scholar] [CrossRef] [PubMed]
- Xia, X.; Lee, H.K.; Clark, S.C.; Choi, Y.S. Recombinant interleukin (IL) 2-induced human B cell differentiation is mediated by autocrine IL6. Eur. J. Immunol. 1989, 19, 2275–2281. [Google Scholar] [CrossRef] [PubMed]
- Mattoli, S.; Colotta, F.; Fincato, G.; Mezzetti, M.; Mantovani, A.; Patalano, F.; Fasoli, A. Time course of IL1 and IL6 synthesis and release in human bronchial epithelial cell cultures exposed to toluene diisocyanate. J. Cell. Physiol. 1991, 149, 260–268. [Google Scholar] [CrossRef] [PubMed]
- Irvin, B.J.; Hanson, C.L.; Smith, L.H.; Daniels, C.K. Cyclic AMP- and IL6-signaling cross talk: Comodulation of proliferation and apoptosis in the 7TD1 B cell hybridoma. Exp. Cell Res. 2001, 265, 73–79. [Google Scholar] [CrossRef] [PubMed]
- Lee, S.; Lee, H.S.; Baek, M.; Lee, D.Y.; Bang, Y.J.; Cho, H.N.; Lee, Y.S.; Ha, J.H.; Kim, H.Y.; Jeoung, D.I. MAPK signaling is involved in camptothecin-induced cell death. Mol. Cells 2002, 14, 348–354. [Google Scholar] [PubMed]
- Ren, D.; Yang, H.; Zhang, S. Cell death mediated by MAPK is associated with hydrogen peroxide production in Arabidopsis. J. Biol. Chem. 2002, 277, 559–565. [Google Scholar] [CrossRef] [PubMed]
- Petrache, I.; Choi, M.E.; Otterbein, L.E.; Chin, B.Y.; Mantell, L.L.; Horowitz, S.; Choi, A.M. Mitogen-activated protein kinase pathway mediates hyperoxia-induced apoptosis in cultured macrophage cells. Am. J. Physiol. 1999, 277, L589–L595. [Google Scholar] [CrossRef] [PubMed]
- Hori, O.; Brett, J.; Slattery, T.; Cao, R.; Zhang, J.; Chen, J.X.; Nagashima, M.; Lundh, E.R.; Vijay, S.; Nitecki, D. The receptor for advanced glycation end products (RAGE) is a cellular binding site for amphoterin. Mediation of neurite outgrowth and co-expression of rage and amphoterin in the developing nervous system. J. Biol. Chem. 1995, 270, 25752–25761. [Google Scholar] [CrossRef] [PubMed]
- Koo, H.C.; Davis, J.M.; Li, Y.; Hatzis, D.; Opsimos, H.; Pollack, S.; Strayer, M.S.; Ballard, P.L.; Kazzaz, J.A. Effects of transgene expression of superoxide dismutase and glutathione peroxidase on pulmonary epithelial cell growth in hyperoxia. Am. J. Physiol. Lung Cell Mol. Physiol. 2005, 288, L718–L726. [Google Scholar] [CrossRef] [PubMed]
- Li, Y.; Zhang, W.; Mantell, L.L.; Kazzaz, J.A.; Fein, A.M.; Horowitz, S. Nuclear factor-kappaB is activated by hyperoxia but does not protect from cell death. J. Biol. Chem. 1997, 272, 20646–20649. [Google Scholar] [CrossRef] [PubMed]


| Parameter | Hyperoxia-Group NH0 (n = 6) | Normoxia-Group NN0 (n = 6) | Significance Level |
|---|---|---|---|
| Blood Gases | |||
| Oxygen partial pressure (pO2, mmHg) | 580 ± 49 | 89 ± 9 | p < 0.05 |
| Carbon dioxide partial pressure (pCO2, mmHg) | 38.1 ± 5.2 | 36.4 ± 3.9 | n.s. |
| HCO3- actual (HCO3−-act, mmol/L) | 24.5 ± 5.0 | 26.0 ± 3.3 | n.s. |
| Plasma albumin (g/L) | 36.0 ± 1.3 | 36.3 ± 1.0 | n.s. |
| Electrolytes | |||
| Glucose (mg/dL) | 191 ± 28 | 188 ± 30 | n.s. |
| Lactate (mmol/L) | 2.0 ± 1.7 | 2.2 ± 2.0 | n.s. |
| Blood Cells | |||
| Leukocytes (109/L) | 8.45 ± 2.78 | 8.83 ± 2.97 | n.s. |
| Thrombocytes (109/L) | 709 ± 99 | 792 ± 111 | n.s. |
| Circulation | |||
| Heart rate (1/min) | 402 ± 78 | 452 ± 44 | n.s. |
| Body temperature (°C) | 37.6 ± 0.5 | 37.9 ± 0.4 | n.s. |
| Other | |||
| Weight (g) | 286 ± 23 | 274 ± 16 | n.s. |
| Organ | Molecular Weight (kDa) | Significance, t-Test | Protein Mascot Score | Protein Name | Accession Number | IF Day 0 | IF Day 3 | IF Day 7 |
|---|---|---|---|---|---|---|---|---|
| Kidney | 72 | p = 0.012 | 71 | Meprin A subunit alpha | MEP1A_RAT | −4.17 | ||
| Kidney | 70 | p = 0.022 | 23 | Microtubule-associated tumor suppressor 1 homolog | MTUS1_RAT | 8.12 | 8.12 | |
| Kidney | 33 | p = 0.035 | 90 | 40S ribosomal protein SA | RSSA_RAT | −1.77 | −1.77 | −1.77 |
| Kidney | 29 | p = 0.011 | 202 | Fructose-1,6-bisphosphatase 1 | F16P1_RAT | −1.87 | ||
| Stomatin-like protein 2, mitochondrial | STML2_RAT | |||||||
| 3′(2′),5′-bisphosphate nucleotidase 1 | BPNT1_RAT | |||||||
| Legumain | LGMN_RAT | |||||||
| Kidney | 28 | p = 0.03 | 64 | ATP synthase subunit alpha mitochondrial | ATPA_RAT | −1.81 | −1.81 | |
| Voltage-dependent anionselective channel protein 1 | VDAC1_RAT | |||||||
| Kidney | 28 | p = 0.042 | 256 | Fructose-1,6-bisphosphatase 1 | F16P1_RAT | 1.74 | ||
| Actin, cytoplasmic 2 | ACTG_RAT | |||||||
| Actin, cytoplasmic 1 | ACTB_RAT | |||||||
| Kidney | 23 | p = 0.018 | 60 | Serine/threonine-protein phosphatase 2A 55 kDa regulatory subunit B alpha isoform | 2ABA_RAT | 1.74 | 1.74 | 1.74 |
| Kidney | 23 | p = 0.012 | 60 | Serine/threonine-protein phosphatase 2A 55 kDa regulatory subunit B alpha isoform | 2ABA_RAT | 1.74 | 1.74 | 1.74 |
| Kidney | 14 | p = 0.033 | 59 | Ras-related protein Rab-1A | RAB1A_RAT | 1.81 | ||
| Brain | p < 0.001 | 310 | Cytosolic aspartate aminotransferase | GOT1 | 8.95 | 1.15 | 2.13 | |
| Brain | p < 0.01 | 116 | Peroxiredoxin 2 | PRDX2 | −1.35 | −4.00 | −1.35 | |
| Brain | p < 0.001 | 256 | Glucose-6-phosphate dehydrogenase | G6PD | 2.42 | 9.46 | 23.91 | |
| Brain | p < 0.01 | 115 | Phosphatidylethanolamine- Binding protein 1 | PEBP1 | −2.78 | −1.07 | −4.54 | |
| Brain | p < 0.01 | 318 | Enolase 1 | ENO1 | −1.54 | 1.54 | 1.17 | |
| Brain | p < 0.001 | 342 | Albumin | ALB | 13.25 | 1.59 | 1.53 | |
| Brain | p < 0.001 | 205 | Dihydropyrimi-dinaselike 2 | DPYSL2 | 4.09 | 1.32 | 1.59 | |
| Brain | p < 0.001 | 135 | Chaperonin containing TCP1, subunit 2 (β) | CCT2 | 1.73 | 2.04 | 1.13 | |
| Brain | p < 0.01 | 131 | Malate dehydrogenase 1 | MDH1 | −1.23 | 1.43 | 1.18 | |
| Lung | p < 0.001 | Interferon-induced protein with tetratricopeptide repeats 3 | IFIT3 | 1.37 | −1.62 | 2.72 | ||
| Lung | p < 0.001 | Heat shock protein beta-1 | HSPB1 | 3.87 | 5.77 | 6.79 | ||
| Lung | p < 0.01 | Actin-related protein 3 | ACTR3 | −4.93 | −1.73 | −3.92 | ||
| Lung | p = 0.148 | Guanine deaminase | GDA | −1.52 | −2.40 | −1.36 | ||
| Lung | p < 0.01 | Protein disulfide-isomerase A3 | PDIA3 | −3.06 | −1.05 | −1.84 | ||
| Lung | p < 0.01 | Dihydropyrimidinaserelated protein 2 | DPYSL2 | −2.27 | −1.21 | −2.13 | ||
| Lung | p < 0.01 | Zinc finger protein 667 | ZNF667 | −3.96 | −1.51 | −2.85 | ||
| Lung | p < 0.01 | Isoform 2 of Beta-adducin | ADD2 | −92.94 | −1.51 | −3.10 | ||
| Lung | p < 0.01 | Small ubiquitin-related modifier 3 | SUMO3 | −8.53 | −1.05 | −3.66 | ||
| Lung | p < 0.01 | Pleckstrin homology domain containing, family A member 7 | PLEKHA7 | −8.29 | −3.13 | −1.77 |
| Organ | Protein Name | Accession Number | IF at T0 |
|---|---|---|---|
| Kidney | 40S ribosomal protein SA | RSSA_RAT | −1.77 |
| Kidney | Serine/threonine-protein phosphatase 2A 55 kDa regulatory subunit B alpha isoform | 2ABA_RAT | 1.74 |
| Kidney | Serine/threonine-protein phosphatase 2A 55 kDa regulatory subunit B alpha isoform | 2ABA_RAT | 1.74 |
| Kidney | Ras-related protein Rab-1A | RAB1A_RAT | 1.81 |
| Brain | Cytosolic aspartate aminotransferase | GOT1 | 8.95 |
| Brain | Albumin | ALB | 13.25 |
| Brain | Dihydropyrimi-dinaselike 2 | DPYSL2 | 4.09 |
| Lung | Heat shock protein beta-1 | HSPB1 | 3.87 |
| Lung | Actin-related protein 3 | ACTR3 | −4.93 |
| Lung | Protein disulfide-isomerase A3 | PDIA3 | −3.06 |
| Lung | Dihydropyrimidinaserelated protein 2 | DPYSL2 | −2.27 |
| Lung | Zinc finger protein 667 | ZNF667 | −3.96 |
| Lung | Isoform 2 of Beta-adducin | ADD2 | −92.94 |
| Lung | Small ubiquitin-related modifier 3 | SUMO3 | −8.53 |
| Lung | Pleckstrin homology domain containing, family A member 7 | PLEKHA7 | −8.29 |
| Organ | Protein Name | Accession Number | IF at T3 |
|---|---|---|---|
| Kidney | Meprin A subunit alpha | MEP1A_RAT | −4.17 |
| Kidney | Microtubule-associated tumor suppressor 1 homolog | MTUS1_RAT | 8.12 |
| Kidney | 40S ribosomal protein SA | RSSA_RAT | −1.77 |
| Kidney | Fructose-1,6-bisphosphatase 1 | F16P1_RAT | −1.87 |
| Stomatin-like protein 2, mitochondrial | STML2_RAT | ||
| 3′(2′),5′-bisphosphate nucleotidase 1 | BPNT1_RAT | ||
| Legumain | LGMN_RAT | ||
| Kidney | ATP synthase subunit alpha mitochondrial | ATPA_RAT | −1.81 |
| Voltage-dependent anionselective channel protein 1 | VDAC1_RAT | ||
| Kidney | Serine/threonine-protein phosphatase 2A 55 kDa regulatory subunit B alpha isoform | 2ABA_RAT | 1.74 |
| Kidney | Serine/threonine-protein phosphatase 2A 55 kDa regulatory subunit B alpha isoform | 2ABA_RAT | 1.74 |
| Brain | Peroxiredoxin 2 | PRDX2 | −4.00 |
| Brain | Enolase 1 | ENO1 | 1.54 |
| Brain | Chaperonin containing TCP1, subunit 2 (beta) | CCT2 | 2.04 |
| Brain | Malate dehydrogenase 1 | MDH1 | 1.43 |
| Lung | Heat shock protein beta-1 | HSPB1 | 5.77 |
| Lung | Guanine deaminase | GDA | −2.40 |
| Organ | Protein Name | Accession Number | IF at T7 |
|---|---|---|---|
| Kidney | Microtubule-associated tumor suppressor 1 homolog | MTUS1_RAT | 8.12 |
| Kidney | 40S ribosomal protein SA | RSSA_RAT | −1.77 |
| Kidney | ATP synthase subunit alpha mitochondrial | ATPA_RAT | −1.81 |
| Voltage-dependent anionselective channel protein 1 | VDAC1_RAT | ||
| Kidney | Fructose-1,6-bisphosphatase 1 | F16P1_RAT | 1.74 |
| Actin, cytoplasmic 2 | ACTG_RAT | ||
| Actin, cytoplasmic 1 | ACTB_RAT | ||
| Kidney | Serine/threonine-protein phosphatase 2A 55 kDa regulatory subunit B alpha isoform | 2ABA_RAT | 1.74 |
| Kidney | Serine/threonine-protein phosphatase 2A 55 kDa regulatory subunit B alpha isoform | 2ABA_RAT | 1.74 |
| Brain | Glucose-6-phosphate dehydrogenase | G6PD | 23.91 |
| Brain | Phosphatidylethanolamine- Binding protein 1 | PEBP1 | −4.54 |
| Lung | Interferon-induced protein with tetratricopeptide repeats 3 | IFIT3 | 2.72 |
| Lung | Heat shock protein beta-1 | HSPB1 | 6.79 |
© 2018 by the authors. Licensee MDPI, Basel, Switzerland. This article is an open access article distributed under the terms and conditions of the Creative Commons Attribution (CC BY) license (http://creativecommons.org/licenses/by/4.0/).
Share and Cite
Hinkelbein, J.; Braunecker, S.; Danz, M.; Böhm, L.; Hohn, A. Time Dependent Pathway Activation of Signalling Cascades in Rat Organs after Short-Term Hyperoxia. Int. J. Mol. Sci. 2018, 19, 1960. https://doi.org/10.3390/ijms19071960
Hinkelbein J, Braunecker S, Danz M, Böhm L, Hohn A. Time Dependent Pathway Activation of Signalling Cascades in Rat Organs after Short-Term Hyperoxia. International Journal of Molecular Sciences. 2018; 19(7):1960. https://doi.org/10.3390/ijms19071960
Chicago/Turabian StyleHinkelbein, Jochen, Stefan Braunecker, Matthias Danz, Lennert Böhm, and Andreas Hohn. 2018. "Time Dependent Pathway Activation of Signalling Cascades in Rat Organs after Short-Term Hyperoxia" International Journal of Molecular Sciences 19, no. 7: 1960. https://doi.org/10.3390/ijms19071960