Article

Genome-Wide Characterization and Analysis of Metallothionein Family Genes That Function in Metal Stress Tolerance in Brassica napus L.

1
Key Laboratory of Horticulture Science for Southern Mountainous Regions, Ministry of Education, Southwest University, No. 2 Tiansheng Road, Beibei, Chongqing 400715, China
2
Academy of Agricultural Sciences, Southwest University, Chongqing 400715, China
3
Chongqing Rapeseed Engineering Research Center, College of Agronomy and Biotechnology, Southwest University, No. 2 Tiansheng Road, Beibei, Chongqing 400715, China
*
Authors to whom correspondence should be addressed.
These authors contributed equally to this paper.
Int. J. Mol. Sci. 2018, 19(8), 2181; https://doi.org/10.3390/ijms19082181
Submission received: 25 June 2018 / Revised: 21 July 2018 / Accepted: 24 July 2018 / Published: 26 July 2018
(This article belongs to the Special Issue Plant Genetics and Molecular Breeding)

Abstract

:
Brassica plants exhibit both high biomass productivity and high rates of heavy metal absorption. Metallothionein (MT) proteins are low molecular weight, cysteine-rich, metal-binding proteins that play crucial roles in protecting plants from heavy metal toxicity. However, to date, MT proteins have not been systematically characterized in Brassica. In this study, we identified 60 MTs from Arabidopsis thaliana and five Brassica species. All the MT family genes from Brassica are closely related to Arabidopsis MTs, encoding putative proteins that share similar functions within the same clades. Genome mapping analysis revealed high levels of synteny throughout the genome due to whole genome duplication and segmental duplication events. We analyzed the expression levels of 16 Brassica napus MTs (BnaMTs) by RNA-sequencing and real-time RT-PCR (RT-qPCR) analysis in plants under As3+ stress. These genes exhibited different expression patterns in various tissues. Our results suggest that BnaMT3C plays a key role in the response to As3+ stress in B. napus. This study provides insight into the phylogeny, origin, and evolution of MT family members in Brassica, laying the foundation for further studies of the roles of MT proteins in these important crops.

1. Introduction

Heavy metals are essential micronutrients for various physiological processes in plants. However, excess amounts of essential (copper, zinc) and non-essential metals (cadmium) are toxic to plants, as they inhibit plant growth, impair root development, and decrease chlorophyll contents, resulting in chlorosis [1,2]. Therefore, plants have evolved a suite of mechanisms involving the chelation and sequestration of heavy metals by various amino acids, organic acids, phytochelatins (PCs) and metallothioneins (MTs) [3,4]. These compounds play crucial roles in protecting plants from heavy metal toxicity [5,6,7,8,9].
MTs, low-molecular-weight proteins (7–10 kDa) with a high percentage of cysteine (Cys) residues [10,11], have been widely characterized in various prokaryotic and eukaryotic organisms. Plant MTs are classified into four types according to the arrangement of their Cys residues [12], including the MT1, MT2, MT3, and MT4 subfamilies [10,13]. MTs play crucial roles in ion homeostasis and tolerance in plants. Seven functional MT genes have been isolated from the model plant Arabidopsis thaliana. Of these, AtMT1a, AtMT2a, AtMT2b, and AtMT3 enhance plant tolerance of Cu ions, especially in leaves [14,15], as well as Cd tolerance in transformed yeast and fava bean (Vicia faba) guard cells [16,17]. AtMT4 modulates Zn homeostasis in seeds and is highly expressed during the late stages of development [18]. Additionally, various MT genes show significantly different expression patterns in plants under heavy metal stress. For example, MT2a and MT2b genes are more highly expressed in the roots of the heavy metal hyperaccumulator Noccaea caerulescens than in those of A. thaliana, while MT3 is more highly expressed in shoots of N. caerulescens than in the non-hyperaccumulator Thlaspi arvense [19,20]. MT4 mRNAs are primarily expressed in ripening fruits and developing seeds [14]. Therefore, plant MTs are likely involved in many physiological processes, such as seed development and germination [18,21,22], fruit ripening [14], and root development [21,23].
Brassica plants are considered to be highly tolerant to heavy metals (e.g., Cd, Cu, Ni, Zn, Pb, and Se), making them ideal plants for studying metal accumulation in phytoremediation studies [24,25,26,27]. Indian mustard (Brassica juncea) is a high-biomass-producing crop with the potential to take up and accumulate heavy metals [1,23,27,28]. However, this plant accumulates Cd less effectively than other crops such as maize (Zea mays), rice (Oryza sativa), and sugar beet (B. vulgaris) when it is present at low concentrations in the soil [29]. Rapeseed (B. napus) has many advantages for this type of analysis due to its rapid growth, high biomass productivity and efficient heavy metal absorption, and it is therefore also widely used to investigate heavy metal tolerance [26,30,31,32]. Indeed, while heavy metal tolerance has been well studied in various Brassica species, the mechanisms that contribute to the tolerance of these plants to heavy metals remain unclear.
In the present study, we screened the draft genome sequences of A. thaliana and various Brassica species (Brassica rapa, Brassica oleracea, B. napus, Brassica juncea and Brassica nigra) for MT genes that participate in heavy metal detoxification. We identified 60 MT genes and performed a detailed analysis of their duplication patterns, classifications, and chromosomal distribution and motifs, as well as a phylogenetic analysis. Finally, we verified the differential expression profiles of selected rapeseed MT genes in different B. napus tissues at various developmental stages. We also investigated the expression patterns of MT genes in B. napus seedlings exposed to heavy metals. Our results provide important information about the origin and evolution of the MT gene family in Brassica and provide a basis for further studies of the functions of MT family proteins in rapeseed.

2. Results

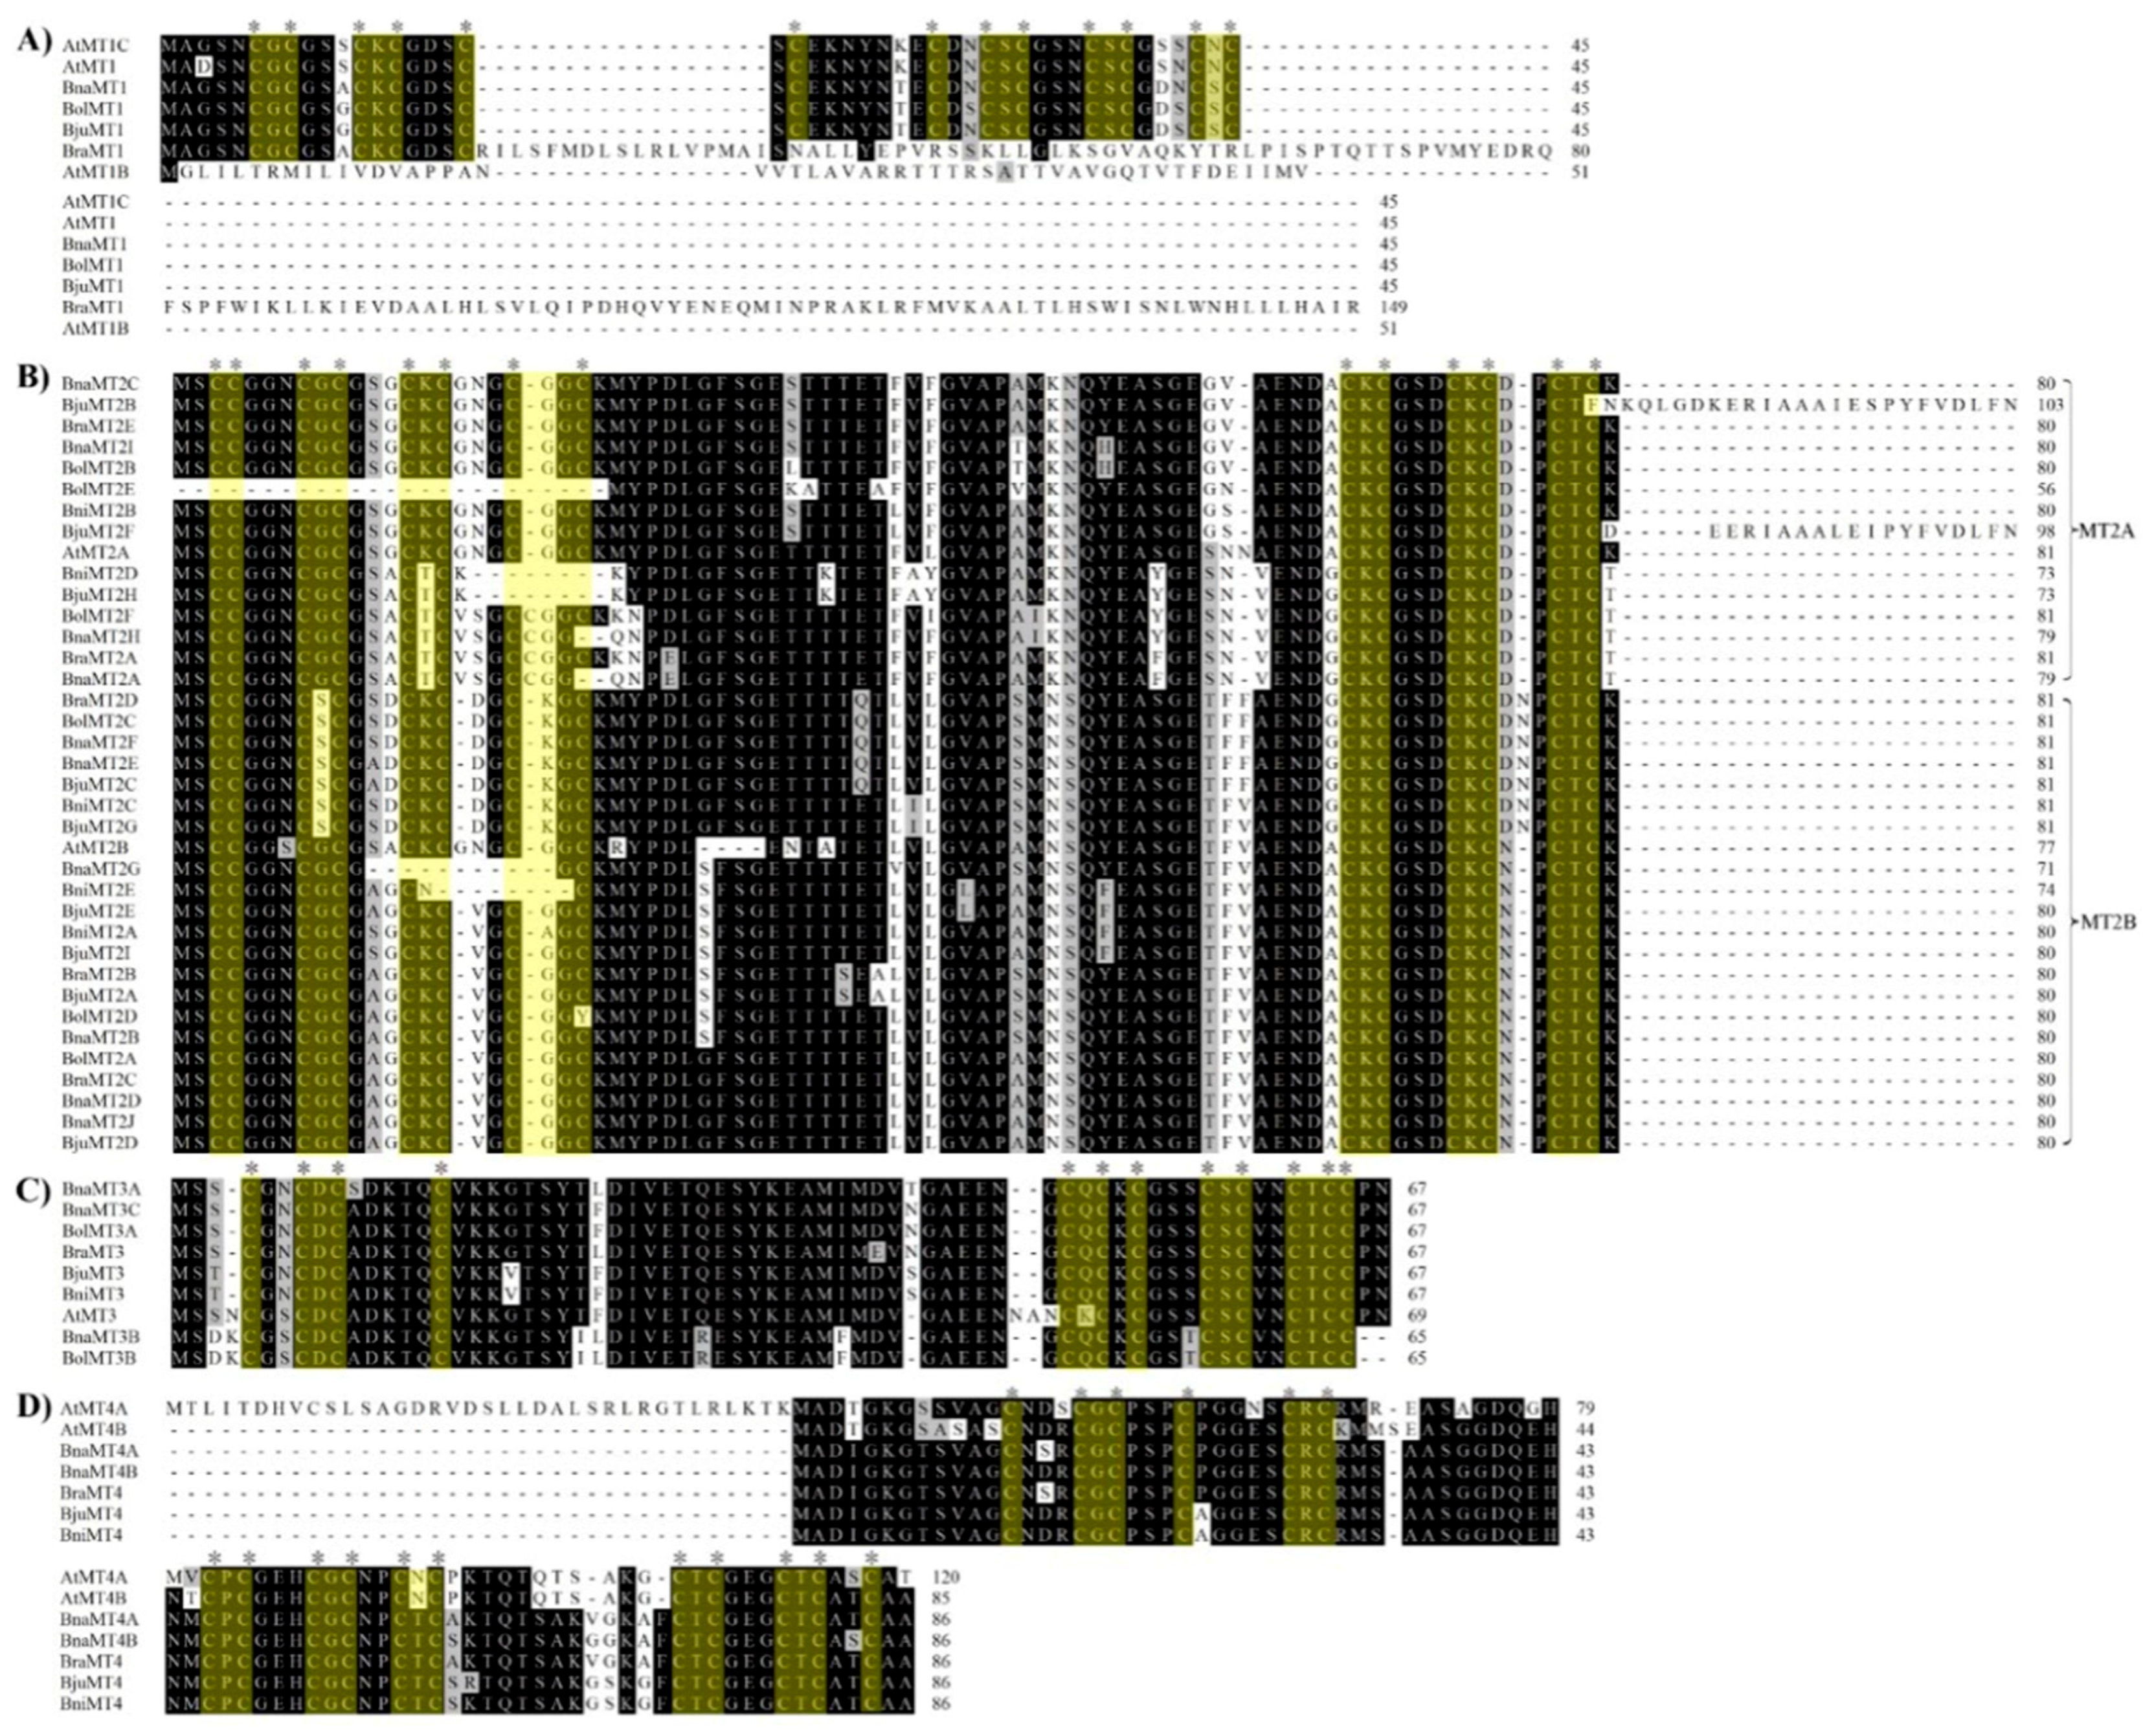
2.1. Identification and Multiple Sequence Alignment of MT Family Genes

Using the protein sequences of the MT family genes from the TAIR10 database (Table 1) as queries, we identified 60 MT genes in A. thaliana and various Brassica plants (B. rapa, B. oleracea, B. napus, B. juncea and B. nigra). These genes were classified into four subgroups (Figure 1, Table 1). Of these, seven were MT1 subfamily members, five of which were identified from the corresponding genome databases, except BolMT1 and BjuMT1. BraMT1 has been reported in B. rapa with 45 amino-acid proteins [33]; the difference between these sequences requires further study. In addition, 37 were MT2 subfamily members, encoding deduced proteins ranging from 56 to 103 amino acids in length; nine were MT3 subfamily members, encoding proteins from 65 to 69 amino acids in length; and seven were MT4 subfamily members, encoding proteins from 85 to 120 amino acids in length (Table 1). Of the MT1 subfamily members, three homologs were identified in A. thaliana, while BnaMT1 and BraMT1 were identified in B. napus and B. rapa, respectively. No MT1 subfamily members were found in B. oleracea, B. juncea, or B. nigra, whereas BolMT1 and BjuMT1 have been reported previously [13], indicating that genome gaps may still emerge in B. oleracea, and B. juncea. Six Cys-X-Cys motifs were equally distributed on the N- and C-termini of MT1 family proteins, except in the case of BraMT1 and AtMT1B (Figure 2A).
We identified 37 MT2 subfamily genes in A. thaliana (AtMT2A and AtMT2B) and Brassica (five in B. rapa, six in B. oleracea, ten in B. napus, nine in B. juncea, and five in B. nigra), which were divided into the MT2A and MT2B subgroups (Figure 2B, Table 1), pointing to the extensive triplication and expansion of these genomes during their evolution in Brassica plants. Furthermore, one Cys–Cys and two Cys–X–Cys motifs were almost always present in the N-terminal regions of these proteins, and three Cys–X–Cys were almost always present in their C-terminal regions (Figure 2B). In addition, MT2 subfamily genes encode a deduced protein with the MSCCGGN/S sequence in their N-termini, which is consistent with previous findings [13,34]. Three variant regions were found in the MT2A subgroup and three in the MT2B subgroup (Figure 2B), which might be associated with their roles in metal tolerance.
We identified MT3 subfamily genes, including one each in A. thaliana, B. rapa, B. juncea, and B. nigra, two in B. oleracea and three in B. napus (Figure 1, Table 1). The alignment of the MT3 amino acid sequences showed a completely conserved sequence, CXXCDCX5C, located in the N-terminus of each protein, and a highly conserved consensus sequence with eight Cys residues at the C-terminus (Figure 2C). In addition, 30–40 amino acids were detected in the Cys-poor linker region between the N- and C-terminal regions, in accordance with the MT2 subfamily (Figure 2B,C), pointing to a possible evolutionary relationship between the MT2 and MT3 family genes.
MT4 subfamily genes, which are homologous to plant EC metallothionein-like genes, are different from MT1–MT3 subfamily members. Two MT4 subfamily members were found in A. thaliana and B. napus, one each in B. rapa, B. juncea, and B. nigra, and none in B. oleracea (Figure 1, Table 1). These proteins contain three Cys-poor linkers comprising 12–15 amino acids, as well as two Cys-rich regions with a highly conserved consensus sequence among them (Figure 2D).

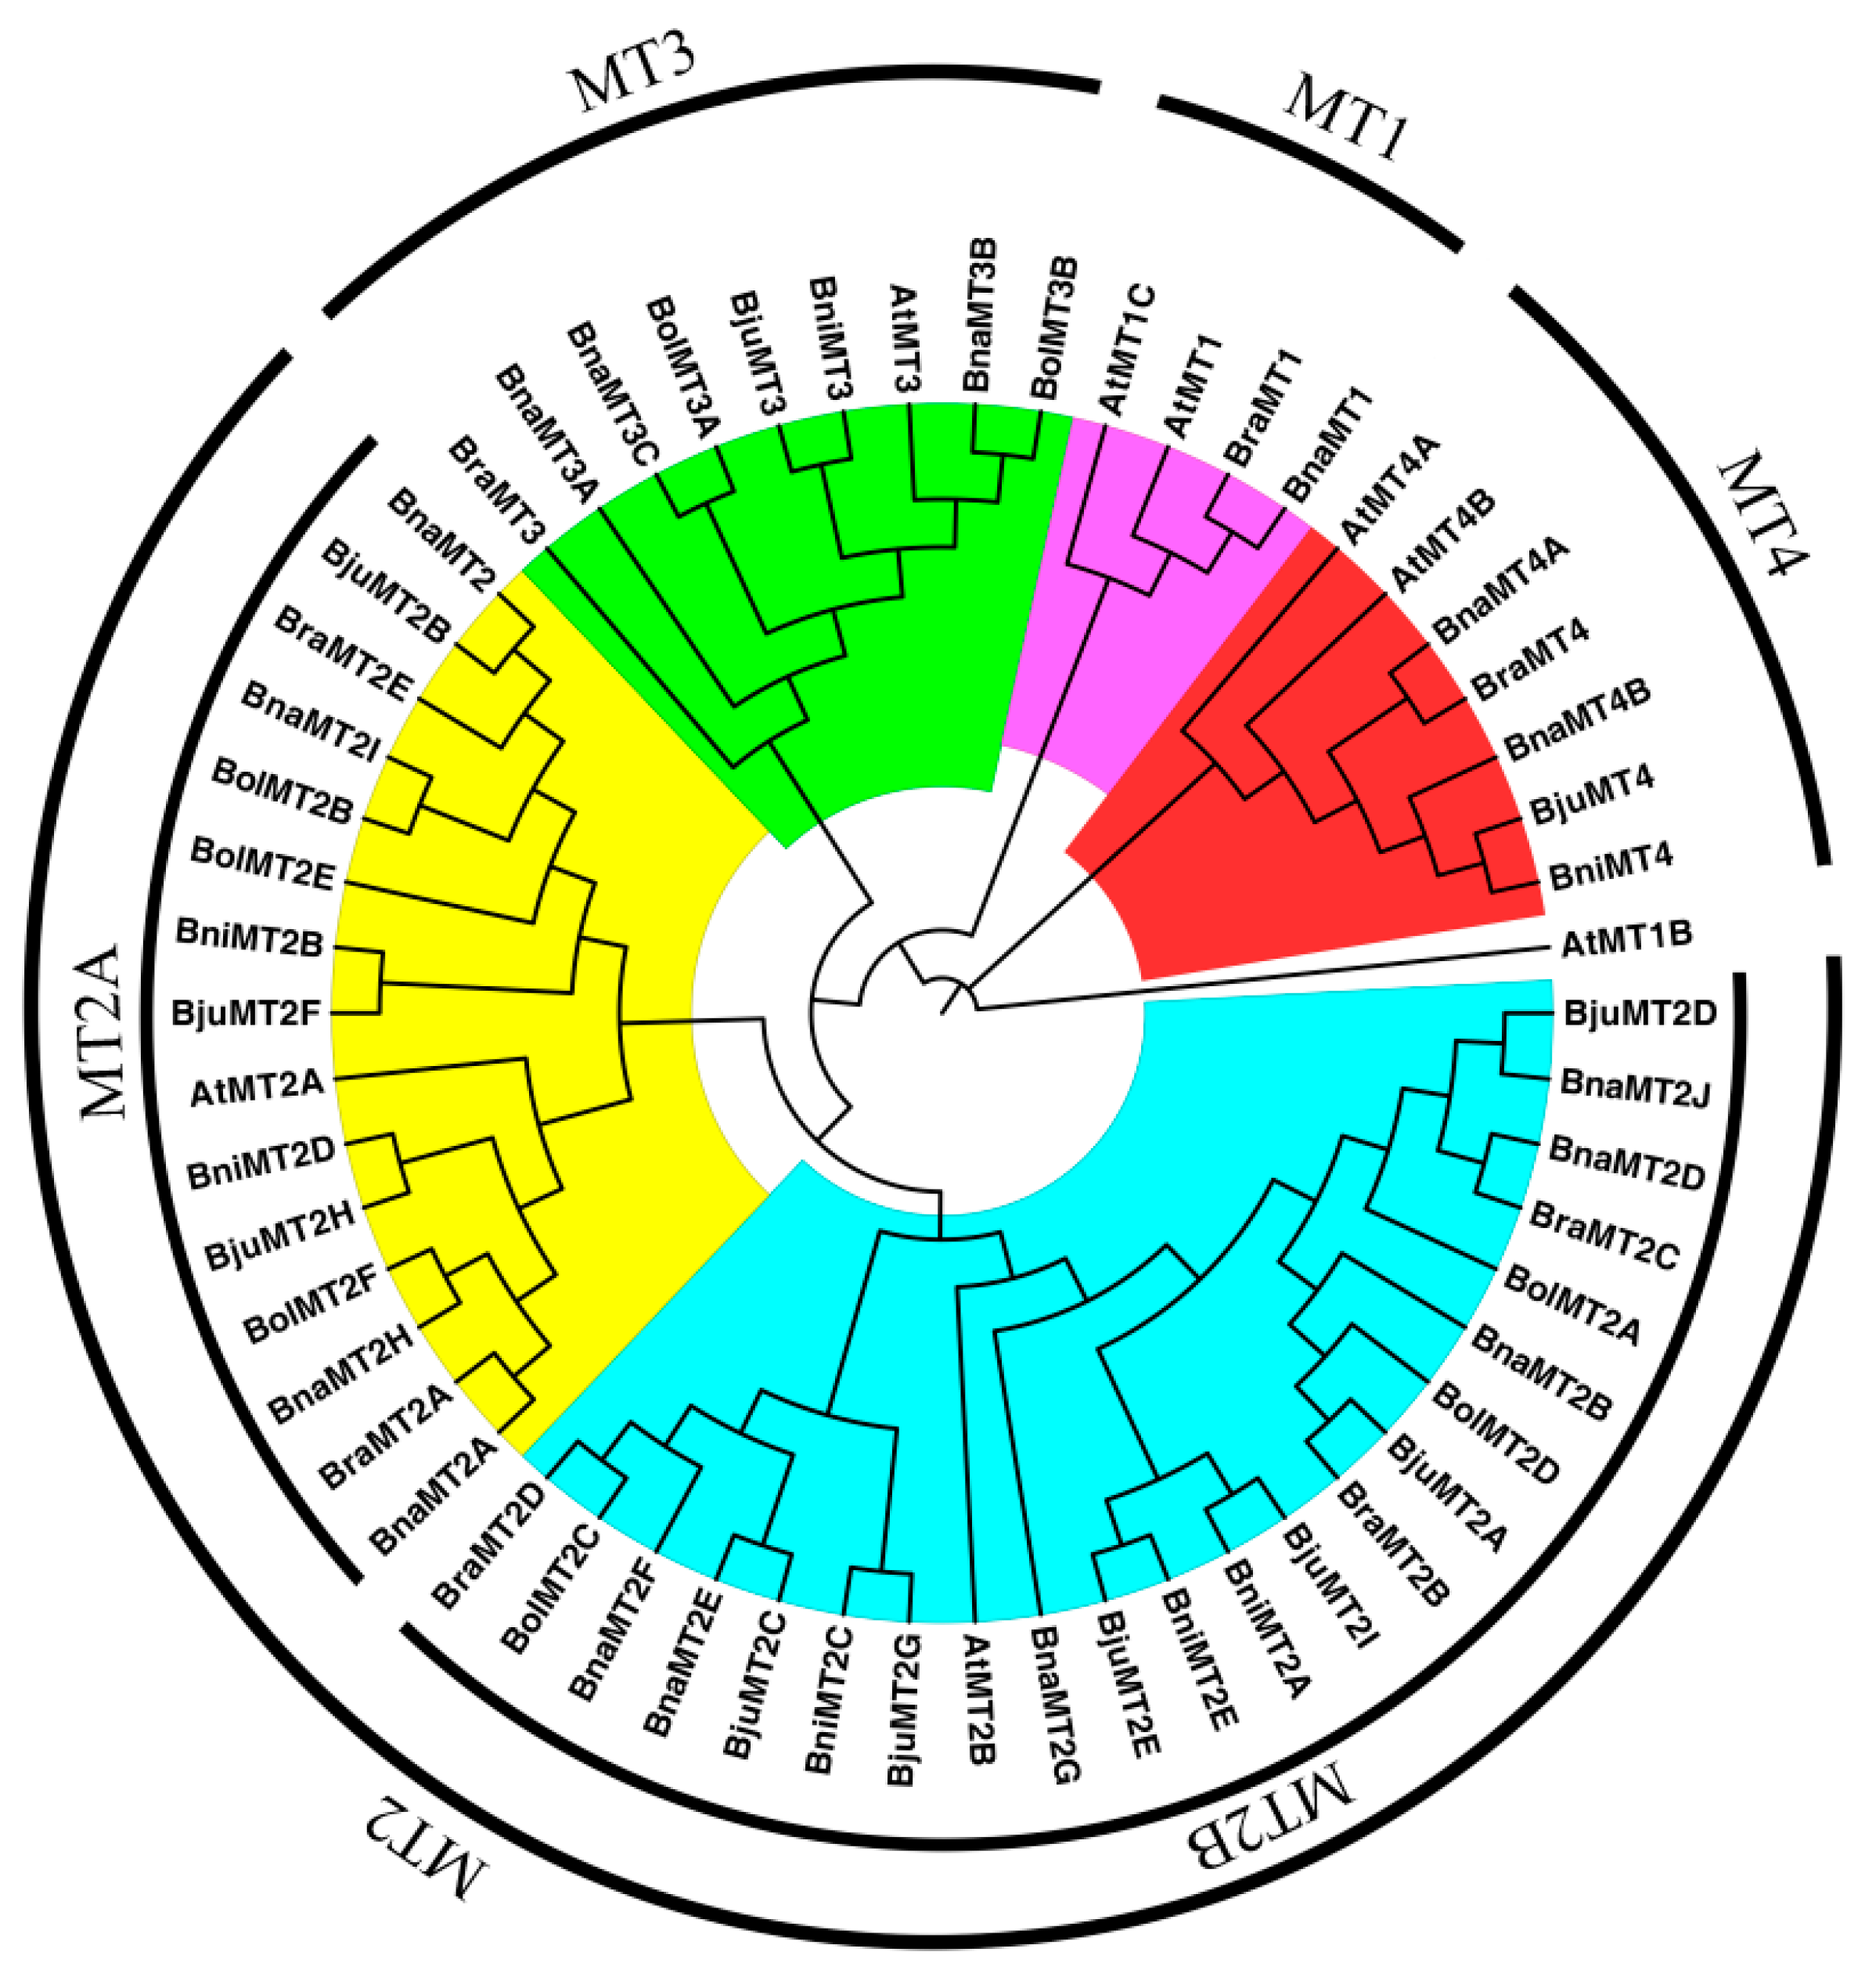
2.2. Phylogenetic Analysis of MT Family Genes

Based on the multiple sequence alignment of the deduced MT1–MT4 proteins, it was found that Cys-rich regions are widely distributed among MT family proteins. These regions are characterized by conserved consensus sequences, with motifs such as Cys–G–Cys, Cys–K–Cys, and Cys–S–Cys (Figure 2). To investigate the evolutionary relationships among MT family genes from A. thaliana and various Brassica species, we constructed a NJ phylogenetic tree based on the alignment of MT domains. Based on the phylogenetic tree, the 58 MT domains were classified into four subfamilies (MT1, MT2, MT3, and MT4), except for BolMT1 and BjuMT1, which were not annotated in the genome databases, and most genes were grouped with the AtMTs (Figure 2). AtMT1B represents the outgroup in the phylogenetic tree. In addition, the MT2 subfamily was classified into two sister groups (Figure 1), MT2A and MT2B, which is highly consistent with the results of multiple sequence alignments of whole proteins (Figure 2). For example, two sister groups were also identified and found to contain eight and six MT family genes, respectively (Figure 2), which also contain highly conserved consensus sequences (Figure 1). These results will be helpful in identifying the functions of MT family genes via orthology analysis.

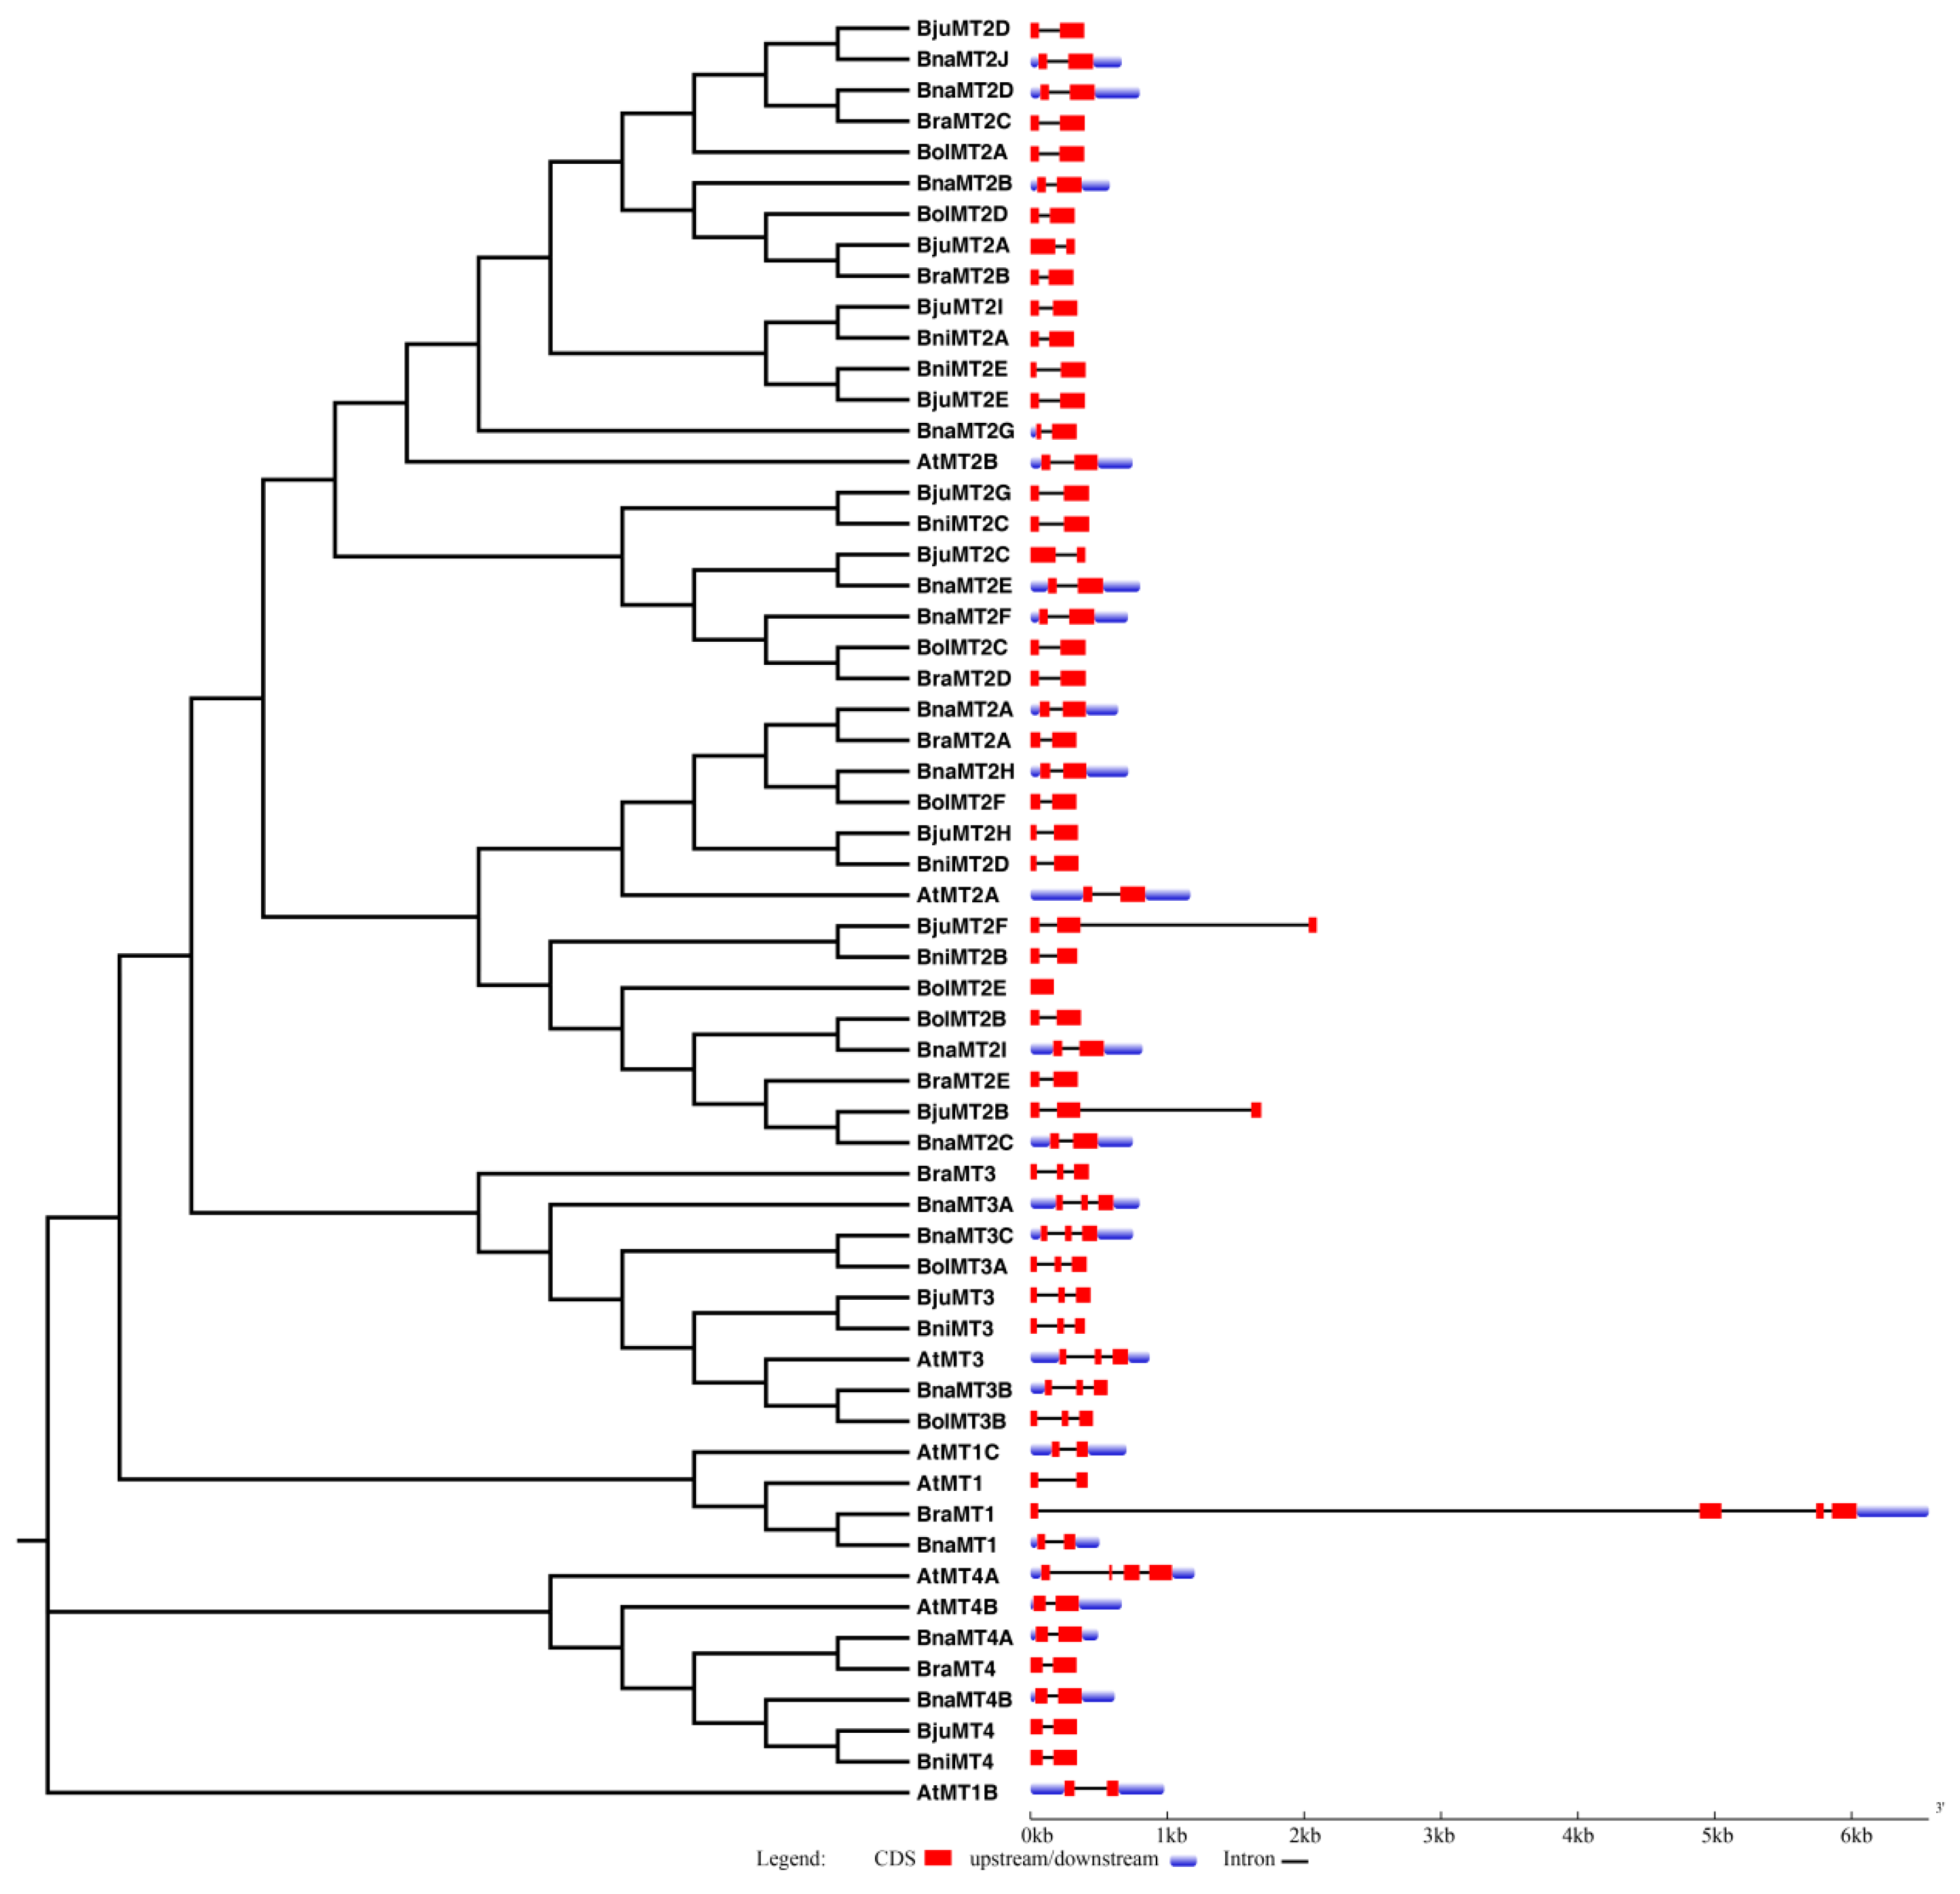
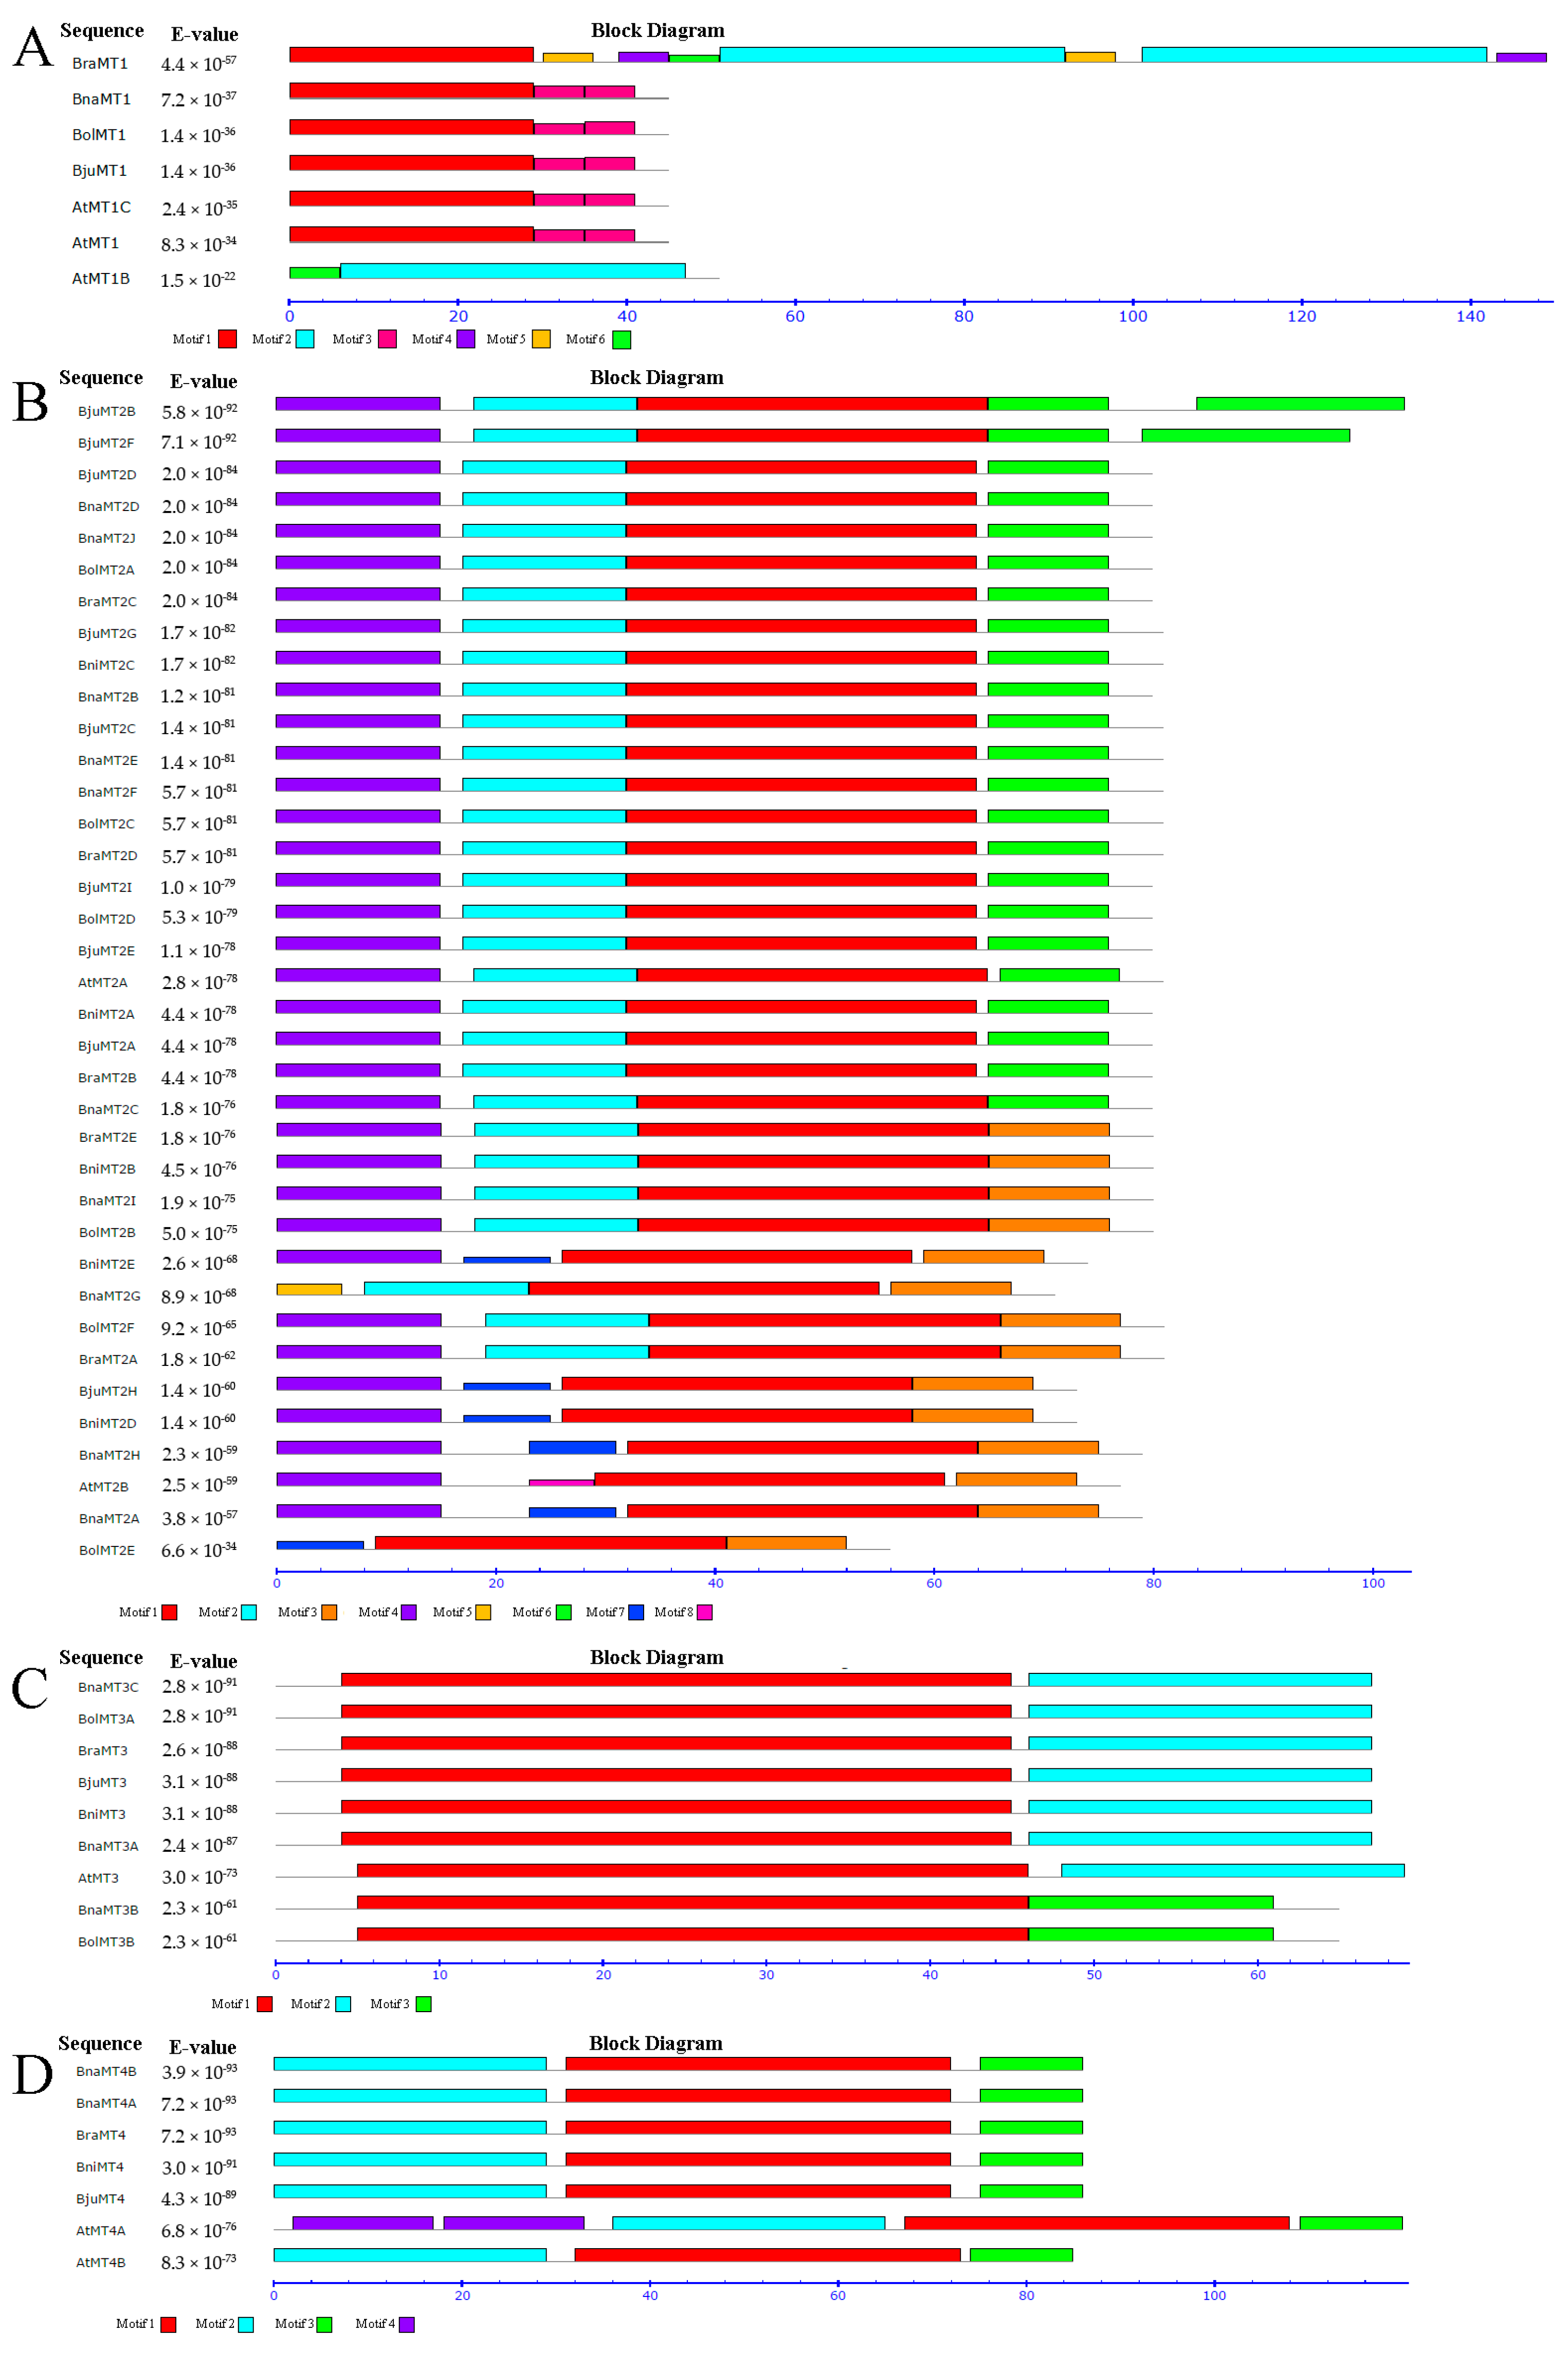
2.3. Genomic Structure and Conserved Motif Analysis of the MT Gene Family

We characterized the gene structures of the MT family genes by comparing the full-length CDS and the corresponding genomic DNA sequences using GSDS 2.0 (http://gsds.cbi.pku.edu.cn/index.php). Of the 58 MT genes, 44 contain a single intron with a highly conserved structure in each group, i.e., the MT1, MT2 and MT4 subfamilies. Additionally, MT3 subfamily members contain two introns, which were also found in BjuMT2B and BjuMT2F (Figure 3). BolMT2E lacks an intron and belongs to the MT2A gene family, while AtMT4A and BraMT1 contain three introns with distinct sizes (Figure 3). Most genes in the same subfamily exhibit similar exon–intron structures, but the genomic structures of BjuMT2B and BjuMT2F are similar to those of the MT3 subfamily, providing further support for the evolutionary relationship and classification of the MT gene family members identified in this study.
Using MEME v4.12.0 (http://meme-suite.org/tools/meme), six, eight, three, and four conserved motifs were detected in the MT1, MT2, MT3, and MT4 subfamilies, respectively, in B. rapa, B. oleracea, B. napus, B. juncea, and B. nigra (Figure 4A–D); the detailed structures of the motifs are shown in Figure S1A–D. All members of the MT1 subfamily except for AtMT1B contain motif 1 (Figure 4A and Figure S1A). All members of the MT2 subfamily contain motif 1, whereas all members of the MT2A subfamily contain motifs 2, 4, and 6, but motif 3 is found only in the MT2B subfamily members. The motifs in the MT2B subfamily members are more variable than those of the other MTs (Figure 4B and Figure S1B), pointing to the triplication and expansion of Brassica genomes. All nine genes in the MT3 subfamily contain motif 1, while the MT3A subfamily genes contain motif 2 and the MT3B subfamily genes contain motif 3 (Figure 4C and Figure S1C). The MT4 subfamily genes contain motifs 1, 2, and 3, indicating that these motifs are conserved among these genes (Figure 4D and Figure S1D). In summary, the same conserved motifs are widely found in paralogous/orthologous genes, suggesting that they might have similar functions at the protein level.

2.4. Chromosome Locations and Duplication of MT Genes in Brassica

Brassica includes three diploid species, B. rapa (AA, 2n = 20), B. oleracea (CC, 2n = 18), and B. nigra (BB, 2n = 20) and three allotetraploid species, B. napus (AACC, 2n = 38), B. juncea (AABB, 2n = 36), and B. carinata (BBCC, 2n = 34), and the evolution and relationships between the members of Brassica can be well understood according to the U-triangle theory [35]. Five of these species have been completely sequenced, and their sequences are available in the Brassica database (BRAD) database. To identify the physical positions of the MT genes, we mapped them to the chromosomes in the corresponding Brassica species. The 43 MT genes are located on 27 chromosomes in the five Brassica species with available whole-genome sequences, including four chromosomes (BraA02, BraA03, BraA05, and BraA10) in B. rapa, four chromosomes (BolC01, BolC02, BolC03 and BolC05) in B. oleracea and five chromosomes in B. nigra (BniB02, BniB03, BniB05, BniB07 and BniB08) (Figure 5). Further, we detected high levels of synteny among MT family genes in these species. For example BraMT2D on chromosome BraA02, BjuMT2C on chromosome BjuA02, BnaMT2F on chromosome BnaC02, and BolMT2C on chromosome BolC02 are located near the top of the chromosomes and are classified into the same subgroups (Figure 2), suggesting that these genes might have undergone whole-genome duplication events during the evolutionary process and might have similar functions. However, some of these genes, e.g., BnaMT4A and BraMT4 on chromosome A03, BnaMT3A and BraMT3 on chromosome A05, and BnaMT1 and BraMT1 on chromosome A10 might have undergone segmental duplications (Figure 5). Finally, BjuMT2H and BniMT2E on chromosome B03 and BjuMT2E and BniMT2A on chromosome B08 might have undergone gene transposition (Figure 5). Taken together, these results shed light on the evolutionary patterns of these subfamilies among adjacent species.

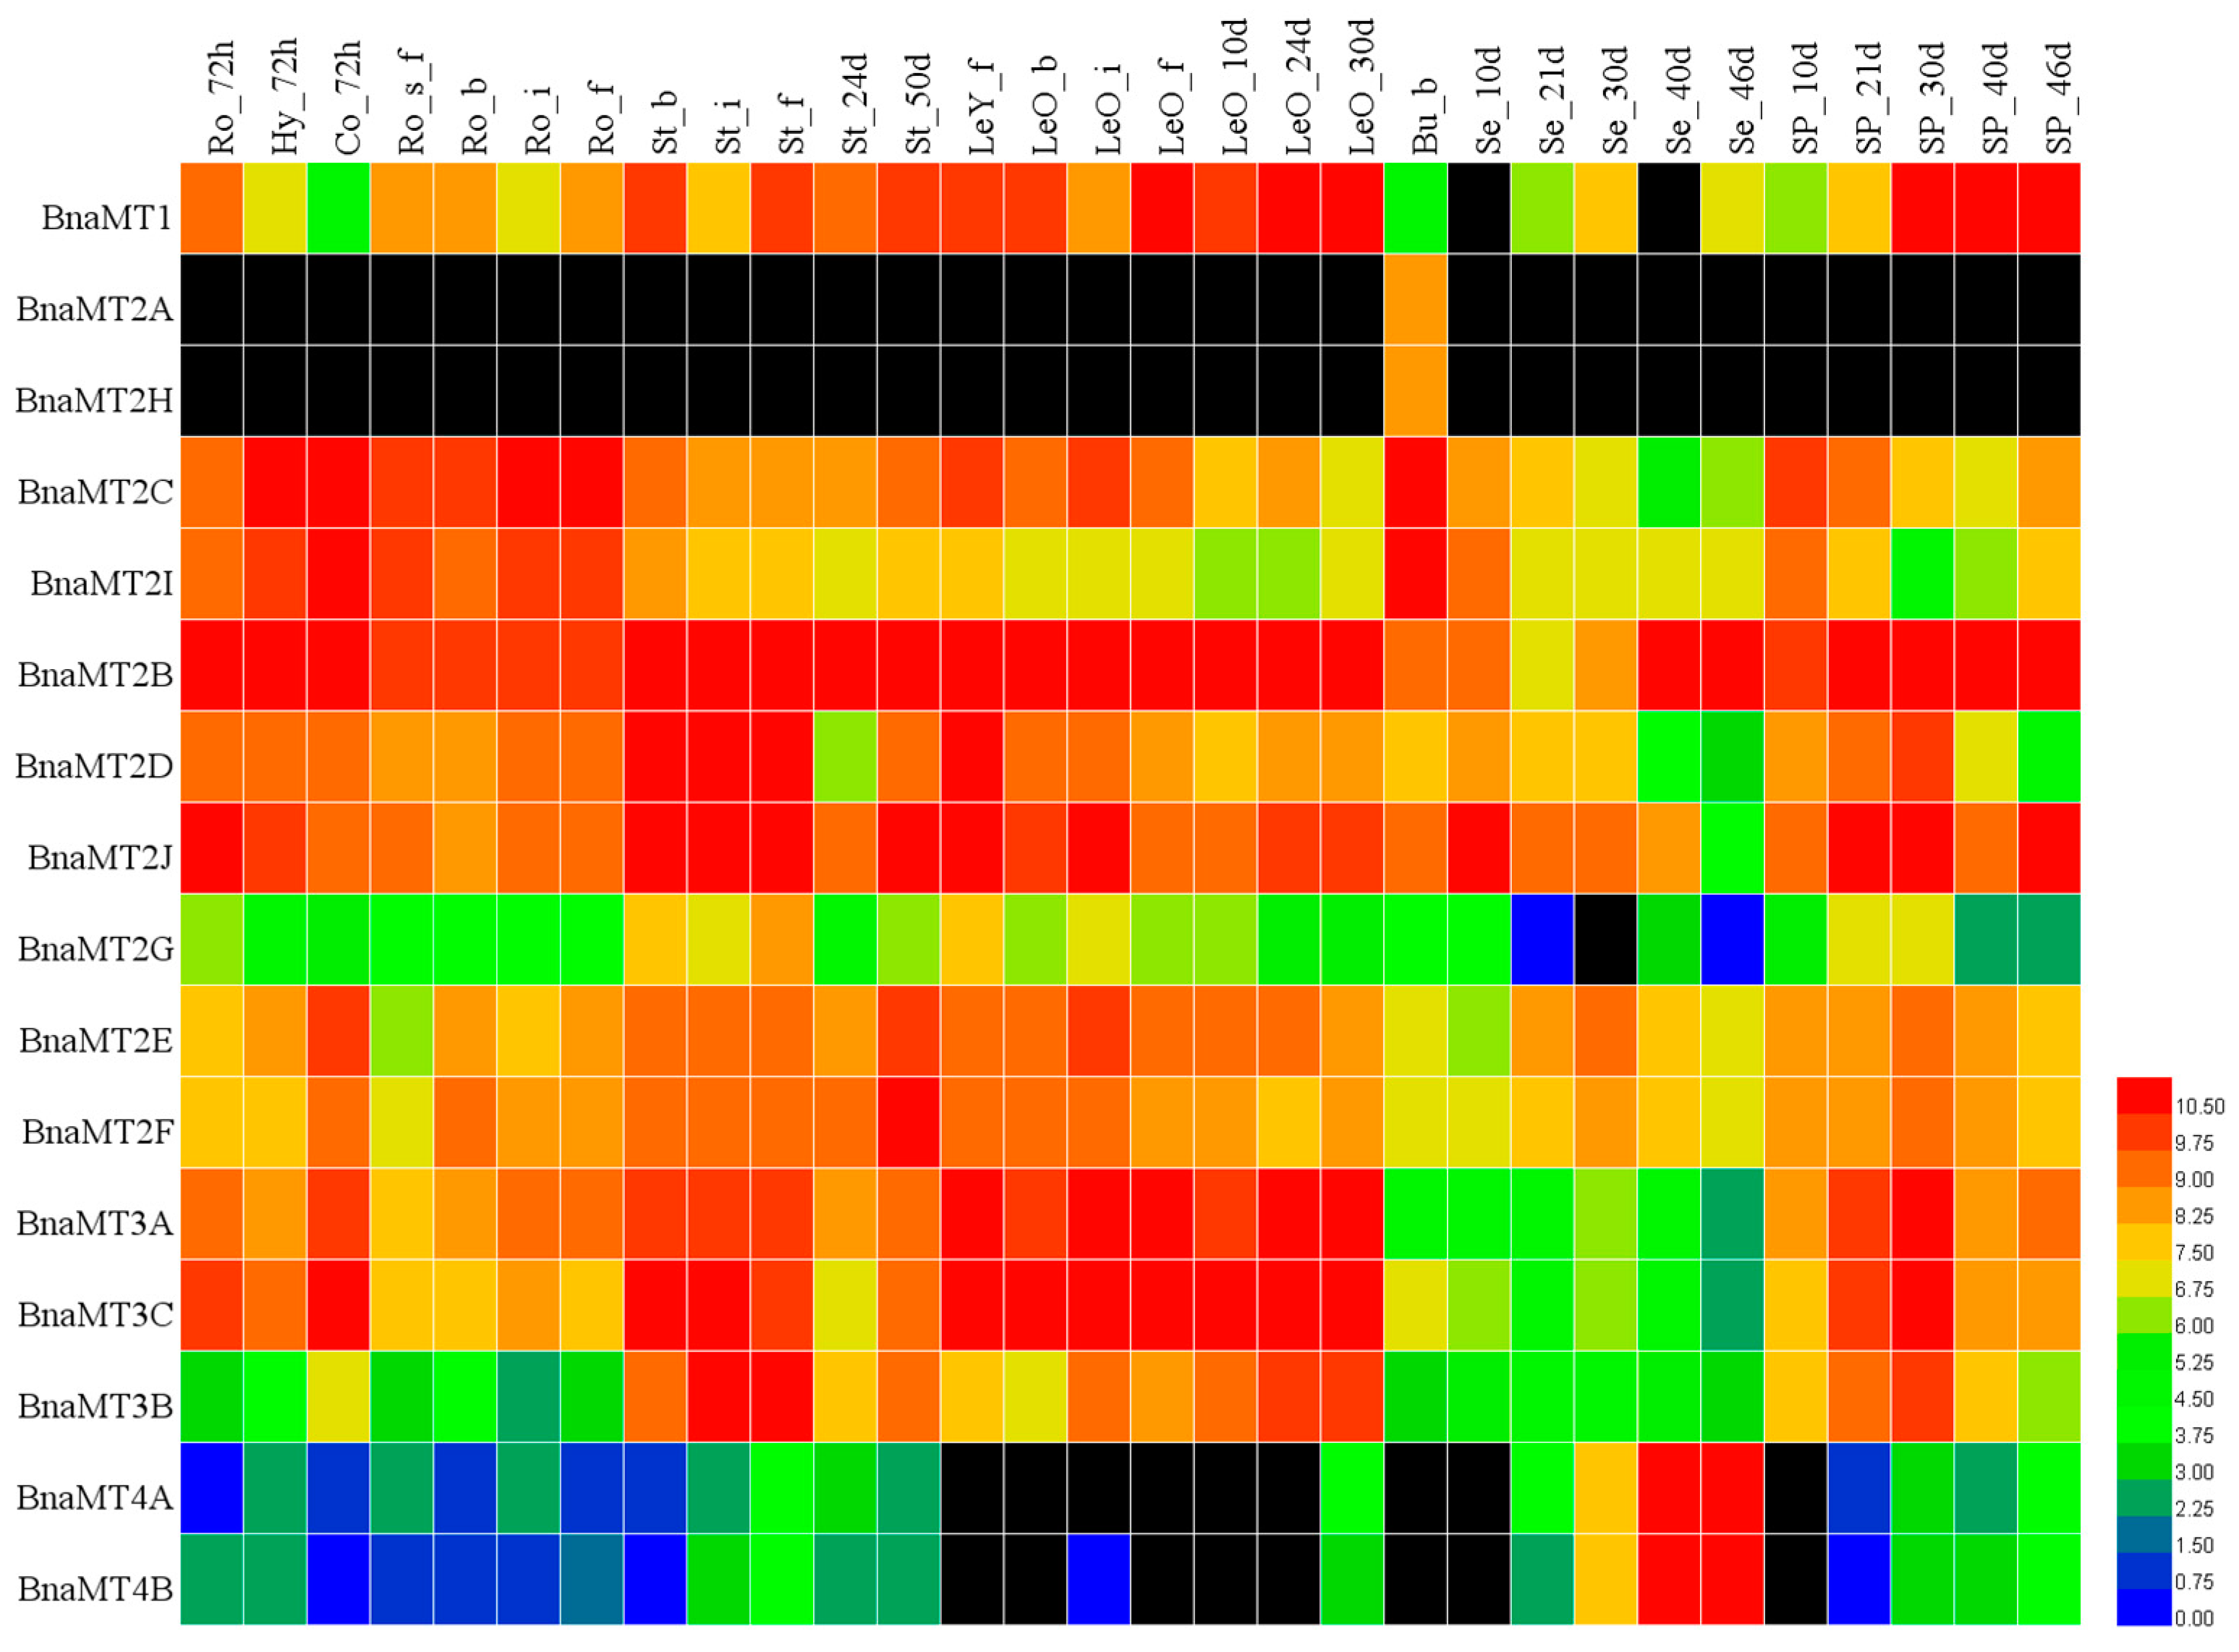
2.5. Expression Profiles of BnaMT Family Genes in B. napus

Based on the transcriptome sequencing datasets from B. napus ZS11 (BioProject ID PRJNA358784), we characterized the expression profiles of the BnaMT genes in eight different tissues, covering all stages of rapeseed development (Figure 6, Tables S1 and S2). Among the 16 BnaMT genes, BnaMT1 was more highly expressed in the stems, leaves, and siliques 30 days after pollination than in other tissues (Figure 6). Among MT2 genes, BnaMT2A and BnaMT2H were specifically expressed in buds; BnaMT2C and BnaMT2I were expressed at higher levels in roots, hypocotyls, cotyledons, and buds than in others tissues; BnaMT2B, BnaMT2D, and BnaMT2J were highly expressed throughout plant development, whereas BnaMT2G was expressed at low levels; and BnaMT2E and BnaMT2F were more highly expressed in stems and leaves than in other tissues (Figure 6). BnaMT3A, BnaMT3B, and BnaMT3C were more highly expressed in stems, leaves, and siliques before day 30 than in other tissues (Figure 6). Finally, BnaMT4A and BnaMT4B were mainly expressed in ripening seeds (Figure 6). The expression patterns of MT family genes correspond with the results of the phylogenetic analysis (Figure 2). For example, the expression patterns were similar for BnaMT2A and BnaMT2H, BnaMT2C and BnaMT2I, and BnaMT2B, BnaMT2D, and BnaMT2J, which were classified into the same sister groups.

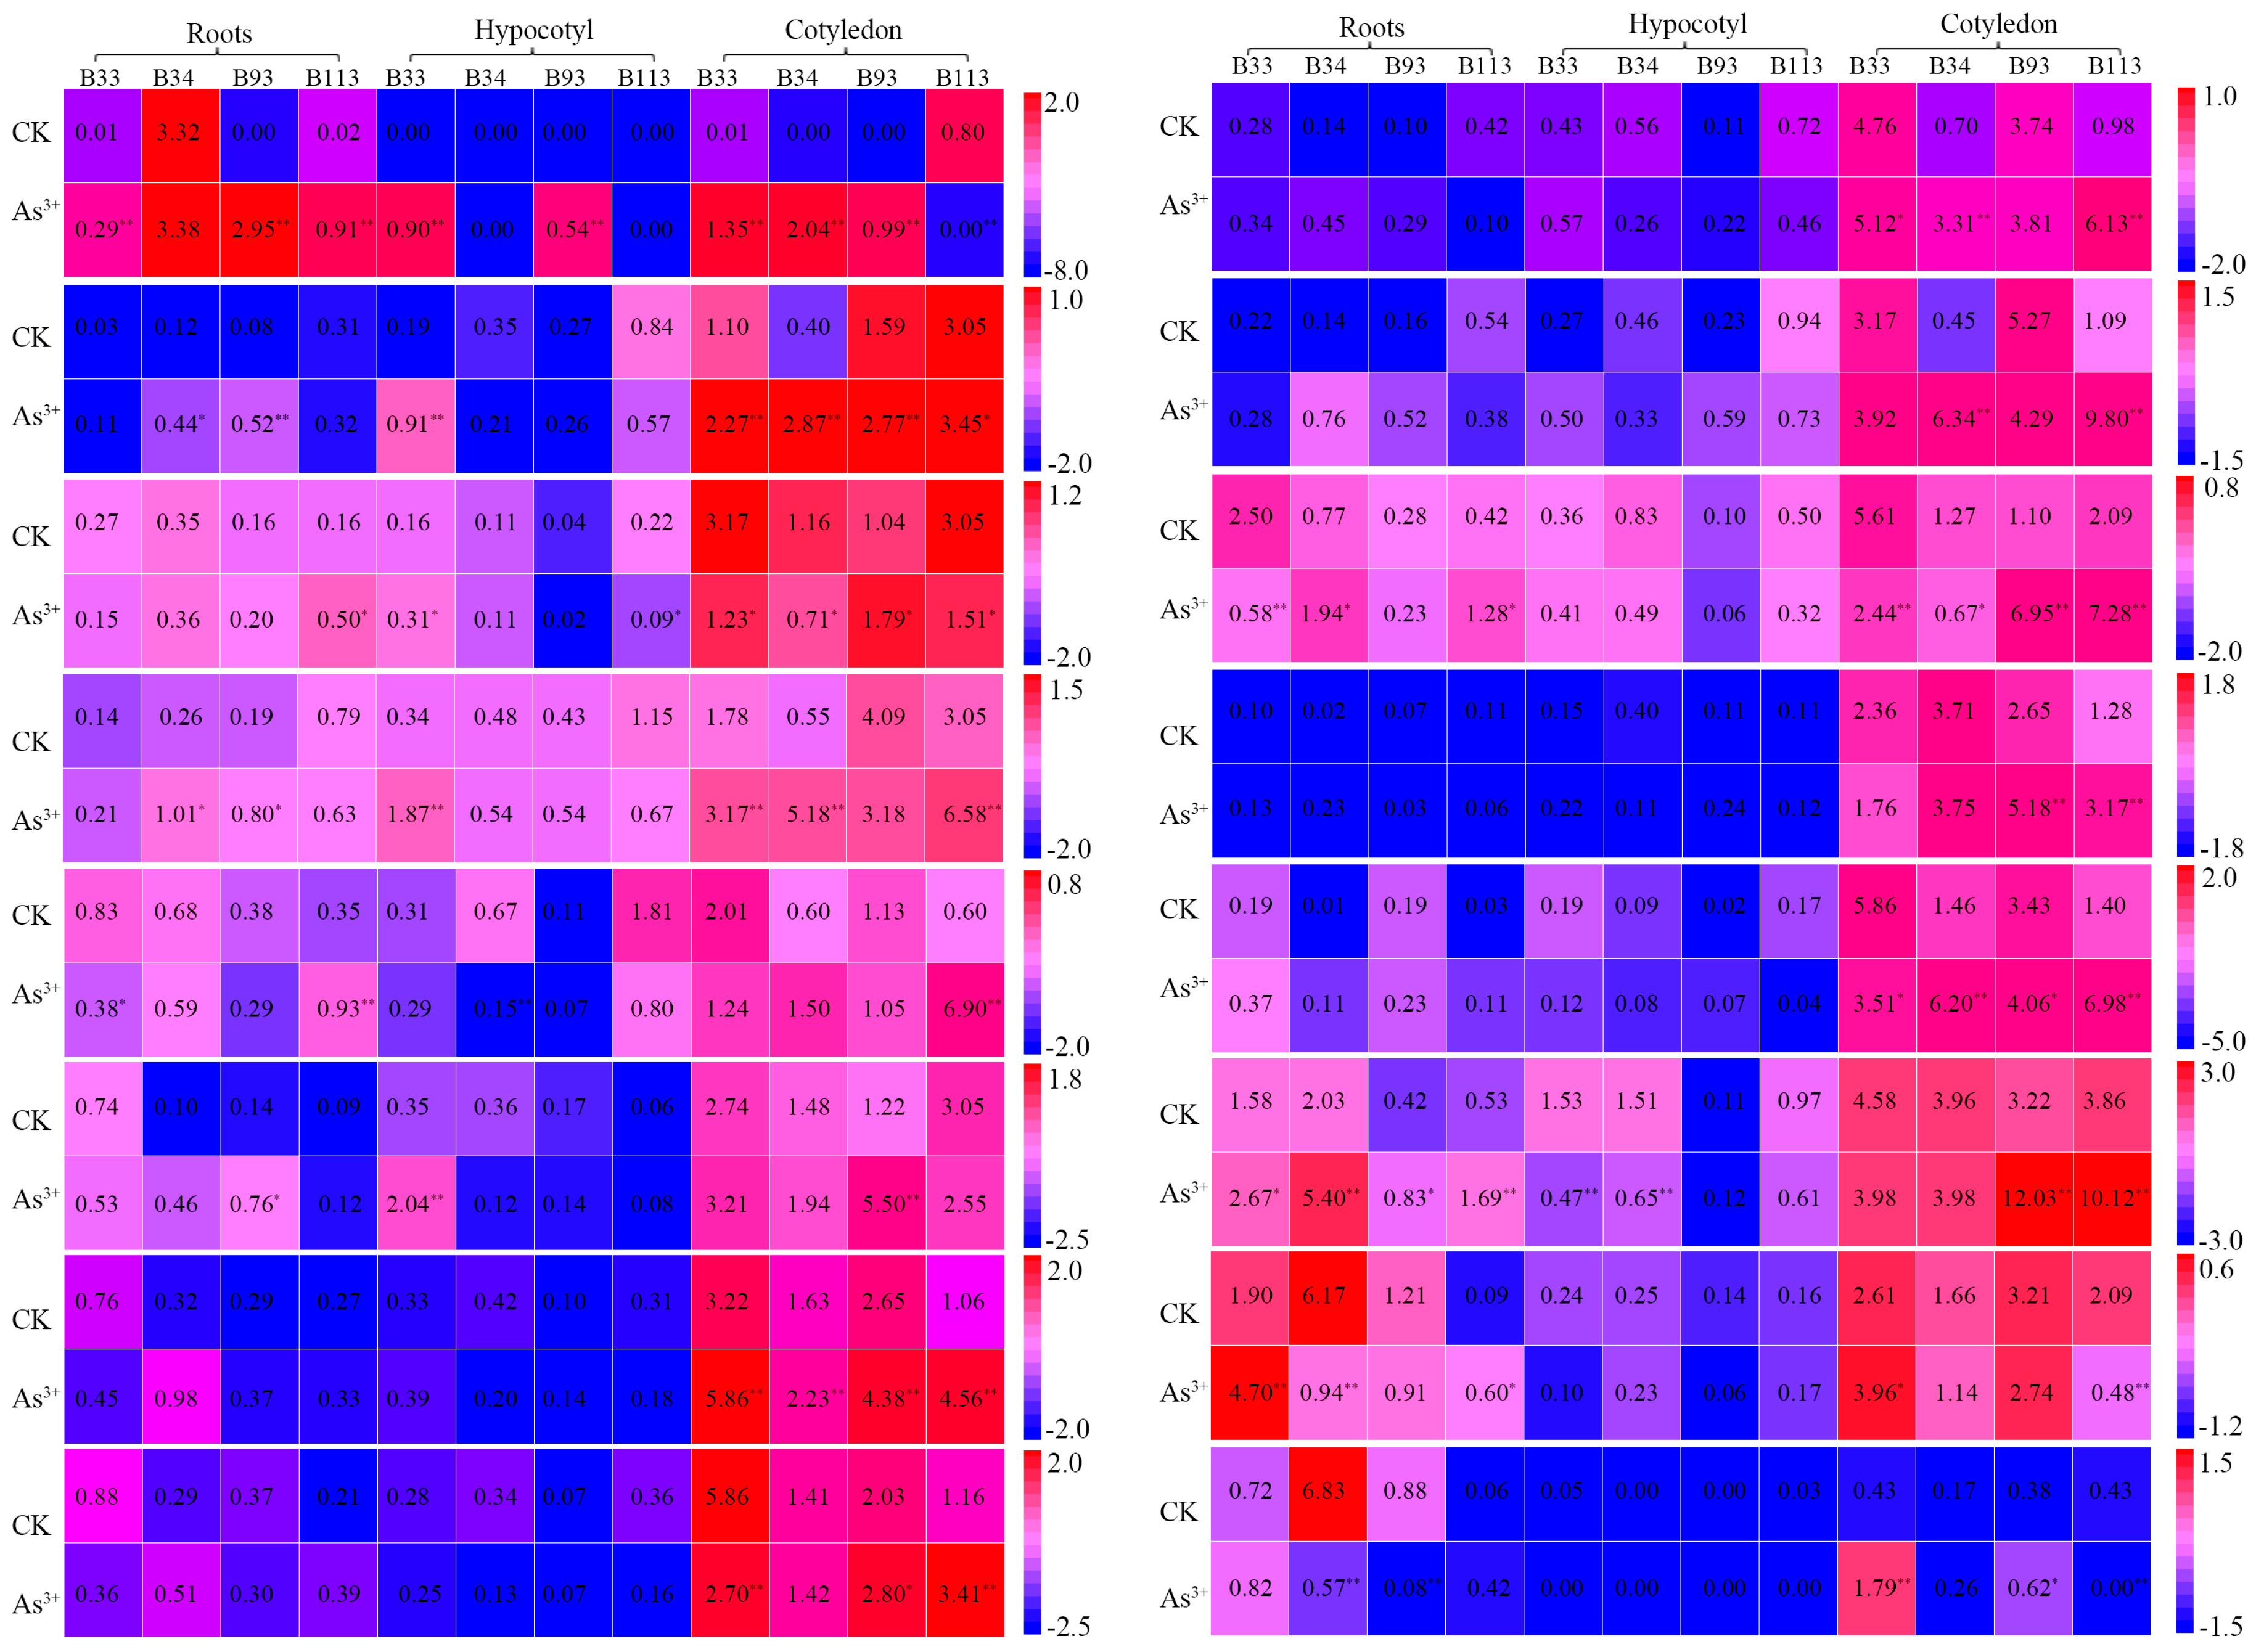
2.6. Expression Analysis of BnaMT Genes in Response to Metal Treatment

MTs are the best-characterized heavy-metal-binding ligands in plants. To analyze the roles of BnaMTs in metal tolerance, we compared the expression profiles of BnaMTs in the roots, hypocotyls, and cotyledons of B. napus plants under As3+ stress versus normal conditions via real-time RT-PCR (RT-qPCR). Under normal conditions, the expression patterns of the BnaMTs were similar to the patterns identified by RNA-seq, with different expression profiles detected among different rapeseed varieties (Figure 7, Table S3). For example, BnaMT2B, BnaMT2C, BnaMT2D, and BnaMT2J were highly expressed in all tissues; BnaMT1 and BnaMT4B were expressed at lower levels in roots, hypocotyls, and cotyledons; BnaMT2A, BnaMT2F, BnaMT2G, BnaMT2H, BnaMT2I, BnaMT3A, and BnaMT3B were expressed at lower levels in roots and hypocotyls than in cotyledons (Figure 7); and BnaMT2A and BnaMT2H did not exhibit tissue-specific expression in B. napus (Figure 6 and Figure 7). After As3+ treatment, all BnaMT genes were expressed at higher levels in roots than in hypocotyls but were expressed at the highest levels in cotyledons (Figure 7). For example, BnaMT1 was upregulated by As3+ treatment, and BnaMT2A, BnaMT2B, BnaMT2F, BnaMT2J, and BnaMT3B were more significantly upregulated in cotyledons than in roots and hypocotyls (Figure 7). Importantly, BnaMT3C was more highly expressed in varieties B33 and B34 than in B93 and B113 (Figure 7).

3. Discussion

The high-affinity heavy metal chelators, PCs and MTs, play crucial roles in maintaining metal homeostasis during plant development [36,37,38,39,40,41]. Moreover, the Brassica plants had high biomass productivity and high levels of heavy metal absorption, as analyzed in B. juncea [1,23], B. rapa [33], and B. napus [42]. In addition, seven putative MT genes have been identified in Arabidopsis [15,16], but no comprehensive study of these genes has been reported. Brassica species, which were derived from a common ancestor, are ideal model systems for analyzing polyploid evolution and genome duplication [43]. Many analyses have focused on the model plant A. thaliana and various Brassica species (B. rapa, B. nigra, B. oleracea, B. napus, B. juncea and B. carinata). The whole genome sequences of all species except B. carinata are available in BRAD (the Brassica Database, http://brassicadb.org/brad/downloadOverview.php). In the present study, we identified 52 MT genes from various Brassica species based on A. thaliana MT gene sequences (Table 1). Phylogenetic analysis revealed that all MT family genes are closely associated with AtMTs (Figure 2), suggesting that they share similar functions or have undergone gene fusion [44]. Of these, MT1 subfamily genes from B. nigra, B. oleracea, and B. juncea have not been identified, but BolMT1 and BjuMT1 have been identified [13]. The number of MT2 (10) and MT3 (3) genes in B. napus is nearly equal to the sum of these genes in B. rapa (5 MT2 and 1 MT3) and B. oleracea (6 MT2 and 2 MT3), and most genes showed high levels of synteny throughout the genome, reflecting the fact that whole genome duplications and segmental duplications were a major contributor to the expansion of MTs during evolution. However, the deduced protein sequence of BraMT1 in B. rapa is longer than the previously published sequence [33], indicating the need for further study to confirm BraMT1. In addition, homologs of BnaMT4A and BraMT4, BnaMT3A and BraMT3, and BnaMT1 and BraMT1 were not detected in the corresponding genomes (Figure 5, Table 1), in accordance with the finding that gene loss typically occurs after polyploidization in eukaryotes [45,46,47]. Furthermore, Cys-rich regions were almost completely conserved among MTs, and the distinct spacer sequences in the Cys-poor linkers were also well-conserved, comprising 7 amino acids in Brassica MT1s, 40–42 amino acids in Brassica MT2s, 32–34 amino acids in Brassica MT3s, and 14–15 amino acids in Brassica MT4s (Figure 1). These results are in close agreement with previous predictions that Cys-rich regions will show highly conserved MT family genes [13,33], and we infer that the variations in the MTs might be associated with their different functions in plants [48].
To date, plant MTs have been widely characterized, exhibiting different tissue-specific expression patterns [8,14,49,50,51,52]. For example, AtMT1A and AtMT2B were predominantly expressed in roots and leaves, while AtMT2A and AtMT3 were highly expressed in roots and young leaves [14]. Likewise, notable differences in expression patterns were also found among MT1, MT2A, and MT2B subfamily genes in B. napus (Figure 6). BnaMT1 was expressed at the highest level in siliques of 30D, except for roots and leaves, whereas B. napus MT2A genes (with four members; BnaMT2A, BnaMT2C, BnaMT2H and BnaMT2I) and MT2B genes (with six members; BnaMT2B, BnaMT2D, BnaMT2E, BnaMT2F, BnaMT2G and BnaMT2J; Figure 2) showed variable expression patterns. For example, BnaMT2A and BnaMT2H were preferentially expressed in buds, and BnaMT2G was expressed at low levels in all organs (Figure 6). These differences may be attributed to concentrations and species differences in future works. However, B. napus MT3 and MT4 subfamily genes shared similar expression patterns with AtMT3 and AtMT4 [14]. B. napus MT3s were mainly expressed in stems, roots, and leaves, and B. napus MT4s were primarily expressed in developing seeds (Figure 6). The expression patterns of these BnaMTs revealed by RT-qPCR corresponded well with the patterns obtained by transcriptome analysis under normal conditions, although there were differences among B. napus varieties (Figure 7). Although no comprehensive heavy metal tolerance mechanisms have been uncovered in Brassica, distinctive expression patterns were identified among the B. napus MT family members in this work, laying the foundation for investigating the biochemical and physiological functions of MTs in plants.
Heavy metal (Cu, Cd, and As) pollution in agricultural soils has become a critical problem affecting crop production and quality. The absorption of these heavy metals by plants plays an important role in the entry of these metals into the food chain [42]. Further, MTs have been shown to play an important role in metal homeostasis and tolerance in plants [4,6,9,10,21,26,33,34]. Strikingly, Brassica plants exhibit efficient heavy metal uptake and translocation, as well as a high tolerance to heavy metals [31,42], and several MT genes in Brassica have been reported, especially in Indian mustard (Brassica juncea L.) [23,27,33,53]. Recently, three B. rapa metallothionein genes (BrMT13) displayed differential expression levels under various exogenous stress factors [54], and MT-like, protein-encoding gene transcription was obviously induced in roots and leaves of B. napus under As treatment [55]. Here, we investigated the expression profiles of BnaMT family genes in B. napus under normal conditions and As3+ stress. The BnaMTs were obviously induced by the As3+ treatments, which is in accordance with findings that MTs are involved in the chelation and sequestration of heavy metals [3,4,55]. Like other plant MT genes [4,41,54,55], however, these genes also had different expression profiles in different B. napus varieties and in different tissues, with high expression levels in cotyledons and low expression levels in hypocotyls, such as BnaMT1, BnaMT2A, BnaMT2B, BnaMT2C, BnaMT2F, BnaMT2J, BnaMT3B, and BnaMT3C (Figure 7). These results suggest that hypocotyls might merely be involved in the transport of heavy metal ions, but that these ions accumulate in roots and cotyledons. In addition, BnaMT3C was obviously increased in the roots and hypocotyls of B33 and B34, but the higher expression levels of B93 and B113 in cotyledons (Figure 7), which comply with the finding that B33 and B34 exhibited better growth than B93 and B113 under As3+ treatment (Figure S2), indicate that they play crucial roles in the response to As3+ stress in B. napus. Our results provide important information for further functional studies of MT family genes in B. napus.

4. Materials and Methods

4.1. Identification of MT Family Genes in Brassica

The amino acid sequences of MTs from the Arabidopsis Information Resource (TAIR10) database (ftp://ftp.arabidopsis.org) were used as queries for the BLASTp analysis against the whole genome sequences in the Brassica database [56]. The candidate sequences with E-values ≤ 1 × 10⁻²⁰ were identified and confirmed using the Hidden Markov model (HMM) searches program (HMMER v3.0, http://hmmer.janelia.org/), and the BLAST analysis of the MTs was performed against a Brassica protein database constructed using Geneious v4.8.5 software (http://www.geneious.com/, Biomatters, Auckland, New Zealand). The coding sequences (CDS) of the MTs were identified by BLASTn searches against the Brassica genome database. The candidate proteins were named using the species abbreviation of the source organism (italicized), the gene family name, and the positions in the subtribe, e.g., AtMT1B and BnaMT1A. Physicochemical properties, including the molecular weight (kDa), isoelectric point (pI), and the grand average of hydropathy (GRAVY) value of each deduced protein were determined using the online ExPASy-ProtParam tool (http://web.expasy.org/protparam/).

4.2. Multiple Sequence Alignment and Phylogenetic Analysis of MTs in Brassica

The deduced amino acid sequences of MT proteins from A. thaliana and various Brassica species, including B. rapa, B. oleracea, B. napus, B. juncea, and B. nigra, were subjected to multiple protein sequence alignment using the ClustalW software with default settings [57]. To illustrate the evolutionary relationships of MTs in Brassica, a neighbor-joining (NJ) phylogenetic tree was generated with the MEGA v6.0 program (Tokyo Metropolitan University, Tokyo, Japan) using the JTT+I+G substitution model and a bootstrap test with 1000 replicates [58]. The phylogenetic trees were visualized using FigTree v1.4.2 (http://tree.bio.ed.ac.uk/software/figtree/).

4.3. Conserved Motif Recognition and Gene Structure Analysis

The CDS of the MTs from the Brassica species were retrieved based on their protein sequences, and the corresponding genomic sequences were extracted from the Brassica genome sequences. The exon–intron structures of the MTs were analyzed online using the Gene Structure Display Server (GSDS v2.0, http://gsds.cbi.pku.edu.cn/index.php). Conserved motifs were identified using Multipel Expectation Maximization for Motif Elucidation (MEME v4.12.0, http://meme-suite.org/tools/meme) with the following parameters: number of repetitions, any; maximum number of motifs, 15; and optimum width of each motif, between 6 and 300 residues [59]. Each motif with an E-value <  1 × 10⁻¹⁰ was retained for motif detection.

4.4. Chromosomal Locations of MT Family Genes in B. napus

The MT family genes were mapped to the rapeseed chromosomes according to their physical distances in the GFF genome files, which were downloaded from the B. napus genome database (http://www.genoscope.cns.fr/brassicanapus/) [43]. A map of the chromosomal locations of the MTs was constructed using MapChart v2.0 (https://www.wur.nl/en/show/Mapchart.htm) [60].

4.5. Plant Materials and Metal Stress Treatments

B. napus seeds were collected from the Rapeseed Engineering Research Center of Southwest University in Chongqing, China (CERCR). Fifty healthy seeds were selected and soaked in a dish (the diameter was 90 mm) containing deionized water for 24 h. Then morphologically uniform seedlings were selected and plugged into a hydroponic system with a float tray (60 cm × 40 cm × 10 cm) for 7 days. Here, the seedlings were exposed to distilled water and 35 μM As3+ solutions, respectively. Meanwhile, they were cultivated under long-day conditions (16 h light/8 h dark, 5000 Lux) at 25 °C. After 7 days, the whole roots, hypocotyls, and cotyledons were sampled to analyze the MT gene expression patterns; the tissues were snap frozen in liquid nitrogen and stored at −80 °C prior to total RNA extraction. All experiments were repeated three times.

4.6. Total RNA Extraction and RT-qPCR Analysis

As the B. napus cultivars B33 and B34 grow better than B93 and B113 under heavy metal treatment (Figure S2), they were therefore used for expression analysis. Total RNA was isolated from the samples using a DNAaway RNA Mini-Prep Kit (Sangon Biotech, Shanghai, China). For the tissue-specific expression analysis, RNA was extracted from the roots, hypocotyls, and cotyledons and pretreated with gDNA Eraser (Takara, Dalian, China). Subsequently, 1 μg of the total RNA was used to synthesize first-strand cDNA with an RNA PCR Kit (AMV) Ver. 3.0 (Takara, Dalian, China). The cDNA was subjected to RT-qPCR analysis using SYBR Premix Ex Taq II (Takara, Dalian, China) on a Bio-Rad CFX96 Real Time System (Bio-Rad Laboratories, Hercules, CA, USA) as previously described [61]. BnACTIN7 (EV116054) was employed as a reference gene to normalize MT gene expression levels via the 2−ΔΔCt method [62]. All experiments were performed with three technical replicates, and the values represent the average ± standard error (SE). The specific primer sequences used in this study were obtained from the qPCR Primer Database [63] and are listed in Supplementary Table S4.

4.7. Statistical Analysis

All experiments were repeated three times (three biological replicates). All data were statistically analyzed using the Student’s t-test with the statistical analysis software package SPSS v15.0 (IBM Corp, Armonk, NJ, USA).

5. Conclusions

In this study, we identified 60 MTs from A. thaliana and five Brassica species. The phylogenetic analysis showed that all MT family genes are closely associated with the AtMTs. Genome-mapping analysis revealed high levels of synteny throughout the genome due to whole genome duplication and segmental duplication events. In addition, all 16 BnaMTs were induced by heavy metal stress, especially in cotyledons versus roots and hypocotyls. Finally, BnaMT3C might improve the response to As3+ stress in B. napus. Our results provide a basis for the further functional analysis of the molecular functions of MT family genes in B. napus.

Supplementary Materials

Supplementary materials can be found at https://www.mdpi.com/1422-0067/19/8/2181/s1.

Author Contributions

C.Q. (Cunmin Qu) and J.L. conceived and designed the experiments; Y.P. and M.Z. conducted the experiments; S.W., G.M. and X.H. collected and analyzed the data; Y.L., C.Q. (Cailin Qiao), R.W. and X.X. carried out the experiments and performed the software analyses; K.L. and C.Q. (Cunmin Qu) wrote the manuscript; and C.Q. (Cunmin Qu) and J.L. reviewed the manuscript.

Funding

This work was supported by the National Natural Science Foundation of China (31772320, 31571701), The National Key Research and Development Plan (2018YFD0100501), the Department of Agriculture projects of modern agricultural technology system (CARS-12), Chongqing Basic Scientific and Advanced Technology Research (cstc2015jcyjBX0001, cstc2017jcyjAX0321), the 973 Project (2015CB150201), the 111 Project (B12006), the Fundamental Research Funds for the Central Universities (XDJK2016A005, XDJK2016B030).

Acknowledgments

We would also like to thank Kathy Farquharson for critical reading of this manuscript.

Conflicts of Interest

The authors declare no conflict of interest.

References

  1. Ebbs, S.; Uchil, S. Cadmium and zinc induced chlorosis in Indian mustard [Brassica juncea (L.) czern] involves preferential loss of chlorophyll b. Photosynthetica 2008, 46, 49–55. [Google Scholar] [CrossRef]
  2. Lingua, G.; Franchin, C.; Todeschini, V.; Castiglione, S.; Biondi, S.; Burlando, B.; Parravicini, V.; Torrigiani, P.; Berta, G. Arbuscular mycorrhizal fungi differentially affect the response to high zinc concentrations of two registered poplar clones. Environ. Pollut. 2008, 153, 137–147. [Google Scholar] [CrossRef] [PubMed]
  3. Hall, J.L. Cellular mechanisms for heavy metal detoxification and tolerance. J. Exp. Bot. 2002, 53, 1–11. [Google Scholar] [CrossRef] [PubMed] [Green Version]
  4. Lv, Y.; Deng, X.; Quan, L.; Xia, Y.; Shen, Z. Metallothioneins BcMT1 and BcMT2 from Brassica campestris enhance tolerance to cadmium and copper and decrease production of reactive oxygen species in Arabidopsis thaliana. Plant Soil 2013, 367, 507–519. [Google Scholar] [CrossRef]
  5. Huang, G.Y.; Wang, Y.S. Expression and characterization analysis of type 2 metallothionein from grey mangrove species (Avicennia marina) in response to metal stress. Aquat. Toxicol. 2010, 99, 86–92. [Google Scholar] [CrossRef] [PubMed]
  6. Mir, G.; Domenech, J.; Huguet, G.; Guo, W.J.; Goldsbrough, P.; Atrian, S.; Molinas, M. A plant type 2 metallothionein (MT) from cork tissue responds to oxidative stress. J. Exp. Bot. 2004, 55, 2483–2493. [Google Scholar] [CrossRef] [PubMed] [Green Version]
  7. Gall, J.E.; Boyd, R.S.; Rajakaruna, N. Transfer of heavy metals through terrestrial food webs: A review. Environ. Monit. Assess. 2015, 187, 201. [Google Scholar] [CrossRef] [PubMed]
  8. Gu, C.S.; Liu, L.Q.; Deng, Y.M.; Zhu, X.D.; Huang, S.Z.; Lu, X.Q. The heterologous expression of the Iris lactea var. chinensis type 2 metallothionein IlMT2b gene enhances copper tolerance in Arabidopsis thaliana. Bull. Environ. Contam. Toxicol. 2015, 94, 247–253. [Google Scholar] [CrossRef] [PubMed]
  9. Hassinen, V.H.; Tuomainen, M.; Peraniemi, S.; Schat, H.; Karenlampi, S.O.; Tervahauta, A.I. Metallothioneins 2 and 3 contribute to the metal-adapted phenotype but are not directly linked to Zn accumulation in the metal hyperaccumulator, Thlaspi caerulescens. J. Exp. Bot. 2009, 60, 187–196. [Google Scholar] [CrossRef] [PubMed]
  10. Cobbett, C.; Goldsbrough, P. Phytochelatins and metallothioneins: Roles in heavy metal detoxification and homeostasis. Annu. Rev. Plant Biol. 2002, 53, 159–182. [Google Scholar] [CrossRef] [PubMed]
  11. Bourdineaud, J.P.; Baudrimont, M.; Gonzalez, P.; Moreau, J.L. Challenging the model for induction of metallothionein gene expression. Biochimie 2006, 88, 1787–1792. [Google Scholar] [CrossRef] [PubMed]
  12. Robinson, N.J.; Tommey, A.M.; Kuske, C.; Jackson, P.J. Plant metallothioneins. Biochem. J. 1993, 295, 1–10. [Google Scholar] [CrossRef] [PubMed] [Green Version]
  13. Leszczyszyn, O.I.; Imam, H.T.; Blindauer, C.A. Diversity and distribution of plant metallothioneins: A review of structure, properties and functions. Metallomics 2013, 5, 1146–1169. [Google Scholar] [CrossRef] [PubMed]
  14. Guo, W.J.; Bundithya, W.; Goldsbrough, P.B. Characterization of the Arabidopsis metallothionein gene family: Tissue-specific expression and induction during senescence and in response to copper. New Phytol. 2003, 159, 369–381. [Google Scholar] [CrossRef]
  15. Benatti, M.R.; Yookongkaew, N.; Meetam, M.; Guo, W.J.; Punyasuk, N.; Abuqamar, S.; Goldsbrough, P. Metallothionein deficiency impacts copper accumulation and redistribution in leaves and seeds of Arabidopsis. New Phytol. 2014, 202, 940–951. [Google Scholar] [CrossRef] [PubMed]
  16. Guo, W.J.; Meetam, M.; Goldsbrough, P.B. Examining the specific contributions of individual Arabidopsis metallothioneins to copper distribution and metal tolerance. Plant Physiol. 2008, 146, 1697–1706. [Google Scholar] [CrossRef] [PubMed]
  17. Lee, J.; Shim, D.; Song, W.Y.; Hwang, I.; Lee, Y. Arabidopsis metallothioneins 2a and 3 enhance resistance to cadmium when expressed in Vicia faba guard cells. Plant Mol. Biol. 2004, 54, 805–815. [Google Scholar] [CrossRef] [PubMed]
  18. Ren, Y.; Liu, Y.; Chen, H.; Li, G.; Zhang, X.; Zhao, J. Type 4 metallothionein genes are involved in regulating Zn ion accumulation in late embryo and in controlling early seedling growth in Arabidopsis. Plant Cell Environ. 2012, 35, 770–789. [Google Scholar] [CrossRef] [PubMed]
  19. Roosens, N.; Leplae, R.; Bernard, C.; Verbruggen, N. Variations in plant metallothioneins: The heavy metal hyperaccumulator Thlaspi caerulescens as a study case. Planta 2005, 222, 716–729. [Google Scholar] [CrossRef] [PubMed]
  20. Hammond, J.P.; Bowen, H.C.; White, P.J.; Mills, V.; Pyke, K.A.; Baker, A.J.; Whiting, S.N.; May, S.T.; Broadley, M.R. A comparison of the Thlaspi caerulescens and Thlaspi arvense shoot transcriptomes. New Phytol. 2006, 170, 239–260. [Google Scholar] [CrossRef] [PubMed]
  21. Yuan, J.; Chen, D.; Ren, Y.; Zhang, X.; Zhao, J. Characteristic and Expression Analysis of a Metallothionein Gene, OsMT2b, Down-Regulated by Cytokinin Suggests Functions in Root Development and Seed Embryo Germination of Rice. Plant Physiol. 2008, 146, 1637–1650. [Google Scholar] [CrossRef] [PubMed]
  22. Zhou, Y.; Chu, P.; Chen, H.; Li, Y.; Liu, J.; Ding, Y.; Tsang, E.W.; Jiang, L.; Wu, K.; Huang, S. Overexpression of Nelumbo nucifera metallothioneins 2a and 3 enhances seed germination vigor in Arabidopsis. Planta 2012, 235, 523–537. [Google Scholar] [CrossRef] [PubMed]
  23. An, Z.; Li, C.; Zu, Y.; Du, Y.; Andreas, W.; Gromes, R.; Rausch, T. Expression of BjMT2, a metallothionein 2 from Brassica juncea, increases copper and cadmium tolerance in Escherichia coli and Arabidopsis thaliana, but inhibits root elongation in Arabidopsis thaliana seedlings. J. Exp. Bot. 2006, 57, 3575–3582. [Google Scholar]
  24. Kumar, P.B.; Dushenkov, V.; Motto, H.; Raskin, I. Phytoextraction: The use of plants to remove heavy metals from soils. Environ. Sci. Technol. 1995, 29, 1232–1238. [Google Scholar] [CrossRef] [PubMed]
  25. Salt, D.E.; Blaylock, M.; Kumar, N.P.; Dushenkov, V.; Ensley, B.D.; Chet, I.; Raskin, I. Phytoremediation: A novel strategy for the removal of toxic metals from the environment using plants. Biotechnology 1995, 13, 468–474. [Google Scholar] [CrossRef] [PubMed]
  26. Cojocaru, P.; Gusiatin, Z.M.; Cretescu, I. Phytoextraction of Cd and Zn as single or mixed pollutants from soil by rape (Brassica napus). Environ. Sci. Pollut. Res. 2016, 23, 10693–10701. [Google Scholar] [CrossRef] [PubMed]
  27. Gasic, K.; Korban, S.S. Expression of Arabidopsis phytochelatin synthase in Indian mustard (Brassica juncea) plants enhances tolerance for Cd and Zn. Planta 2007, 225, 1277–1285. [Google Scholar] [CrossRef] [PubMed]
  28. Sridhar, B.B.M.; Diehl, S.V.; Han, F.X.; Monts, D.L.; Su, Y. Anatomical changes due to uptake and accumulation of Zn and Cd in Indian mustard (Brassica juncea). Environ. Exp. Bot. 2005, 54, 131–141. [Google Scholar] [CrossRef]
  29. Ishikawa, S.; Noriharu, A.; Murakami, M.; Wagatsuma, T. Is Brassica juncea a suitable plant for phytoremediation of cadmium in soils with moderately low cadmium contamination?—Possibility of using other plant species for Cd-phytoextraction. Soil Sci. Plant Nutr. 2006, 52, 32–42. [Google Scholar] [CrossRef]
  30. Marchiol, L.; Assolari, S.; Sacco, P.; Zerbi, G. Phytoextraction of heavy metals by canola (Brassica napus) and radish (Raphanus sativus) grown on multicontaminated soil. Environ. Pollut. 2004, 132, 21–27. [Google Scholar] [CrossRef] [PubMed]
  31. Solhi, M.; Shareatmadari, H.; Hajabbasi, M.A. Lead and Zinc Extraction Potential of Two Common Crop Plants, Helianthus Annuus and Brassica napus. Water Air Soil Pollut. 2005, 167, 59–71. [Google Scholar] [CrossRef]
  32. Touiserkani, T.; Haddad, R. Cadmium-induced stress and antioxidative responses in different Brassica napus cultivars. J. Agric. Sci. Technol. 2012, 14, 929–937. [Google Scholar]
  33. Kim, S.H.; Lee, H.S.; Song, W.Y.; Choi, K.S.; Hur, Y. Chloroplast-targeted BrMT1 (Brassica rapa type-1 metallothionein) enhances resistance to cadmium and ROS in transgenicatabidopsis plants. J. Plant Biol. 2007, 50, 1–7. [Google Scholar] [CrossRef]
  34. Zhang, M.; Takano, T.; Liu, S.; Zhang, X. Abiotic stress response in yeast and metal-binding ability of a type 2 metallothionein-like protein (PutMT2) from Puccinellia tenuiflora. Mol. Biol. Rep. 2014, 41, 5839–5849. [Google Scholar] [CrossRef] [PubMed]
  35. Nagaharu, U. Genome analysis in Brassica with special reference to the experimental formation of B. napus and peculiar mode of fertilisation. J. Jpn. Bot. 1935, 7, 389–452. [Google Scholar]
  36. Von Ruecker, A.A.; Wild, M.; Rao, G.S.; Bidlingmaier, F. Atrial natriuretic peptide protects hepatocytes against damage induced by hypoxia and reactive oxygen. Possible role of intracellular free ionized calcium. J. Clin. Chem. Clin. Biochem. 1989, 27, 531–537. [Google Scholar] [PubMed]
  37. Palmiter, R.D. The elusive function of metallothioneins. Proc. Natl. Acad. Sci. USA 1998, 95, 8428–8430. [Google Scholar] [CrossRef] [PubMed] [Green Version]
  38. Tottey, S.; Rondet, S.A.; Borrelly, G.P.; Robinson, P.J.; Rich, P.R.; Robinson, N.J. A copper metallochaperone for photosynthesis and respiration reveals metal-specific targets, interaction with an importer, and alternative sites for copper acquisition. J. Biol. Chem. 2002, 277, 5490–5497. [Google Scholar] [CrossRef] [PubMed]
  39. Coyle, P.; Philcox, J.; Carey, L.; Rofe, A.M. Metallothionein: The multipurpose protein. Cell. Mol. Life Sci. 2002, 59, 627–647. [Google Scholar] [CrossRef] [PubMed]
  40. Guo, S.Y.; Xu, D.; Yang, P.; Yu, W.T.; Lv, M.K.; Yuan, D.R.; Yang, Z.H.; Zhang, G.H.; Sun, S.Y.; Wang, X.Q.; et al. A Novel Nonlinear Optical Complex Crystal with an Organic Ligand Coordinated Through an O Atom: Tetrathiocyanatocadmiummercury-Dimethyl Sulfoxide. Cryst. Res. Technol. 2001, 36, 609–614. [Google Scholar] [CrossRef]
  41. Ansarypour, Z.; Shahpiri, A. Heterologous expression of a rice metallothionein isoform (OsMTI-1b) in Saccharomyces cerevisiae enhances cadmium, hydrogen peroxide and ethanol tolerance. Braz. J. Microbiol. 2017, 48, 537–543. [Google Scholar] [CrossRef] [PubMed]
  42. Benáková, M.; Ahmadi, H.; Dučaiová, Z.; Tylová, E.; Clemens, S.; Tůma, J. Effects of Cd and Zn on physiological and anatomical properties of hydroponically grown Brassica napus plants. Environ. Sci. Pollut. Res. 2017, 24, 20705–20716. [Google Scholar] [CrossRef] [PubMed]
  43. Chalhoub, B.; Denoeud, F.; Liu, S.; Parkin, I.A.; Tang, H.; Wang, X.; Chiquet, J.; Belcram, H.; Tong, C.; Samans, B.; et al. Early allopolyploid evolution in the post-neolithic Brassica napus oilseed genome. Science 2014, 345, 950–953. [Google Scholar] [CrossRef] [PubMed]
  44. Sun, H.; Fan, H.-J.; Ling, H.-Q. Genome-wide identification and characterization of the bHLH gene family in tomato. BMC Genom. 2015, 16, 9. [Google Scholar] [CrossRef] [PubMed]
  45. Sankoff, D.; Zheng, C.; Zhu, Q. The collapse of gene complement following whole genome duplication. BMC Genom. 2010, 11, 313. [Google Scholar] [CrossRef] [PubMed]
  46. Wang, X.; Wang, H.; Wang, J.; Sun, R.; Wu, J.; Liu, S.; Bai, Y.; Mun, J.-H.; Bancroft, I.; Cheng, F.; et al. The genome of the mesopolyploid crop species Brassica Rapa. Nat. Genet. 2011, 43, 1035–1039. [Google Scholar] [CrossRef] [PubMed]
  47. Qu, C.; Zhao, H.; Fu, F.; Wang, Z.; Zhang, K.; Zhou, Y.; Wang, X.; Wang, R.; Xu, X.; Tang, Z.; et al. Genome-wide survey of flavonoid biosynthesis genes and gene expression analysis between black- and yellow-seeded Brassica napus. Front. Plant Sci. 2016, 7. [Google Scholar] [CrossRef] [PubMed]
  48. Zimeri, A.M.; Dhankher, O.P.; Mccaig, B.; Meagher, R.B. The Plant MT1 Metallothioneins are Stabilized by Binding Cadmiums and are Required for Cadmium Tolerance and Accumulation. Plant Mol. Biol. 2005, 58, 839–855. [Google Scholar] [CrossRef] [PubMed]
  49. Framond, A.J.D. A metallothionein-like gene from maize (Zea mays) Cloning and characterization. FEBS Lett. 1991, 290, 103–106. [Google Scholar] [CrossRef]
  50. Zhou, J.; Goldsbrough, P.B. Structure, organization and expression of the metallothionein gene family in Arabidopsis. Mol. Gen. Genet. 1995, 248, 318–328. [Google Scholar] [CrossRef] [PubMed]
  51. Foley, R.C.; Singh, K.B. Isolation of a Vicia faba metallothionein-like gene, expression in foliar trichomes. Plant Mol. Biol. 1994, 26, 435–444. [Google Scholar] [CrossRef] [PubMed]
  52. Shawber, C.; Nofziger, D.; Hsieh, J.J.; Lindsell, C.; Bögler, O.; Hayward, D.; Weinmaster, G. Notch signaling inhibits muscle cell differentiation through a CBF1-independent pathway. Development 1996, 122, 3765–3773. [Google Scholar] [PubMed]
  53. Liu, J.X.; Zu, Y.G.; Shi, X.G.; Ai, Y.Z.; Du, Y.J.; Fu, Y.J.; An, Z.G. BjMT2, a metallothionein type-2 from Brassica juncea, may effectively remove excess lead from erythrocytes and kidneys of rats. Environ. Toxicol. Pharmacol. 2007, 23, 168–173. [Google Scholar] [CrossRef] [PubMed]
  54. Ahn, Y.O.; Kim, S.H.; Lee, J.; Kim, H.; Lee, H.S.; Kwak, S.S. Three Brassica rapa metallothionein genes are differentially regulated under various stress conditions. Mol. Biol. Rep. 2012, 39, 2059–2067. [Google Scholar] [CrossRef] [PubMed]
  55. Farooq, M.A.; Gill, R.A.; Ali, B.; Wang, J.; Islam, F.; Ali, S.; Zhou, W. Subcellular distribution, modulation of antioxidant and stress-related genes response to arsenic in Brassica napus L. Ecotoxicology 2016, 25, 350–366. [Google Scholar] [CrossRef] [PubMed]
  56. Altschul, S.F.; Madden, T.L.; Schäffer, A.A.; Zhang, J.; Zhang, Z.; Miller, W.; Lipman, D.J. Gapped BLAST and PSI-BLAST: A new generation of protein database search programs. Nucleic Acids Res. 1997, 25, 3389–3402. [Google Scholar] [CrossRef] [PubMed]
  57. Larkin, M.A.; Blackshields, G.; Brown, N.; Chenna, R.; McGettigan, P.A.; McWilliam, H.; Valentin, F.; Wallace, I.M.; Wilm, A.; Lopez, R. Clustal W and Clustal X version 2.0. Bioinformatics 2007, 23, 2947–2948. [Google Scholar] [CrossRef] [PubMed] [Green Version]
  58. Tamura, K.; Stecher, G.; Peterson, D.; Filipski, A.; Kumar, S. MEGA6: Molecular evolutionary genetics analysis version 6.0. Mol. Biol. Evol. 2013, 30, 2725–2729. [Google Scholar] [CrossRef] [PubMed]
  59. Bailey, T.L.; Boden, M.; Buske, F.A.; Frith, M.; Grant, C.E.; Clementi, L.; Ren, J.; Li, W.W.; Noble, W.S. MEME SUITE: Tools for motif discovery and searching. Nucleic Acids Res. 2009, 37, W202–W208. [Google Scholar] [CrossRef] [PubMed]
  60. Voorrips, R. MapChart: Software for the graphical presentation of linkage maps and QTLs. Heredity 2002, 93, 77–78. [Google Scholar] [CrossRef]
  61. Qu, C.; Fu, F.; Lu, K.; Zhang, K.; Wang, R.; Xu, X.; Wang, M.; Lu, J.; Wan, H.; Zhanglin, T.; et al. Differential accumulation of phenolic compounds and expression of related genes in black-and yellow-seeded Brassica napus. J. Exp. Bot. 2013, 64, 2885–2898. [Google Scholar] [CrossRef] [PubMed]
  62. Wu, G.; Li, Z.; Yuhua, W.; Yinglong, C.; Changming, L. Comparison of Five Endogenous Reference Genes for Specific PCR Detection and Quantification of Brassica napus. J. Agric. Food Chem. 2010, 58, 2812–2817. [Google Scholar] [CrossRef] [PubMed]
  63. Lu, K.; Li, T.; He, J.; Chang, W.; Zhang, R.; Liu, M.; Yu, M.; Fan, Y.; Ma, J.; Sun, W. qPrimerDB: A thermodynamics-based gene-specific qPCR primer database for 147 organisms. Nucleic Acids Res. 2018, 46, D1229–D1236. [Google Scholar] [CrossRef] [PubMed]
Figure 1. Neighbor-Joining (NJ) phylogenetic tree showed the relationships of Metallothionein (MT) family genes from A. thaliana and various Brassica species. The rooted neighbor-joining phylogenetic tree was constructed using MEGA6 and visualized using Figure Tree v1.4.2. The MTs were divided into four subfamilies (MT1–MT4), which are indicated by different colors. Organism name and gene accession numbers are shown in Table 1.
Ijms 19 02181 g001
Figure 2. Alignment of MT protein sequences from A. thaliana and various Brassica species. Black and light gray shading indicate identical and conserved amino acid residues, respectively. (A) The MT1 protein sequences; (B) the MT2 protein sequences; (C) the MT3 protein sequences; (D) the MT4 protein sequences. The conserved cysteines regions are highlighted by asterisks and light yellow. The MTs were preliminarily classified by Cobbett and Goldsbrough reported [10]; detailed information is provided in Table 1.
Ijms 19 02181 g002
Figure 3. Phylogenetic relationships and genomic structures of the MT genes from A. thaliana and various Brassica species. The red boxes represent exons, solid lines represent introns (connecting two exons), and blue boxes represent untranslated regions (UTRs). The lengths of the MT genes are indicated by horizontal lines (kb).
Ijms 19 02181 g003
Figure 4. Putative conserved motifs in MT family proteins in various Brassica species identified using the MEME search tool. (A) the conserved motifs in MT1 family; (B) the conserved motifs in MT2 family; (C) the conserved motifs in MT3 family; (D) the conserved motifs in MT4 family. Different motifs are represented by different colors, and protein names and combined p values are shown on left side of this figure. The best possible matched motifs, their functional annotation, and motif width are shown in Figure S1.
Ijms 19 02181 g004
Figure 5. Chromosomal distribution and analysis of duplication events in MT family genes among Brassica species. Genes from the same subgroups are indicated by the same color, which is consistent with the corresponding family in the phylogenetic tree (Figure 1). The labels on the corresponding chromosomes indicate the names of the source organism and the subgenome. The scales indicate the sizes of various Brassica plant genomes (Mb). Bra, B. rapa; Bol, B. oleracea; Bni, B. nigra; Bna, B. napus; and Bju, B. juncea. The genes located on the scaffold are not shown in the Figure 5.
Ijms 19 02181 g005
Figure 6. Heatmap of the expression profiles of BnaMT family genes in different tissues and organs. The abbreviations above the heatmap indicate the different tissues and organs/developmental stages of B. napus ZS11 (listed in Table S1). The expression data was gained from the RNA-seq data and shown as log2, as calculated by fragments per kilo base of exon model permillion (FPKM) values. Black boxes indicate that no expression was detected by RNA-seq analysis. The heatmap was generated using Heatmap Illustrator v1.0 (HemI v1.0, Huazhong University, Wuhan, China; http://hemi.biocuckoo.org/contact.php).
Ijms 19 02181 g006
Figure 7. Expression analysis of BnaMT family genes in different tissues under control and As3+ treatment via real-time RT-PCR (RT-qPCR). Three biological replicates per sample were used for analysis, and three technical replicates were analyzed per biological replicate. Values represent the average of three biological replicates with three technical replicates of each tissue (Table S3). The expression data was gained from the real-time RT-PCR (RT-qPCR) analysis data and shown as log2 as calculated by average values normalized to that of the reference gene BnACTIN7 (EV116054). *, ** indicates a significance level at 0.05 and 0.01, respectively. The heatmap was generated using Heatmap Illustrator v1.0 (HemI v1.0, Huazhong University, Wuhan, China; http://hemi.biocuckoo.org/contact.php).
Ijms 19 02181 g007
Table 1. List of Metallothionein (MT) genes identified in the A. thaliana and Brassica genomes.
GroupsNameGene IDChr.Start (bp)End (bp)Length (bp)Length (aa)MW (KDa)pIsExonIntron
MT1AtMT1AT1G07600AtChr123389042339321138454.5804.2321
AtMT1CAT1G07610AtChr123415422342123138454.4954.5421
AtMT1BAT5G56795AtChr52297204222972449156515.42810.2521
BraMT1Bra015594BraA1076667077270645014916.779.3243
BnaMT1BnaA10g04950DBnaA1026732662673770138454.4803.9221
BolMT1DK501359UNUNUN138454.4123.92UNUN
BjuMT1EF471214UNUNUN138454.4393.92UNUN
MT2AtMT2AAT3G09390AtChr328894862890229246818.1634.3521
AtMT2BAT5G02380AtChr5506498507244234777.7664.5421
BraMT2ABra001309BraA031580359815803933246818.1974.1721
BraMT2BBra005720BraA03275453275766243808.0334.2921
BraMT2CBra009595BraA101618205816182453243808.0314.2921
BraMT2DBra028875BraA02269835270,238246818.3864.2021
BraMT2EBra029765BraA052308283323083178243808.0244.3521
BolMT2ABol000591Scaffold0005213795038342243808.0314.2921
BolMT2BBol011307Scaffold000212445183445551243808.0544.5821
BolMT2CBol012825BolC02305134305536246818.3864.2021
BolMT2DBol015273BolC03101213101535243808.1374.2921
BolMT2EBol023080BolC013753390937534079171565.9204.1510
BolMT2FBol033925Scaffold000040316614316949246818.1474.1521
BnaMT2ABnaA03g30680DBnaA031485753014858170240797.9663.8121
BnaMT2BBnaA03g54880DA03_random4475145330243808.0774.2921
BnaMT2CBnaA05g29010DBnaA052041606020416808243808.0244.3521
BnaMT2DBnaA10g27170DBnaA101717077317171571243808.0314.2921
BnaMT2EBnaAnng00330DAnn_random321245322046246818.3704.2021
BnaMT2FBnaC02g03550DBnaC0216856181686330246818.3864.2021
BnaMT2GBnaC03g00710DBnaC03346945347282216717.2844.0821
BnaMT2HBnaC03g35960DBnaC032177802521778740240797.9503.7921
BnaMT2IBnaC05g43490DBnaC054032748640328304243808.0284.5821
BnaMT2JBnaCnng40400DCnn_random3897240138973067243808.0314.2921
BjuMT2ABjuA008858BjuA03321697322020243808.0334.2921
BjuMT2BBjuA020647BjuA05293176802931936631210310.6614.2432
BjuMT2CBjuA040818BjuA02430697431097246818.3704.2021
BjuMT2DBjuA044587BjuA101961906619619458243808.0314.2921
BjuMT2EBjuB001621BjuB08169755170152243808.0594.2921
BjuMT2FBjuB005939BjuB0143381550433836412979810.0573.9332
BjuMT2GBjuB012072BjuB052038727220387699246818.3534.1121
BjuMT2HBjuB031838BjuB031276675712767103222737.5964.3521
BjuMT2IBjuB044439BjuB025275731352757655243808.0614.2921
BniMT2ABniB001954-PABniB083052416630524483243808.0754.2921
BniMT2BBniB007929-PABniB0521899852190357243807.9784.3521
BniMT2CBniB023579-PABniB022821302528213453246818.3534.1121
BniMT2DBniB039464-PABniB073224038332240733222737.5964.3521
BniMT2EBniB045064-PABniB034431818944318591225747.5694.0821
MT3AtMT3AT3G15353AtChr351806425181586210697.3734.3532
BraMT3Bra027254BraA052068349420683920204677.1834.1732
BolMT3ABol011145BolC052812053028120940204677.1584.1532
BolMT3BBol025753BolC031706198217062438198657.0164.4032
BnaMT3ABnaA05g24200DBnaA051817787118178669204677.1274.1532
BnaMT3BBnaC03g39060DBnaC032409159224092154198657.0164.4032
BnaMT3CBnaC05g38240DBnaC053701713137017881204677.1584.1532
BjuMT3BjuB025665BjuB014043425340434691204677.1874.1532
BniMT3BniB008959-PABniB0549574664957899204677.1874.1532
MT4AtMT4BAT2G23240AtChr298958559896325261868.4375.5821
AtMT4AAT2G42000AtChr2175292431753044336612112.2297.6243
BraMT4Bra000590BraA031195123511951571261868.4807.3721
BnaMT4ABnaA03g23200DBnaA031106771911068213261868.4807.3721
BnaMT4BBnaC03g27400DBnaC031589503215895647261868.4686.9721
BjuMT4BjuO006263Contig407_1_341981122112122451261868.5006.9721
BniMT4BniB049568-PABniB032974952429749863261868.4726.9721
Note, At, A. thalinana; Bra, B. rapa; Bol, B. oleracea; Bni, B. nigra; Bna, B. napus; and Bju, B. juncea; Chr., Chromosome; UN, unknown.

