Article

Substantial Epigenetic Variation Causing Flower Color Chimerism in the Ornamental Tree Prunus mume Revealed by Single Base Resolution Methylome Detection and Transcriptome Sequencing

1
Beijing Key Laboratory of Ornamental Plants Germplasm Innovation & Molecular Breeding, National Engineering Research Center for Floriculture, Beijing Laboratory of Urban and Rural Ecological Environment, Key Laboratory of Genetics and Breeding in Forest Trees and Ornamental Plants of Ministry of Education, School of Landscape Architecture, Beijing Forestry University, Beijing 100083, China
2
Beijing Advanced Innovation Center for Tree Breeding by Molecular Design, Beijing Forestry University, Beijing 100083, China
3
Mei Research Center of China, Wuhan 430074, China
*
Author to whom correspondence should be addressed.
Int. J. Mol. Sci. 2018, 19(8), 2315; https://doi.org/10.3390/ijms19082315
Submission received: 4 June 2018 / Revised: 29 July 2018 / Accepted: 2 August 2018 / Published: 7 August 2018
(This article belongs to the Special Issue Plant Genomics)

Abstract

:
Epigenetic changes caused by methylcytosine modification participate in gene regulation and transposable element (TE) repression, resulting in phenotypic variation. Although the effects of DNA methylation and TE repression on flower, fruit, seed coat, and leaf pigmentation have been investigated, little is known about the relationship between methylation and flower color chimerism. In this study, we used a comparative methylomic–transcriptomic approach to explore the molecular mechanism responsible for chimeric flowers in Prunus mume “Danban Tiaozhi”. High-performance liquid chromatography-electrospray ionization mass spectrometry revealed that the variation in white (WT) and red (RT) petal tissues in this species is directly due to the accumulation of anthocyanins, i.e., cyanidin 3,5-O-diglucoside, cyanidin 3-O-glucoside, and peonidin 3-O-glucoside. We next mapped the first-ever generated methylomes of P. mume, and found that 11.29–14.83% of the genomic cytosine sites were methylated. We also determined that gene expression was negatively correlated with methylcytosine level in general, and uncovered significant epigenetic variation between WT and RT. Furthermore, we detected differentially methylated regions (DMRs) and DMR-related genes between WT and RT, and concluded that many of these genes, including differentially expressed genes (DEGs) and transcription factor genes, are critical participants in the anthocyanin regulatory pathway. Importantly, some of the associated DEGs harbored TE insertions that were also modified by methylcytosine. The above evidence suggest that flower color chimerism in P. mume is induced by the DNA methylation of critical genes and TEs.

1. Introduction

Prunus mume Sieb. et Zucc. (2n = 2x = 16), a well-known ornamental tree, is widely grown for its fruits and its abundant, colorful flowers with their unique fragrance [1]. Following the domestication of this species more than 3000 years ago in China, the cultivation of P. mume has spread widely to other countries in East Asia. Its petal color, which ranges from white to pale yellow, pink, red, and reddish-purple, determines the desirability and economic value of individual plants and is one of the central ornamental features attracting viewers and admirers. In the 1940s, varieties with a novel characteristic, flower color chimerism, were discovered and have since served as important materials for landscaping applications and genetic improvement [2]. Drawing on our breeding experience with these varieties, we recognize five types of flowers according to petal color patterns and arrangements on individual trees: (i) bicolored flowers, which are mostly white with some red-spotted or streaked petals; (ii) pure white flowers and (iii) pure red flowers, which are both found together in the same cluster; (iv) white flowers from branches bearing white flowers only; and (v) red flowers from branches bearing red flowers only. Although graft-propagated branches bearing chimeric flowers (i, ii, and iii) produce chimeric individuals, branches with only single-color flowers (iv and v) generate single-color clones. However, at present, little information is available on the genetic mechanisms of P. mume floral chimerism.
At the cytological level, the formation of plant chimeras is believed to be linked to genetic changes in primordial cells located in the apical meristem that then proliferate mechanically [3]. The resulting somatic cell lines contain pigments, including flavonoid, carotenoid, and betalain secondary metabolites, that can be directly visualized [4,5,6,7]. At the molecular level, chimeric variation was initially explained by the action of transposable elements (TEs, or transposons), or, more specifically, the Activator/Dissociation (Ac/Ds) system that regulates the mixture of purple and yellow pigments in maize kernels by activating or repressing a C group gene [8]. Much later, the insertions of TEs Tpn1, Tpn2, and Tpn3 into structural genes dihydroflavonolreductase-B (DFR-B), chalcone isomerase (CHI), and chalcone synthase-D (CHS-D), respectively, were revealed to be the critical factors giving rise to the corresponding variegated color mutants flecked, specked, and r-1 [9,10,11]. The integration of Tpn4, an En/Spm-related transposon, into the purple-mutable (pr-m) gene encoding a vacuolar Na+/H+ exchanger was found to be responsible for a mutation giving rise to purple flowers with blue sectors [12,13]. A similar functional mechanism has been linked to tobacco flower color [14]. Other examples include Gret1 activation regulating the expression of VvmybA1 to produce colorless grape skin [15]; Tam1 transposon insertion in Glycine max [16]; and the insertion of either Ty1dic1 or Retdic1 in AA5GT, whose disruption prevents glycosylation at the 5 position of anthocyanins in Dianthus caryophyllus [17].
Other studies have uncovered evidence supporting a relationship between chimeric petals and the expression of structural/biosynthetic genes encoding enzymes and other regulatory factors involved in floral pigment biosynthesis and metabolism. For instance, CHS, cinnamate-4-hydroxylase (C4H), flavanone 3-hydroxylase (F3H), DFR, anthocyanidin synthase (ANS), and UDP-glucose: flavonoid 3-O-glucosyltransferase (UFGT) genes have been found to exhibit differential expression patterns between red and white flower petal tissues of individual higher plants [7,18,19,20,21]. The alternative splicing of ANS results in red flower petals [22], while the sequence-specific silencing of CHS generates white sectors in Petunia hybrida “Red Star” flowers [23]. Flower color variegation was also observed when the regulator involved in anthocyanin transport (Riant) gene, encoding a GST protein, was expressed while harboring an insertion–deletion polymorphism in exon 3 [24], and a TT2-like R2R3 MYB has been shown to regulate anthocyanin biosynthesis in flowering P. persica “Genpei” [25]. At the same time, epigenetic modification, such as the use of hypomethylated promoters of A1, DFR-B, and OgCHS genes driving the brick-red pelargonidin pigmentation of flower tissue [11,26,27], has been introduced to reveal genetic variation in variegated flowers.
With reference to the previous example, DNA methylation indeed appears to be one of the best-studied epigenetic modifications regulating eukaryotic growth and development [28,29,30,31,32] that also leads to morphological abnormalities in plants [33,34]. For instance, the extensive methylation and transcriptional silencing of a Lcyc gene leads to a fundamental change in floral symmetry, from bilateral to radial flowers [35], while methylated genes encoding MYB transcription factors are inversely associated with red and green-skinned fruits of apple and pear cultivars [36,37,38]. Importantly, DNA methylation modification is related to the silencing or reactivation of TEs that generally remain inactive [39,40,41,42]. However, little research has focused on the relationship between methylated TEs and chimeric traits.
In this study, we first assumed that the flower color chimerism of P. mume is associated with DNA methylation modification of structural genes or regulators, as well as methylated TEs, through the color regulation pathway. We performed transcriptome sequencing (RNA-seq) and advanced single base resolution methylome detection, which is a technique that has been used to elucidate fruit ripening in tomato [43], dynamic changes during seed development in soybean [44], photoperiodic sensitivity in cotton [45], and drought stress in cotton, apple, and rice [46,47,48], to examine three issues: (i) the methylome landscape of P. mume; (ii) differentially methylated region (DMR)-related genes contributing to pigment variation; and (iii) the question of whether TEs with DNA methylation modification contribute to bicolored flower formation.

2. Results

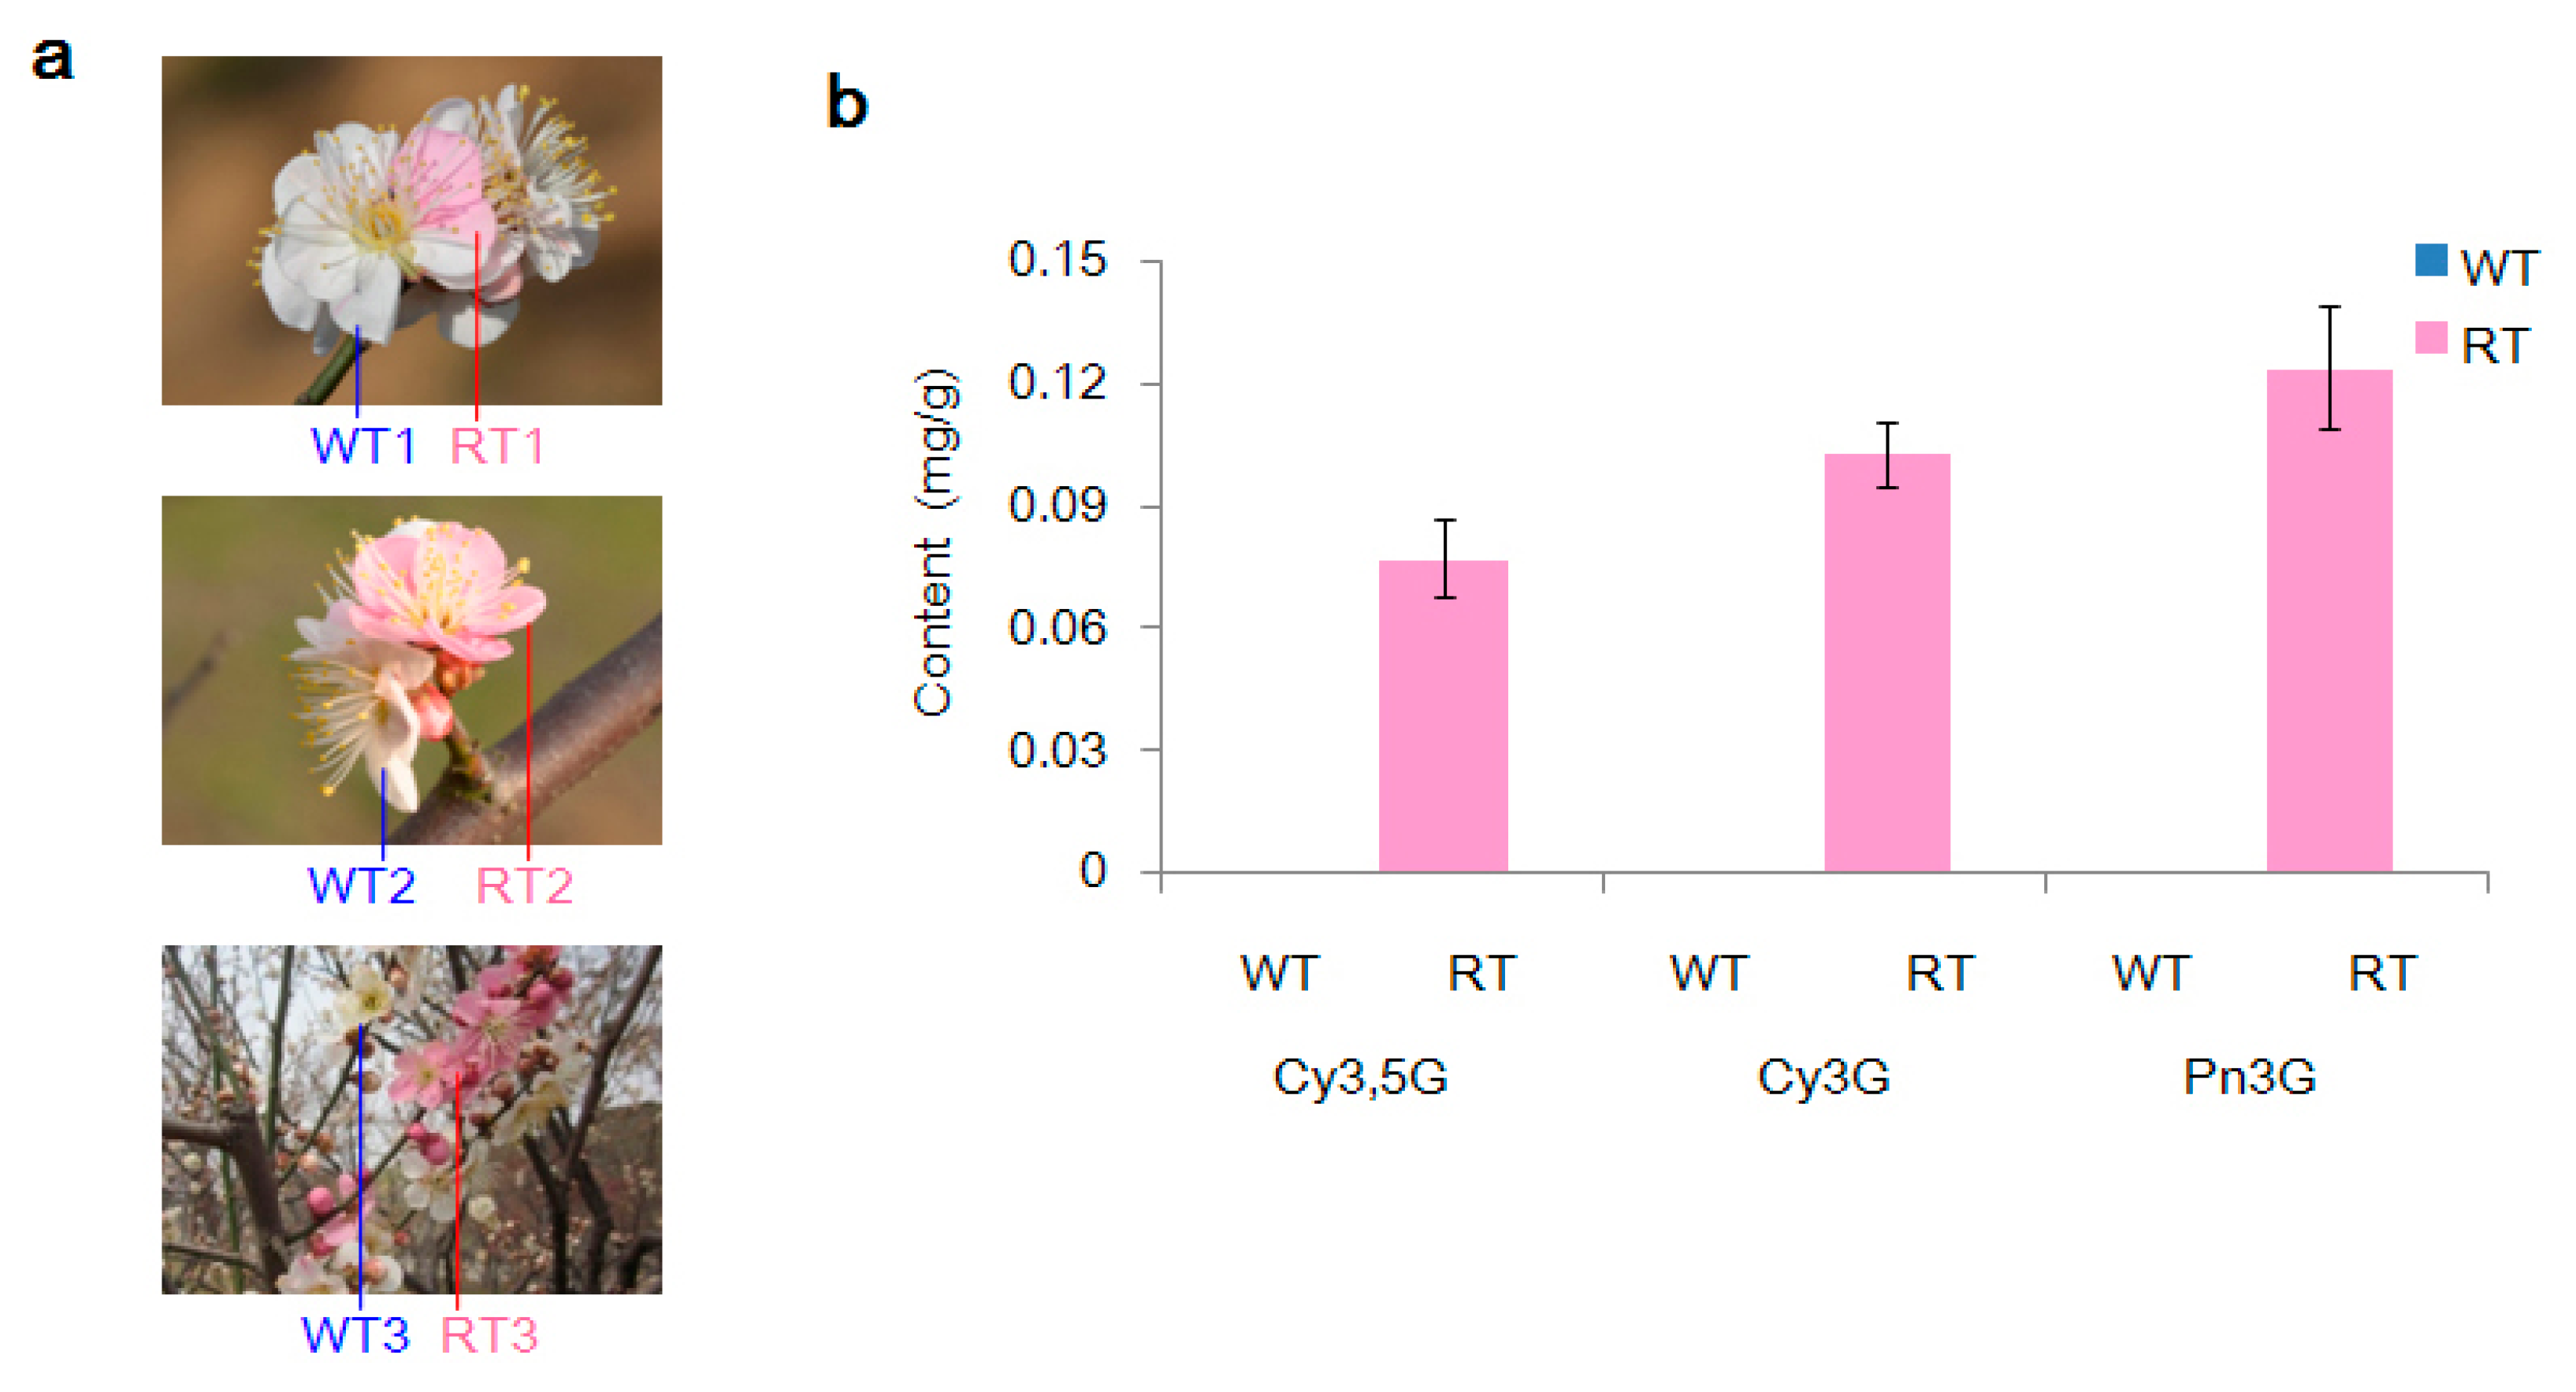
2.1. Variation in Pigmentation in White (WT) and Red (RT) Petal Tissues

Three types of anthocyanins, namely, cyanidin 3,5-O-diglucoside (Cy3,5G; 0.077 mg/g fresh weight), cyanidin 3-O-glucoside (Cy3G; 0.103 mg/g fresh weight), and peonidin 3-O-glucoside (Pn3G; 0.124 mg/g fresh weight), were detected in red petal tissue (RT) samples by high performance liquid chromatography-electrospray ionization-mass spectrometry (HPLC-ESI-MS). In contrast, no compounds similar to these secondary metabolite products were detected at an absorption wavelength of 520 nm in white petal tissue (WT) samples (Figure 1a,b and Figure S1).

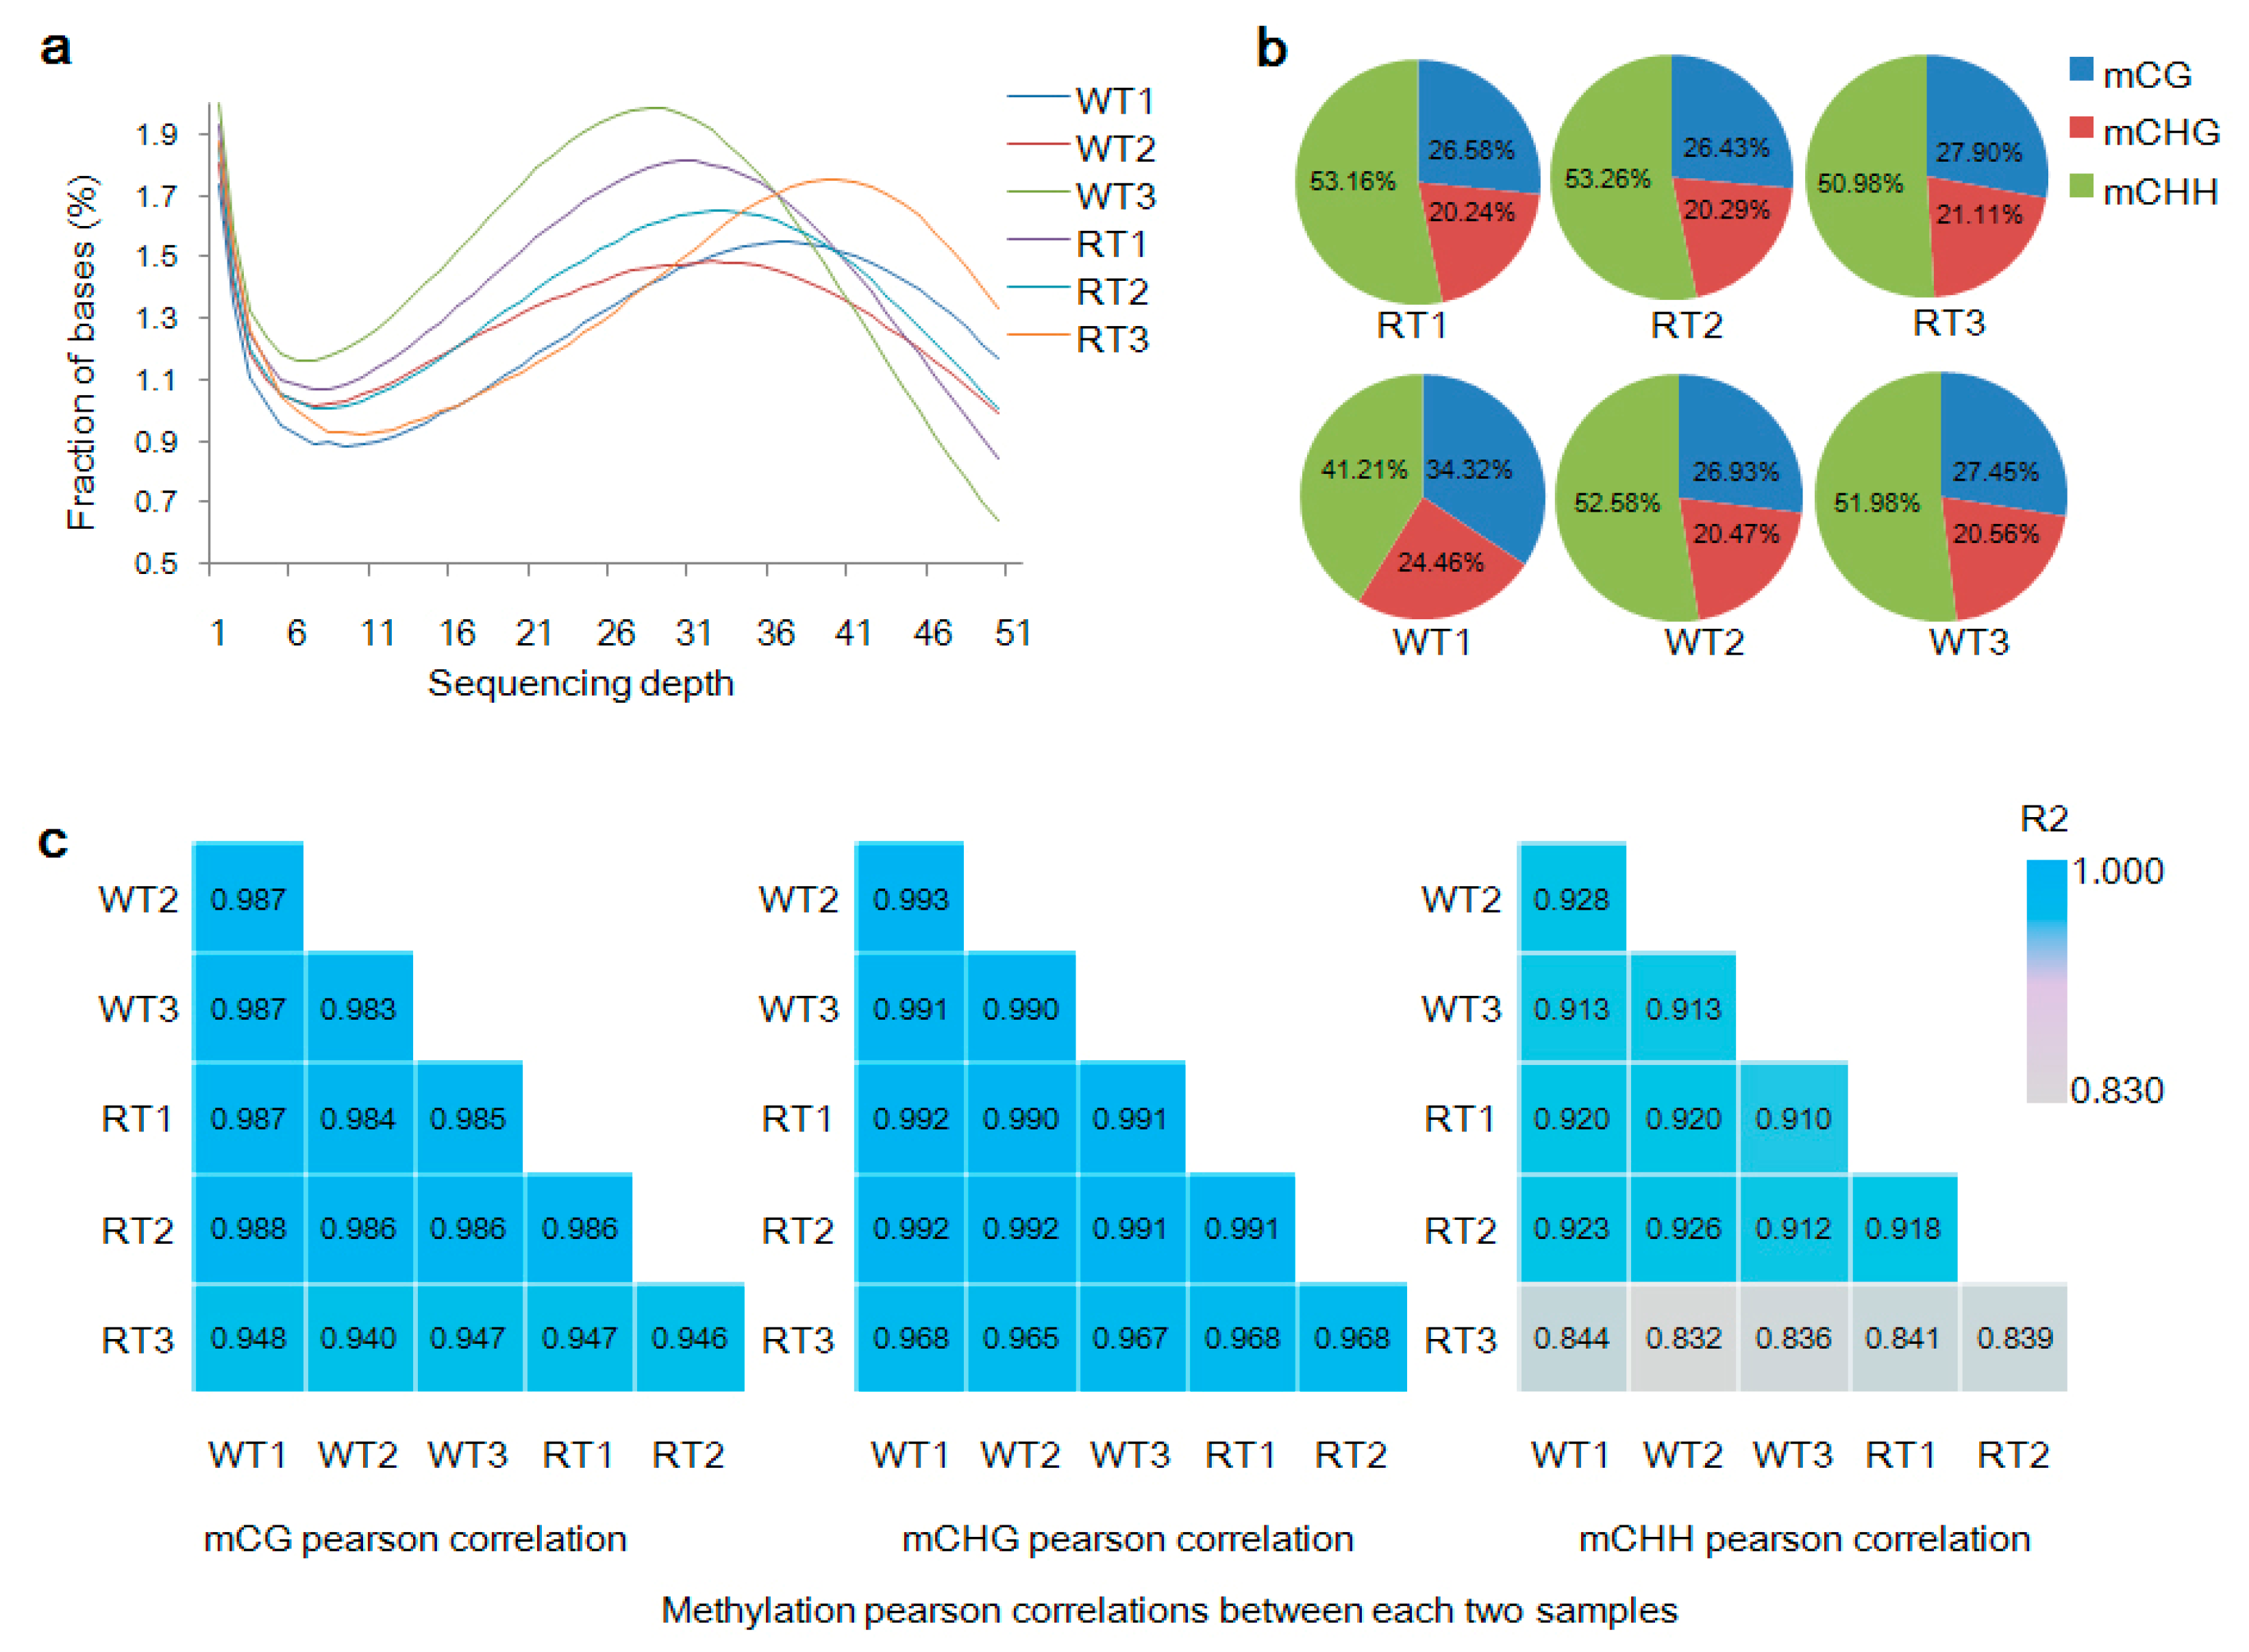
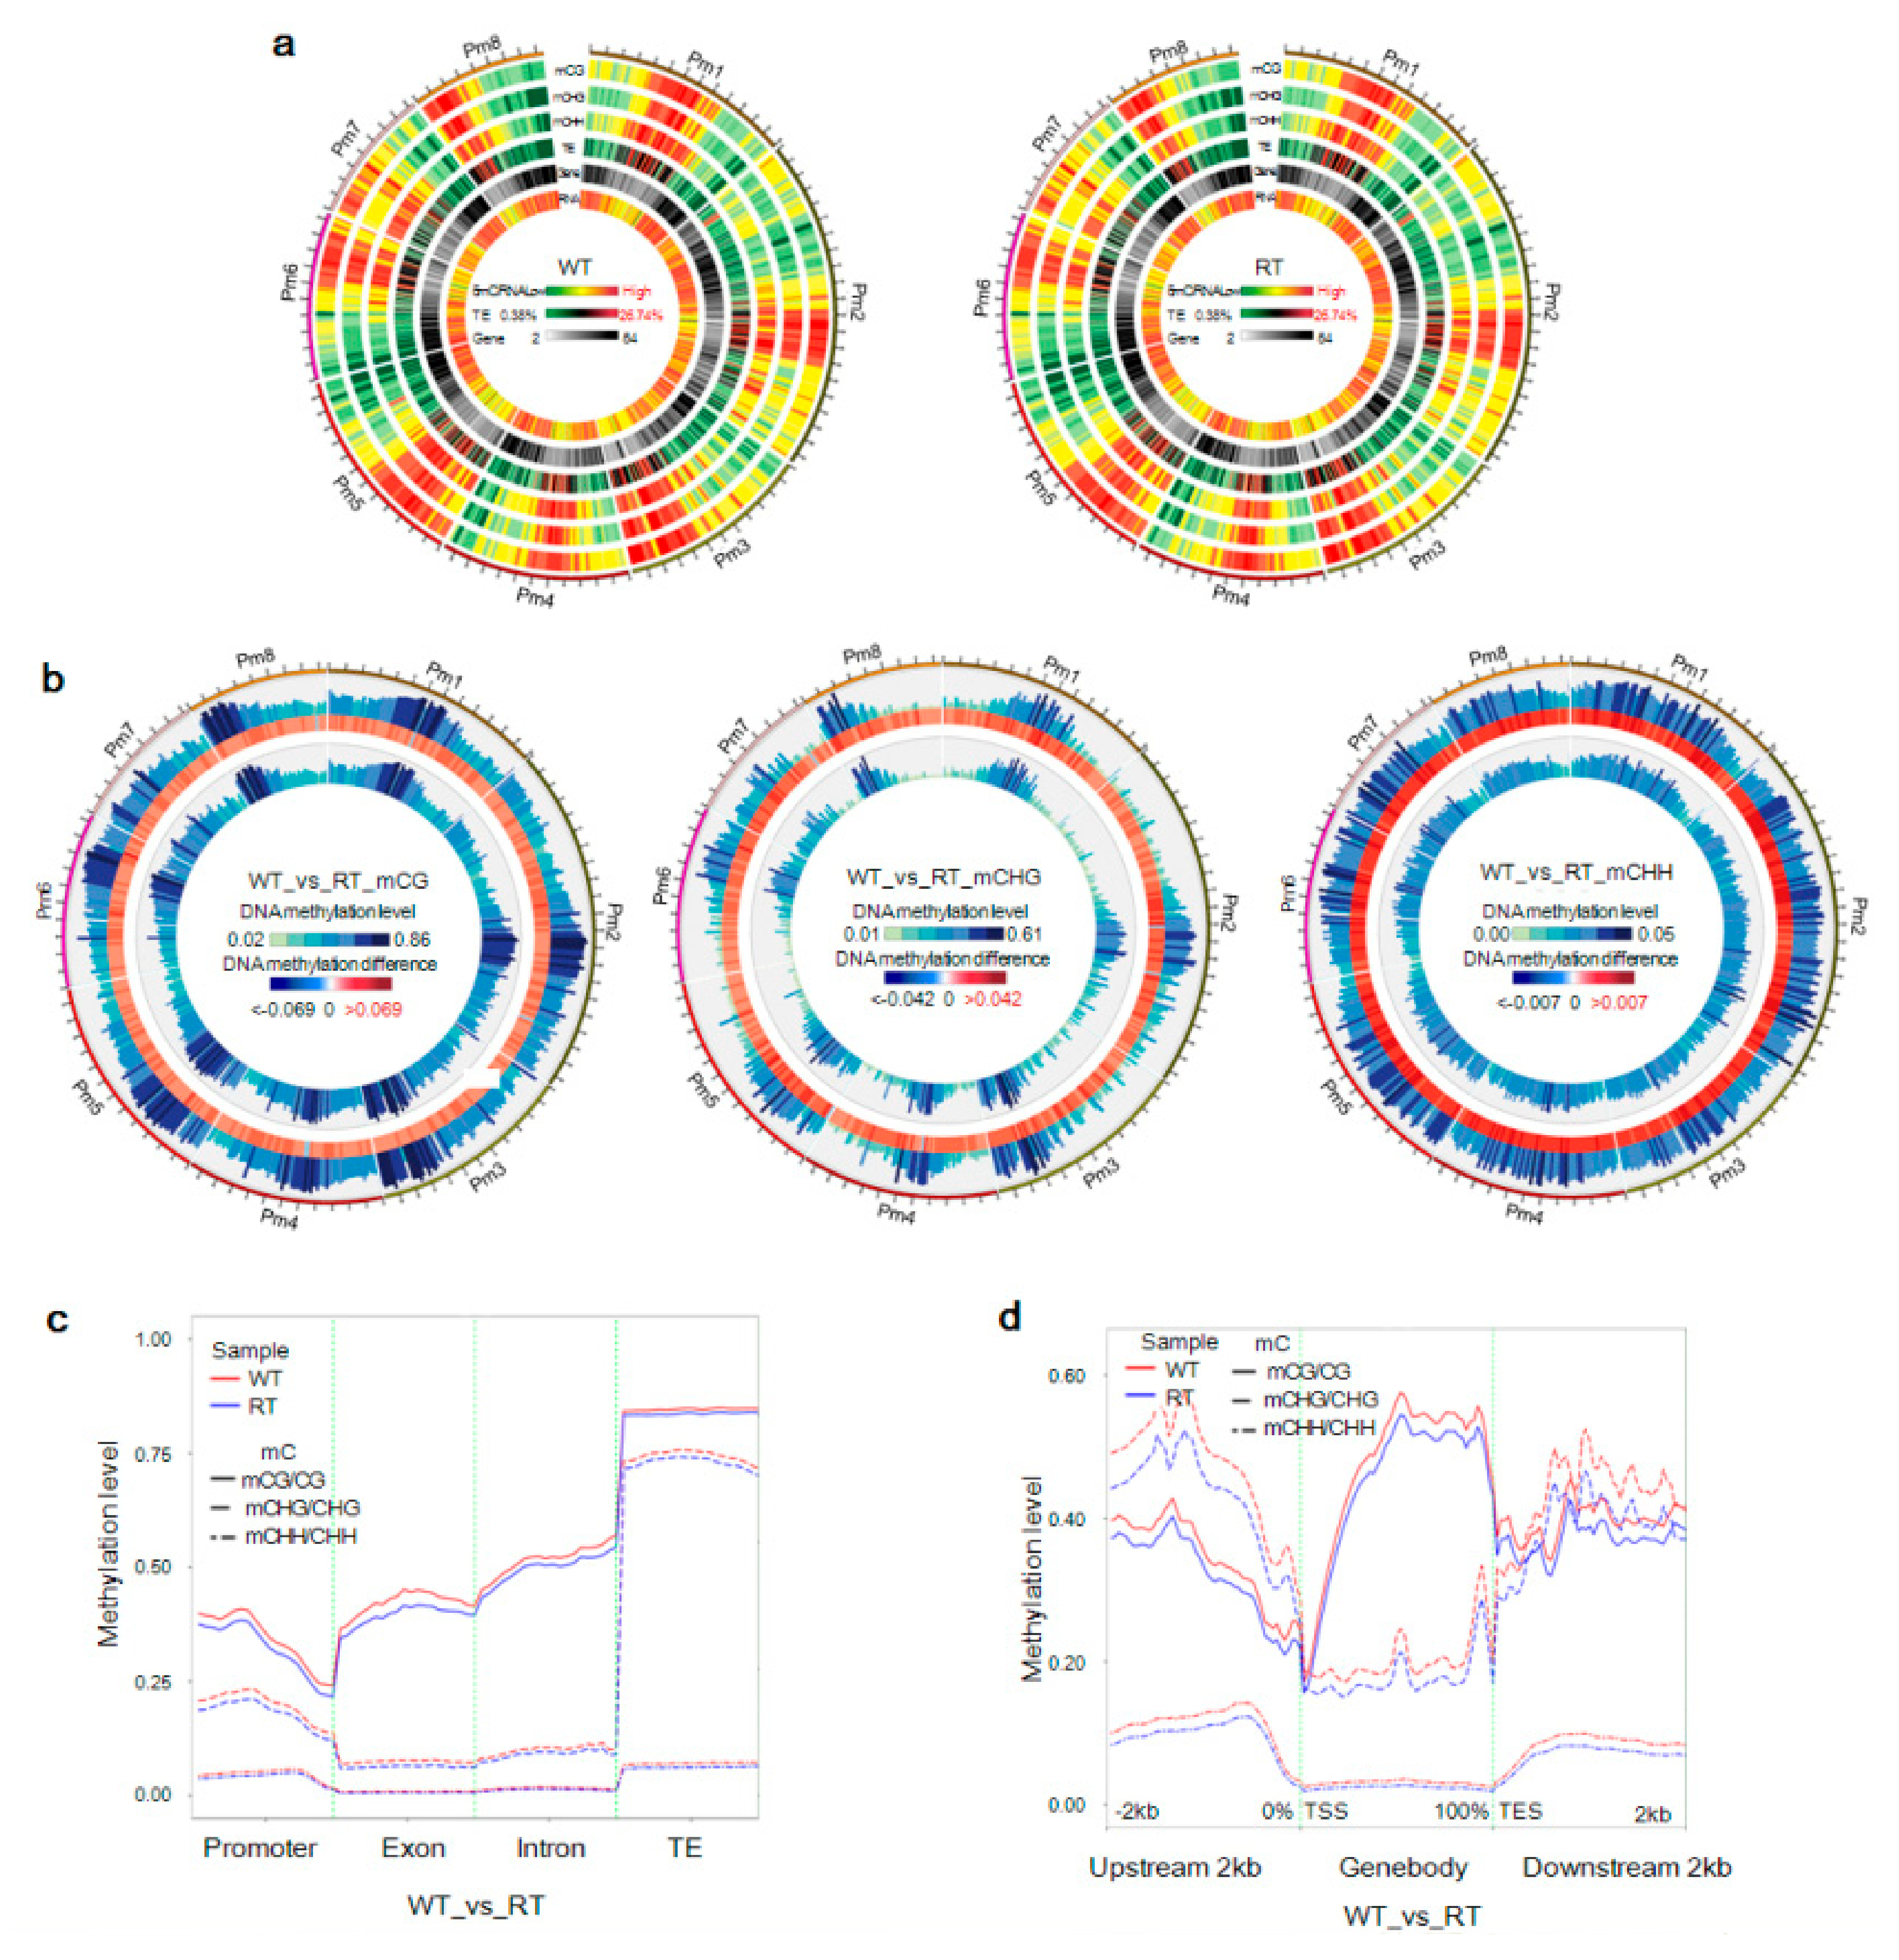
2.2. Genome Methylation Landscape of Prunus mume

We used the BS-seq method, the “gold standard” of DNA methylation detection, to reveal the methylomes of six petal tissue groups from a single ornamental tree. In total, 40.0–50.9 million clean reads were generated, which corresponded to 11.6–14.6 Gb and greater than 41-fold coverage of the genome (estimated size = 280 Mb). To confirm the quality of the sequences, we also calculated QC20 (>97%) and QC30 (>92%) values, the bisulfite conversion rate (>99%), and GC content (21.37–21.54%). Approximately 59% of clean reads could be mapped to the reference genome, with a duplication rate of approximately 11.13–19.09% (Table S1). As revealed by sequencing coverage statistics, the maximum coverage was obtained at a sequencing depth of approximately 30× to 40× of the reference genome (Figure 2a), with each chromosome sequenced at a depth of around 24× to 34.2× (Figure S2). The coverage of cytosine sites, 8.8–10.95% of which were methylated, was reliably about 10.5× to 13.8×, with differing levels of mCG, mCHG, and mCHH sites (Figure S3, Table S2).
To assess the influence of non-methylated cytosine on BS-seq library construction and control for methylcytosine sequencing preference [49], methylated loci mapped to unique sites in the reference genome were detected after M-bias assessment (Figure S4). The percentage of methylated cytosine to total cytosine, mC/C, was 13.72%, and the ratios of mCG/CG, mCHG/CHG and mCHH/CHH sites were 38.04%, 20.42% and 9.21%, respectively (Table 1). The relative proportion of mCG, mCHG, and mCHH sites throughout the genome was 28.28% (26.43–34.32%), 21.19% (20.24–24.46%), and 50.53% (41.42–53.26%), respectively (Figure 2b). Meanwhile, there existed a tendency toward mCG and mCHG sites with highly methylation levels; 70–100% were methylated with a large proportion. However, the mCHH context showed the opposite trend with a low methylation level; 0–30% were methylated with a large proportion (Figure S5). An examination of logo plots exploring methylation preferences at sites and nearby regions revealed no significant variations in mC preference (Figure S6). Chromosome 3 had the highest number of methylated sites of any chromosome (Figure S7).
Methylation levels of CG, CHG, and CHH sites were highly correlated (R2 > 0.83) among different samples of the same petal color (Figure 2c), thus demonstrating that RT1–RT3 and WT1–WT3 could be analyzed as replicates of red petal tissue (RT) and WT samples, respectively. mCG, mCHG, and mCHH sites on chromosomes had similar distribution trends, with the most highly methylated regions in WT and RT corresponding to low-density genes (Figure 3a).

2.3. Levels of mC Variation in Different Colored Petal Tissues

The status and level of DNA methylation can vary between different individuals, tissues, and even genomic regions. We therefore explored variation in methylation between WT and RT samples in chromosomes as well as genomic regions. As shown in Figure 3b, the majority of strongly and weakly methylated regions occurred at similar chromosomal positions between the two samples. Calculated mCG/CG, mCHG/CHG, and mCHH/CHH ratios in the RT sample were 2.3–85%, 1.7–59%, and 0.4–4.3%, respectively. Many mC loci in RT were different from those in WT, where the mCG/CG, mCHG/CHG, and mCHH/CHH ratios were 2.8–83%, 1.7–61%, and 0.6–5%, respectively.
Although methylation levels in different genomic functional domains were higher in WT than in RT, they followed similar trends, with the highest and lowest methylation context ratios corresponding to mCG/CG and mCHH/CHH, respectively (Figure 3c). In the context of CG, methylation levels in exon and intron regions were higher than in promoter regions, but lower than in TE regions. For CHG and CHH, mCHG/CHG and mCHH/CHH ratios were lower in exon and intron regions than in promoter and transcriptional end site (TES) regions, although the difference in the mCHH/CHH ratio across various regions was not very pronounced. The highest methylation levels within gene bodies were at CG sites, whereas methylation levels in the ~2-kb upstream and downstream regions were highest at the CHG sites (Figure 3d). The lowest methylation levels, including at CG and CHG sites, were observed within regions adjacent to transcriptional start sites (TSSs) and TESs.

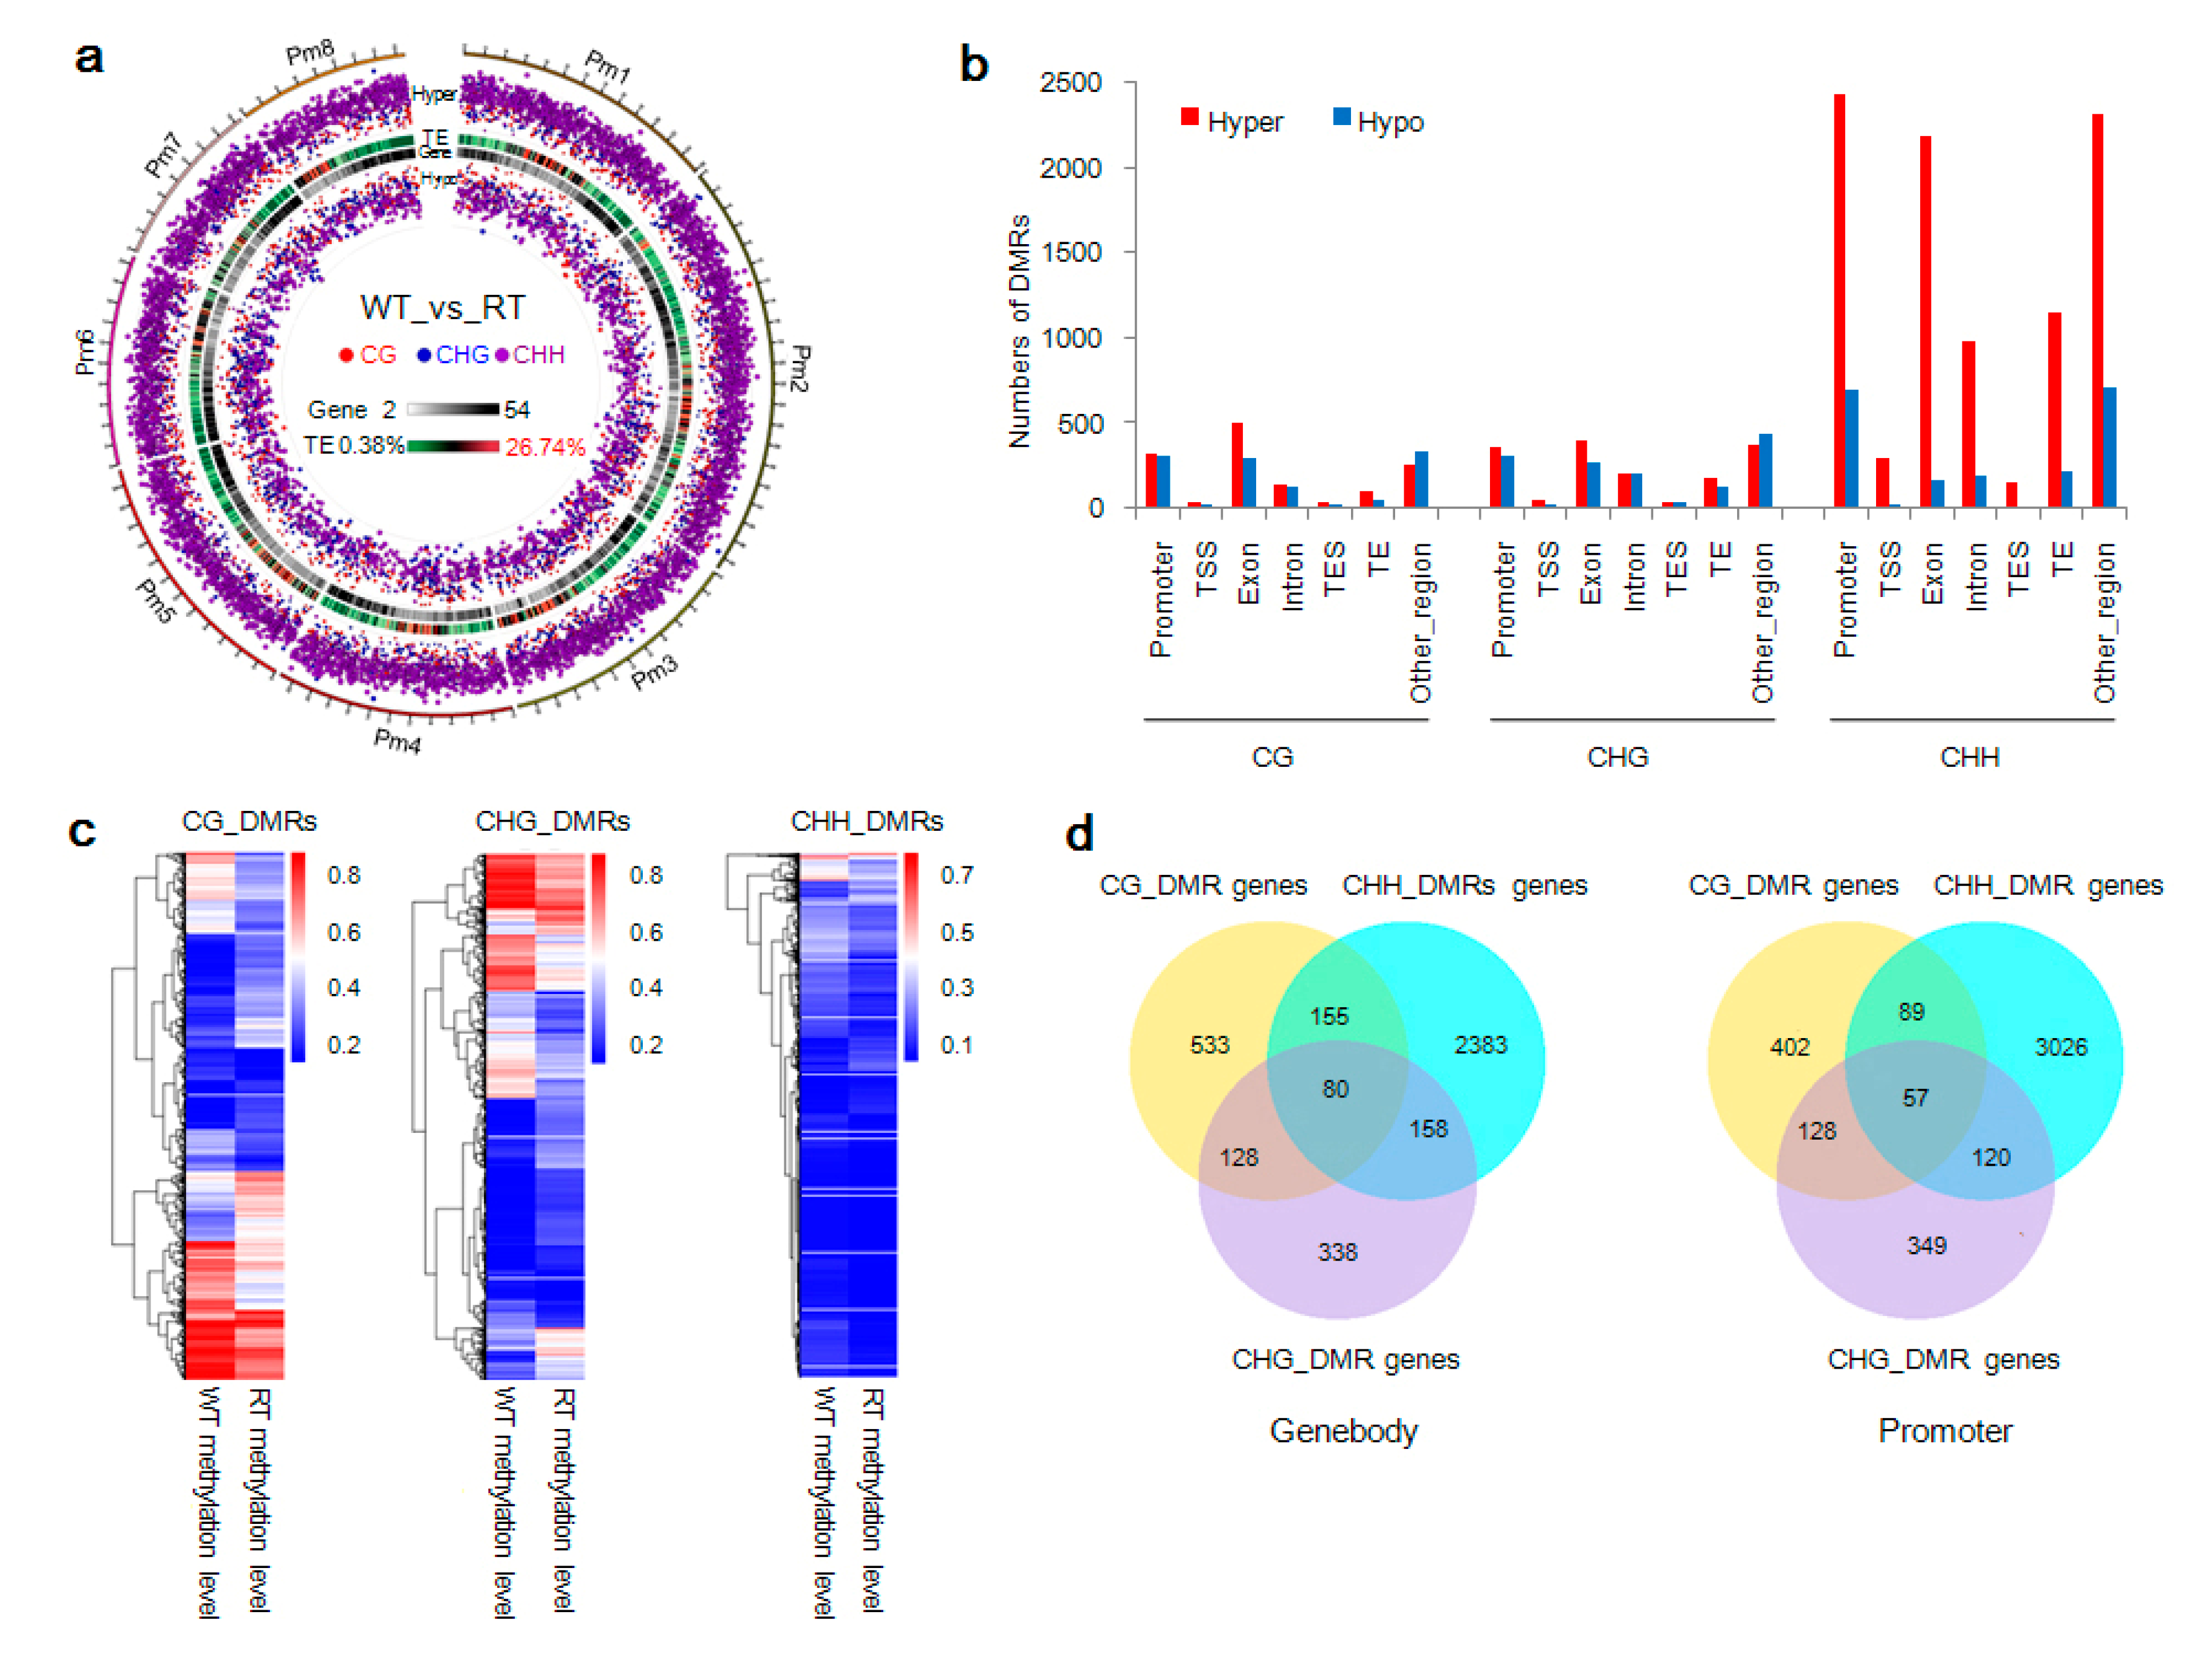
2.4. DMR-Related Genes and Bicolored Flowers on Individual Trees

DMRs can be used to identify methylation differences between individuals or developmental stages and their involvement in gene transcriptional regulation [50,51]. In the present study, 13,468 DMRs—10,121 hypermethylated and 3347 hypomethylated—were predicted between WT and RT types using DSS software. These DMRs, whose lengths were normally distributed (Figure S8a), were methylated at levels of approximately 38.5% (CG), 31.5% (CHG), and 8.4% (CHH) (Figure S8b). DMR chromosomal distributions and levels of significance are displayed in Figure 4a and Figure S8c. In each gene functional region (except for other regions in CG and CHG contexts), the number of DMRs between WT and RT exhibiting hypermethylation was higher than those with hypomethylation. In the CHH context, many more hypermethylated DMRs were detected than hypomethylated ones, and the TSS and TES regions contained few DMRs (Figure 4b). Heat maps of methylation levels of CG, CHG, and CHH DMRs revealed that variation was present in the methylation of WT and RT samples (Figure 4c). As shown in Figure 4d, these DMRs were overlapped with 4376 gene bodies and 4622 gene promoters. A total of 80 genes containing mCG, mCHG, and mCHH sites in their transcribed region were detected; similarly, 57 gene promoters were predicted containing all three types of methylated sites.
Following DMR detection, Gene Ontology (GO) and Kyoto Encyclopedia of Genes and Genomes (KEGG) annotations were performed to explore the functions of DMR-related genes. These analyses uncovered the enrichment of 896 CG–DMR-anchored genes (543 hypermethylated and 361 hypomethylated), 704 CHG–DMR-anchored genes (432 hypermethylated and 288 hypomethylated), and 3777 CHH–DMR-anchored genes (2531 hypermethylated and 292 hypomethylated). In addition, 696, 654, and 3292 genes with promoters overlapping with CG, CHG, and CHH DMRs, respectively, were found to be enriched. The identified genes have important molecular functions in various biological processes, especially phenylalanine metabolism and the biosynthesis of phenylpropanoids, carotenoids, flavonoids, and plant hormones. Since these are critical processes in flower color formation, their over-representation among DMR-anchored genes suggests that variation in methylation levels of DMRs affected the color of WT and RT samples (Figures S9–S12).

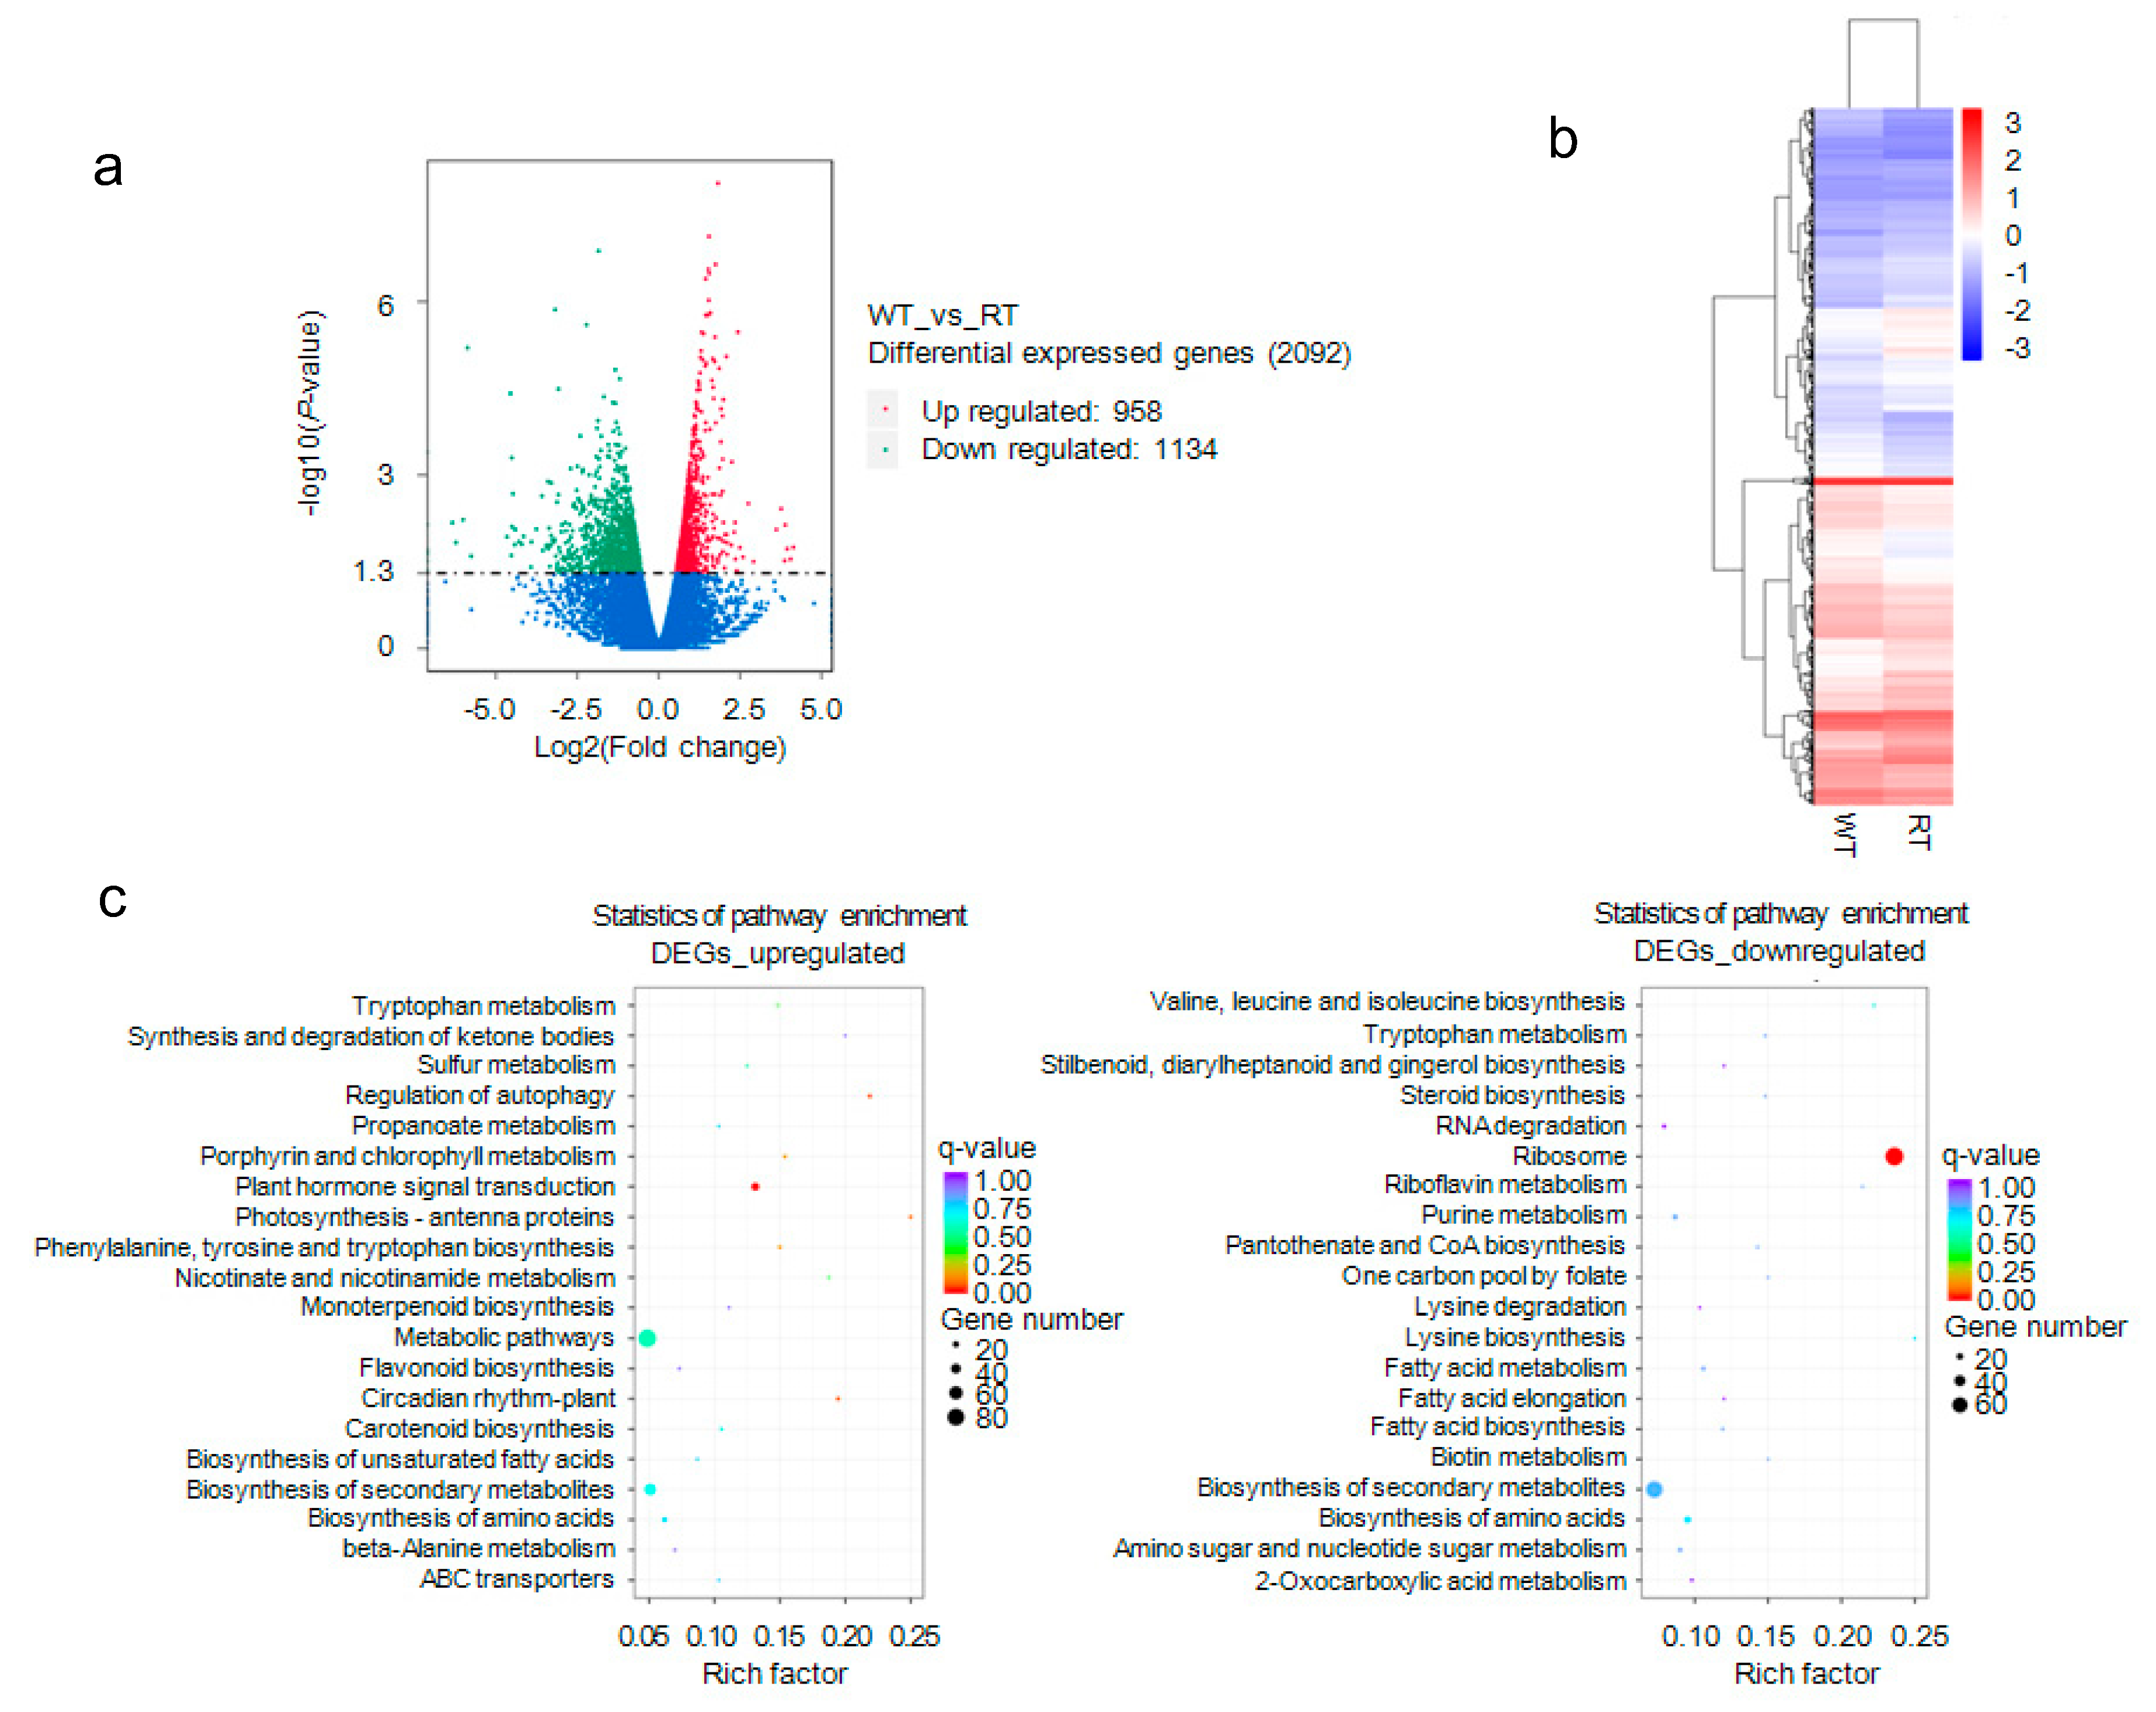
2.5. Analysis of Differential Transcription between WT and RT

To reveal expression differences between WT and RT, we compared the transcriptomes of the six petal tissue samples. RNA-seq generated 44,202,732–55,656,090 clean reads per sample, of which 38,737,776–49,062,666 (88%; 85% unique) were mapped to the reference genome. Approximately half of the unique reads were mapped to the positive-sense strand of chromosomes (Figure S13, Table S3), and 294 transcription factors were detected (Table S4). Gene expression levels were distributed similarly, and significantly positively correlated among the sample genomes (R2 > 0.93) (Figure S14a,b). In the next step, the six samples were divided into two groups—WT (WT1, WT2, and WT3) and RT (RT1, RT2, and RT3)—for further analysis.
In this analysis, 16,383 expressed genes, 221 WT-specific and 765 RT-specific, were detected using a FPKM > 1 threshold (Figure S14c), with FPKM standing for fragments per kilobase of exon per million fragments mapped. Screening with DESeq yielded 958 upregulated and 1134 downregulated differentially expressed genes (DEGs) widely distributed across WT and RT genomes (Figure 5a,b). These DEGs belonged to 55 functional groups, including 36 biological process, 14 cellular components, and five molecular function categories. Many of the enriched genes take part in metabolic processes (Figure S14d). KEGG pathway analysis was used to further explore DEGs associated with anthocyanin biosynthesis and metabolic regulation (Figure 5c). We found that the genes were enriched mainly in pathways controlling plant hormone signal transduction (ko pmum04075), biosynthesis of secondary metabolites (ko pmum01110), metabolism (ko pmum01100), and flavonoid biosynthesis (ko pmum00941). Structural genes, including Pm020453 (YUCCA8), Pm004176 (ANGLT), Pm031359 (UGT79B6), Pm006139 (GSTF1), Pm011195 (GSTXC), Pm012985 (GSTF7), and Pm025127 (GSTX6), were downregulated, but other critical genes, such as Pm013782 (DFRA), Pm018402 (DFRA), Pm023202 (DFRA), Pm017146 (FLRT), and Pm008680 (UGFGT), were upregulated (Supplementary Data 1). In addition, 189 transcription factor genes, including MYB, bHLH, and WD, were detected using iTAK software (Supplementary Data 2), which suggests that transcription factors take part in the regulation of bicolored flowers.

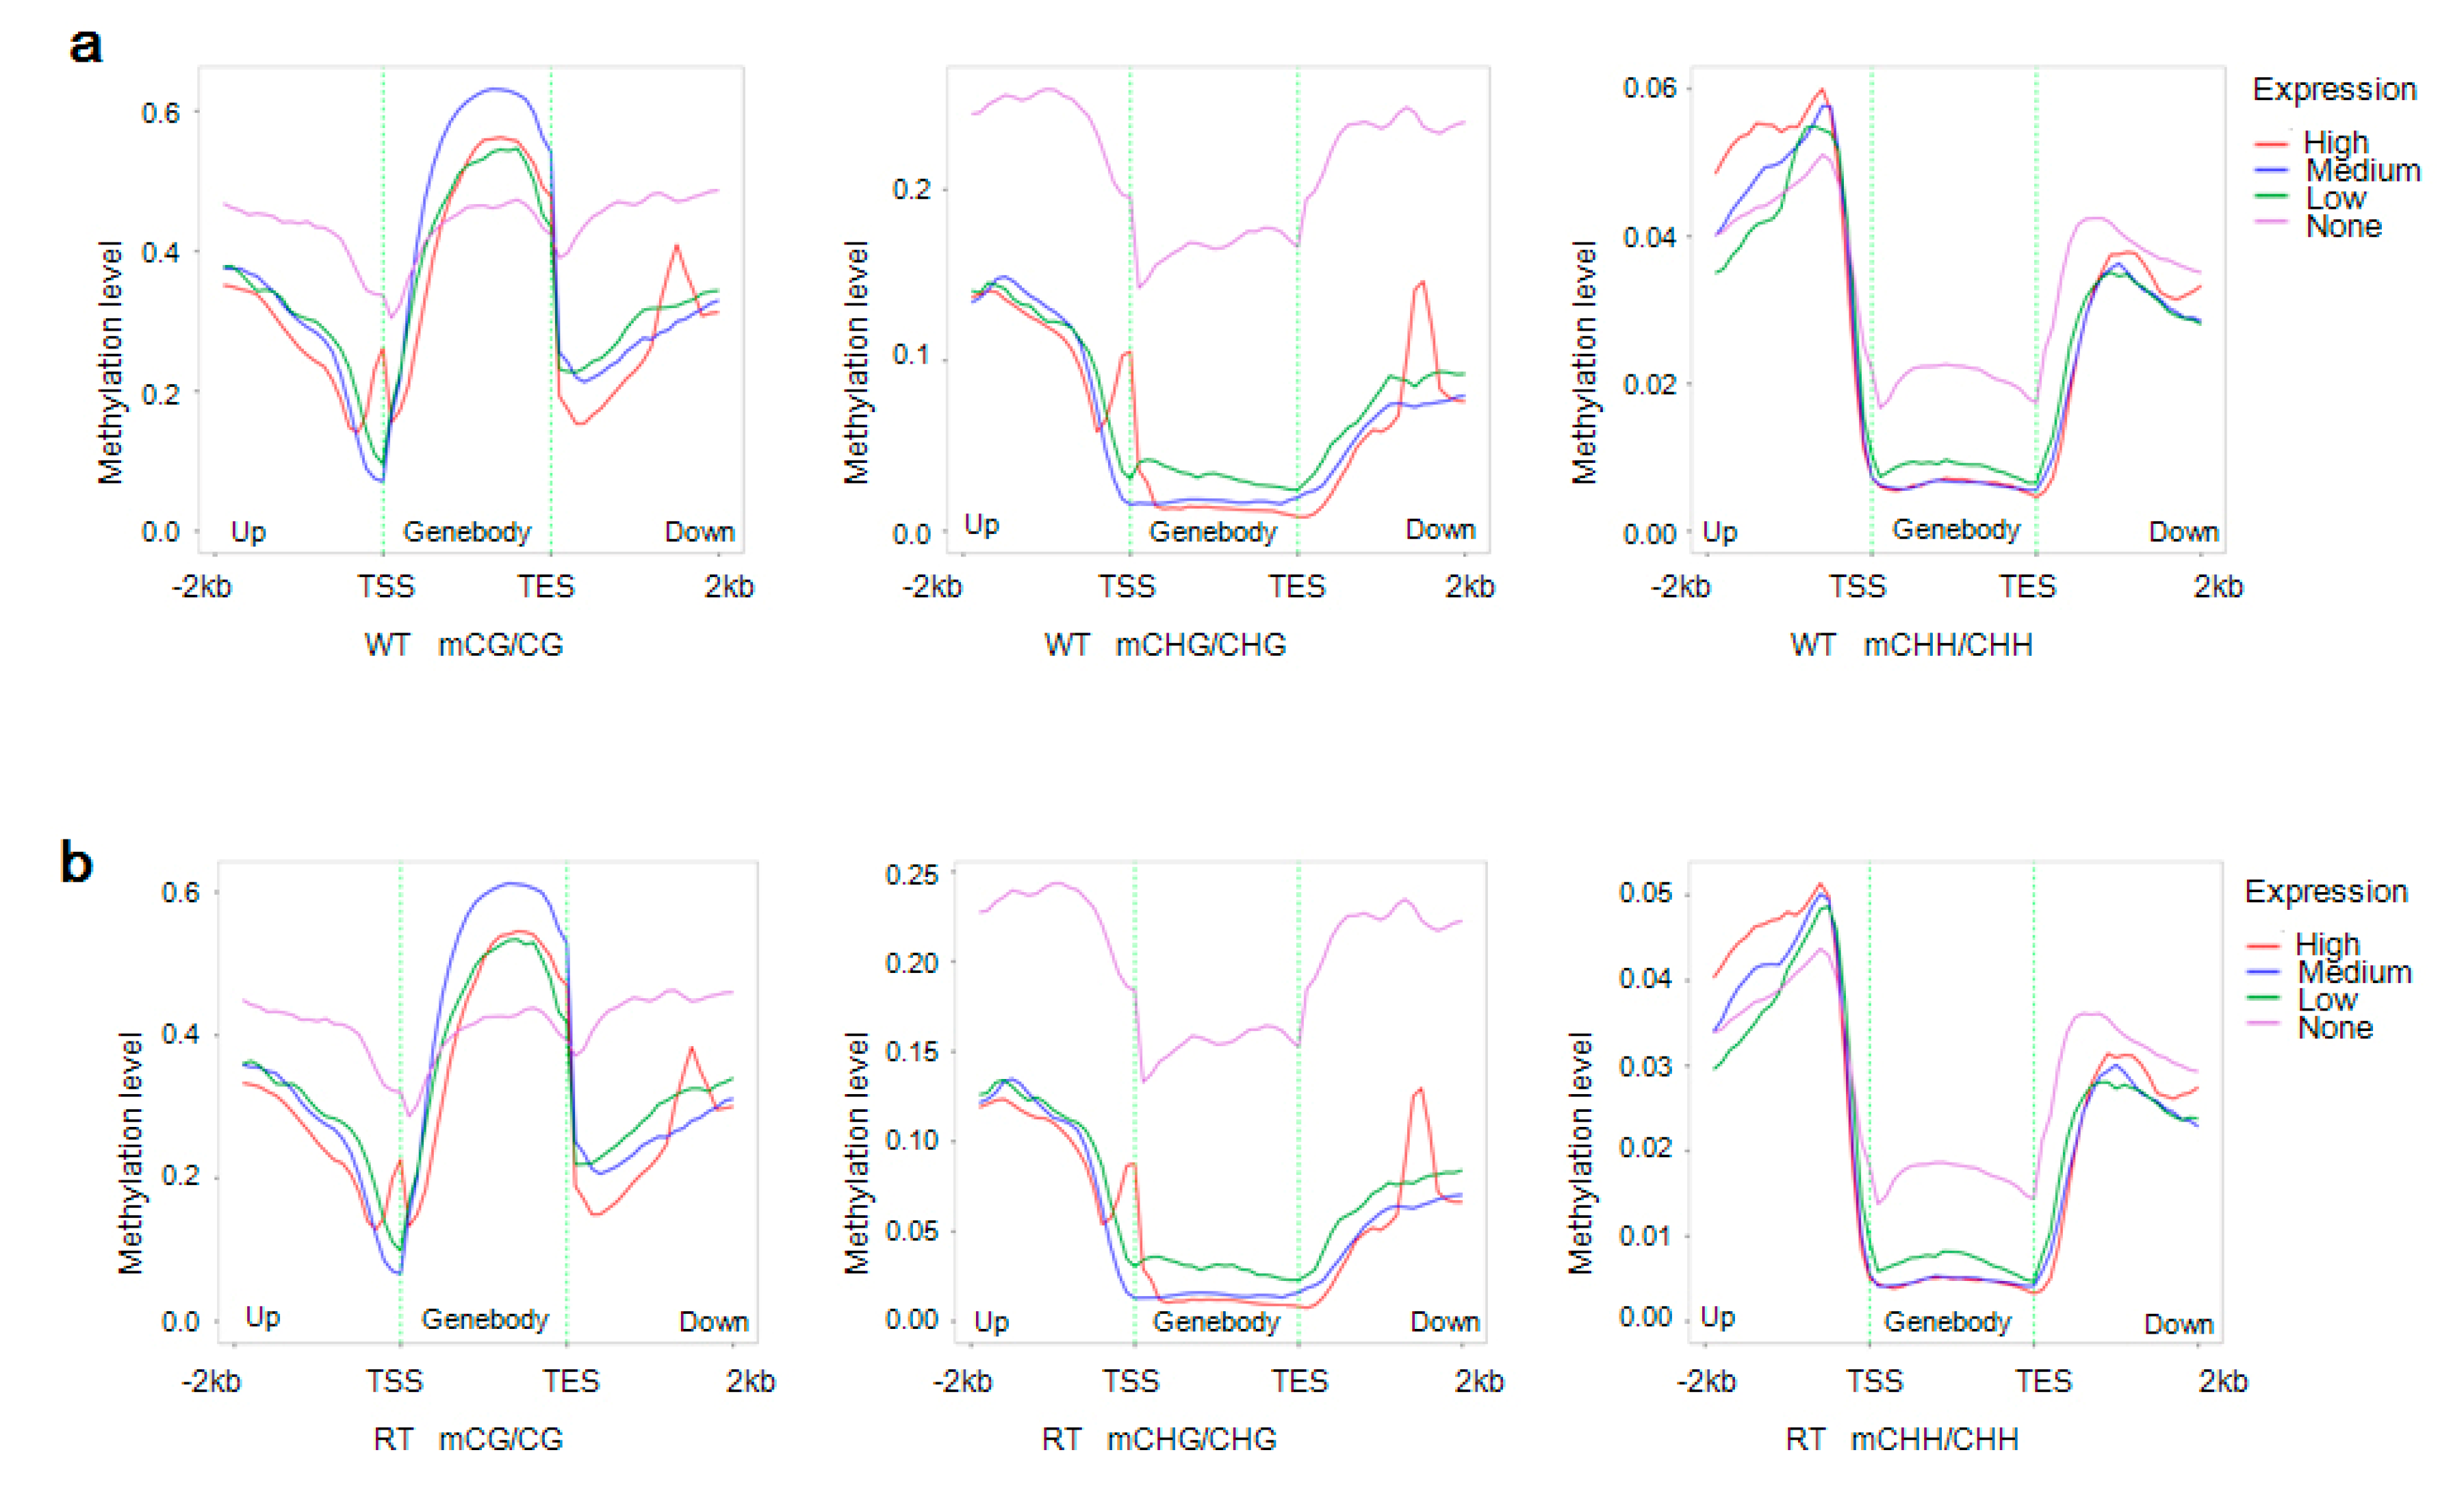
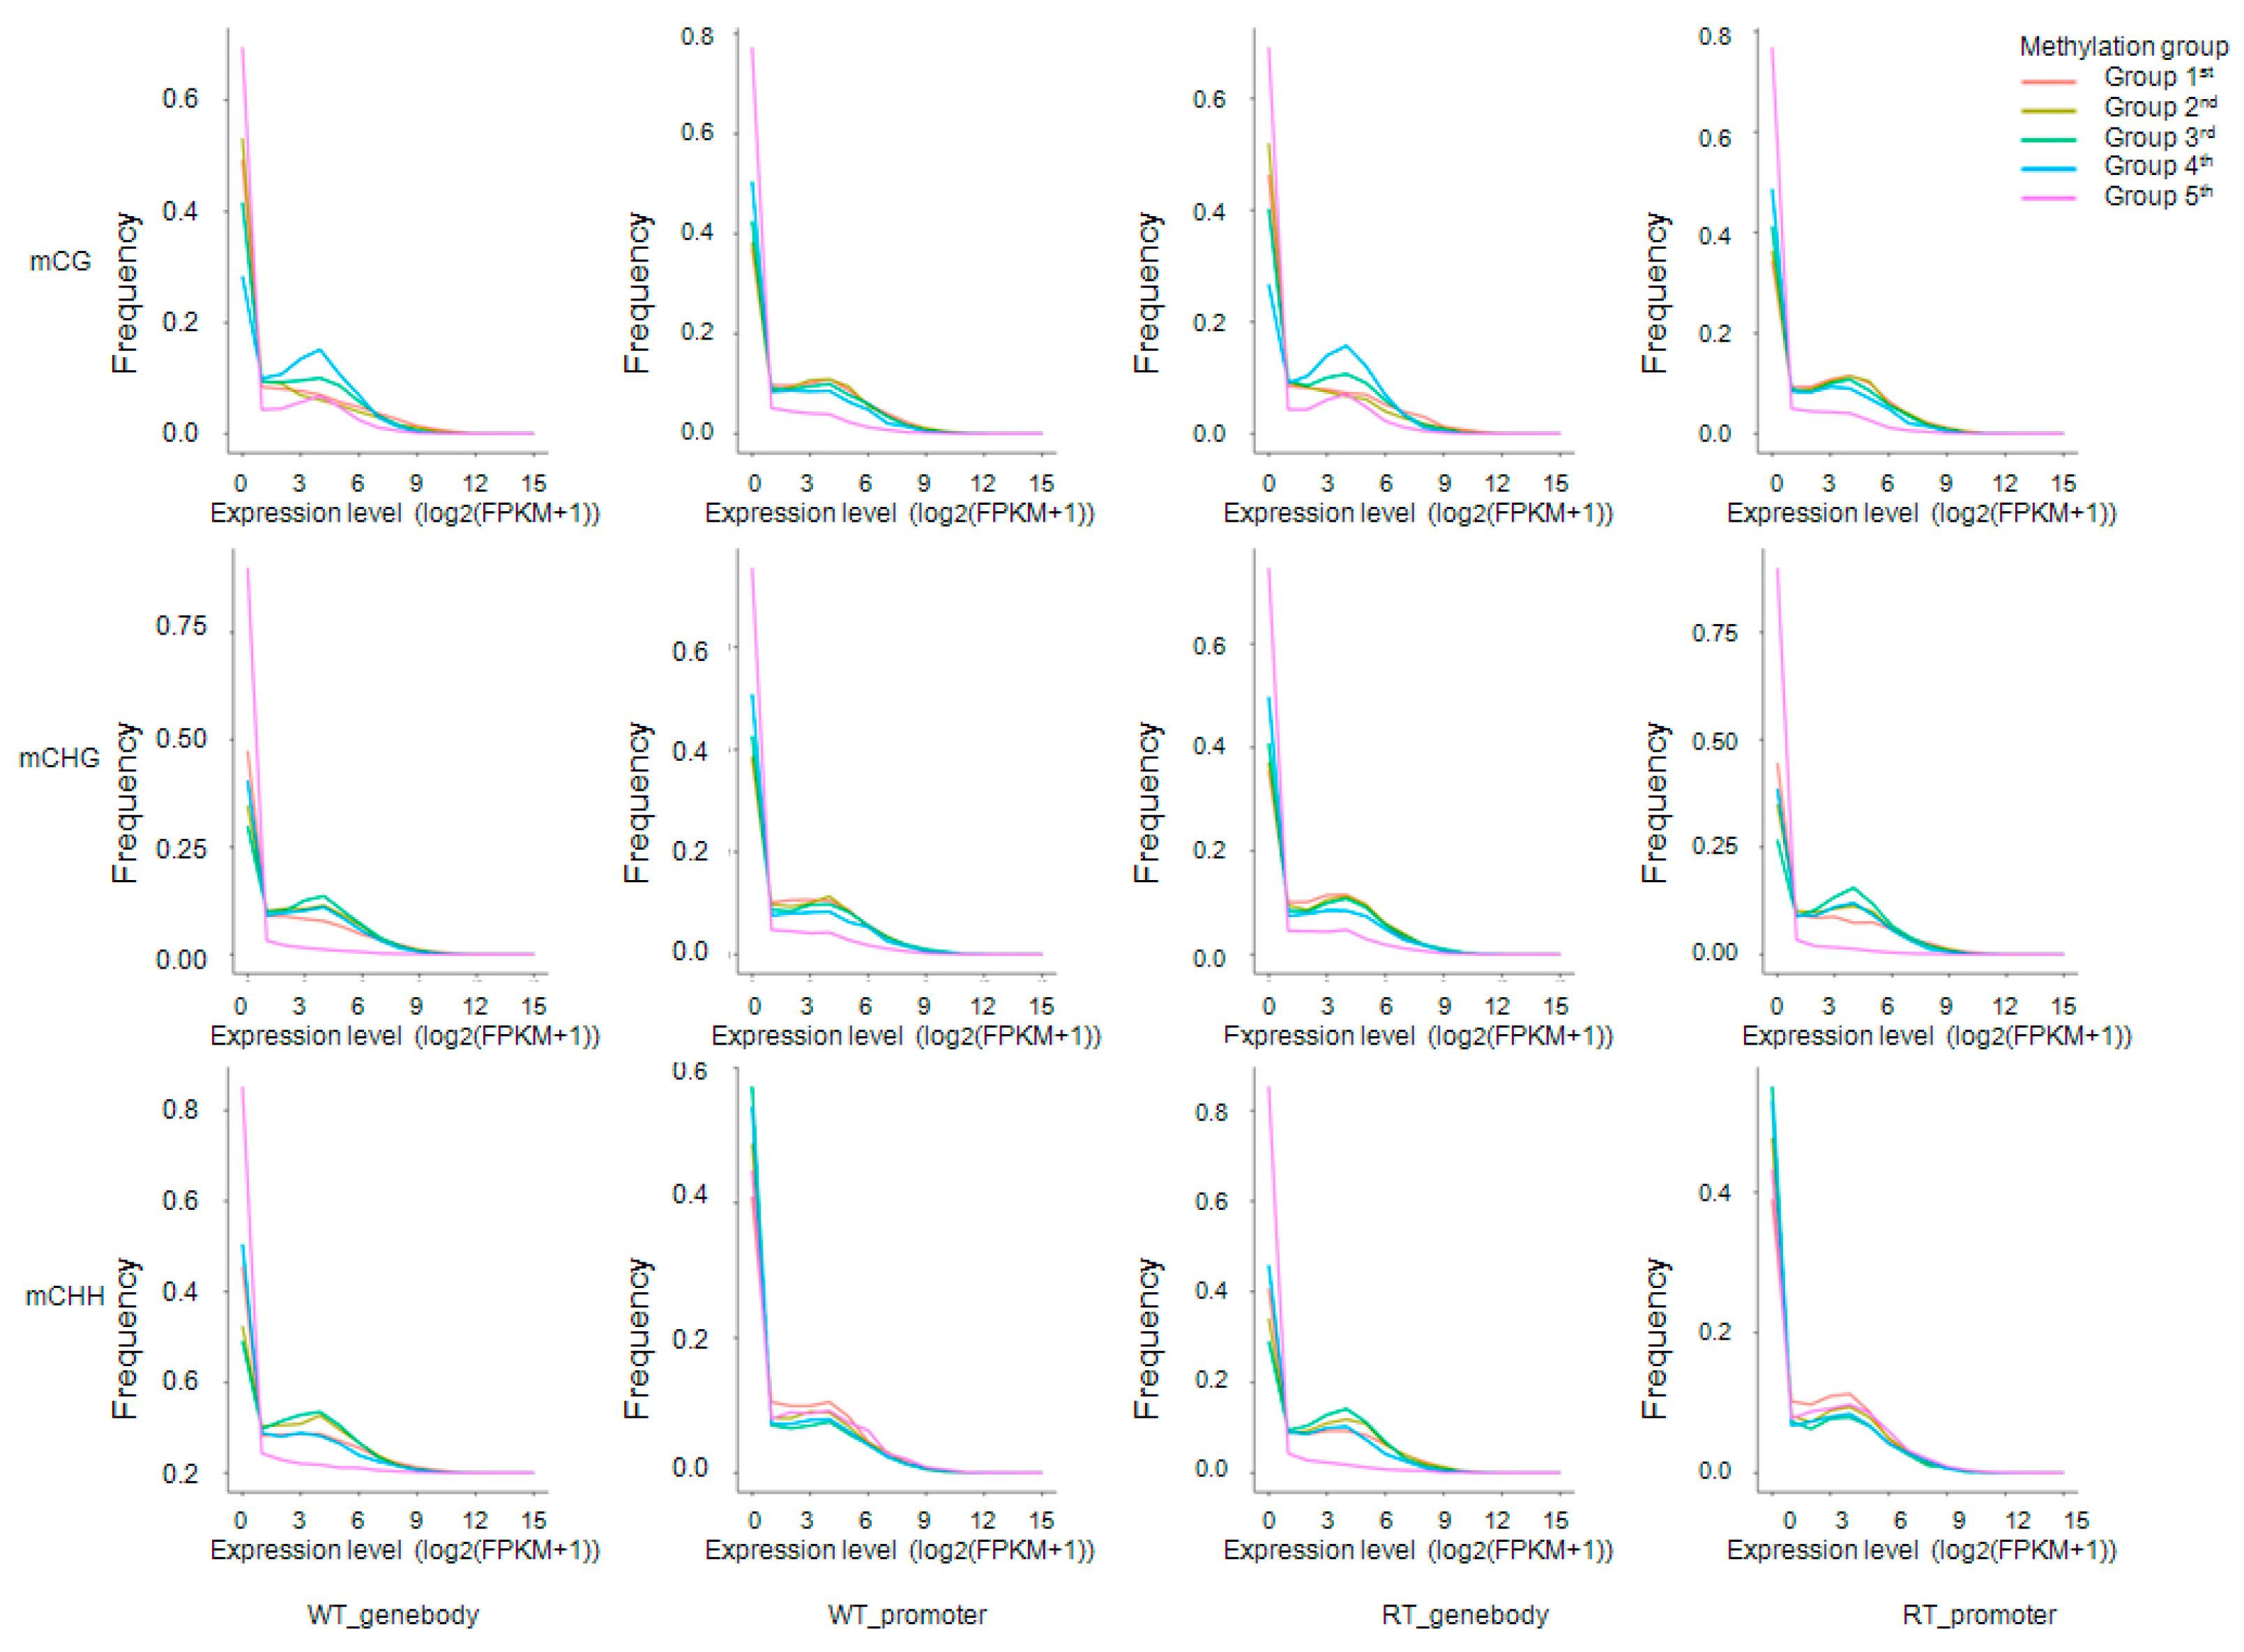
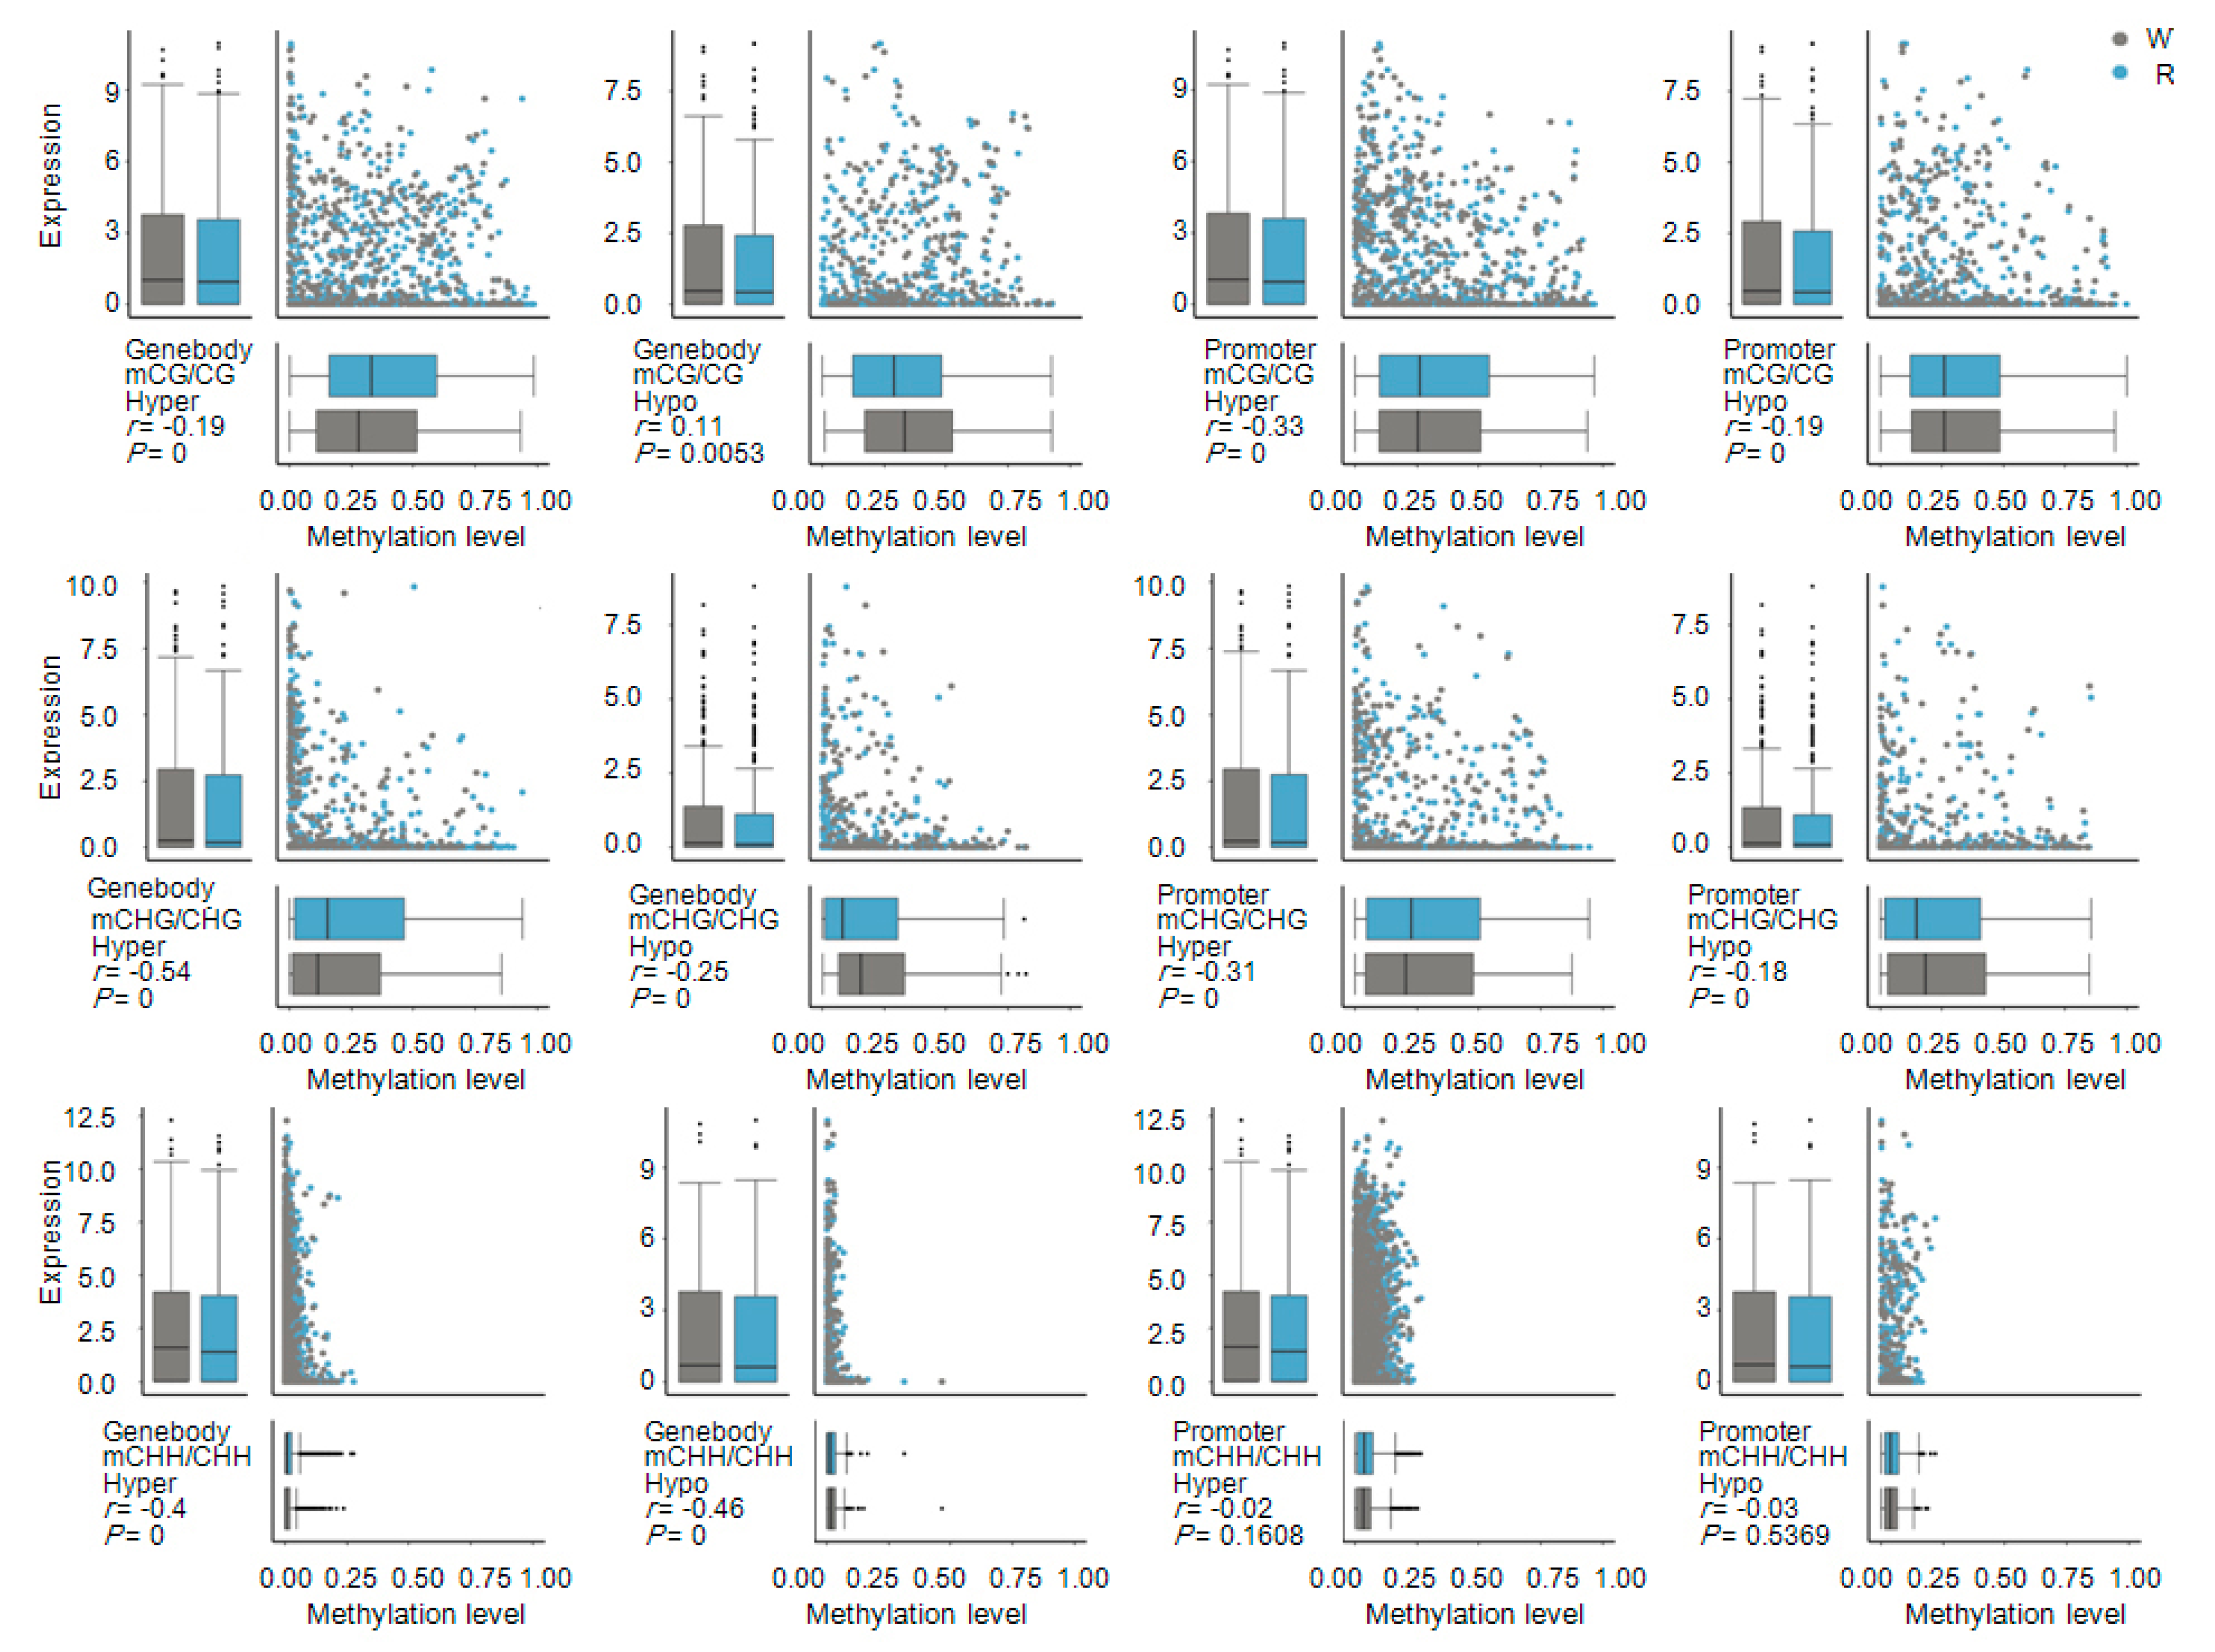
2.6. Correlation between Gene Expression Levels and DNA Methylation

The DNA methylation of genes is correlated with changes in their expressions. To reveal the potential roles of expression level differences in WT versus RT regulated by DNA methylation, we analyzed the distribution of gene methylation and expression levels within each chromosome and gene functional region. As shown in Figure 3a, highly expressed genes were distributed in regions of low methylcytosine density. This negative correlation between gene expression levels and DNA methylation in general was apparent on scatter plots and heat maps (Figure S15).
To analyze the relationship between levels of expression and methylation within gene bodies (including 2-kb upstream and downstream domains), we divided genes into high, medium, low, and no expression groups [high expression (FPKM ≥ FPKM_75%); medium expression (FPKM_25% ≤ FPKM < FPKM_75%); low expression (1 ≤ FPKM < FPKM_25%); and no expression (FPKM < 1). FPKM stands for fragments per kilobase of exon per million fragments mapped, and FPKM_25% and FPKM_75% refer to values at the boundary of the 25th and 75th percentiles of expression levels, respectively]. And their methylation levels were plotted as a function of location [48]. As shown in Figure 6, the non-expressed genes displayed high methylation levels at CG sites within domains that are 2-kb upstream or downstream of the gene body and at CHG sites in all of the gene regions. Within the gene body and 2-kb downstream regions, non-expressed genes showed high methylation levels at CHH sites, but gene expression was positively correlated with CG methylation within the gene body. Similarly, a positive correlation was detected between gene expression and CHH methylation levels within 2-kb upstream of the TSS. Interestingly, two peaks in CG and CHG methylation levels were observed in the 2-kb upstream and downstream regions of highly expressed genes.
Another statistical approach, projecting methylation levels onto a coordinate system of expression levels (x-axis) and frequency (y-axis), was used to further explore gene expression and DNA methylation (Figure 7). We divided the methylation levels of gene bodies and promoters into five groups according to Xu et al. [48], and found that DNA methylation and gene expression levels were negatively correlated in most genes. In contrast, genes whose promoters lacked mCHH sequences were only weakly expressed (Figure 7); this situation may have been responsible for the positive correlation between gene expression and methylation levels within 2-kb upstream regions (Figure 6).

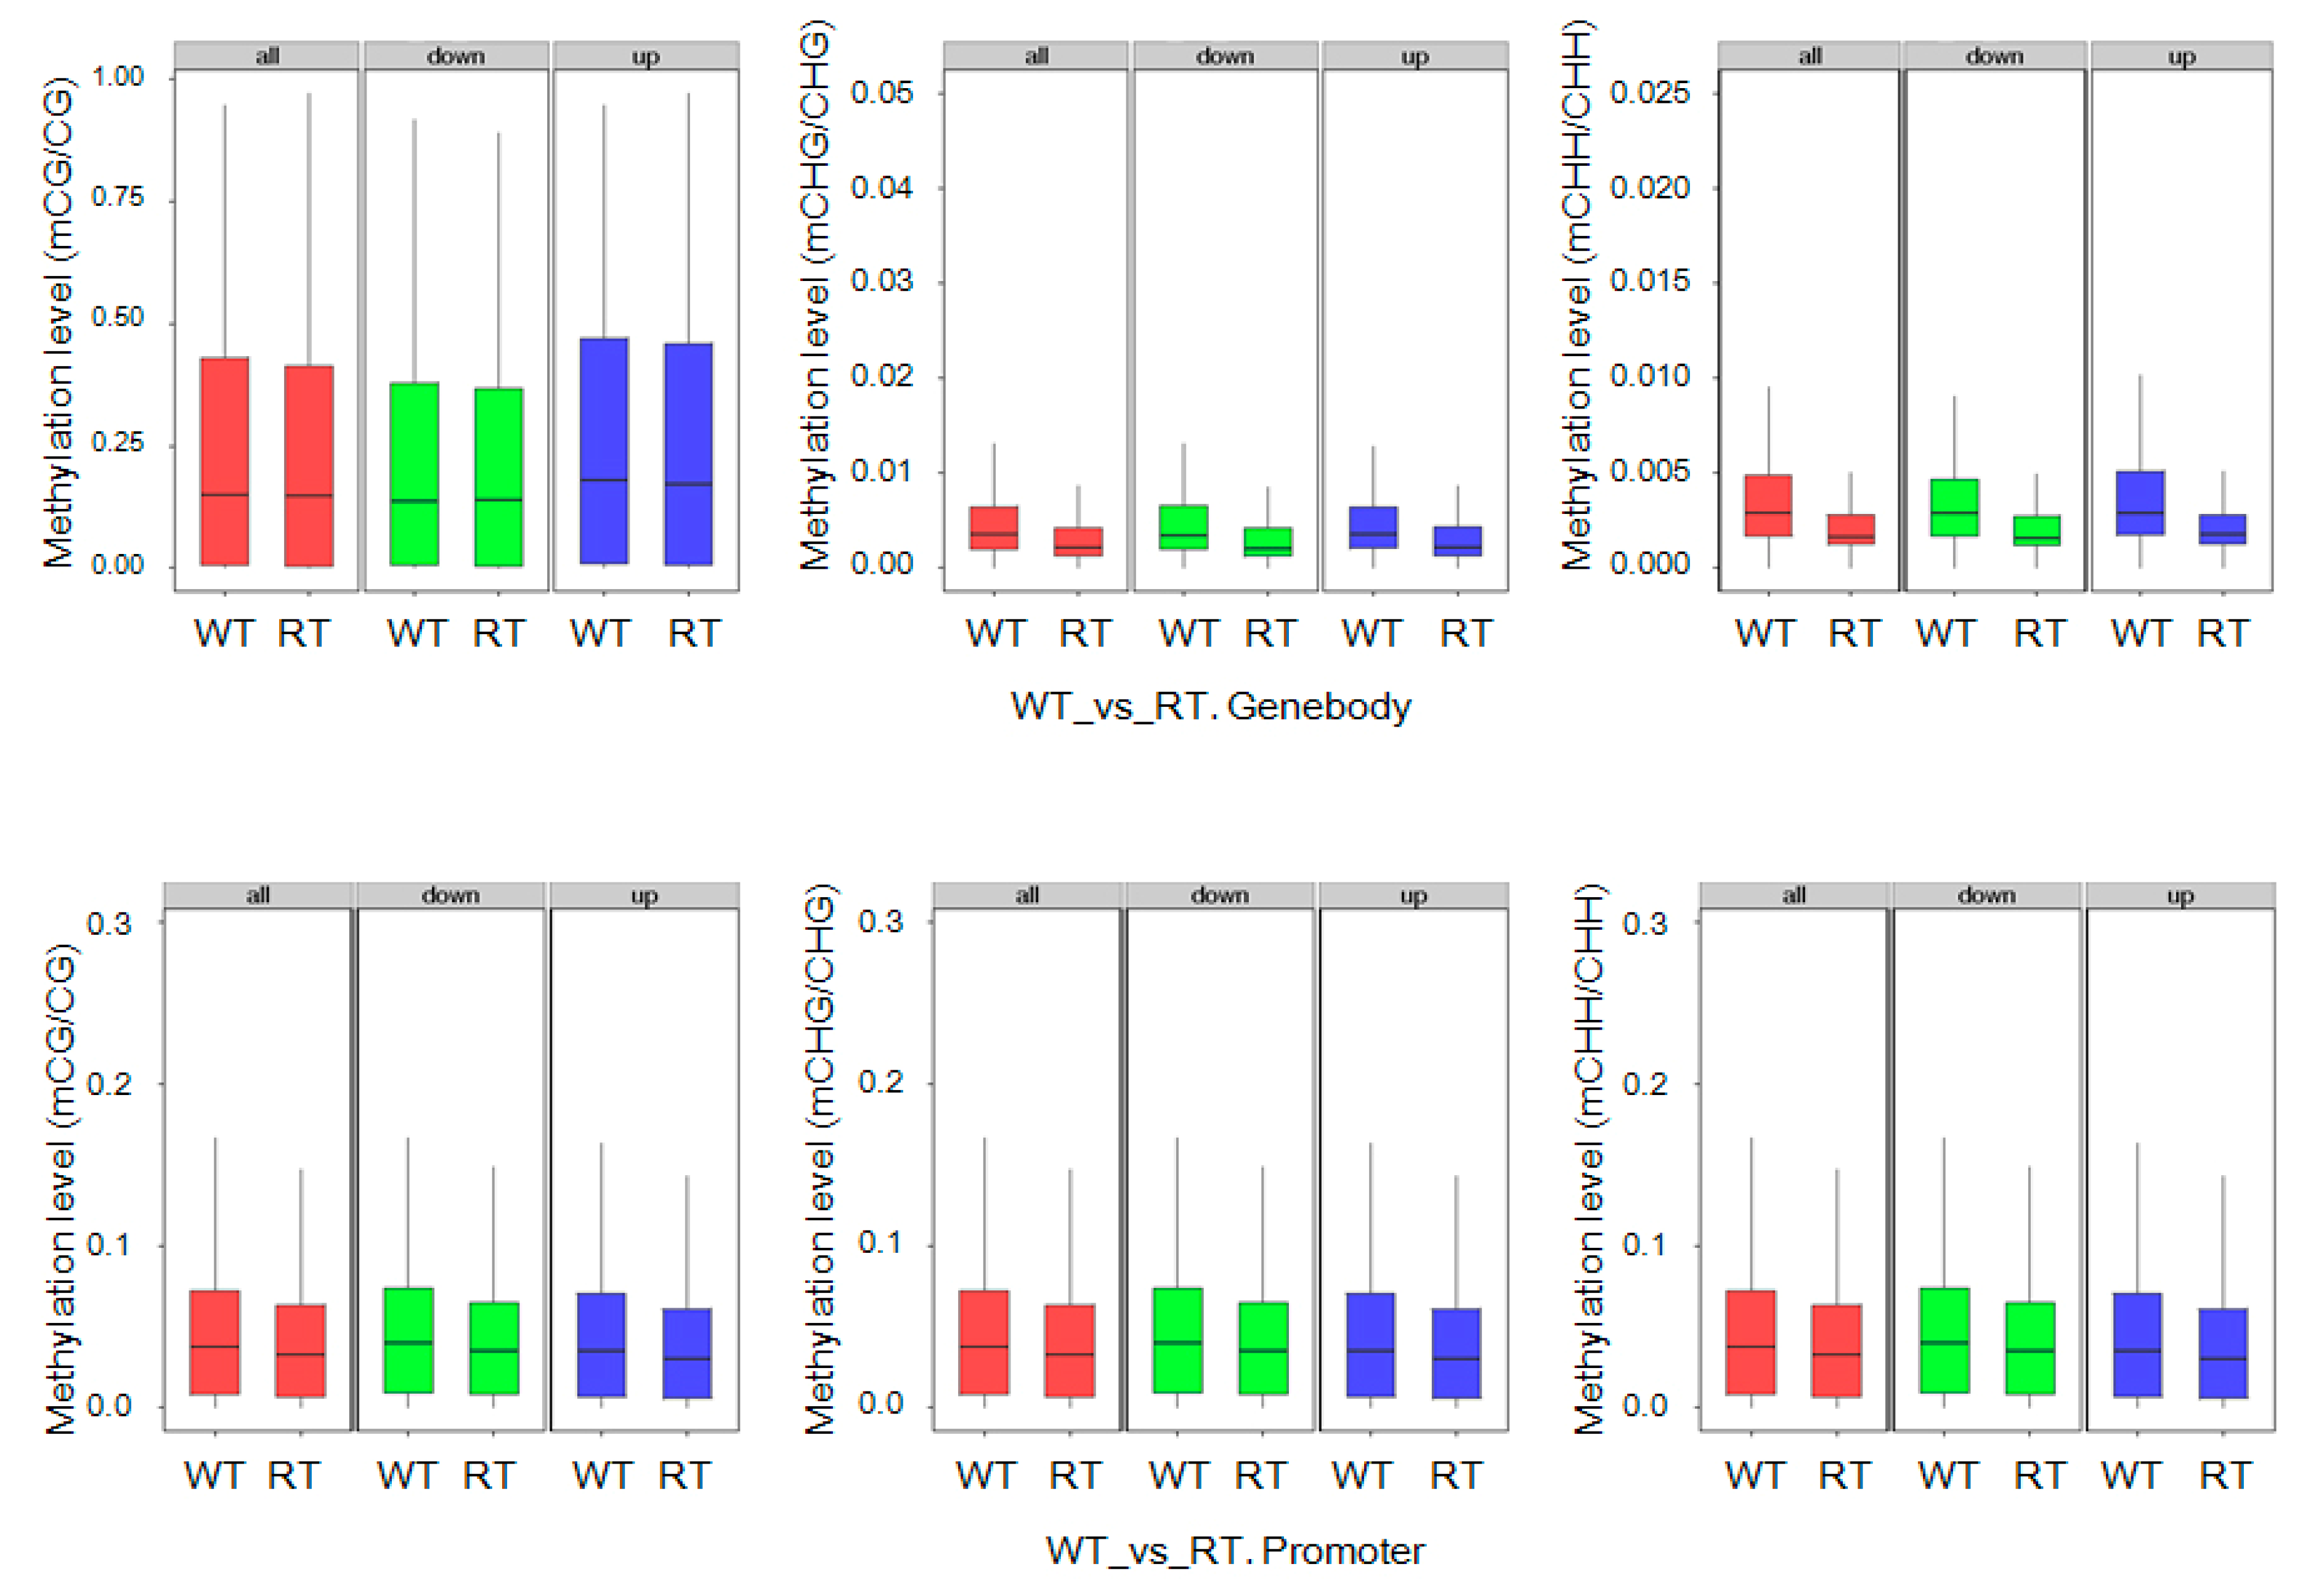
2.7. DEGs with Methylation Modification and DMR-Related Gene Expression

Analysis of DEG DNA methylation levels revealed large differences between WT and RT (Figure 8). In WT samples, high methylation levels were observed within DEGs, including downregulated and upregulated ones (i.e., involving promoters), at CG, CHG, and CHH sites. In contrast, DEGs in RT samples exhibited low methylation levels, with especially low levels observed at CHG and CHH sites within gene body domains. We also observed that DEG expression level differences between WT and RT samples were positively correlated with ratios of mCG/CG (r = 0.037, p< 0.01), mCHG/CHG (r = 0.046, p< 0.01), and mCHH/CHH (r = 0.037, p< 0.01) in gene body regions. However, in 2-kb downstream regions, a negative correlation (r = −0.038, p< 0.01) was observed between CHG methylation and expression level differences between WT and RT (Figure S16).
Next, an expression analysis of DMR-related genes (located in both gene body and promoter regions) identified 1154 mCG–DMR-related genes, 852 mCHG–DMR-related genes, and 4282 mCHH–DMR-related genes. Hypomethylated DMR-related genes were mostly associated with highly expressed genes, whereas the hypermethylation of DMR-related genes was associated with decreased expression levels (Figure 9). Methylation levels of DMR-related genes were negatively correlated with their expression levels with one exception: hypomethylation at CG sites within gene body regions was positively correlated with gene expression (Figure 10).

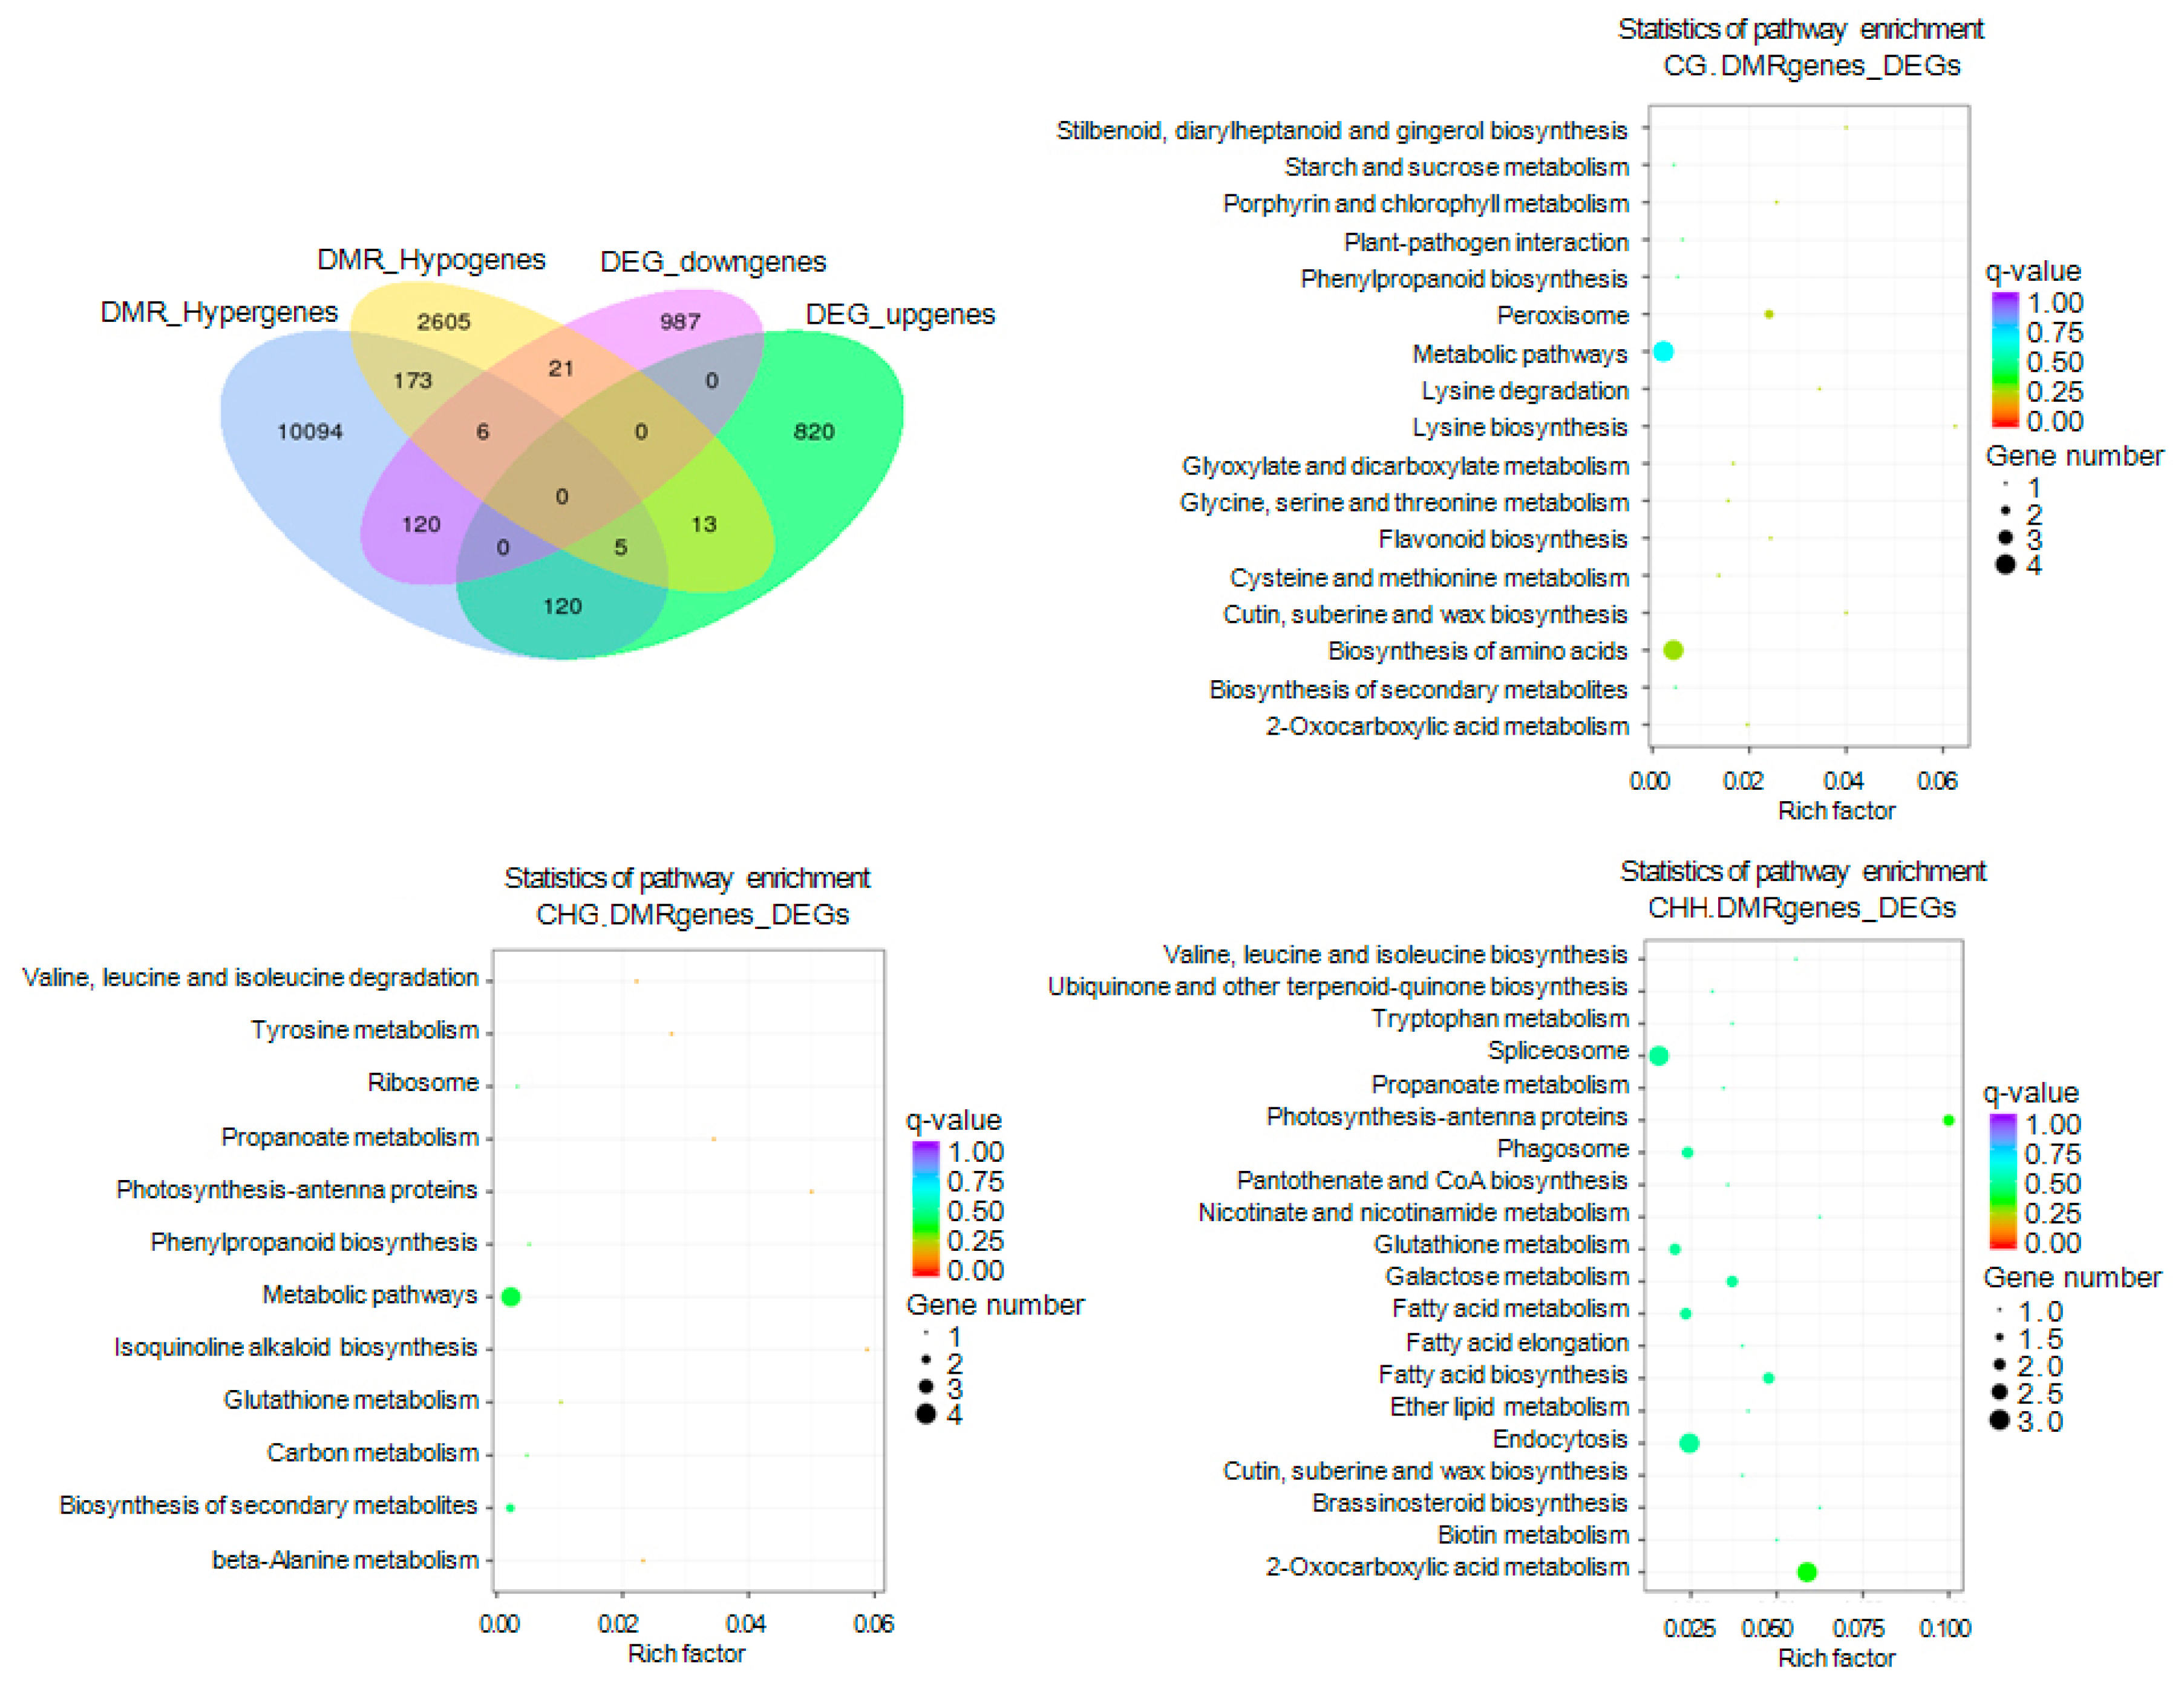
2.8. Gene Ontology (GO) and Kyoto Encyclopedia of Genes and Genomes (KEGG) Enrichment of DMR-Related Genes Associated with DEGs

To investigate the effect of DNA methylation on genes with unique functions, we performed GO and KEGG enrichment analyses of gene sets generated from an association analysis between DMR-related genes and 506 DEGs. We first identified 285 DMR-related genes associated with gene-body domains of downregulated or upregulated DEGs. Of these 285, 126, and 125 hypermethylated DMR-related genes were associated with upregulated and downregulated DEGs, respectively, whereas 27 and 18 hypomethylated DMR-related genes were associated with upregulated and downregulated DEGs, respectively. In addition, six upregulated and five downregulated DEGs overlapped with both hypermethylated and hypomethylated DMR-related genes (Figure 11). We also discovered that 282 associated DEGs, 61 of which also overlapped with DMR-related genes within gene body regions, were hypermethylated (213) or hypomethylated (83) within promoter domains. A total of 43 and 40 DMR-related genes that were hypomethylated within promoter regions were associated with downregulated and upregulated DEGs, respectively; these numbers were larger than the number of genes hypomethylated within promoter domains (Figure S17).
GO enrichment analysis was then carried out to functionally classify the DEGs associated with DMR-related genes into biological process, cellular component, and molecular function categories (Figure S18). We also performed a KEGG analysis on the associated DEGs, which revealed the enrichment of the following pathways that play important roles in flower color formation: flavonoid biosynthesis (ko pmum00941), the biosynthesis of secondary metabolites (ko pmum01110), phenylpropanoid biosynthesis (ko pmum00940), and plant hormone signal transduction (ko pmum04075) (Figure 11, Figures S17, S19 and S20). Examination of methylation level modifications of key structural and transcription factor genes differentially expressed between WT and RT indicated that Pm031359 (UGT79B6) was hypermethylated at CHH sites in exon regions, and Pm027422 (YUCCA2) and Pm008425 (MYB305) were hypermethylated at CHH sites in the promoters of downregulated genes. In upregulated DEGs, Pm008680 (UFGT) and Pm019063 (CHI) were hypomethylated at CG and CHH sites within exons and CG sites within promoters. Hypermethylation was also detected in promoter and intron regions of the Pm013782 (DFRA) gene (Supplementary Data 1).

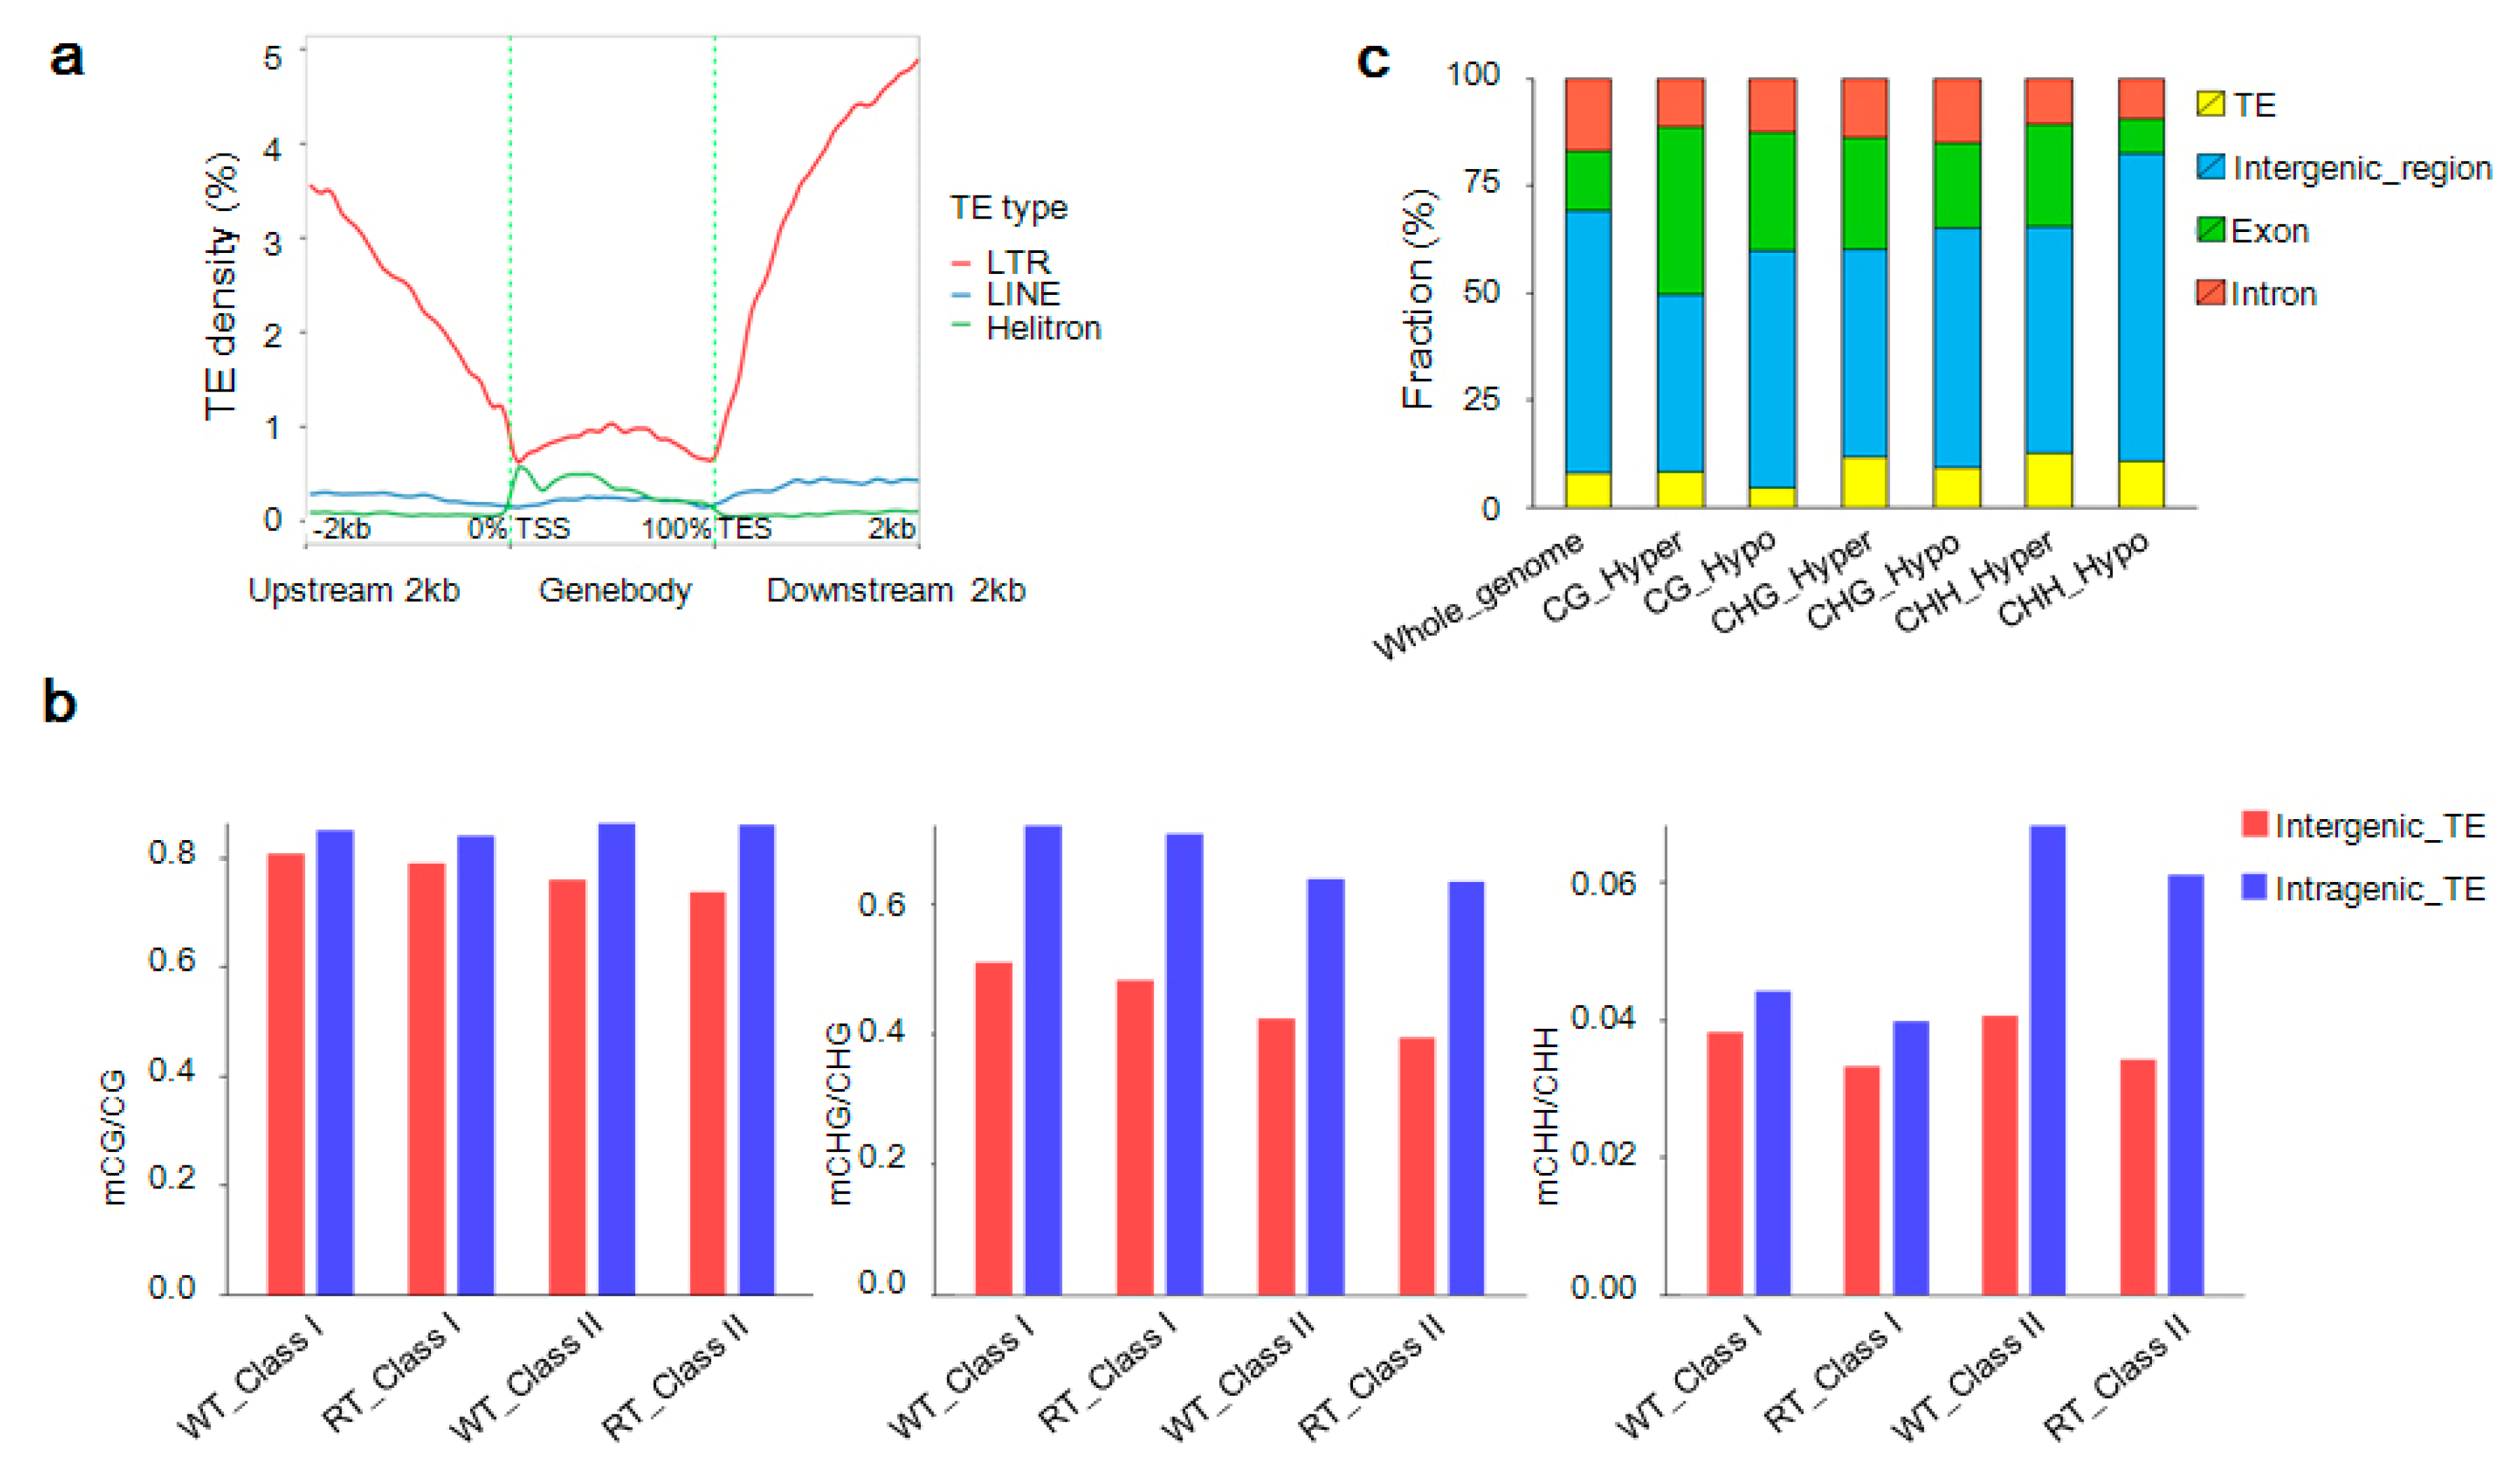
2.9. Detection of Methylated TEs Regulating Candidate Gene Expression

At the global genome level, TE density was heaviest in genomic regions with a high methylation density and lightest in areas of low gene density and low gene expression (Figure 3a). Most long terminal repeat (LTR) TEs were located in 2-kb upstream and downstream regions of gene body domains, while Helitron TEs were mainly scattered throughout the gene body and long interspersed nuclear elements (LINE) were approximately evenly distributed (Figure 12a). Class-II TEs in intragenic regions were the most heavily methylated of the intergenic and intragenic class-I and class-II TEs. In addition, more methylated sites were found within TEs in the WT sample than in the RT sample. An analysis of the methylation sequence context of TEs revealed that mCG and mCHG accounted for a large proportion of methylated sites, especially within intragenic areas (Figure 12b).
A total of 1833 DMRs (1437 hypermethylated and 396 hypomethylated) comprising 158 mCG, 302 mCHG, and 1373 mCHH sequences were detected within TEs between WT and RT samples. Hypermethylated mCG, hypomethylated mCG, hypermethylated mCHG, hypomethylated mCHG, hypermethylated mCHH, and hypomethylated mCHH within TEs accounted for 8.3%, 4.8%, 11.6%, 9.2%, 12.6% and 10.7%, respectively, of DMRs in genomic functional regions (Figure 12c). Among these DMRs, 197 were located in 196 TEs inserted into 106 DEGs associated with DMR-related genes (Supplementary Data 3). The gene Pm008680 (UGFGT), with three hypomethylated-mCHH Copia TE insertions, was upregulated in WT relative to RT, as was Pm013782 (DFRA) carrying three inserted hypermethylated TEs (two hypermethylated-mCHG L1 and one hypermethylated-mCHG Copia elements). In contrast, the Pm031359 (UGT79B6) gene, harboring a hypermethylated-mCHH Copia TE insertion in its 2-kb upstream region, and the Pm031359 (UGT79B6) gene, with a hypermethylated-mCHG Helitron TE insertion in its 2-kb downstream region, were both downregulated (Supplementary Data 1).

3. Discussion

Since variation in petal color is highly prized in ornamental plant species, P. mume trees bearing chimeric red and white flowers have been selected during the process of genetic improvement. Floral chimerism is caused by the spatially and temporally restricted deposition of plant pigments, for instance, secondary metabolites of anthocyanins [7,25,37,52,53]. In our study, we detected Cy3G, Cy35G, and Pn3G in RT samples by HPLC-MS. The implied function of these compounds as determinants of color in red petal tissues suggests that genes related to the anthocyanin regulatory pathway, as revealed by an association analysis between transcriptomes and methylomes, are the molecular basis of chimerism in P. mume “Danban Tiaozhi”.

3.1. Genes within Anthocyanin Regulation Pathway Were Differentially Expressed

Numerous molecular studies have revealed the processes controlling the genetics of plant organ coloration, which include differences in expressions of structural and transcription factor genes. For example, Han et al. [54] have reported that the downregulation of CHI and DFR by anthocyanidin reductase (ANR) results in yellow-skinned apple fruits. In bicolored flowers of Petunia hybrida, the enhancement of CHS expression induces blue or red coloration, respectively, in blue–white or red–white sectors of variegated flowers [5,23]. RNA-Seq technology has revealed that the significant upregulation of annotated anthocyanin biosynthetic genes CHS, F3H, F3H, DFR, leucoanthocyanidin dioxygenase (LDOX), ANS, and/or UF3GT is responsible for purple flesh coloration in a Dioscoreaalata cultivar, bicolored tepals in lily, and variegated petals in P. mume “Fuban Tiaozhi” [7,20,53]. In our study, we found that the anthocyanin biosynthetic gene homologs Pm020453 (YUCCA8), Pm004176 (ANGLT), and Pm031359 (UGT79B6) were upregulated in red petal tissues, but other critical genes, such as Pm013782 (DFRA), Pm018402 (DFRA), Pm023202 (DFRA), Pm017146 (FLRT), and Pm008680 (UGFGT) were downregulated. These differences between P. mume “Danban Tiaozhi” and “Fuban Tiaozhi” may be due to the temporal and tissue-specific nature of transcriptome expression [7], which has different development stages, and its genotypes show a variety of gene expression [8]. We also discovered that GST genes, which encode proteins transporting cyanidins and/or anthocyanins to the tonoplast [55], were upregulated in red tissues. This result is similar to the finding of a previous study that the Riant gene encoding a GST protein induces red flower coloration in peach [24].
The identification and functional characterization of flavonoid-related R2R3-MYB transcription factors, which show active or repressive effects on anthocyanin biosynthetic genes, is important for revealing plant pigmentation [56]. A study of blood-fleshed P. persica uncovered a mechanism whereby BLOOD (BL) was the key gene for the blood-fleshed trait via its activation of PpMYB10.1, and the silencing of BL reduced anthocyanin pigmentation in maturing fruits [6]. The MYB10 promoter is more variable in Malus × domestica “Honeycrisp” than in “Royal Gala”, which results in a more variable color pattern in the peel of the first cultivar [36]. A transcriptomic comparison of red and green-colored leaves of P. persica has identified a MYB transcription regulator, PpMYB10.4, whose transient expression induces anthocyanin accumulation [57].
In “Lollypop” Asiatic lilies, the transcriptional profiling of LhMYB12 has revealed that the presence of bicolored tepals is controlled by the transcriptional regulation of anthocyanin biosynthetic genes [53]. Differential expression of Peace (peach anthocyanin colour enhancement, a R2R3 MYB-like gene) determines the pattern of flower coloration in variegated petals within individual trees of flowering P. persica “Genpei” [25]. In addition, jasmonate has been reported to regulate WD-repeat/bHLH/MYB complex-mediated anthocyanin accumulation in Arabidopsis thaliana [58]. Using iTAK software, we detected 189 differentially expressed transcription factor genes, including MYB, bHLH, and WD, suggesting that transcription factors may play important roles in the formation of chimeras in P. mume “Danban Tiaozhi”.

3.2. Methylcytosine Modification Affected the Expression of Anthocyanin-Related Genes

Cytosine methylation is a common form of DNA modification that is closely interwoven with the process of gene transcription. Although important for the epigenetic regulation of endogenous genes, the extent to which this type of DNA modification regulates genomes remains elusive [59,60]. DNA methylation occurs at higher levels in heterochromatin than euchromatin, and performs specific functions across different species [43,48,61,62]. In this study, we mapped the first-reported methylomes of P. mume flower petals using the single base resolution technique. We also compared methylomes and transcriptomes to elucidate the relationship of methylcytosine and gene expression. We discovered that 11.29–14.83% of cytosine sites within genomes were methylated, and the patterns of methylation (mCG, mCHG and mCHH) were similar to those reported in Arabidopsis [60,63], rice [64,65], maize [66], soybean [44,67], tomato [43], apple [48], and cotton [45,47]; specifically, the highest and lowest levels of methylation were at the CG and CHH sites, respectively, with significant differences observed within both WT and RT tissues. We also found that the mCG/CG ratios were highest in exon and intron regions; in contrast, mCHG/CHG and mCHH/CHH ratios were lower in the exon and intron regions than in the promoter and TE regions.
Gene transcription is influenced or regulated by DNA methylation [59,68], with methylcytosine levels negatively correlated with gene expression in general [69]. In our study, we observed a similar pattern. We also found that methylcytosine levels of RT samples were lower than those of WT samples, which suggests that anthocyanidin-related genes are suppressed by the high levels of methylcytosine in WT genomes. However, a contradictory result was seen in gene body regions, where methylcytosine levels of hypomethylated CG-DMR-related genes were positively correlated with gene expression. This latter observation is consistent with the finding that genes methylated in transcribed regions are highly expressed and constitutively active in A. thaliana [60], and that CG methylation is often linked to increased gene expression [68,70,71].
Next, we searched for DMRs and investigated the expression of DMR-related genes (especially DEGs). We focused on DMRs in functional regions, as gene body methylation is conserved across species among constitutively expressed genes [60,64,71], and because methylation within promoters is highly tissue-specific in nature and strongly associated with transcriptional repression in plants [60,69,72]. We detected 13,468 DMRs associated with 4376 gene bodies (285 DEGs) and 4622 gene promoters (282 DEGs). These associated DEGs were enriched in KEGG terms such as flavonoid biosynthesis, the biosynthesis of secondary metabolites, phenylpropanoid biosynthesis, plant hormone signal transduction, and transcription factor activity. In previous studies, gene methylation has been observed to influence floral pigmentation. For instance, red pigmentation is observed in the flowers of the transgenic petunia line 17-R upon hypomethylation of the 35S promoter driving the A1 gene [26], while mosaic red anthocyanin in lip crests, sepals, and petals of yellow flowers of Oncidium “Gower Ramsey” may be attributed to activation of the OgCHS gene resulting from the demethylation of the five-upstream promoter region [27]. As a third example, methylation levels of MYB genes are associated with the formation of red-skinned pears and apples [37,38]. Thus, we suggest that the methylation or demethylation of genes participating in the anthocyanin regulation pathway is responsible for flower color chimerism in P. mume “Danban Tiaozhi”.

3.3. TEs with Methylcytosine Affected the Expression of Anthocyanin-Related Genes

Various evidence supports the role of TE insertions in gene expression changes and phenotypic variation in higher plants. In anthocyanin biosynthetic genes, for example, TE-induced insertions cause null mutations that result in variations in seed, peel, and flower coloration. The insertion and excision of the Ds transposon has given rise to variation in the size and intensity of colored spots in maize kernels, and a Candystripe 1 insertion in the second intron domain of the y-candystripe allele has altered the pigmentation of the sorghum grain pericarp from solid red to variegated [8,73,74]. Similarly, the TRANSPARENT TESTA8 (BrTT8) locus, encoding a bHLH protein, lost its function with the insertion of a Helitron transposon, resulting in yellow seeds in Brassicarapa [75]. The golden pigmentation in hulls and internodes of Oryza sativa mutants is due to the complete suppression of the OsCHI gene following insertion of a Dasheng retrotransposon into its 5′ untranslated region (UTR), while a retrotransposon insertion in the upstream sequence of the pigmentation-related gene VvmybA1 is regarded as the molecular basis for white-skinned coloration in grape cultivars [15,76]. TE-mediated insertional mutations have also caused alterations in seed coat and flower color in both Ipomoea purpurea and Glycine max [77,78,79,80]. Transformed tobacco plants carrying an inserted Tag1 element between the CaMV 35S promoter and the maize R gene have variegated flowers, and the insertion of either Ty1dic1 or Retdic1 transposons can disrupt the AA5GT (acyl-glucose-dependent anthocyanin 5-O-glucosyltransferase) gene to prevent glycosylation of the 5′ position of anthocyanins in Dianthus caryophyllus [14,17].
One unanswered question concerns how TEs are activated or repressed to ensure a stable phenotype. Emerging evidence is demonstrating that TEs are silenced or reactivated by epigenetic mechanisms such as DNA methylation modification [39,41,42,68,81,82]. In the model plant A. thaliana, the imprinted gene FWA is a flowering-time modifier, with its silencing dependent on the cytosine methylation of a SINE retro element in the promoter region [83]. Transposons in Arabidopsis are heavily methylated at both CG and non-CG sites, whereas non-CG methylation is rarely found in active genes [70]. In rice, the essential chloroplast protease 5 (OsClpP5) gene with the insertion of an epigenetically silenced autonomous DNA-based active rice transposon 1 (aDart1) may induce leaves to show variegation [84]. Similarly, in our study, we detected 197 DMRs associated with 196 TEs inserted into 106 DEGs. We annotated these DEGs with GO and KEGG functional terms and pathways. The genes Pm008680 (UGFGT), Pm031359 (UGT79B6), Pm031359 (UGT79B6), Pm013782 (DFRA), and Pm011195 (GSTXC), all participating directly in the color regulation pathway and anthocyanin transport, were enriched. This result suggests that the insertion of methylcytosine-modified transposons affects the expression of anthocyanin genes, resulting in chimerism.

4. Materials and Methods

4.1. Plant Materials

White and red petal tissues were collected from fresh flower blossoms of the flower color chimera P. mume “Danban Tiaozhi” on a fine day between 9:00–11:00. The collected tissues were carefully sorted under subzero temperatures with fine-tipped tweezers into six groups according to their color and origin (Figure 1a). Tissues in the first two groups came from individual flowers having both white (WT1) and red (RT1) petal tissues. The second two groups individually consisted of white (WT2) and red (RT2) petal tissues from single-color (white or red) flowers that were located together in the same branches. The final two groups comprised petal tissues derived from separate branches bearing either white (WT3) or red (RT3) flowers only. To facilitate the use of these materials for biochemical detection and a variation analysis of single base resolution genomes, all of the tissues were harvested from a single ornamental tree, snap-frozen in liquid nitrogen, and stored at −80 °C.

4.2. Qualitative and Quantitative Analysis of Floral Pigments

Previously frozen petal tissues were ground into fine powder in liquid nitrogen. Next, 200.0-mg portions of individual petal tissue samples were placed in centrifuge tubes containing extraction reagent (70:27:2:1 (v/v/v/v) methanol-water-formic acid-trifluoroacetic acid) [85] and vortexed for 1 min at room temperature followed by ultrasonic extraction in a KQ 2200B ultrasonic cleaner (Jiangsu, China) at 4 °C for 15 min. After storage overnight at −20 °C, the mixtures were centrifuged (A-14C, Sartorius, Goettingen, Germany) for 10 min at 12,000 rpm and 4 °C. Supernatants were collected and filtered through 0.22-μm nylon membranes [86] for high-performance liquid chromatography-electrospray ionization-mass spectrometry (HPLC-ESI-MS) analysis.
Preliminary HPLC analysis [86] was performed on a Waters 2695 system (USA) equipped with a W2996 photodiode array and a C18 column (5 μm, 4.6 × 250 mm i.d.; WondaCract ODS-2, Shimadzu, Shanghai, China). The major parameters were set as follows: column temperature = 30 °C, absorption spectrum = 200 to 600 nm, injection volume = 10 μL, and flow rate = 0.8 mL/min. Gradient separation was carried out using a two-solvent system, 0.5% formic acid in water (phase A) and 0.1% formic acid in acetonitrile (phase B), as follows: 0 min, 5% B; 5 min, 10% B; 20 min, 20% B; 30 min, 25% B; 33 min, 10% B; 35 min, 5% B; and 50 min, 5% B. Quantification of WT and RT samples was performed using three replicates (WT1, WT2 and WT3, and RT1, RT2 and RT3, respectively) and an external standard. The external standard was cyanidin 3-O-glucoside chloride (Sigma-Aldrich, St. Louis, MO, USA), which was dissolved in the same extraction reagent (70:27:2:1 (v/v/v/v) methanol-water-formic acid-trifluoroacetic acid) with a concentration of 0.125 mg/mL.
Following preliminary HPLC identification, anthocyanins were detected using an HPLC system (Agilent 1200LC, Santa Clara, CA, USA) equipped with a diode array detector at 520 nm and the same C18 column used above and coupled to an electrospray ionization-mass spectrometer (ESI-MS) (6310 MSD Trap VL, Agilent, USA). ESI-MS was performed with the following settings: positive ionization mode (ESI, m/z 50–1000 mass units), gas temperature = 350 °C, flow rate = 8.0 L/min, nebulizer pressure = 35 psi, and capillary exit voltage = 120.4 V.

4.3. Bisulfite Sequencing and DMR Analysis

4.3.1. Extraction of DNA and BS-Seq

WT1, WT2, WT3, RT1, RT2, and RT3 samples were separately ground into fine powder in liquid nitrogen. Genomic DNA was extracted using a DNeasy Plant Mini kit (QianGen, Shanghai, China) following the manufacturer’s instructions and then checked on 0.1% agarose gels and a NanoPhotometer spectrophotometer (Implen, Westlake Village, CA, USA). DNA concentrations were determined with a Qubit DNA Assay kit on a Qubit 2.0 fluorometer (Life Technologies, Carlsbad, CA, USA).
Next, 5.2 μg of qualified DNA spiked with 26 ng of lambda DNA (negative control) was sheared in a Covaris S220 ultrasonicator into random 200–300-bp fragments. The resulting fragments were then subjected to end repair, adenylation, and methyl-treated adapter ligation. Two bisulfite treatments with an EZ DNA Methylation-Gold kit (Zymo Research, Irvine, CA, USA) were applied to these fragments to transform non-methylated cytosines into uracil for subsequent base pairing with thymine by PCR. After PCR amplification using KAPA HiFi HotStart Uracil + ReadyMix (2×), the generated BS-seq library was quantified on a Qubit 2.0 fluorometer (Life Technologies) and by quantitative PCR, and insert size was assayed on an Agilent Bioanalyzer 2100 system. Sequencing of the BS-seq library, which generated 125/150-bp paired-end reads, was performed on an Illumina Hiseq 2500 platform followed by Illumina CASAVA pipeline analysis.

4.3.2. Quality Assessment of Sequencing Data

The sequenced paired-end reads (raw reads or raw data) were checked for quality using FastQC (fastqc_v0.11.5) and stored in the FASTQ file format (Babraham Bioinformatics, http://www.bioinformatics.babraham.ac.uk/projects/fastqc/). The resulting files were pre-processed with Trimmomatic v0.36 software [87] using the following parameters: SLIDINGWINDOW: 4:15; LEADING:3, TRAILING:3; ILLUMINACLIP: adapter.fa: 2:30:10; and MINLEN:36. Reads passing these filtering steps were counted as clean reads for use in subsequent analyses. Finally, basic quality statistics on the clean reads were obtained using FastQC.
All the sequencing data (accession number: CRA000731) are available in the database of Genome Sequence Archive (GSA, http://bigd.big.ac.cn/).

4.3.3. Reference Genome Preparation and Mapping of Clean Reads

To enable the mapping of clean reads, we first prepared a reference genome of P. mume [1]. Then, we performed reverse complementation process (C to T, and G to A) using Bismarkv 0.16.3 software [88] and Bowtie2 [89]. In addition, a gene annotation file in gene transfer format, a Gene Ontology (GO) annotation file, a description file, and a gene region file in browser extensible data format were generated for subsequent annotation and function analyses.
The quality-checked clean reads generated by BS-seq were aligned against the two strands of the converted reference genome (X700-dovetail). The best unique alignment of these sequence reads was selected from the two sets of pairwise comparisons. To infer cytosine methylation states and positions, the sequences were then compared against the normal genomic sequence. Identical sequences aligned to a unique genomic region were regarded as duplicates and used to estimate sequencing depth and coverage. To allow their visualization in the IGV browser, sequences were transformed into bigWig format (non-overlap) [88,90]. The bisulfite non-conversion rate was defined as the number of sequenced cytosines at all of the cytosine reference positions divided by the number in the lambda genome.

4.3.4. Evaluation of Methylation Level and Distribution

Methylation level was calculated as ML(mC) = reads(mC)/(reads(mC) + reads(C)), where mC is methylcytosine, C is non-methylated cytosine, and ML(mC) is the methylcytosine level. As recommended in a previous study [91], the parameter ML(mC) was corrected to ML(corrected) according to the following formula: ML(corrected) = (ML(mC) − r)/(1 − r), where r represents the bisulfite non-conversion rate. Methylcytosine sequence contexts—mCG, mCHG, and mCHH (where H represents A, T, or C)—were analyzed. Methylation level densities and methylcytosine distributions in each chromosome and gene functional region (promoter, exon, intron, and 2-kb upstream and downstream regions) were also analyzed [43,92,93]. Differences in global methylation levels and methylcytosine distributions in gene structural regions (including 2-kb upstream and downstream) were compared between samples [72]. To focus on petal color variation, WT1, WT2, and WT3 samples were merged together as three biological replicates of WT; similarly, RT1, RT2, and RT3 served as the three RT biological replicates.

4.3.5. Correlation Analysis and DMR Detection

A correlation analysis was carried out based on Pearson’s coefficient [94]. DSS software was used to identify DMRs and differentially methylated loci between WT and RT samples [95,96,97]. Information from neighboring cytosine sites (i.e., spatial correlation) and site read depths were analyzed to improve the accuracy of long cytosine reads. Variance among biological replicates was analyzed using a beta-binomial distribution model. DMRs were annotated, and DMR-related genes were defined as those having coding regions (from the transcriptional start site (TSS) to the transcriptional end site (TES)) or promoter regions (i.e., upstream 2-kb from the TSS) that overlapped with the distribution of DMRs.

4.3.6. GO and KEGG Enrichment Analysis of DMR-Related Genes

GO enrichment analysis of DMR-related genes was performed using the GOseq R package [98], which also corrects for gene length bias. A GO term was considered to be significantly enriched in DMR-related genes at a corrected p-value threshold of 0.05. KEGG analysis (http://www.genome.jp/kegg/), an approach for understanding high-level functions and relationships in biological systems, was applied to uncover the pathway enrichment of DMR-associated genes [99]. KOBAS software [100] was used to test for statistical enrichment of DMR-related genes, which were then subdivided into all, hypermethylation, and hypomethylation categories and assigned to KEGG pathways.

4.4. Transcriptome Sequencing and Differentially Expressed Gene (DEG) Analysis

4.4.1. RNA Isolation and Sequencing

RNA was isolated from WT1, WT2, WT3, RT1, RT2, and RT3 samples using an RNeasy Plant Mini kit (QianGen). Extracted RNA was checked for degradation and contamination using 1% agarose gels and a NanoPhotometer spectrophotometer (Implen, CA, USA), respectively, and then quantified with a Qubit RNA Assay kit on a Qubit 2.0 fluorometer (Life Technologies). RNA integrity was assessed on a Bioanalyzer 2100 system (Agilent) using the supplied RNA Nano 6000 assay kit.
For sequencing library construction, first and second-strand cDNA synthesis was carried out using 3 µg of RNA and a NEBNext Ultra RNA Library Prep Kit for Illumina (NEB, Ipswich, MA, USA), following the manufacturer’s instructions. After purification using an AMPure XP system (Beckman Coulter, Beverly, MA, USA), the synthesized strands were subjected to three-end adenylation and the addition of a poly-A tail and a NEBNext adapter. Next, 150–200-bp adapter-ligated fragments were preferentially selected using AMPure XP beads and amplified by PCR. The quality of the enriched cDNA library was assessed on an Agilent Bioanalyzer 2100 system. Clusters were generated from the qualified library using a cBot Cluster Generation System with a TruSeq PE Cluster kit v3-cBot-HS (Illumina, San Diego, CA, USA) and then sequenced on an Illumina Hiseq platform to generate 125-bp/150-bp paired-end reads (raw reads).

4.4.2. Mapping and DEG Analysis

After quality control to remove low-quality reads and adapter contaminants from the raw reads, the remaining clean reads were aligned to the P. mume reference genome [1] using HISAT2.0.4 software with default parameters [101]. Cufflinks v2.1.1 was then used to assemble and identify known and novel transcripts, and HTSeq v0.6.1 (-m union) was used to estimate gene expression levels based on fragments per kilobase of transcript sequence per millions of base pairs (FPKM) [102]. Differential expression analysis of WT and RT groups, with three biological replicates per group, was performed in DESeq v1.10.1, a program providing statistical routines for the determination of differential expression in digital gene expression data with a negative binomial distribution (Kij~NB(μij,σij2)) [103,104]. Significant DEGs were identified using an adjusted p-value cutoff of 0.05 and then subjected to GO [98] and KEGG [100] annotation.

4.5. Identification of Transcription Factors and TEs

Transcription factors and transcriptional regulatory factors were predicted and classified from the assembled transcriptome data according to Pérez-Rodríguez et al. [105] and Jin et al. [106]. In addition, the DEG sequences were screened for transcription factors using the iTAK tool (http://bioinfo.bti.cornell.edu/tool/itak), a program to identify plant transcription factors and transcriptional regulators and protein kinases, which currently provides both online and standalone versions with a hidden Markov model [107].
TEs were identified from the reference genome using RepeatMasker (http://www.repeatmasker.org/). TE density based on the length ratio of each bin within every chromosome was displayed as a Circos plot [48]. TEs annotated within gene set domains (including 2-kb upstream and downstream sequences) of DMR-related genes overlapping with DEGs were used for DNA methylation analysis. TEs were classified, and their distributions and mC contexts were analyzed.

4.6. Methylation Modification of Gene Expression

After the completion of independent methylome and transcriptome analyses, the correlation between methylation level and gene expression was progressively analyzed on four different levels. First, gene methylation level and gene expression densities were mapped onto the chromosomes of P. mume, and relationships between methylation levels and the expressions of promoters or gene coding regions, upstream (2-kb) and downstream (2-kb) regions, TSSs, and TESs were explored from a global perspective [48,90,108]. Second, CG, CHG, and CHH methylation modification patterns of DEGs (including promoters and 2-kb upstream and downstream regions) identified from the transcriptome data were analyzed [109,110]. Third, we attempted to relate the expression of DMR-related genes to different methylation modification patterns [111,112]. Finally, we identified the set of DMR-related genes that overlapped with DEGs, and subjected them to GO and KEGG enrichment analyses.

5. Conclusions

Flower color chimerism has since served as important material for landscaping application and genetic improvement. In our study, we detected the specific color substances, i.e., cyanidin 3,5-O-diglucoside, cyanidin 3-O-glucoside, and peonidin 3-O-glucoside, in red petal tissues of P. mume “Danban Tiaozhi”. Simultaneously, we investigated the molecular mechanism of chimeric flowers by using a comparative methylomic–transcriptomic approach. We mapped the first-ever generated methylomes of P. mume, and determined that gene expression was negatively correlated with methylcytosine level in general and uncovered significant epigenetic variation between WT and RT. We also detected DMRs and DMR-related genes between WT and RT, and concluded that many of these genes, including DEGs and transcription factor genes, are critical participants in the anthocyanin regulatory pathway. Importantly, some of the associated DEGs harbored TE insertions that were also modified by methylcytosine. It suggests that flower color chimerism in P. mume is induced by the DNA methylation of critical genes and TEs.

Supplementary Materials

The following are available online at https://www.mdpi.com/1422-0067/19/8/2315/s1.

Author Contributions

K.-F.M., Q.-X.Z. designed the experiments; T.-R.C., X.-L.Y., H.-T.P., and J.W. collected the plant materials and performed the qualitative and quantitative analysis on the content of anthocyanins; K.-F.M. did the experiment in molecular biology and analyzed the data profiles; K.-F.M. and Q.-X.Z. wrote the manuscript; T.-R.C., X.-L.Y., H.-T.P., and J.W. provided suggestions for manuscript revision.

Funding

This research was supported by the Fundamental Research Funds for the Central Universities (Nos. 2016ZCQ02 and BLX2013010), the National Natural Science Foundation of China (No. 31501787), and the Special Fund for Beijing Common Construction Project.

Conflicts of Interest

The authors declare no conflicts of interest.

References

  1. Zhang, Q.X.; Chen, W.B.; Sun, L.D.; Zhao, F.Y.; Huang, B.Q.; Yang, W.R.; Tao, Y.; Wang, J.; Yuan, Z.Q.; Fan, G.Y.; et al. The genome of Prunus mume. Nat. Commun. 2012, 3, 1318. [Google Scholar] [CrossRef] [PubMed]
  2. Chen, J.Y. Chinese Mei Flowers; Hainan Publishing House: Haikou, China, 1996; pp. 12–58. (In Chinese) [Google Scholar]
  3. Marcotrigiano, M. Chimeras and variegation: Patterns of deceit. Hortscience 1997, 32, 773–784. [Google Scholar]
  4. Suzuki, M.; Miyahara, T.; Tokumoto, H.; Hakamatsuka, T.; Goda, Y.; Ozeki, Y.; Nobuhiro Sasaki, N. Transposon-mediated mutation of CYP76AD3 affects betalain synthesis and produces variegated flowers in four o’clock (Mirabilis jalapa). J. Plant Physiol. 2014, 171, 1586–1590. [Google Scholar] [CrossRef] [PubMed]
  5. Wang, C.; Chin, Y.; Lin, C.; Chen, P.; To, K. Transforming the snapdragon aurone biosynthetic genes into petunia alters coloration patterns in transgenic flowers. Adv. Biosci. Biotechnol. 2015, 6, 702–722. [Google Scholar] [CrossRef]
  6. Zhou, H.; Linwang, K.; Wang, H.L.; Gu, C.; Dare, A.P.; Epley, R.V.; He, H.P.; Allan, A.C.; Han, Y.P. Molecular genetics of blood-fleshed peach reveals activation of anthocyanin biosynthesis by NAC transcription factors. Plant J. 2015, 82, 105–121. [Google Scholar] [CrossRef] [PubMed] [Green Version]
  7. Wu, X.; Gong, Q.; Ni, X.; Zhou, Y.; Gao, Z. UFGT: The key enzyme associated with the petals variegation in Japanese apricot. Front. Plant Sci. 2017, 8, 108. [Google Scholar] [CrossRef] [PubMed]
  8. McClintock, B. Chromosome organization and gene expression. Cold Spring Harb. Symp. Quant. Biol. 1951, 16, 13–47. [Google Scholar] [CrossRef] [PubMed]
  9. Inagaki, Y.; Hisatomi, Y.; Iida, S. Somatic mutations caused by excision of the transposable element, Tpn1, from the DFR gene for pigmentation in sub-epidermal layer of periclinally chimeric flowers of Japanese morning glory and their germinal transmission to their progeny. Theor. Appl. Genet. 1996, 92, 499–504. [Google Scholar] [CrossRef] [PubMed]
  10. Abe, Y.; Hoshino, A.; Iida, S. Appearance of flower variegation in the mutable speckled line of the Japanese morning glory is controlled by two genetic elements. Genes Genet. Syst. 1997, 72, 57–62. [Google Scholar] [CrossRef]
  11. Iida, S.; Morita, Y.; Choi, J.; Park, K.; Hoshino, A. Genetics and epigenetics in flower pigmentation associated with transposable elements in morning glories. Adv. Biophys. 2004, 38, 141–159. [Google Scholar] [CrossRef]
  12. Fukada-Tanaka, S.; Inagaki, Y.; Yamaguchi, T.; Saito, N.; Iida, S. Colour-enhancing protein in blue petals. Nature 2000, 407, 581. [Google Scholar] [CrossRef] [PubMed]
  13. Yamaguchi, T.; Fukadatanaka, S.; Inagaki, Y.; Saito, N.; Yonekurasakakibara, K.; Tanaka, Y.; Kusumi, T.; Iida, S. Genes en-coding the vacuolar Na+/H+ exchanger and flower coloration. Plant Cell Physiol. 2001, 42, 451–461. [Google Scholar] [CrossRef] [PubMed]
  14. Liu, D.; Galli, M.; Crawford, N.M. Engineering variegated floral patterns in tobacco plants using the Arabidopsis transposable element Tag1. Plant Cell Physiol. 2001, 42, 419–423. [Google Scholar] [CrossRef] [PubMed]
  15. Kobayashi, S.; Goto-Yamamoto, N.; Hirochika, H. Retrotransposon-induced mutations in grape skin color. Science 2004, 304, 982. [Google Scholar] [CrossRef] [PubMed]
  16. Zabala, G.; Vodkin, L. A putative autonomous 20.5 kb-CACTA transposon insertion in an F3'H allele identifies a new CACTA transposon subfamily in Glycine max. BMC Plant Biol. 2008, 8, 124. [Google Scholar] [CrossRef] [PubMed]
  17. Nishizaki, Y.; Matsuba, Y.; Okamoto, E.; Okamura, M.; Yoshihiro Ozeki, Y.; Sasaki, N. Structure of the acyl-glucose-dependent anthocyanin 5-O-glucosyltransferase gene in carnations and its disruption by transposable elements in some varieties. Mol. Genet. Genom. 2011, 286, 383–394. [Google Scholar] [CrossRef] [PubMed]
  18. Fukada-Tanaka, S.; Hoshino, A.; Hisatomi, Y.; Habu, Y.; Hasebe, M.; Iida, S. Identification of new chalcone synthase genes for flower pigmentation in the Japanese and common morning glories. Plant Cell Physiol. 1997, 38, 754–758. [Google Scholar] [CrossRef] [PubMed]
  19. Chen, Y.N.; Mao, Y.; Liu, H.L.; Yu, F.X.; Li, S.X.; Yin, T.M. Transcriptome analysis of differentially expressed genes relevant to variegation in peach flowers. PLoS ONE 2014, 9, e90842. [Google Scholar] [CrossRef] [PubMed]
  20. Wu, Z.G.; Jiang, W.; Mantri, N.; Bao, X.Q.; Chen, S.L.; Tao, Z.M. Transciptome analysis reveals flavonoid biosynthesis regulation and simple sequence repeats in yam (Dioscorea alata L.) tubers. BMC Genom. 2015, 16, 346. [Google Scholar] [CrossRef] [PubMed]
  21. Zhang, Y.; Cheng, Y.; Ya, H.; Xu, S.; Han, J. Transcriptome sequencing of purple petal spot region in tree peony reveals differentially expressed anthocyanin structural genes. Front Plant Sci. 2015, 8, 964. [Google Scholar] [CrossRef] [PubMed]
  22. Hassani, D.; Liu, H.L.; Chen, Y.N.; Wan, Z.B.; Zhuge, Q.; Li, S.X. Analysis of biochemical compounds and differentially expressed genes of the anthocyanin biosynthetic pathway in variegated peach flowers. Genet. Mol. Res. 2015, 14, 13425–13436. [Google Scholar] [CrossRef] [PubMed]
  23. Koseki, M.; Goto, K.; Masuta, C.; Kanazawa, A. The star-type color pattern in Petunia hybrida ‘Red Star’ flowers is induced by sequence-specific degradation of Chalcone Synthase RNA. Plant Cell Physiol. 2005, 46, 1879–1883. [Google Scholar] [CrossRef] [PubMed]
  24. Cheng, J.; Liao, L.; Zhou, H.; Gu, C.; Wang, L.; Han, Y.P. A small indel mutation in an anthocyanin transporter causes variegated colouration of peach flowers. J. Exp. Bot. 2015, 66, 7227–7239. [Google Scholar] [CrossRef] [PubMed] [Green Version]
  25. Uematsu, C.; Katayama, H.; Makino, I.; Inagaki, A.; Arakawa, O.; Martin, C. Peace, a MYB-like transcription factor, regulates petal pigmentation in flowering peach ‘Genpei’ bearing variegated and fully pigmented flowers. J. Exp. Bot. 2014, 65, 1081–1094. [Google Scholar] [CrossRef] [PubMed]
  26. Meyer, P.; Heidmann, I.; Niedenhof, I. Differences in DNA-methylation are associated with a paramutation phenomenon in transgenic petunia. Plant J. 1993, 4, 89–100. [Google Scholar] [CrossRef] [PubMed] [Green Version]
  27. Liu, X.J.; Chuang, Y.N.; Chiou, C.Y.; Chin, D.C.; Shen, F.Q.; Yeh, K.W. Methylation effect on chalcone synthase gene expression determines anthocyanin pigmentation in floral tissues of two Oncidium orchid cultivars. Planta 2012, 236, 401–409. [Google Scholar] [CrossRef] [PubMed]
  28. Jones, P.A.; Takai, D. The role of DNA methylation in mammalian epigenetics. Science 2001, 293, 1068–1070. [Google Scholar] [CrossRef] [PubMed]
  29. Reik, W.; Dean, W.; Walter, J. Epigenetic reprogramming in mammalian development. Science 2001, 293, 1089–1093. [Google Scholar] [CrossRef] [PubMed]
  30. Reik, W.; Santos, F.; Mitsuya, K.; Morgan, H.P.; Dean, W. Epigenetic asymmetry in the mammalian zygote and early embryo: Relationship to lineage commitment? Philos. Trans. R. Soc. B 2003, 358, 1403–1409. [Google Scholar] [CrossRef] [PubMed]
  31. Bird, A. DNA methylation patterns and epigenetic memory. Genes Dev. 2002, 16, 6–21. [Google Scholar] [CrossRef] [PubMed] [Green Version]
  32. Bocchini, M.; Galla, G.; Pupilli, F. The vesicle traffcking regulator PN_SCD1 is demethylated and overexpressed in florets of apomictic Paspalum notatum genotypes. Sci. Rep. 2018, 8, 3030. [Google Scholar] [CrossRef] [PubMed]
  33. Marfil, C.F.; Camadro, E.L.; Masuelli, R.W. Phenotypic instability and epigenetic variability in a diploid potato of hybrid origin, Solanum ruiz-lealii. BMC Plant Biol. 2009, 9, 21. [Google Scholar] [CrossRef] [PubMed]
  34. Ma, K.F.; Song, Y.P.; Jiang, X.B.; Zhang, Z.Y.; Li, B.L.; Zhang, D.Q. Photosynthetic response to genome methylation affects the growth of Chinese white poplar. Tree Genet. Genomes 2012, 8, 1407–1421. [Google Scholar] [CrossRef]
  35. Cubas, P.; Vincent, C.; Coen, E. An epigenetic mutation responsible for natural variation in floral symmetry. Nature 1999, 401, 157–161. [Google Scholar] [CrossRef] [PubMed]
  36. Telias, A.; Linwang, K.; Stevenson, D.E.; Cooney, J.M.; Hellens, R.P.; Allan, A.C.; Hoover, E.; Bradeen, J.M. Apple skin patterning is associated with differential expression of MYB10. BMC Plant Biol. 2011, 11, 93. [Google Scholar] [CrossRef] [PubMed] [Green Version]
  37. Wang, Z.G.; Meng, D.; Wang, A.D.; Li, T.L.; Jiang, S.L.; Cong, P.H.; Li, T.Z. The methylation of the PcMYB10 promoter is associated with green-skinned sport in Max red bartlett pear. Plant Physiol. 2013, 162, 885–896. [Google Scholar] [CrossRef] [PubMed]
  38. Bai, S.L.; Tuan, P.A.; Saito, T.; Honda, C.; Hatsuyama, Y.; Ito, A.; Moriguchi, T. Epigenetic regulation of MdMYB1 is associated with paper bagging-induced red pigmentation of apples. Planta 2016, 244, 573–586. [Google Scholar] [CrossRef] [PubMed]
  39. Hoekenga, O.A.; Muszynski, M.G.; Cone, K.C. Developmental patterns of chromatin structure and DNA methylation responsible for epigenetic expression of a maize regulatory gene. Genetics 2000, 155, 1889–1902. [Google Scholar] [PubMed]
  40. Kankel, M.W.; Ramsey, D.E.; Stokes, T.L.; Flowers, S.K.; Haag, J.R.; Jeddeloh, J.A.; Riddle, N.C.; Verbsky, M.L.; Richards, E.J. Arabidopsis MET1 cytosine methyltransferase mutants. Genetics 2003, 163, 1109–1122. [Google Scholar] [PubMed]
  41. Rudenko, G.N.; Ono, A.; Walbot, V. Initiation of silencing of maize MuDR/Mu transposable elements. Plant J. 2003, 33, 1013–1025. [Google Scholar] [CrossRef] [PubMed]
  42. Chan, S.W.; Henderson, I.R.; Jacobsen, S.E. Gardening the genome: DNA methylation in Arabidopsis thaliana. Nat. Rev. Genet. 2005, 6, 351–360. [Google Scholar] [CrossRef] [PubMed]
  43. Zhong, S.L.; Fei, Z.J.; Chen, Y.R.; Zheng, Y.; Huang, M.Y.; Vrebalov, J.; Mcquinn, R.; Gapper, N.E.; Liu, B.; Xiang, J.; et al. Single-base resolution methylomes of tomato fruit development reveal epigenome modifications associated with ripening. Nat. Biotechnol. 2013, 31, 154–159. [Google Scholar] [CrossRef] [PubMed]
  44. An, Y.C.; Goettel, W.; Han, Q.; Bartels, A.; Liu, Z.R.; Xiao, W.Y. Dynamic changes of genome-wide DNA methylation during soybean seed development. Sci. Rep. 2017, 7, 12263. [Google Scholar] [CrossRef] [PubMed]
  45. Song, Q.; Zhang, T.; Stelly, D.M.; Chen, Z.J. Epigenomic and functional analyses reveal roles for epialleles in the loss of photoperiod sensitivity during domestication of allotetraploid cottons. Genome Biol. 2017, 18, 99. [Google Scholar] [CrossRef] [PubMed]
  46. Wang, W.S.; Qin, Q.; Sun, F.; Wang, Y.X.; Xu, D.D.; Li, Z.K.; Fu, B.Y. Genome-wide differences in DNA methylation changes in two contrasting rice genotypes in response to drought conditions. Front. Plant Sci. 2016, 7, 1675. [Google Scholar] [CrossRef] [PubMed]
  47. Lu, X.K.; Wang, X.G.; Chen, X.G.; Shu, N.; Wang, J.J.; Wang, D.L.; Wang, S.; Fan, W.L.; Guo, L.X.; Guo, X.N.; et al. Single-base resolution methylomes of upland cotton (Gossypium hirsutum L.) reveal epigenome modifications in response to drought stress. BMC Genom. 2017, 18, 297. [Google Scholar] [CrossRef] [PubMed]
  48. Xu, J.D.; Zhou, S.S.; Gong, X.Q.; Song, Y.; Van Nocker, S.; Ma, F.W.; Guan, Q.M. Single-base methylome analysis reveals dynamic epigenomic differences associated with water deficit in apple. Plant Biotechnol. J. 2018, 16, 672–687. [Google Scholar] [CrossRef] [PubMed]
  49. Bock, C. Analysing and interpreting DNA methylation data. Nat. Rev. Genet. 2012, 13, 705–719. [Google Scholar] [CrossRef] [PubMed]
  50. Meissner, A.; Mikkelsen, T.S.; Gu, H.C.; Wernig, M.; Hanna, J.; Sivachenko, A.; Zhang, X.L.; Bernstein, B.E.; Nusbaum, C.; Jaffe, D.B.; et al. Genome-scale DNA methylation maps of pluripotent and differentiated cells. Nature 2008, 454, 766–770. [Google Scholar] [CrossRef] [PubMed] [Green Version]
  51. Doi, A.; Park, I.; Wen, B.; Murakami, P.; Aryee, M.J.; Irizarry, R.; Herb, B.R.; Ladd-Acosta, C.; Rho, J.; Loewer, S.; et al. Differential methylation of tissue- and cancer-specific CpG island shores distinguishes human induced pluripotent stem cells, embryonic stem cells and fibroblasts. Nat. Genet. 2009, 41, 1350–1353. [Google Scholar] [CrossRef] [PubMed] [Green Version]
  52. Zhou, Y.; Wu, X.; Zhang, Z.; Gao, Z. Comparative proteomic analysis of floral color variegation in peach. Biochem. Biophys. Res. Commun. 2015, 464, 1101–1106. [Google Scholar] [CrossRef] [PubMed]
  53. Suzuki, K.; Suzuki, T.; Nakatsuka, T.; Dohra, H.; Yamagishi, M.; Matsuyama, K.; Matsuura, H. RNA-seq-based evaluation of bicolor tepal pigmentation in Asiatic hybrid lilies (Lilium spp.). BMC Genom. 2016, 17, 611. [Google Scholar] [CrossRef] [PubMed]
  54. Han, Y.; Vimolmangkang, S.; Soria-Guerra, R.E.; Korban, S.S. Introduction of apple ANR genes into tobacco inhibits expression of both CHI and DFR genes in flowers, leading to loss of anthocyanin. J. Exp. Bot. 2012, 63, 2437–2447. [Google Scholar] [CrossRef] [PubMed]
  55. Sun, Y.; Li, H.; Huang, J. Arabidopsis TT19 functions as a carrier to transport anthocyanin from the cytosol to tonoplasts. Mol. Plant 2012, 5, 387–400. [Google Scholar] [CrossRef] [PubMed]
  56. Zhou, H.; Peng, Q.; Zhao, J.B.; Owiti, A.; Ren, F.; Liao, L.; Wang, L.; Deng, X.B.; Jiang, Q.; Han, Y.P. Multiple R2R3-MYB transcription factors involved in the regulation of anthocyanin accumulation in peach flower. Front. Plant Sci. 2016, 7, 1557. [Google Scholar] [CrossRef] [PubMed]
  57. Zhou, Y.; Zhou, H.; Linwang, K.; Vimolmangkang, S.; Espley, R.V.; Wang, L.; Allan, A.C.; Han, Y.P. Transcriptome analysis and transient transformation suggest an ancient duplicated MYB transcription factor as a candidate gene for leaf red coloration in peach. BMC Plant Biol. 2014, 14, 388. [Google Scholar] [CrossRef] [PubMed]
  58. Qi, T.C.; Song, S.S.; Ren, Q.C.; Wu, D.W.; Huang, H.; Chen, Y.; Fan, M.; Peng, W.; Ren, C.M.; Xie, D.X. The Jasmonate-ZIM-Domain proteins interact with the WD-Repeat/bHLH/MYB complexes to regulate jasmonate-mediated anthocyanin accumulation and trichome initiation in Arabidopsis thaliana. Plant Cell 2011, 23, 1795–1814. [Google Scholar] [CrossRef] [PubMed]
  59. Zilberman, D.; Gehring, M.; Tran, R.K.; Ballinger, T.; Henikoff, S. Genome-wide analysis of Arabidopsis thaliana DNA methylation uncovers an interdependence between methylation and transcription. Nat. Genet. 2007, 39, 61–69. [Google Scholar] [CrossRef] [PubMed]
  60. Zhang, X.Y.; Yazaki, J.; Sundaresan, A.; Cokus, S.J.; Chan, S.W.L.; Chen, H.M.; Henderson, I.R.; Shinn, P.; Pellegrini, M.; Jacobsen, S. Genome-wide high-resolution mapping and functional analysis of DNA methylation in Arabidopsis. Cell 2006, 126, 1189–1201. [Google Scholar] [CrossRef] [PubMed]
  61. Madlung, A.; Comai, L. The effect of stress on genome regulation and structure. Ann. Bot. 2004, 94, 481–495. [Google Scholar] [CrossRef] [PubMed]
  62. Song, Q.; Decato, B.; Hong, E.E.; Zhou, M.; Fang, F.; Qu, J.H.; Garvin, T.; Kessler, M.; Zhou, J.; Smith, A.D. A reference methylome database and analysis pipeline to facilitate integrative and comparative epigenomics. PLoS ONE 2013, 8, e81148. [Google Scholar] [CrossRef] [PubMed]
  63. Cokus, S.J.; Feng, S.H.; Zhang, X.Y.; Chen, Z.G.; Merriman, B.; Haudenschild, C.D.; Pradhan, S.; Nelson, S.F.; Pellegrini, M.; Jacobsen, S.E. Shotgun bisulphite sequencing of the Arabidopsis genome reveals DNA methylation patterning. Nature 2008, 452, 215–219. [Google Scholar] [CrossRef] [PubMed]
  64. Feng, S.H.; Cokus, S.J.; Zhang, X.Y.; Chen, P.Y.; Bostick, M.; Goll, M.G.; Hetzel, J.; Jain, J.; Strauss, S.H.; Halpern, M.E.; et al. Conservation and divergence of methylation patterning in plants and animals. Proc. Natl. Acad. Sci. USA 2010, 107, 8689–8694. [Google Scholar] [CrossRef] [PubMed] [Green Version]
  65. Chodavarapu, R.K.; Feng, S.H.; Ding, B.; Simon, S.A.; Lopez, D.; Jia, Y.L.; Wang, G.L.; Meyers, B.C.; Jacobsen, S.E.; Pellegrini, M. Transcriptome and methylome interactions in rice hybrids. Proc. Natl. Acad. Sci. USA 2012, 109, 12040–12045. [Google Scholar] [CrossRef] [PubMed] [Green Version]
  66. Gent, J.I.; Ellis, N.A.; Guo, L.; Harkess, A.; Yao, Y.Y.; Zhang, X.Y.; Dawe, R.K. CHH islands: De novo DNA methylation in near-gene chromatin regulation in maize. Genome Res. 2013, 23, 628–637. [Google Scholar] [CrossRef] [PubMed]
  67. Schmitz, R.J.; He, Y.P.; Valdeslopez, O.; Khan, S.M.; Joshi, T.; Urich, M.A.; Nery, J.R.; Diers, B.W.; Xu, D.; Stacey, G.; et al. Epigenome-wide inheritance of cytosine methylation variants in a recombinant inbred population. Genome Res. 2013, 23, 1663–1674. [Google Scholar] [CrossRef] [PubMed] [Green Version]
  68. Kim, K.D.; Baidouri, M.E.; Abernathy, B.; Iwataotsubo, A.; Chavarro, C.; Gonzales, M.; Libault, M.; Grimwood, J.; Jackson, S.A. A comparative epigenomic analysis of polyploidy-derived genes in soybean and common bean. Plant Physiol. 2015, 168, 1433–1447. [Google Scholar] [CrossRef] [PubMed]
  69. Li, X.Y.; Wang, X.F.; He, K.; Ma, Y.Q.; Su, N.; He, H.; Stolc, V.; Tongprasit, W.; Jin, W.W.; Jiang, J.M.; et al. High-resolution mapping of epigenetic modifications of the rice genome uncovers interplay between DNA methylation, histone methylation, and gene expression. Plant Cell 2008, 20, 259–276. [Google Scholar] [CrossRef] [PubMed]
  70. Miura, A.; Nakamura, M.; Inagaki, S.; Kobayashi, A.; Saze, H.; Kakutani, T. An ArabidopsisjmjC domain protein protects transcribed genes from DNA methylation at CHG sites. EMBO J. 2009, 28, 1078–1086. [Google Scholar] [CrossRef] [PubMed]
  71. Wang, J.; Marowsky, N.C.; Fan, C. Divergence of gene body DNA methylation and evolution of plant duplicate genes. PLoS ONE 2014, 9, e110357. [Google Scholar] [CrossRef] [PubMed]
  72. Song, Q.X.; Lu, X.; Li, Q.T.; Chen, H.; Hu, X.Y.; Ma, B.; Zhang, W.K.; Chen, S.Y.; Zhang, J. Genome-wide analysis of DNA methylation in soybean. Mol. Plant 2013, 6, 1961–1974. [Google Scholar] [CrossRef] [PubMed]
  73. Chopra, S.; Brendel, V.; Zhang, J.; Axtell, J.D.; Peterson, T. Molecular characterization of a mutable pigmentation phenotype and isolation of the first active transposable element from Sorghum bicolor. Proc. Natl. Acad. Sci. USA 1999, 96, 15330–15335. [Google Scholar] [CrossRef] [PubMed]
  74. Feschotte, C.; Jiang, N.; Wessler, S.R. Plant transposable elements: Where genetics meets genomics. Nat. Rev. Genet. 2002, 3, 329–341. [Google Scholar] [CrossRef] [PubMed]
  75. Li, X.; Chen, L.; Hong, M.Y.; Zhang, Y.; Zu, F.; Wen, J.; Yi, B.; Ma, C.Z.; Shen, J.X.; Tu, J.X.; et al. A large insertion in bHLH transcription factor BrTT8 resulting in yellow seed coat in Brassica rapa. PLoS ONE 2012, 7, e44145. [Google Scholar] [CrossRef] [PubMed]
  76. Hong, L.L.; Qian, Q.; Tang, D.; Wang, K.J.; Li, M.; Cheng, Z.K. A mutation in the rice chalcone isomerase gene causes the golden hull and internode 1 phenotype. Planta 2012, 236, 141–151. [Google Scholar] [CrossRef] [PubMed]
  77. Clegg, M.T.; Durbin, M.L. Tracing floral adaptations from ecology to molecules. Nat. Rev. Genet. 2003, 4, 206–215. [Google Scholar] [CrossRef] [PubMed]
  78. Zabala, G.; Vodkin, L. The wp mutation of Glycine max carries a gene-fragment-rich transposon of the CACTA superfamily. Plant Cell 2005, 17, 2619–2632. [Google Scholar] [CrossRef] [PubMed]
  79. Choi, J.; Hoshino, A.; Park, K.; Park, I.; Iida, S. Spontaneous mutations caused by a Helitron transposon, Hel-It1, in morning glory, Ipomoea tricolor. Plant J. 2007, 49, 924–934. [Google Scholar] [CrossRef] [PubMed]
  80. Park, K.; Ishikawa, N.; Morita, Y.; Choi, J.; Hoshino, A.; Iida, S. A bHLH regulatory gene in the common morning glory, Ipomoea purpurea, controls anthocyanin biosynthesis in flowers, proanthocyanidin and phytomelanin pigmentation in seeds, and seed trichome formation. Plant J. 2007, 49, 641–654. [Google Scholar] [CrossRef] [PubMed]
  81. Mirouze, M.; Vitte, C. Transposable elements, a treasure trove to decipher epigenetic variation: Insights from Arabidopsis and crop epigenomes. J. Exp. Bot. 2014, 65, 2801–2812. [Google Scholar] [CrossRef] [PubMed]
  82. Kim, K.D.; Baidouri, M.E.; Jackson, S.A. Accessing epigenetic variation in the plant methylome. Brief. Funct. Genom. 2014, 13, 318–327. [Google Scholar] [CrossRef] [PubMed] [Green Version]
  83. Fujimoto, R.; Kinoshita, Y.; Kawabe, A.; Kinoshita, T.; Takashima, K.; Nordborg, M.; Nasrallah, M.E.; Shimizu, K.K.; Kudoh, H.; Kakutani, T. Evolution and control of imprinted FWA Genes in the genus Arabidopsis. PLoS Genet. 2008, 4, e1000048. [Google Scholar] [CrossRef] [PubMed] [Green Version]
  84. Tsugane, K.; Maekawa, M.; Takagi, K.; Takahara, H.; Qian, Q.; Eun, C.H.; Iida, S. An active DNA transposon nDart causing leaf variegation and mutable dwarfism and its related elements in rice. Plant J. 2006, 45, 46–57. [Google Scholar] [CrossRef] [PubMed]
  85. Hashimoto, F.; Tanaka, M.; Maeda, H.; Shimizu, K.; Sakata, Y. Characterization of cyanic flower color of Delphinium cultivars. J. Jpn. Soc. Hortic. Sci. 2000, 69, 428–434. [Google Scholar] [CrossRef]
  86. Zhang, J.; Wang, L.S.; Gao, J.M.; Xu, Y.J.; Li, L.F.; Li, C.H. Rapid separation and identification of anthocyanins from flowers of Viola yedoensis and V. prionantha by high-performance liquid chromatography-photodiode array detection-electrospray ionisationmass spectrometry. Phytochem. Anal. 2012, 23, 16–22. [Google Scholar] [CrossRef] [PubMed]
  87. Bolger, A.M.; Lohse, M.; Usadel, B. Trimmomatic: A flexible trimmer for Illumina sequence data. Bioinformatics 2014, 30, 2114–2120. [Google Scholar] [CrossRef] [PubMed]
  88. Krueger, F.; Andrews, S. Bismark: A flexible aligner and methylation caller for Bisulfite-Seq applications. Bioinformatics 2011, 27, 1571–1572. [Google Scholar] [CrossRef] [PubMed]
  89. Langmead, B.; Salzberg, S.L. Fast gapped-read alignment with Bowtie. Nat. Methods 2012, 9, 357–359. [Google Scholar] [CrossRef] [PubMed]
  90. Wang, L.; Zhang, J.; Duan, J.L.; Gao, X.X.; Zhu, W.; Lu, X.Y.; Yang, L.; Zhang, J.; Li, G.Q.; Ci, W.M.; et al. Programming and inheritance of parental DNA methylomes in mammals. Cell 2014, 157, 979–991. [Google Scholar] [CrossRef] [PubMed]
  91. Lister, R.; Mukamel, E.A.; Nery, J.R.; Urich, M.A.; Puddifoot, C.A.; Johnson, N.D.; Lucero, J.; Huang, Y.; Dwork, A.J.; Schultz, M.D.; et al. Global epigenomic reconfiguration during mammalian brain development. Science 2013, 341, 1237905. [Google Scholar] [CrossRef] [PubMed]
  92. Krzywinski, M.; Schein, J.E.; Birol, I.; Connors, J.M.; Gascoyne, R.D.; Horsman, D.; Jones, S.J.M.; Marra, M.A. Circos: An information aesthetic for comparative genomics. Genome Res. 2009, 19, 1639–1645. [Google Scholar] [CrossRef] [PubMed] [Green Version]
  93. Lister, R.; Pelizzola, M.; Dowen, R.H.; Hawkins, R.D.; Hon, G.; Tontifilippini, J.; Nery, J.R.; Lee, L.K.; Ye, Z.; Ngo, Q.; et al. Human DNA methylomes at base resolution show widespread epigenomic differences. Nature 2009, 462, 315–322. [Google Scholar] [CrossRef] [PubMed] [Green Version]
  94. Smallwood, S.A.; Lee, H.J.; Angermueller, C.; Krueger, F.; Saadeh, H.; Peat, J.R.; Andrews, S.; Stegle, O.; Reik, W.; Kelsey, G. Single-cell genome-wide bisulfite sequencing for assessing epigenetic heterogeneity. Nat. Methods 2014, 11, 817–820. [Google Scholar] [CrossRef] [PubMed] [Green Version]
  95. Feng, H.; Conneely, K.N.; Wu, H.A. Bayesian hierarchical model to detect differentially methylated loci from single nucleotide resolution sequencing data. Nucleic Acids Res. 2014, 42, e69. [Google Scholar] [CrossRef] [PubMed]
  96. Wu, H.; Xu, T.L.; Feng, H.; Chen, L.; Li, B.; Yao, B.; Qin, Z.H.; Jin, P.; Conneely, K.N. Detection of differentially methylated regions from whole-genome bisulfite sequencing data without replicates. Nucleic Acids Res. 2015, 43, e141. [Google Scholar] [CrossRef] [PubMed]
  97. Park, Y.; Wu, H. Differential methylation analysis for BS-seq data under general experimental design. Bioinformatics 2016, 32, 1446–1453. [Google Scholar] [CrossRef] [PubMed] [Green Version]
  98. Young, M.D.; Wakefield, M.J.; Smyth, G.K.; Oshlack, A. Gene ontology analysis for RNA-seq: Accounting for selection bias. Genome Biol. 2010, 11, 1–12. [Google Scholar] [CrossRef] [PubMed]
  99. Kanehisa, M.; Araki, M.; Goto, S.; Hattori, M.; Hirakawa, M.; Itoh, M.; Katayama, T.; Kawashima, S.; Okuda, S.; Tokimatsu, T.; et al. KEGG for linking genomes to life and the environment. Nucleic Acids Res. 2007, 36, 480–484. [Google Scholar] [CrossRef] [PubMed]
  100. Mao, X.; Cai, T.; Olyarchuk, J.G.; Wei, L. Automated genome annotation and pathway identification using the KEGG Orthology (KO) as a controlled vocabulary. Bioinformatics 2005, 21, 3787–3793. [Google Scholar] [CrossRef] [PubMed] [Green Version]
  101. Kim, D.; Langmead, B.; Salzberg, S.L. HISAT: A fast spliced aligner with low memory requirements. Nat. Methods 2015, 12, 357–360. [Google Scholar] [CrossRef] [PubMed]
  102. Trapnell, C.; Williams, B.A.; Pertea, G.; Mortazavi, A.; Kwan, G.; Van Baren, M.J.; Salzberg, S.L.; Wold, B.J.; Pachter, L. Transcript assembly and quantification by RNA-Seq reveals unannotated transcripts and isoform switching during cell differentiation. Nat. Biotechnol. 2010, 28, 511–515. [Google Scholar] [CrossRef] [PubMed] [Green Version]
  103. Anders, S.; Huber, W. Differential expression analysis for sequence count data. Genome Biol. 2010, 11, 1–12. [Google Scholar] [CrossRef] [PubMed]
  104. Anders, S.; Huber, W. Differential Expression of RNA-Seq Data at the Gene Level-the DESeq Package; European Molecular Biology Laboratory (EMBL): Heidelberg, Germany, 2012. [Google Scholar]
  105. Pérez-Rodríguez, P.; Rianopachon, D.M.; Correa, L.G.G.; Rensing, S.A.; Kersten, B.; Muellerroeber, B. PlnTFDB: Updated content and new features of the plant transcription factor database. Nucleic Acids Res. 2010, 38, 822–827. [Google Scholar] [CrossRef] [PubMed]
  106. Jin, J.; Zhang, H.; Kong, L.; Gao, G.; Luo, J. PlantTFDB 3.0: A portal for the functional and evolutionary study of plant transcription factors. Nucleic Acids Res. 2014, 42, 1182–1187. [Google Scholar] [CrossRef] [PubMed]
  107. Zheng, Y.; Jiao, C.; Sun, H.; Rosli, H.G.; Pombo, M.A.; Zhang, P.; Banf, M.; Dai, X.; Martin, G.B.; Giovannoni, J.J.; et al. iTAK: A program for genome-wide prediction and classification of plant transcription factors, transcriptional regulators, and protein kinases. Mol. Plant 2016, 9, 1667–1670. [Google Scholar] [CrossRef] [PubMed]
  108. Wang, M.J.; Yuan, D.J.; Tu, L.L.; Gao, W.H.; He, Y.H.; Hu, H.Y.; Wang, P.C.; Liu, N.; Lindsey, K.; Zhang, X.L. Long noncoding RNAs and their proposed functions in fibre development of cotton (Gossypium spp.). New Phytol. 2015, 207, 1181–1197. [Google Scholar] [CrossRef] [PubMed] [Green Version]
  109. Ng, C.W.; Yildirim, F.; Yap, Y.S.; Dalin, S.; Matthews, B.J.; Velez, P.J.; Labadorf, A.; Housman, D.E.; Fraenkel, E. Extensive changes in DNA methylation are associated with expression of mutant huntingtin. Proc. Natl. Acad. Sci. USA 2013, 110, 2354–2359. [Google Scholar] [CrossRef] [PubMed] [Green Version]
  110. Zhou, H.R.; Zhang, F.F.; Ma, Z.Y.; Huang, H.W.; Jiang, L.; Cai, T.; Zhu, J.K.; Zhang, C.Y.; He, X.J. Folate polyglutamylation is involved in chromatin silencing by maintaining global DNA methylation and histone H3K9 dimethylation in Arabidopsis. Plant Cell 2013, 25, 2545–2559. [Google Scholar] [CrossRef] [PubMed]
  111. Yang, I.V.; Pedersen, B.S.; Rabinovich, E.I.; Hennessy, C.E.; Davidson, E.J.; Murphy, E.; Guardela, B.J.; Tedrow, J.; Zhang, Y.Z.; Singh, M.K.; et al. Relationship of DNA methylation and gene expression in idiopathic pulmonary fibrosis. Am. J. Respir. Crit. Care Med. 2014, 190, 1263–1272. [Google Scholar] [CrossRef] [PubMed]
  112. Kretzmer, H.; Bernhart, S.H.; Wang, W.; Haake, A.; Weniger, M.A.; Bergmann, A.K.; Betts, M.J.; Carrillodesantapau, E.; Doose, G.; Gutwein, J.; et al. DNA methylome analysis in Burkitt and follicular lymphomas identifies differentially methylated regions linked to somatic mutation and transcriptional control. Nat. Genet. 2015, 47, 1316–1325. [Google Scholar] [CrossRef] [PubMed] [Green Version]
Figure 1. Color phenotypes and petal-tissue anthocyanin contents of flowers of Prunus mume “Danban Tiaozhi” collected in this study. (a) Examples of the six types of sampled petals. Samples WT1 and RT1 were respectively collected from white and red petals of bicolored flowers; WT2 and RT2 were collected from flowers with only white or red petals, respectively; WT3 and RT3 were collected from flowers on branches with only white flowers and only red flowers, respectively. (b) Anthocyanin content (mg/g fresh weight) of white petal tissue (WT) and red petal tissue (RT) samples. Cy3,5G, cyanidin 3,5-O-diglucoside; Cy3G, cyanidin 3-O-diglucoside; Pn3G, peonidin 3-O-glucoside.
Ijms 19 02315 g001
Figure 2. Genome sequencing coverage and methylation percentages and correlations between samples. WT1, WT2, and WT3 represent white petal tissue samples 1, 2, and 3, respectively. RT1, RT2, and RT3 represent red petal tissue samples 1, 2 and 3, respectively. (a) Distribution of the coverage of the six sequenced genomes. The x-axis represents sequencing depth, and the y-axis indicates the percentage of bases covered. (b) Percentage of methylated sites by sequence context (mCG, mCHG, and mCHH) relative to total methylated sites within each sample genome. (c) Pairwise correlations of methylation levels by sequence context (mCG, mCHG and mCHH) between sequenced genomes.
Ijms 19 02315 g002
Figure 3. Epigenomic landscape and distribution of DNA methylation in white petal tissues (WT) and red petal tissues (RT) of Prunus mume. (a) Circos plots of chromosomes in P. mume WT and RT samples. The track order (from outside to inside) is as follows: (1–3) methylation density by sequence context (mCG, mCHG, and mCHH); (4) transposable element (TE) density; (5) gene density; and (6) number of reads generated by transcriptome sequencing. (b) Circos plots of differences in DNA methylation levels by methylation context (mCG, mCHG, and mCHH) in WT (outer track) and RT (inner track) genomes. The middle track in each plot indicates the degree of DNA methylation-level differences. (c) Distribution of DNA methylation levels within gene functional regions. The x and y-axes indicate gene functional domains and methylation levels, respectively. (d) Distribution of DNA methylation levels within gene-body domains and 2-kb upstream and downstream regions (TSS, transcriptional start site; TES, transcriptional end site). The x and y-axes indicate gene functional domains and methylation levels, respectively.
Ijms 19 02315 g003
Figure 4. Distribution, methylation level, and predicted genes of differentially methylated regions (DMRs) in white petal tissues (WT) and red petal tissues (RT) samples. (a) Circos plots of CG, CHG, and CHH DMRs and transposable element (TE) and gene densities on each chromosome of Prunus mume. Track order (outside to inside) is as follows: scatter plot of hypermethylation (Hyper); TE density (TE); gene density (Gene); and scatter plot of hypermethylation (Hypo). Red, blue, and purple dots indicate CG, CHG, and CHH DMRs, respectively. (b) Distribution of CG, CHG, and CHH DMRs within gene functional regions. TSS, transcriptional start site; TES, transcriptional end site. (c) Heat maps of methylation levels of CG, CHG, and CHH DMRs. (d) Venn diagrams of predicted genes linked with CG, CHG, and CHH DMRs. “Genebody” and “promoter” indicate predicted genes anchored within gene body and promoter regions, respectively.
Ijms 19 02315 g004
Figure 5. Analysis of differentially expressed genes (DEGs). (a) Detection and distribution of genes differentially expressed between white petal tissues (WT) and red petal tissues (RT). Green and red dots indicate upregulated and downregulated DEGs, respectively. (b) Cluster dendrogram of DEGs. (c) Kyoto Encyclopedia of Genes and Genomes (KEGG) pathway enrichment of upregulated and downregulated DEGs.
Ijms 19 02315 g005
Figure 6. Distributions of methylation levels within gene bodies and their 2-kb upstream and downstream regions. Genes were classified into four groups according to their expression levels: no expression (pink; FPKM <1); low expression (green; 1≤ FPKM < FPKM_25%); medium expression (blue; FPKM_25% ≤ FPKM < FPKM_75%); and high expression (red; FPKM ≥ FPKM_75%). FPKM stands for fragments per kilobase of exon per million fragments mapped, and FPKM_25% and FPKM_75% refer to values at the boundary of the 25th and 75th percentiles of expression levels, respectively. Next, the different gene regions (gene body and 2-kb upstream and downstream) were divided into 50 bins, and the methylation levels of each were averaged. WT and RT indicate white petal tissues and red petal tissues, respectively. The x and y-axes represent gene body regions and DNA methylation levels by sequence context (mCG, mCHG, and mCHH), respectively. (a,b) Distributions of methylation levels within gene bodies and 2-kb upstream and downstream regions in samples WT [(a); FPKM_25% = 4.60, FPKM_75% = 45.31] and RT [(b); FPKM_25% = 4.91, FPKM_75% = 45.62].
Ijms 19 02315 g006
Figure 7. Frequencies of expressed genes anchored by methylation sites within gene bodies and promoters. For each methylation sequence context (mCG, mCHG and mCHH), expressed genes were divided into five groups according to methylation level: group 1 (red; methylation level < level_20%); group 2 (yellow-green; level_20% ≤ methylation level < level_40%); group 3 (green; level_40% ≤ methy_level < level_60%); group 4 (blue; level_60% ≤ methy_level < level_80%); group 5 (pink; methy_level ≥ level_80%). Level_20%, _40%, _60%, and _80% represent values at the boundaries of the 20th, 40th, 60th, and 80th percentiles of methylation levels. WT and RT indicate white petal tissues and red petal tissues, respectively. The x and y-axes represent gene expression levels and gene frequencies, respectively.
Ijms 19 02315 g007
Figure 8. Methylation levels of differentially expressed genes (DEGs) by sequence context (mCG, mCHG, and mCHH) and gene region in white petal tissues (WT) and red petal tissues (RT). The terms “all”, “up”, and “down” indicate all, upregulated, and downregulated DEGs, respectively. DNA methylation levels within gene bodies and promoters of genes differentially expressed between WT and RT are shown (“WT vs. RT. Genebody” and “WT vs. RT. Promoter”, respectively).
Ijms 19 02315 g008
Figure 9. Distributions of differential expression of differentially methylated region (DMR)-related genes between white petal tissues (WT) and red petal tissues (RT). CG, CHG, and CHH refer to CG-DMR, CHG-DMR, and CHH-DMR-related genes, respectively. The x-axis indicates methylation-level differences, and the y-axis indicates gene differential expression levels. Red dots represent hypermethylated (hypomethylated) DMR-related genes associated with downregulated (upregulated) expression. Blue dots represent hypomethylated (hypermethylated) DMR-related genes associated with upregulated (downregulated) expression.
Ijms 19 02315 g009
Figure 10. Combined maps of correlations between differentially methylated region (DMR)-related genes and expression levels. Each of the 12 subfigures is divided into four sections: upper left, box plot of DMR-related gene expression; upper right, scatter plot of DMR-related gene expression vs. methylation level; bottom left, comparison and correlation statistics; bottom right, box plot of DMR-related gene methylation level. WT and RT indicate white petal tissues (gray) and red petal tissues (blue), respectively.
Ijms 19 02315 g010
Figure 11. Venn diagram and KEGG pathway enrichment of differentially methylated region (DMR)-related differentially expressed genes (DEGs). DEGs are anchored by DMRs within gene body regions. DMR_Hypergenes and DMR_Hypogenes indicate hypermethylated and hypomethylated DMR-related genes, respectively. DEG_downgenes and DEG_upgenes indicate downregulated and upregulated DEGs, respectively. CG.DMRgenes, CHG.DMRgenes, and CHH.DMRgenes refer to CG-DMR, CHG-DMR, and CHH-DMR-related genes, respectively.
Ijms 19 02315 g011
Figure 12. Methylation of transposable elements (TEs) in the genomes of Prunus mume. (a) Distribution of TEs density within gene body and 2-kb upstream and downstream domains. (b) Distribution of methylated TEs according to sequence context (mCG, mCHG, and mCHH) in intergenic (red) and intragenic (blue) domains. WT and RT indicate white petal tissues and red petal tissues, respectively. Class I and class II refer to class-I and class-II TEs, respectively. (c) Genome-wide length percentages of differentially methylated regions (DMRs) within TEs and other different functional regions (leftmost bar) and the methylome-wide percentage distributions of DMRs with different methylation types in different functional regions.
Ijms 19 02315 g012
Table 1. Methylation of C contexts mapping to the reference genome. mC/C: methylated cytosine to total cytosine.
C SitemC
(mC/C)
CGmCG
(mCG/CG)
CHGmCHG
(mCHG/CHG)
CHHmCHH
(mCHH/CHH)
WT1823680879302812
11.29%
83359743193016
38.30%
116646232275905
19.51%
623674903833891
6.14%
WT28236808711706910
14.21%
83359743153580
37.83%
116646232396865
20.54%
623674906156465
9.87%
WT38236808710982193
13.33%
83359743015038
36.16%
116646232258108
19.35%
623674905709047
9.15%
WT-average8236808710663972
12.94%
83359743120545
37.43%
116646232310293
19.80%
623674905233134
8.39%
RT18236808711609228
14.09%
83359743086648
37.02%
116646232350640
20.15%
623674906171940
9.89%
RT28236808711991003
14.55%
83359743170368
38.03%
116646232434099
20.86%
623674906386536
10.24%
RT38236808712222792
14.83%
83359743411185
40.92%
116646232580335
22.12%
623674906231272
9.99%
RT-average8236808711941008
14.49%
83359743222734
38.66%
116646232455025
21.04%
623674906263249
10.04%
Average8236808711302490
13.72%
83359743171639
38.04%
116646232382659
20.42%
623674905748192
9.21%
“WT1”, “WT2” and “WT3” represent the white petal tissues; “RT1”, “RT2” and “RT3” represent the red petal tissues.

