Article

Transcriptome Analysis of Novosphingobium pentaromativorans US6-1 Reveals the Rsh Regulon and Potential Molecular Mechanisms of N-acyl-l-homoserine Lactone Accumulation

Zhejiang Provincial Key Laboratory of Organic Pollution Process and Control, Department of Environmental Science, College of Environmental and Resource Sciences, Zhejiang University, Hangzhou 310027, China
*
Author to whom correspondence should be addressed.
Int. J. Mol. Sci. 2018, 19(9), 2631; https://doi.org/10.3390/ijms19092631
Submission received: 4 August 2018 / Revised: 27 August 2018 / Accepted: 2 September 2018 / Published: 5 September 2018

Abstract

:
In most bacteria, a bifunctional Rsh responsible for (p)ppGpp metabolism is the key player in stringent response. To date, no transcriptome-wide study has been conducted to investigate the Rsh regulon, and the molecular mechanism of how Rsh affects the accumulation of N-acyl-l-homoserine lactone (AHL) remains unknown in sphingomonads. In this study, we identified an rshUS6–1 gene by sequence analysis in Novosphingobium pentaromativorans US6-1, a member of the sphingomonads. RNA-seq was used to determine transcription profiles of the wild type and the ppGpp-deficient rshUS6–1 deletion mutant (∆rsh). There were 1540 genes in the RshUS6–1 regulon, including those involved in common traits of sphingomonads such as exopolysaccharide biosynthesis. Furthermore, both RNA-seq and quantitative real-time polymerase chain reaction (qRT-PCR) showed essential genes for AHL production (novI and novR) were positively regulated by RshUS6–1 during the exponential growth phase. A degradation experiment indicated the reason for the AHL absence in ∆rsh was unrelated to the AHL degradation. According to RNA-seq, we proposed σE, DksA, Lon protease and RNA degradation enzymes might be involved in the RshUS6–1-dependent expression of novI and novR. Here, we report the first transcriptome-wide analysis of the Rsh regulon in sphingomonads and investigate the potential mechanisms regulating AHL accumulation, which is an important step towards understanding the regulatory system of stringent response in sphingomonads.

1. Introduction

Bacteria need to co-ordinate cellular responses to unfavorable environmental conditions [1]. One major strategy to cope with environmental stress is the activation of stringent response, a global regulatory system [2]. The stringent response is activated by (p)ppGpp (guanosine tetraphosphate and guanosine pentaphosphate) [3]. The proteins from the RelA/SpoT (Rsh) family are the key players, synthesizing (p)ppGpp from ATP and either GTP or GDP, and degrading (p)ppGpp to pyrophosphate and either GTP or GDP. Most species in Betaproteobacteria and Gammaproteobacteria contain two multi-domain Rsh enzymes, RelA and SpoT, while the majority of bacteria contain only a single Rsh protein [3]. A number of studies have demonstrated that Rsh affected the expression of a wide range of genes involved in physiological processes in bacteria such as Escherichia coli, Staphylococcus aureus and Rhizobium etli [4,5,6]. In R. etli, there were 834 genes in the Rsh regulon involved in various cellular processes such as transcriptional regulation, signal transduction, production of sigma factors and non-coding RNAs [6]. Sphingomonads, a group of Alphaproteobacteria, are widely distributed in polluted and oligotrophic environments [7,8]. Sphingomonads have drawn much attention for their traits, including the pronounced abilities of degrading a wide range of recalcitrant natural and xenobiotic compounds such as polycyclic aromatic hydrocarbons (PAH) [7,9], the substitution of sphingolipids for lipopolysaccharide in their outer membrane [10,11] as well as their production of exopolysaccharides (EPS) [12,13]. The genomes of sphingomonads contain one single rsh gene, which responds to environmental stress as in other bacteria [14]. However, to date, no transcriptome-wide study has been conducted to investigate Rsh target genes in any strain of sphingomonads.
One of the physiological activities regulated by Rsh is quorum sensing (QS), a mechanism of intercellular communication. In Gram-negative bacteria, the main QS signal is N-acyl-l-homoserine lactone (AHL), which is produced by LuxI-type synthases. LuxR-type receptors can bind to AHL and then stimulate the expression of luxI homologs [15]. AHL accumulation is dependent on RelA/SpoT homologs in various bacteria such as Pseudomonas aeruginosa [16,17,18] and R. etli [19], and AHL degradation is regulated by (p)ppGpp via AttM in Agrobacterium tumefaciens [20,21]. In P. aeruginosa, deletion of both relA and spoT resulted in increased levels of 4-hydroxyl-2-heptylquinoline and 3,4-dihydroxy-2-heptylquinoline via up-regulated pqsA and pqsR expression and decreased levels of butanoyl-homoserine lactone and 3-oxo-dodecanoyl-homoserine lactone via down-regulated rhlI, rhlR, lasI, and lasR expression [18]. In recent years, an increasing number of strains in sphingomonads which produced AHLs have been isolated [22]. The comparative genomic analyses of 62 sphingomonads genomes showed that the canonical luxI/R-type QS network was widespread within sphingomonads [23]. In the previous study, a Tn5 mutant of Novosphingobium sp. Rr 2-17, deficient in AHL accumulation, was found to have an insertion in an rsh gene, suggesting that QS was under the regulation of Rsh in Novosphingobium, a member of sphingomonads. However, the potential molecular mechanism remains unknown.
Novosphingobium pentaromativorans US6-1, which has been shown to have potential in aromatic hydrocarbons bioremediation, is a type strain belonging to sphingomonads [24]. Its genome sequencing has been completed and the genome database is accessible from the public NCBI database [25]. In this study, we identified an rsh gene in N. pentaromativorans US6-1 (annotated as rshUS6–1) by sequence analysis. The wild-type strain produced ppGpp in static culture medium while rshUS6–1 deletion mutant (∆rsh) did not. Therefore, the transcription profiles of the wild type and ∆rsh grown in static medium was determined by RNA-seq to identify the RshUS6–1 regulon. Furthermore, we determined whether AHL accumulation was affected by RshUS6–1 and investigated the potential molecular mechanisms via quantitative real-time polymerase chain reaction (qRT-PCR), transcriptome analysis and an AHL degradation experiment. These results are useful to understand the regulatory system of stringent response in sphingomonads.

2. Results and Discussion

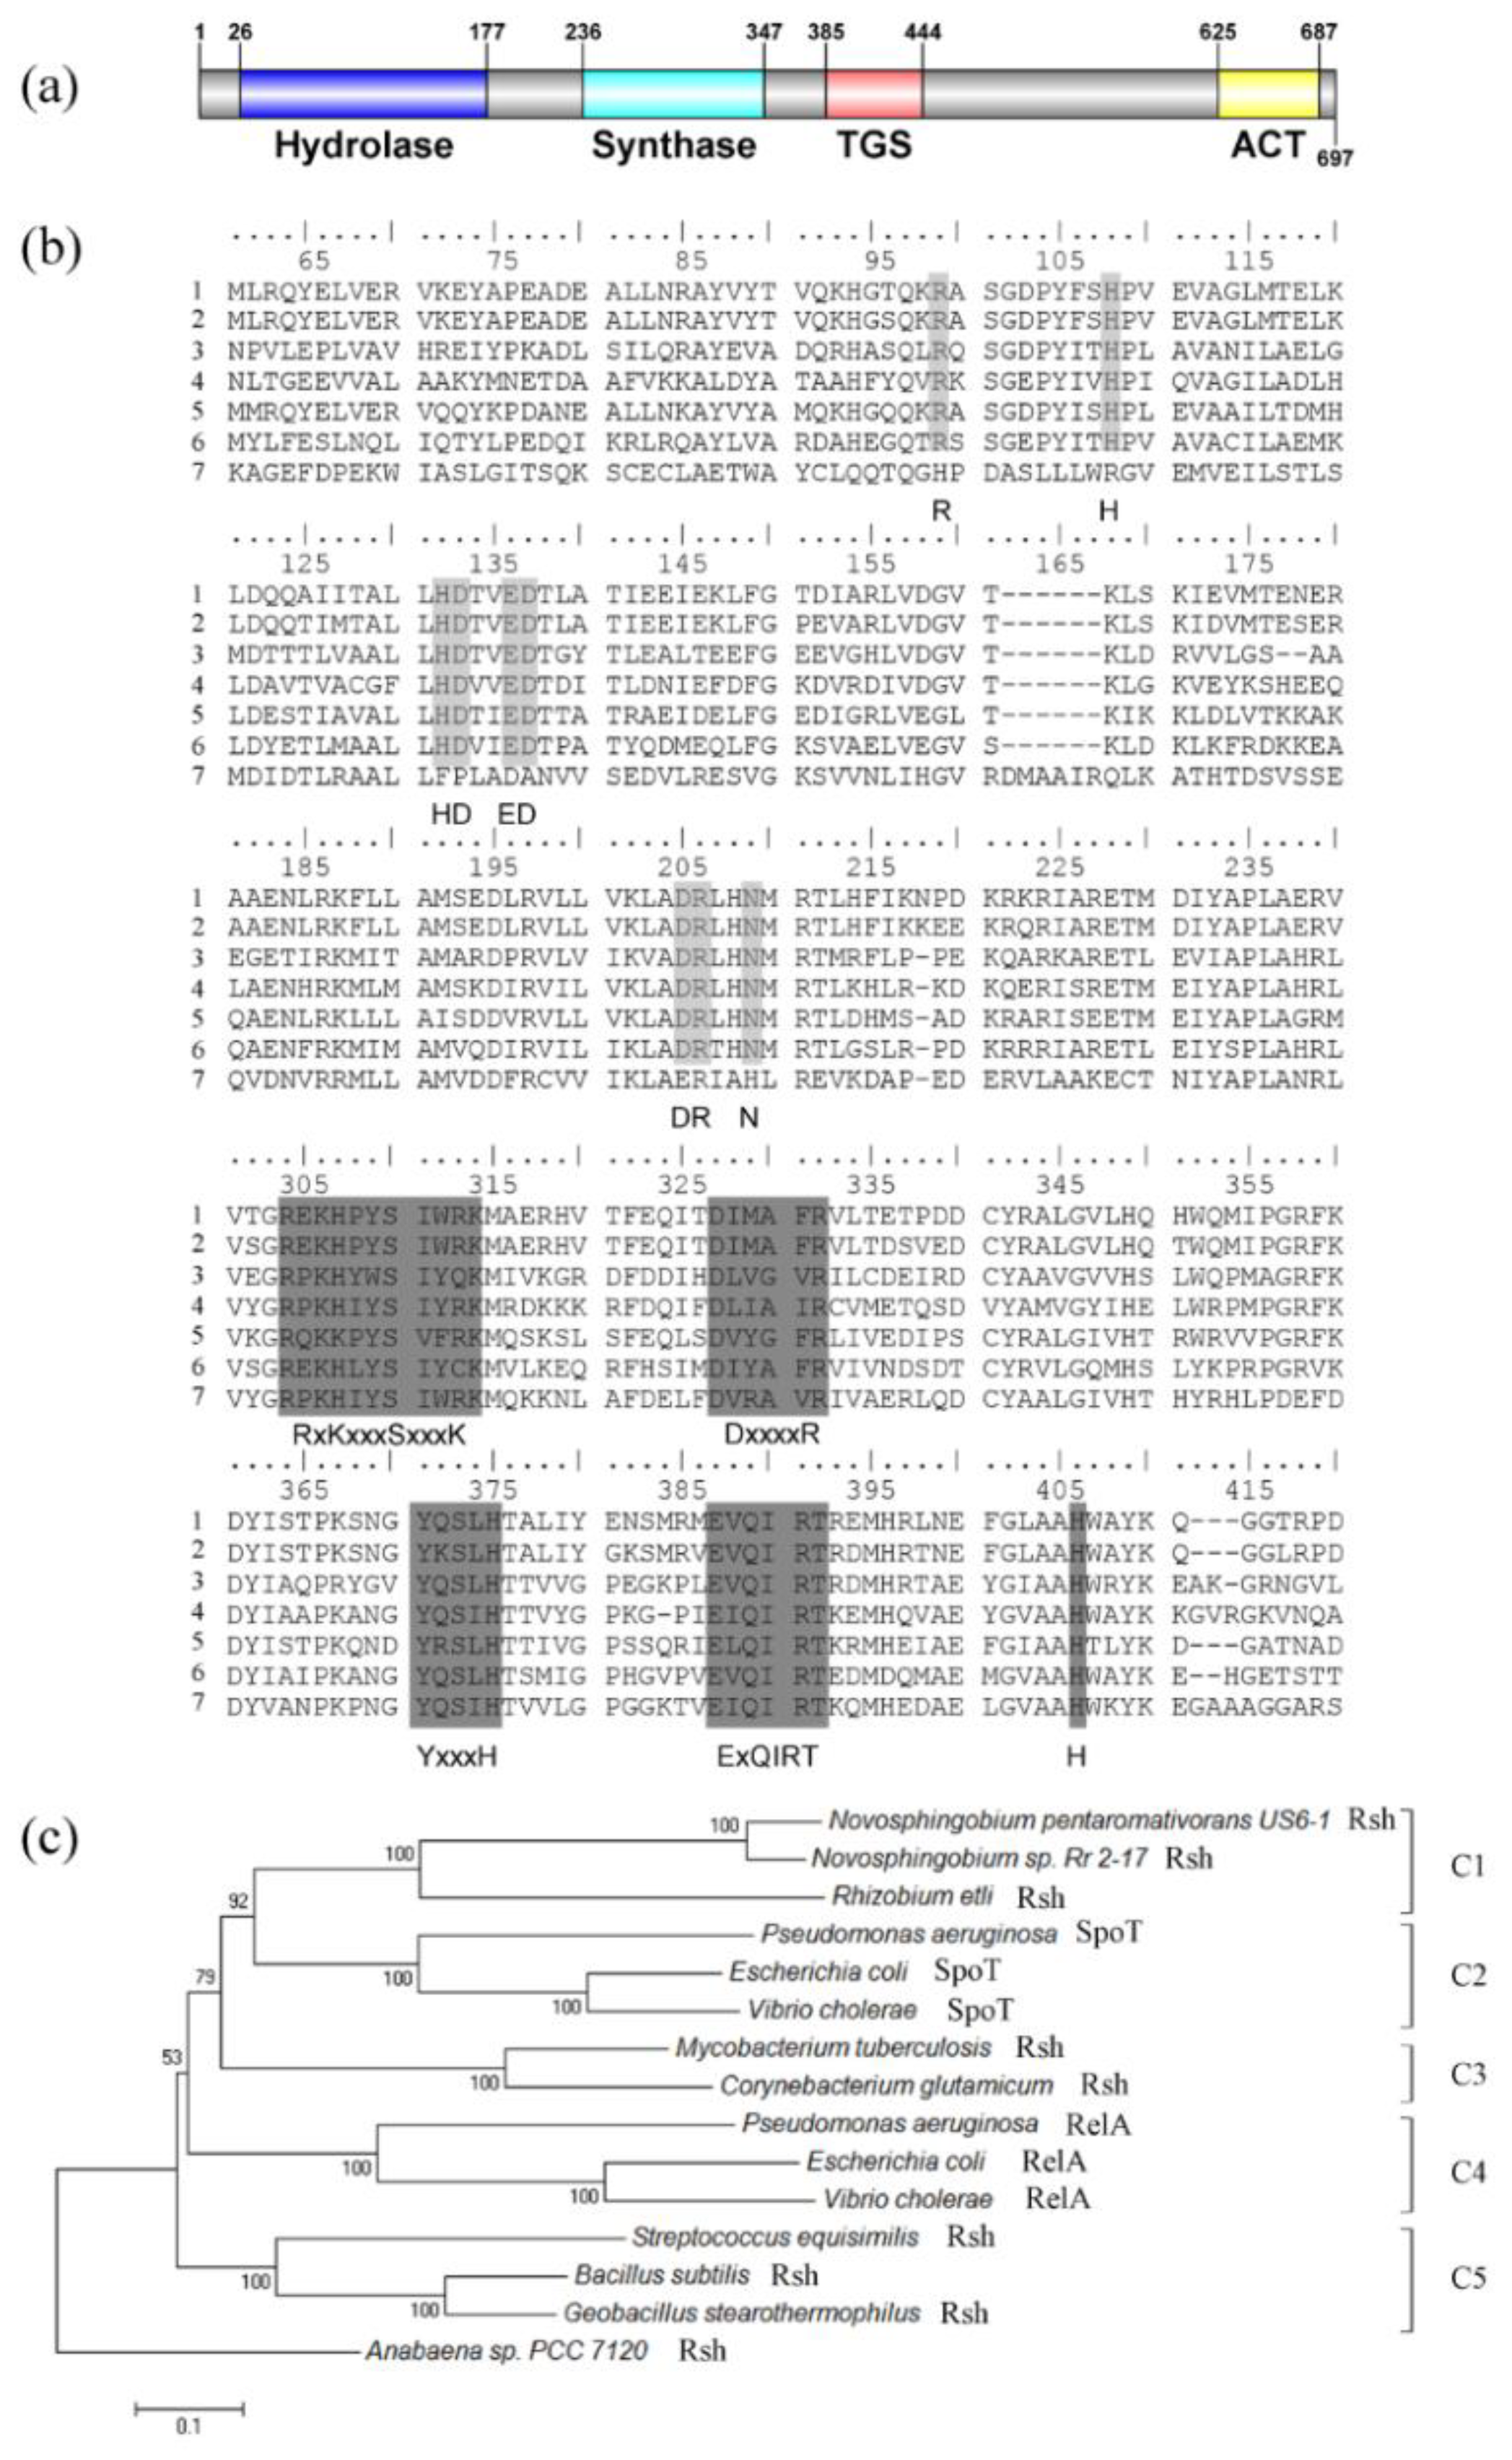
2.1. Sequence Analysis of RshUS6–1 Protein

The open reading frame of the full-length rshUS6–1 gene (accession number WP_007011921) was 2094 nucleotides in length. RshUS6–1 contained the nitrogen-terminal metal-dependent hydrolase domain (HD) (amino acids 26–177) and synthetase domain (Syn) (amino acids 236–347). The carboxy-terminal domain of RshUS6–1 consisted of the TGS domain (for: Thr-tRNA synthetase, GTPase and SpoT) (amino acids 385–444) and ACT domain (for: aspartate kinase, chorismate mutase and T protein) (amino acids 625–687) (Figure 1a). These four domains are commonly present in Rsh [3].
RshUS6–1 displayed high sequence similarity to Rsh proteins whose functions had been identified in other strains [32,33,34,35,36]. The identities of RshUS6–1 with RshRr2–17, RshMtb, RshSeq, RshRet, SpoTEcoli and RelAEcoli were 88%, 37%, 38%, 43%, 38% and 30% respectively. In the HD domain (Figure 1b), RshUS6–1 contained six motifs, which are predicted to be essential for (p)ppGpp hydrolysis [26]. RelAEcoli was more divergent in these motifs, which was consistent with its loss of hydrolase activity. In the Syn domain (Figure 1b), RshUS6–1 also contained five conserved motifs that were proved structurally and biochemically important for (p)ppGpp synthetase activity [26].
The phylogenic analysis of RelA/SpoT homologs was performed (Figure 1c). The result showed that there was a clear separation of the RelA/SpoT families, forming five clusters: C1 for Rsh in Alphaproteobacteria, C2 for SpoT in Gammaproteobacteria, C3 for Rsh in Actinobacteria, C4 for RelA in Gammaproteobacteria, C5 for Rsh in Firmicutes. RshUS6–1 was grouped with RshRr2–17 in C1. These data suggested that RshUS6–1 possessed the sequence required for the (p)ppGpp synthetase and hydrolase activities.

2.2. N-Acyl-l-homoserine Lactone (AHL) Accumulation in the Cross Feeding Assay and Extract Assay

To determine the effect of RshUS6–1 on the AHL accumulation, cross-feeding and extract assays were performed. The results of the cross-feeding and extract assays were consistent (Figure 2). In the cross-feeding assay, strains were grown as biofilm and only US6-1 showed AHL accumulation. In the extract assay, US6-1 accumulated AHL signals in static cultures while no AHL was detected in ∆rsh during the whole growth period. To verify that the rshUS6–1 deletion was responsible for the absence of AHL, a rshUS6–1 complementation strain ∆rsh (pCM62-rsh) was created. ∆rsh (pCM62-rsh) restored the same phenotype as the wild-type strain, suggesting that RshUS6–1 was required for the AHL accumulation. In the extract assay, the AHL molecules in the extract of culture would diffuse through the soft agar to the reporter strain A. tumefaciens A136, and activate the traI-lacZ fusion. Therefore, we could determine the quantity of AHL molecules by the diffusion area indicated by the diameter of the blue coloration in the presence of 5-bromo-4-chloro-3-indolyl-β-d-galactopyranoside (X-Gal) [37]. The relationship between the growth of US6-1 and AHL accumulation was analyzed carefully. The bacteria cells grew exponentially for about 48 h and then entered the stationary phase. Similarly, the AHL accumulation was maximized at 48 h and then declined, indicating US6-1 could degrade AHL signals.

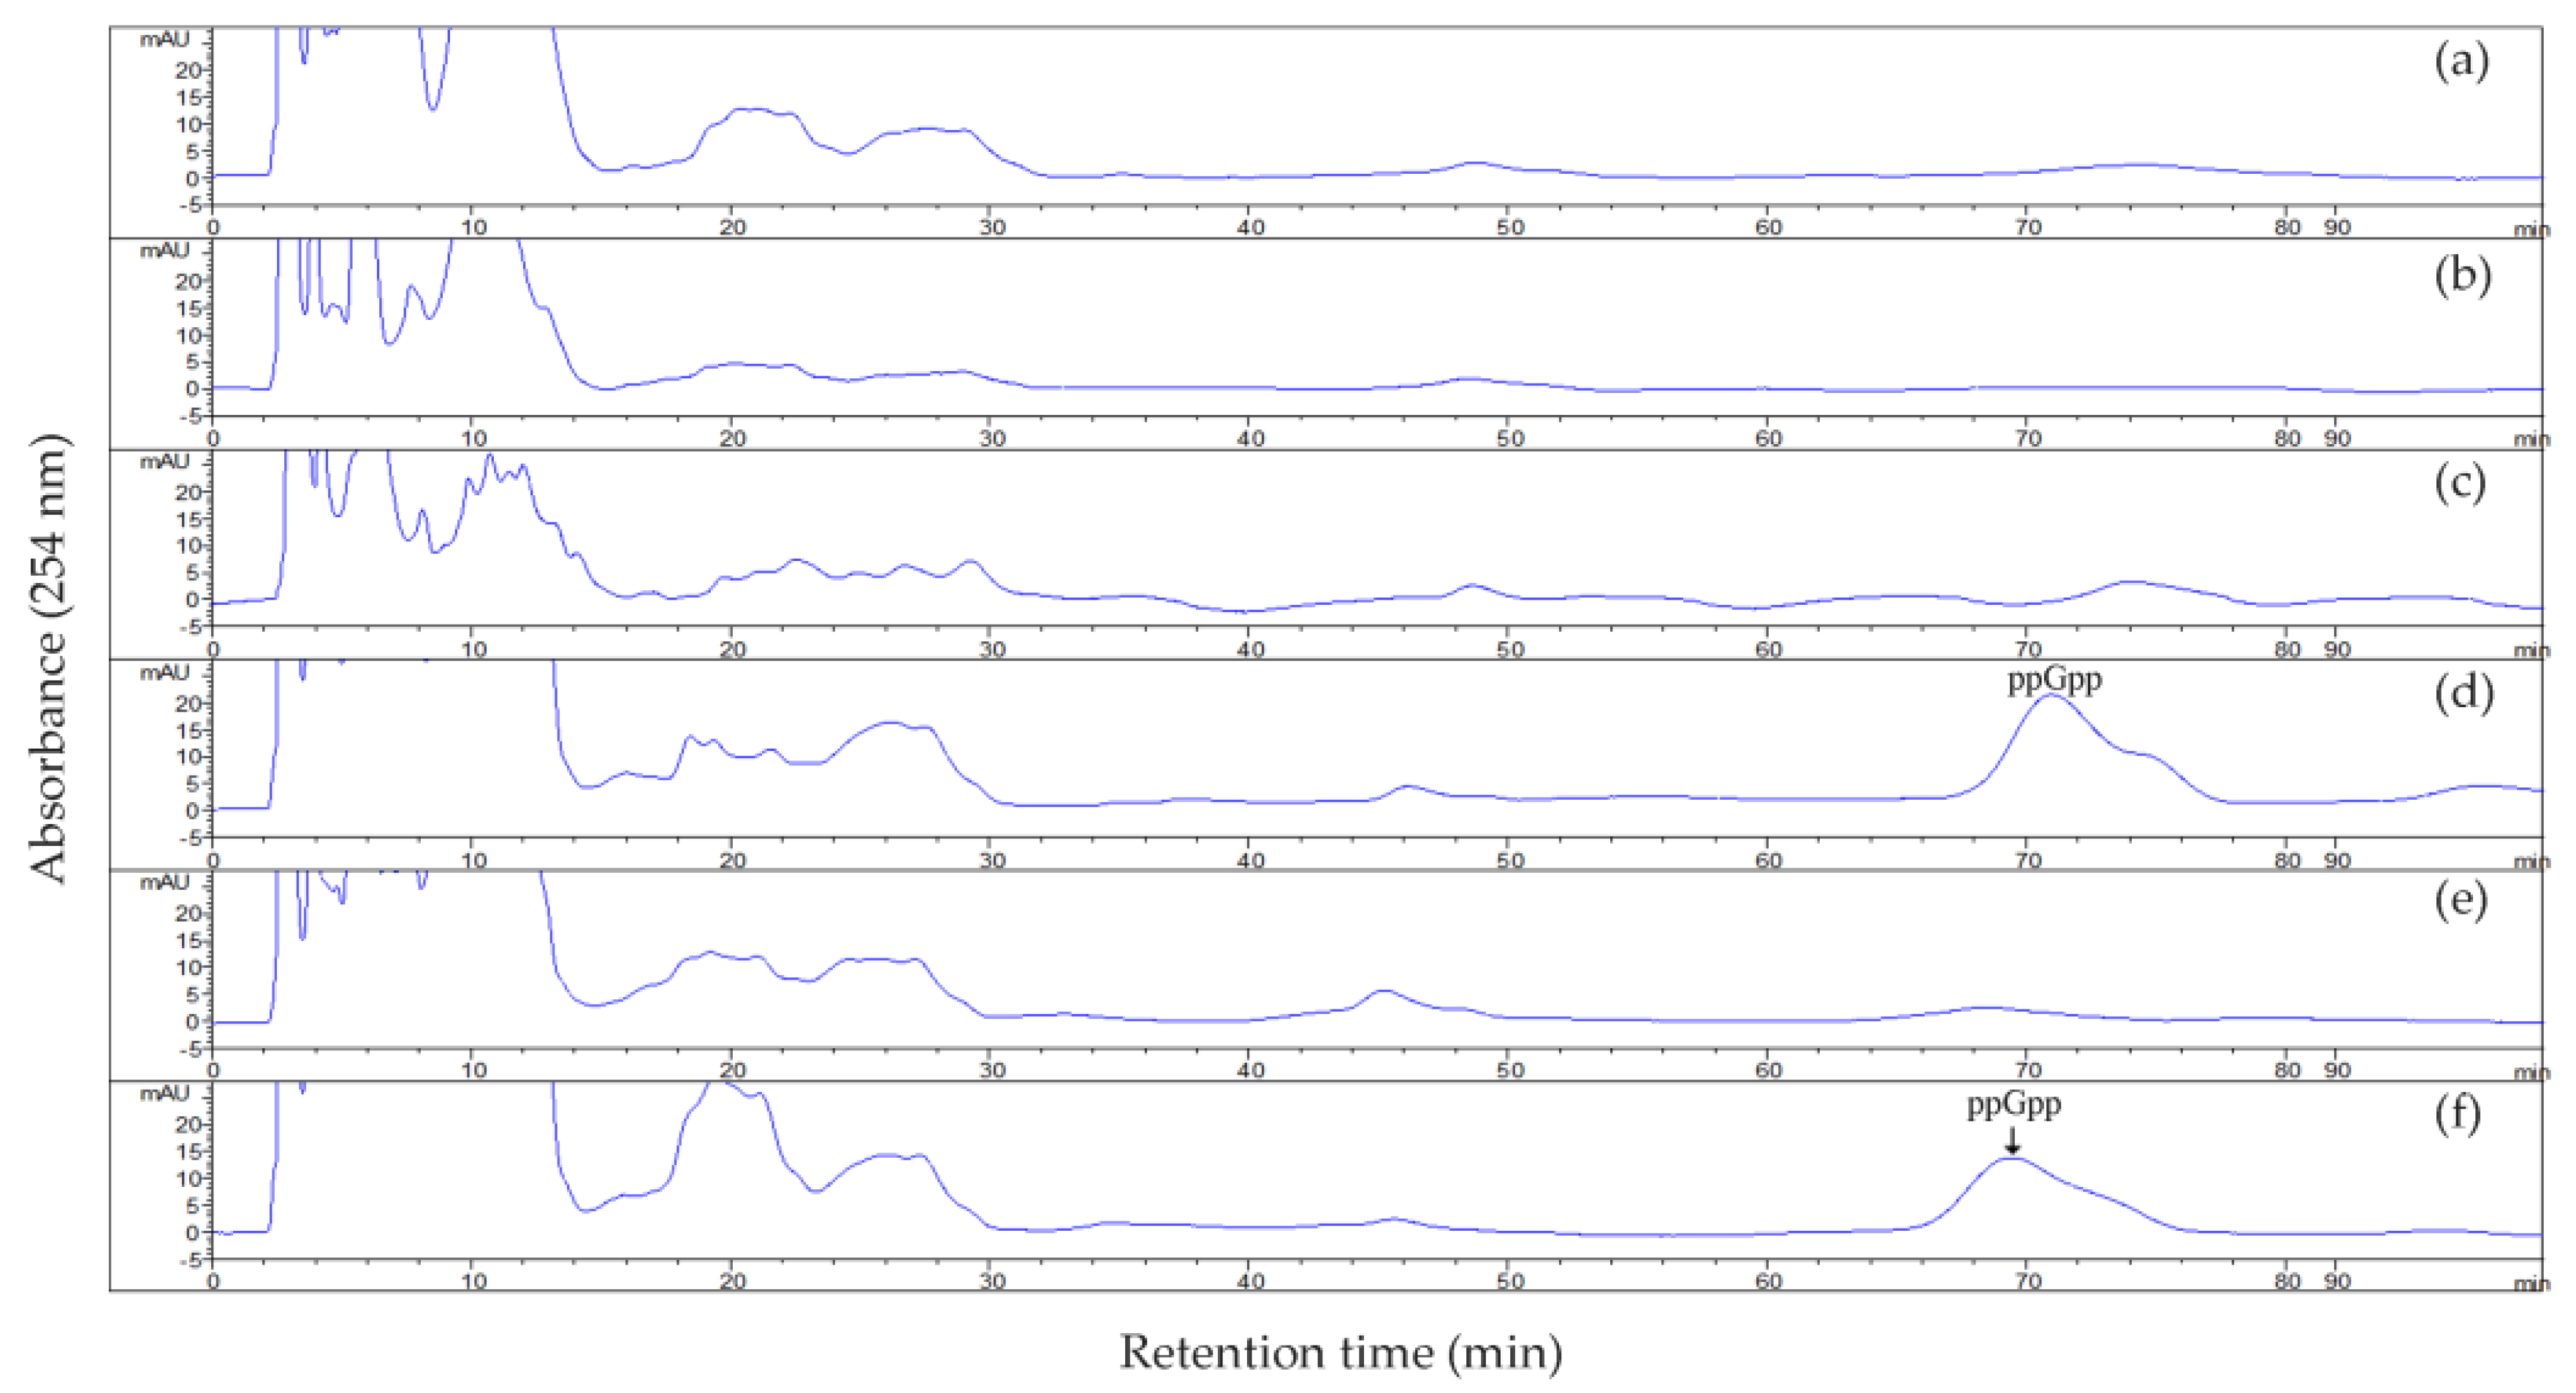
2.3. ppGpp Accumulation in Strain US6-1 and Its Derivatives

We monitored the endogenous ppGpp levels in US6-1, ∆rsh and ∆rsh (pCM62-rsh) (Figure 3). The presence of ppGpp in US6-1 culture at 72 h of incubation (stationary phase) was determined while no ppGpp was detected in ∆rsh. When we analyzed ppGpp accumulation in ∆rsh (pCM62-rsh), the complementation of ppGpp production was observed, confirming that RshUS6–1 was responsible for ppGpp synthesis. These results showed that the stringent response in US6-1 and the complementary strain was induced under the current culture conditions. Nutrient limitation is one of the conditions that can induce the stringent response. However, the medium used in this study was nutrient-rich P5Y3 medium. Several studies has recently found that antibiotics, acid stress and oxidative stress could also induce the stringent response [38]. Therefore, it seems that many factors which can induce the stringent response of bacteria remain unknown. At 36 h of incubation (exponential growth phase), we could not detect the ppGpp accumulation in US6-1 culture. This was probably because the ppGpp level was below the detectable range, as ppGpp is generally thought to be present at basal levels in the exponential growth phase [3]. However, previous studies showed that ppGpp could still regulate the expression of a wide range of genes during this growth period [3,6].

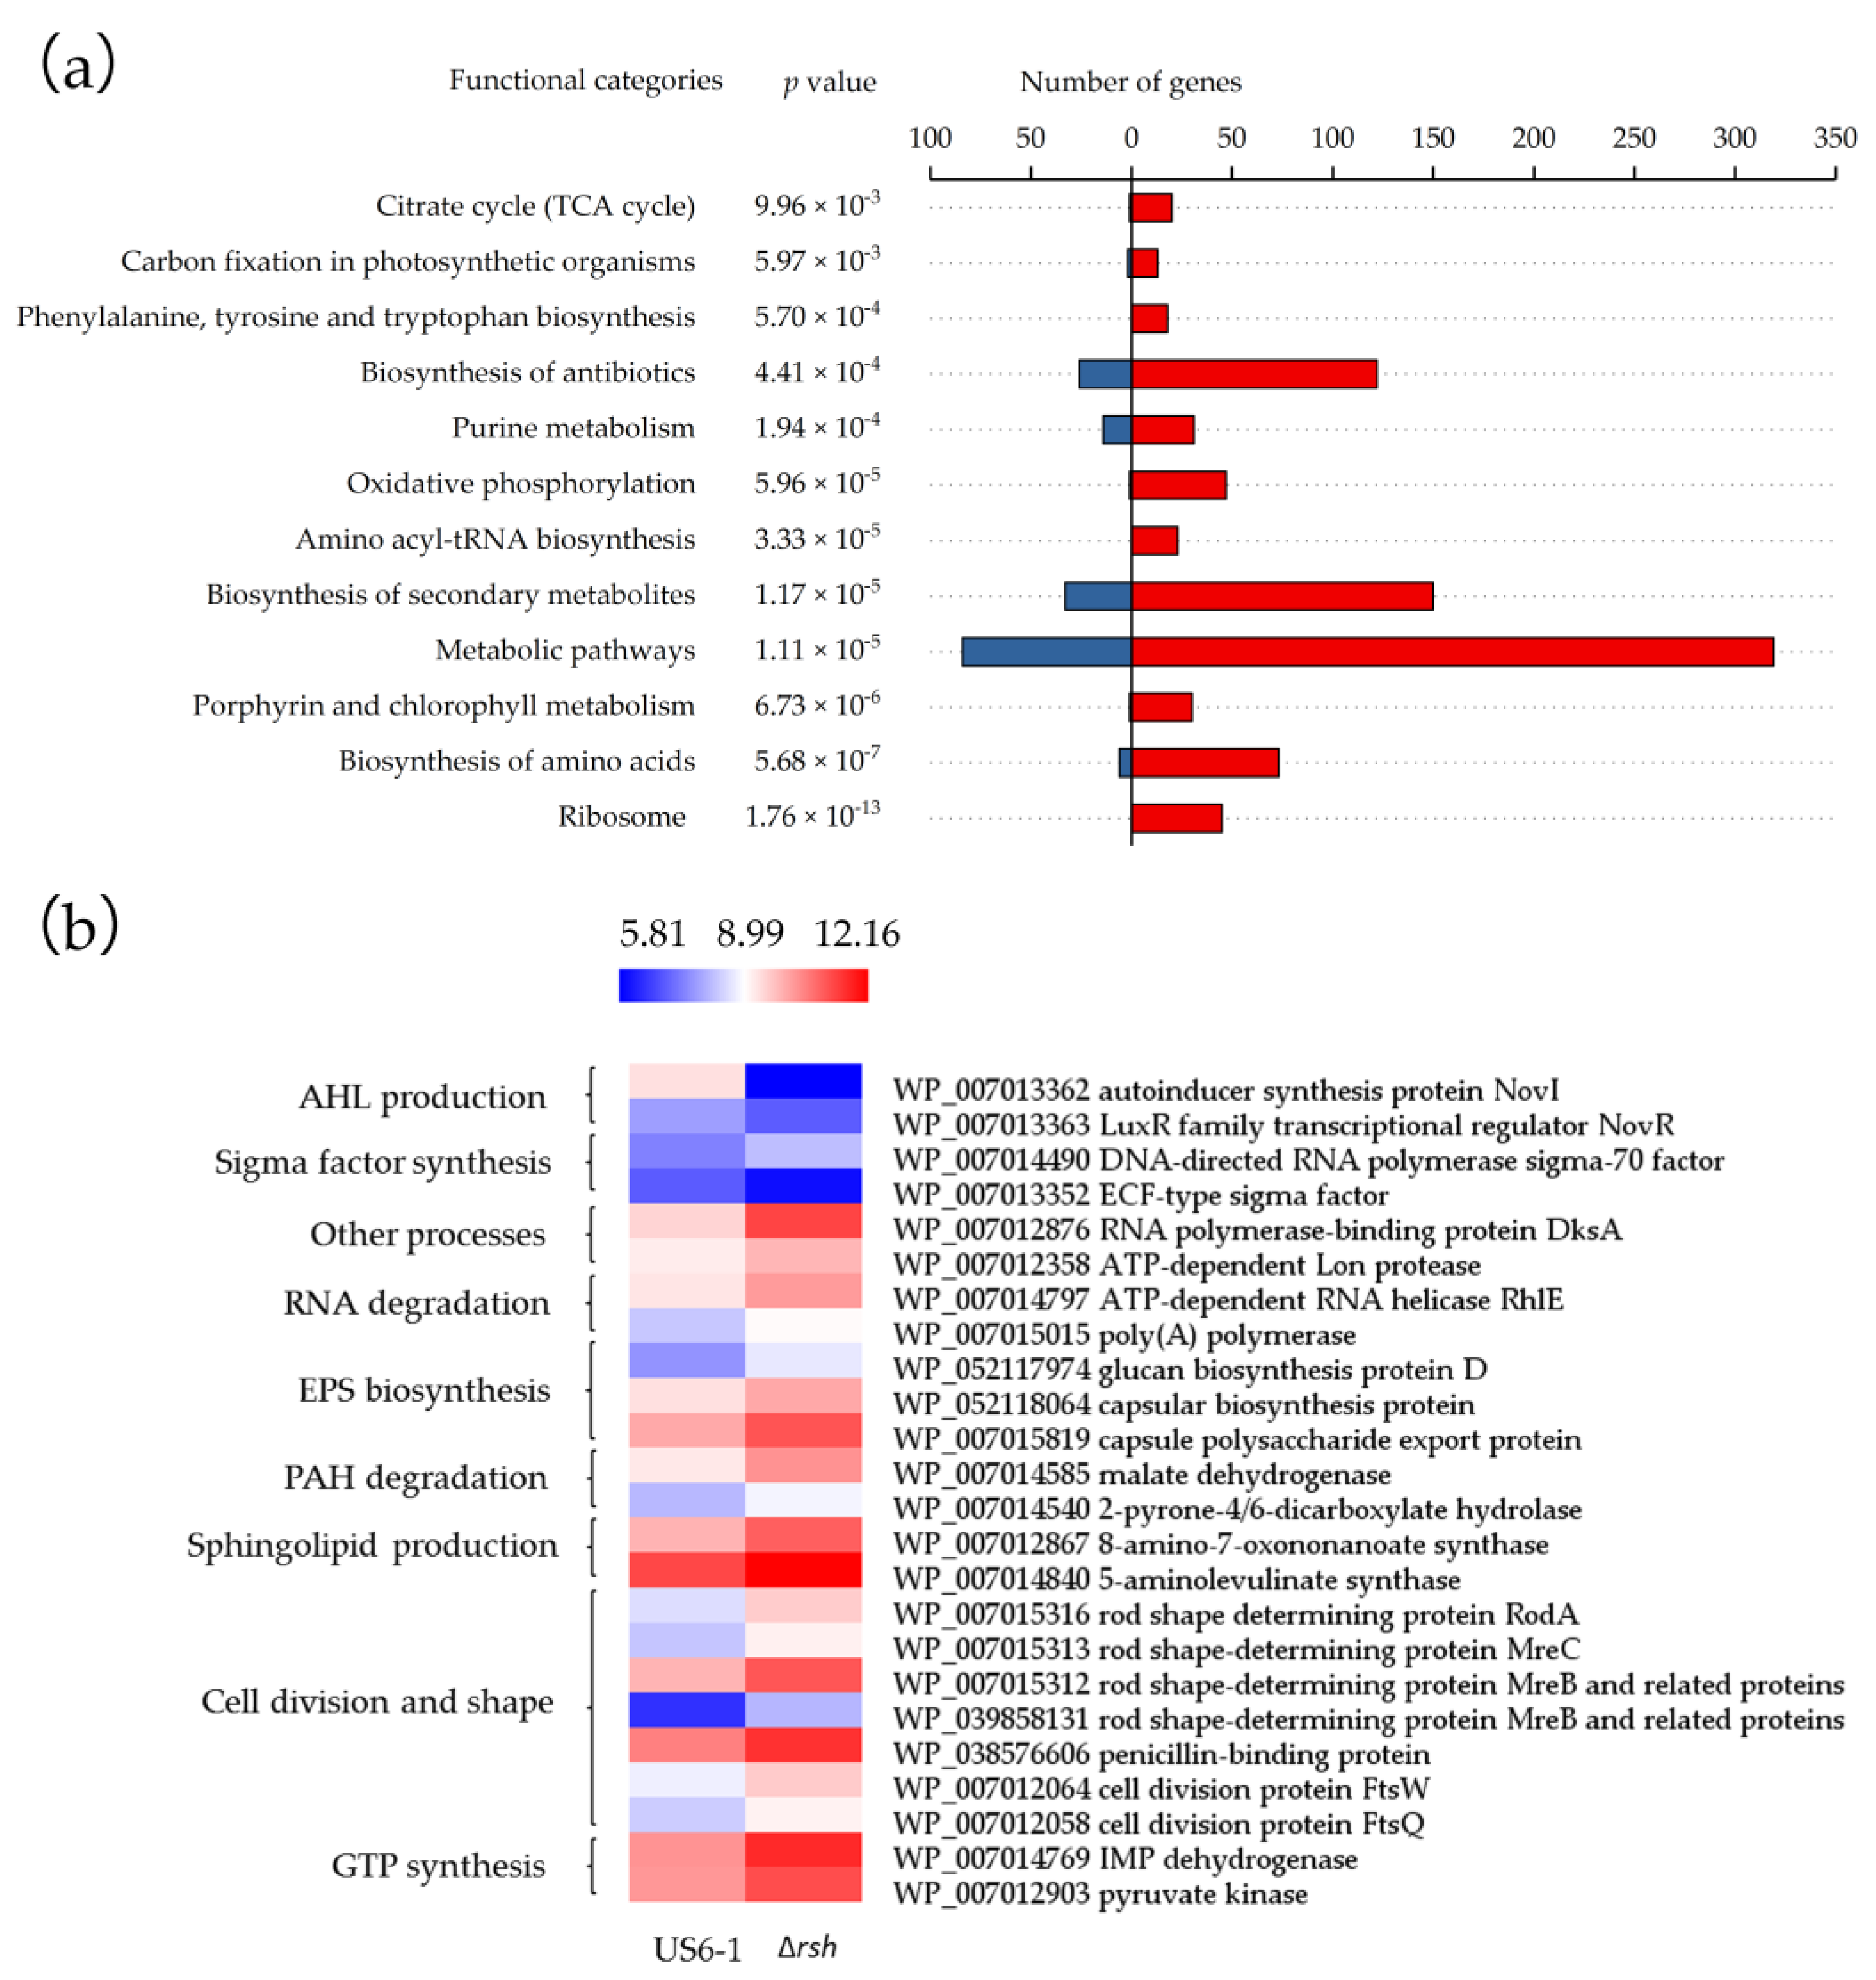
2.4. Global Overview of the RshUS6–1 Regulon

The RNA-seq of strain US6-1 and ∆rsh cultivated in static conditions, in which US6-1 accumulated AHL signals, was conducted to determine the RshUS6–1 regulon. An average of 24 million clean reads in one sample were obtained. The total mapping radios and uniquely mapping ratios of clean reads to reference genome of US6-1 were up to 98% and 95%, indicating that the sequencing was deep enough to cover almost all kinds of transcripts in the cells (Table S1). The genome of US6-1 contains 5110 annotated protein-encoding genes, 59 pseudo genes and 82 RNA genes [25]. The comparative transcriptome analysis between strain US6-1 and ∆rsh revealed 1540 RshUS6–1-dependent differentially expressed genes (DEGs), which were defined according to the combination of the absolute value of a fold change ≥2 and an adjust p value ≤ 0.05 (Table S2). Compared with the wild type, 911 of these genes were up-regulated (17.83%) and 629 genes (12.31%) were down-regulated in ∆rsh (∆rsh vs. US6-1). The differential expression varied between an 8.82-fold up-regulation of a gene encoding a protein of ferrisiderophore receptor (WP_007014902) and a 40.5-fold down-regulation of an autoinducer synthesis protein (WP_007013362). The transcriptome data were validated by analyzing the expression levels of 39 representative genes using qRT-PCR (Table S3). The result showed that 29 (74.36%) of the tested genes were regulated in the same direction (up or down) in both RNA-seq data and qRT-PCR (∆rsh vs. US6-1), and the fold change of each gene in qRT-PCR was log2(x) > 1 or log2(1/x) < −1 (representing a plain fold-change >2) with statistical differences. Among these 29 genes, the expression of 24 genes by qRT-PCR (the complementary strain vs. US6-1) was not different significantly or was regulated in the opposite direction in the RNA-seq data. Therefore, the transcriptome data were in good agreement with the qRT-PCR data, which proved the reliability of the transcriptome data.
These genes were further grouped based on Kyoto Encyclopedia of Genes and Genomes (KEGG) annotation and pathway enrichment analysis (Figure 4a). The Fisher’s exact test identified 12 significantly over-represented KEGG pathways. The result suggested that RshUS6–1 controlled a variety of metabolic pathways. The most of the DEGs involved in ribosomal protein production, porphyrin and chlorophyll metabolism, amino acyl-tRNA biosynthesis, oxidative phosphorylation, TCA cycle, phenylalanine, tyrosine and tryptophan biosynthesis were up-regulated in the mutant, which suggested that the role of RshUS6–1, similar to that in E. coli, was to repress the majority of cellular processes to reallocate cellular resources [39]. Although one of the hallmarks of stringent response is the induction of amino acid biosynthesis [39,40], unexpectedly, in ∆rsh most genes involved in amino acid biosynthesis were up-regulated. Similarly, in relA mutant of Pectobacterium atrosepticum, several unlinked clusters of genes involved in branched chain amino acid metabolism (ilvGMEDA, ilvlH, ilvBN and leuABCD) were also up-regulated [41]. There may be other mechanisms which can induce amino acid biosynthesis when US6-1 grows under environmental stress. According to the validation of the transcriptome data, DEGs involved in AHL production, sigma factor synthesis, RNA degradation, EPS biosynthesis, PAH degradation, sphingolipid production, cell division and shape and GTP synthesis were chosen, and their expression profiles were visualized in the heat map (Figure 4b, Table S3). Except the genes related to AHL production, the most of these genes were under negative control of RshUS6–1. These DEGs will be discussed in detail in the following paragraphs.

2.5. Essential Genes for AHL Production were Positively Regulated by RshUS6–1 in the Exponential Growth Phase

There are only one gene novI, encoding an autoinducer synthase (WP_007013362) and one gene novR encoding a LuxR family transcriptional regulator containing an autoinducer binding domain (WP_007013363) in the genome of US6-1. These two genes are essential for AHL production. The transcriptome data showed that in strain ∆rsh, novI and novR were down-regulated 40.5 and 2.35-fold at 36 h of incubation, respectively. The qRT-PCR analysis of culture samples from different growth periods confirmed the decreased expression levels of novI and novR in ∆rsh (Table 1). The novI and novR were both down-regulated significantly at 36 h and 48 h (exponential growth phase) in ∆rsh while ∆rsh (pCM62-rsh) could complemented their expression.
Although the essential genes for AHL production were down-regulated in the exponential growth phase due to the lack of ppGpp, ∆rsh still possibly produced low concentrations of AHL signals. Since US6-1 could degrade AHL signals, we analyzed whether ∆rsh degraded AHL in the exponential growth phase. When provided with 2 µM medium-chain AHL (C8-AHL and 3-OH-C8-AHL) as cosubstrates in culture medium, ∆rsh did not show the capacity to degrade the medium-chain AHL at 48 h (Figure 5). However, at 72 h of incubation, there were fewer AHL signals in ∆rsh cultures. These results suggested that ∆rsh might not degrade AHL signals in the exponential growth phase. The activation of its capacity to degrade AHL was likely related to the entrance to the stationary phase. Overall, the reason why RshUS6–1 was required for the AHL accumulation was that RshUS6–1 positively regulated essential genes for AHL production in the exponential growth phase, and might be unrelated to the AHL degradation.

2.6. Potential Molecular Mechanisms of RshUS6–1-Dependent Expression of novI and novR

In the case of E. coli, (p)ppGpp regulates the expression of genes through binding to β’-subunit of RNA polymerase to destabilize the short-lived open complexes that form at certain promoters [3]. However, genes in the RshUS6–1 regulon were numerous and the proteins which can modulate the expression of luxI/R homologs vary in bacteria [44]. Therefore, the transcriptome data were used to investigate the potential molecular mechanisms of the decreased expression of novI and novR in ∆rsh.
During exponential growth, transcription is widely under control of the housekeeping sigma factor σ70. ppGpp can regulate the expression of genes via the regulation of alternative sigma factor competition [45]. Previous studies showed that QS was influenced by alternative sigma factors. In P. aeruginosa PAO1 and P. fluorescens UK4, ppGpp up-regulates the expression of rpoS encoding a stationary phase sigma factor and RpoS increases the expression level of AHL-related genes as well as the AHL production [16,46]. However, the Pseudomonas model might not be applicable in strain US6-1, since its genome does not encode a corresponding RpoS. US6-1 possesses 22 putative sigma factors. Only one housekeeping sigma factor σ70 (WP_007014490) was up-regulated 2.2-fold while a extracytoplasmic function (ECF) sigma factor (WP_007013352) was down-regulated 2.73-fold in ∆rsh. The link between ECF sigma factor and QS has recently given rise to controversy. ECF sigma factors can bind directly to -10 and -35 elements in the luxR promoter, thus inducing luxR expression. The binding sites of this kind of sigma factors are also identified in the upstream region of luxS [47,48]. However, the effect of ECF sigma factors on QS was not observed in another study [49].
Our data showed that dksA (WP_007012876) was up-regulated significantly (6.41-fold) in ∆rsh. DksA, a (p)ppGpp cofactor, can bind the secondary channel and sensitize RNAP to (p)ppGpp at many promoters [3]. The previous study showed that DksA could also function without ppGpp [50]. In P. aeruginosa, DksA represses the expression of rhlI during the exponential growth [51].
The gene encoding an ATP-dependent Lon protease (WP_007012358) was up-regulated 2.01-fold due to the RshUS6–1 absence. The gene is involved in the toxin–antitoxin (TA) module, a (p)ppGpp-dependent mechanism related to antibiotic tolerance and resistance [3]. Lon protease is a powerful negative regulator of two HSL-mediated QS systems in P. aeruginosa [52]. In the TA model, (p)ppGpp activates the Lon protease [3]. Interestingly, our data indicated an opposite type of the TA module regulation of ppGpp in strain US6-1.
Moreover, the expression levels of two genes involved in the putative functions of RNA degradation (WP_007014797 and WP_007015015) were increased 2.62 and 2.19-fold respectively in ∆rsh. The enzyme responsible for RNA degradation has been reported to degrade mRNA of AHL synthase genes and thus decrease the AHL production rapidly [53]. Overall, the above transcriptome data showed that ppGpp could regulate several factors including the ECF sigma factor, DksA, ATP-dependent Lon protease and RNA degradation enzymes. These factors have been proved to affect the expression of luxI/R homologs in other bacteria. However, the relationship between these factors and luxI/R homologs in sphingomonads remains unknown and needs further studies. We proposed these potential molecular mechanisms of ppGpp-dependent expression of novI and novR, which might contribute to giving insight into the complicated cross-talk between stringent response and QS in sphingomonads.

2.7. Repressed Exopolysaccharides (EPS) Biosynthesis

Many strains in sphingomonads can produce EPS [12,13]. The transcriptome data showed the gene encoding a putative glucan biosynthesis protein (WP_052117974) and two genes involved in capsule biosynthesis and export (WP_052118064, WP_007015819) were up-regulated 3.03, 2.07 and 3.01-fold respectively in strain ∆rsh. Glucans are major constituents of capsular materials [54]. Thus, we analyzed ∆rsh for Congo red binding. Congo red binds certain polysaccharides as well as polymers that display amyloid-like properties [12]. On Congo red plates, the colony biofilm of ∆rsh was light red, while the wild-type strain appeared slightly orange. The complemented strain showed a phenotype similar to that of the wild-type strain (Figure 6a). Furthermore, the culture of ∆rsh bound more Congo red than the wild type, leaving less Congo red in the cell-free supernatant. The Congo red bounding of ∆rsh (pCM62-rsh) showed no significant difference with that of strain US6-1 (Figure 6b). The results suggested that RshUS6–1 affected EPS biosynthesis as a repressor, consistent with the changes of the expression levels of the above genes. This phenomenon was also observed in Sinorhizobium meliloti [55]. When the local environment becomes unfavorable (e.g., nutrient or oxygen deficiency), the motile behavior is important for bacteria to move towards a better environment to survive. In several strains of sphingomonads, the presence of EPS can result in a phenotypic shift from planktonic cells to non-motile cells [13]. Therefore, the repression of RshUS6–1 on the EPS biosynthesis might be a survival strategy of strain US6-1.

2.8. RshUS6–1 Regulon Involved in Other Processes

The large plasmids present in US6-1 possess putative biodegradation genes that play a key role in PAH degradation [56]. These genes were investigated in the transcriptome data. Two genes (WP_007014585, WP_007014540) located in the large plasmid pLA3 showed up-regulation in ∆rsh, which was similar to the situation in Sphingomonas sp. LH128 [14]. For strain LH128, the expression of phenanthrene catabolic genes were decreased while rsh was up-regulated after 6 months of starvation. This indicated that RshUS6–1 might affect the degradation of PAH. Many researches on sphingomonads mainly focused on enzymes which could degrade PAH directly [56]. Considering sphingomonads always degrade aromatic compounds in contaminated soil with limited nutrient availability [7], studying the relationship between Rsh and genes involved in the degradation of aromatic compounds would help understand a comprehensive degradation mechanism. Future studies carried out in an environment contaminated with PAH using ∆rsh are needed to investigate the relationship.
All sphingomonads contain in their outer membranes sphingolipids which replace lipopolysaccharides [7]. Serine palmitoyltransferase (SPT) is a key enzyme in sphingolipid biosynthesis [57]. Two up-regulated genes (WP_007012867 and WP_007014840) were annotated as α-oxoamine synthases, a family of enzymes including SPT. Their identification of amino acid sequences with SPT from Sphingomonas paucimobilis and Sphingomonas wittichii were more than 30% [57,58], indicating they were responsible for encoding SPT. Sphingolipids play an important role in bacterial survival under stress [59]. However, our results indicated that when spingomonads encountered environmental stress, sphingolipid biosynthesis was repressed via stringent response instead of being induced, probably for energy and resource saving.
The expression level of shape determination genes (rodA, mreC and mreB), cell-division genes (ftsW, ftsQ) and genes encoding penicillin-binding proteins increased as a result of the deletion of rshUS6–1. These genes were involved in cell size and shape, indicating that the morphology of US6-1 was regulated by RshUS6–1. Starvation stress can result in the changes of cell morphology of Sphingomonas [14,60]. The reason might be that the change of cell size and shape improves the uptake of scarce nutrients due to the increase in cell surface area to volume ratio [61]. Our data suggested that US6-1 might adapt to environment stress via the change in cell size or shape regulated by RshUS6–1.
Genes responsible for putative regulatory functions were investigated. Several transcriptional regulators including the cold shock protein, an UspA and a PadR family transcriptional regulator were down-regulated. The balance of available GTP might be altered due to the up-regulation of two genes involved in GTP synthesis, a gene encoding an IMP dehydrogenase (WP_007014769) and a pyruvate kinase (WP_007012903). In Bacillus subtilis, Rsh regulates transcription mainly by altering the balance of GTP [3]. Whether Rsh also affects the expression of genes through the changes of GTP concentration in sphingomonads remains unknown. In addition, the genome of US6-1 contains 16 chemotaxis-related genes in a “che” cluster, in which several genes were up-regulated. Many genes involved in iron homeostasis were also in the RshUS6–1 regulon. There was an up-regulation in the expression level of genes encoding transporters ExbD and a ferrous iron transporter B and a 3.48-fold down-regulation in the gene related to bacterioferritin. Among proteins annotated as TonB-dependent receptors, 10 were up-regulated and 13 were down-regulated. The absence of RshUS6–1 seemed to result in a disruption in iron homeostasis.

3. Materials and Methods

3.1. Bacterial Strains, Plasmids and Growth Conditions

Bacterial strains and plasmids used in this study are listed in Table 2. Strain US6-1 and its derivatives were grown in P5Y3 (5 g/L peptone, 3 g/L yeast exact and 25 g/L sea salt, pH = 6.5 ± 0.2) at 30 °C. Unless noticed otherwise, in all experiments fresh colonies of US6-1 and its derivatives were first inoculated into P5Y3 broth at the shaking speed of 200 rpm to an OD600 value of 1 and 250 µL of this seed culture was then re-inoculated into 50 mL of fresh P5Y3 broth and incubated statically. E. coli and A. tumefaciens A136 were grown in Luria Broth (10 g/L tryptone, 5 g/L yeast extract, 10 g/L NaCl) at 37 °C or 30 °C, respectively. When appropriate, the following antibiotics were added to the medium: kanamycin (100 µg/mL), streptomycin (100 µg/mL), rifampicin (50 µg/mL) and tetracycline (9 µg/mL) for strain US6-1 and its derived strains, kanamycin (50 µg/mL), tetracycline (9 µg/mL) and ampicillin (100 µg/mL) for E. coli, tetracycline (4.5 µg/mL) and spectinomycin (50 µg/mL) for A136.

3.2. Sequence Analysis of RshUS6–1

The nucleotide sequence of rshUS6–1 (accession number WP_007011921) and its deduced amino acid sequences were obtained from NCBI GenBank (https://www.ncbi.nlm.nih.gov, 15 November 2016). Domain prediction was carried out using Conserved Domain Database in NCBI. Multiple-sequence alignments were accomplished using BIOEDIT version 7.0.9.0 (Ibis Therapeutics, Carlsbad, CA, USA) [66]. The identities of RshUS6-1 with RshRr2-17 (Rsh from Novosphingobium sp. Rr 2-17, accession number ACH57394) [33], RshMtb (Rsh from Mycobacterium tuberculosis, accession number CAB01260) [34], RshSeq (Rsh from Streptococcus equisimilis, accession number CAA51353) [35], RshRet (Rsh from Rhizobium etli, accession number ABC90188) [36], SpoTEcoli (SpoT from E. coli, accession number AAC76674) [32] and RelA Ecoli (RelA from E. coli, accession number AAC75826) were calculated by BLAST+ program [67]. For construction of phylogenetic trees, sequences were aligned by using the ClustalW algorithm [27] in MEGA version 6.0 [28]. Then a phylogenetic tree was constructed by the neighbor-joining method [29] with 1000 bootstrap replicates [30] after cutting off the redundant sequences at the end, with the use of MEGA version 6.0. The Rsh protein from Anabaena sp. PCC 7120 (accession number BAB77915) was used as outgroup [31].

3.3. Strain Construction

Primers used in the present study are listed in Table S4. The in-frame gene deletion mutant was constructed as described previously [64]. Briefly, up- and down-stream flanking regions of rshUS6–1, approximately 400 bp each, were amplified by PCR with the primer pairs rsh-5O/rsh-5I and rsh-3O/rsh-3I and joined using overlap PCR with rsh-5O/rsh-3O. The resulting fragments were cloned into the plasmid pAK405 via the BamHI/HindIII restriction site. The pAK405 derivative was subsequently delivered into US6-1 via conjugal transfer from E. coli S17-1 (λpir). After the conjugal transfer, bacteria were plated on P5Y3 supplemented with kanamycin (100 μg/mL) and rifampicin (50 µg/mL). Individual colonies were restreaked once on the same medium and then plated on P5Y3 supplemented with 100 μg/mL streptomycin to select for the second homologous recombination event. The resulting colonies were restreaked on both P5Y3 supplemented with 100 µg/mL streptomycin and P5Y3 containing 100 µg/mL kanamycin, and kanamycin-sensitive clones were analyzed by colony PCR using primers rsh-FO/rsh-RO.
For complementation studies, fragments containing the rshUS6–1 ORFs and upstream regions were amplified by PCR using the primer pairs PrshF/PrshR. The PCR products were cloned into the plasmid pCM62 [65] to generate pCM62-rsh via the EcoRI/HindIII restriction site. The plasmid pCM62-rsh was transformed into ∆rsh by electroporation (2 kV) using a MicroPulse electroporator (Bio-Rad, Hercules, CA, USA). The complementary strain was verified by qRT-PCR and the tetracycline resistance (9 µg/mL). A Bacterial Genomic DNA Extraction Kit, a Gel Extraction Kit and a Plasmid Miniprep Kit were purchased from TransGen Biotech (Beijing, China) and used according to the manufacturer’s instruction.

3.4. Growth Curve

Fresh colonies of US6-1 and its derivatives were first inoculated into P5Y3 broth at the shaking speed of 200 rpm to an OD600 value of 1. Then, 250 µL of this seed culture was re-inoculated into 50 mL of fresh P5Y3 broth and incubated statically. The growth curve was drawn from measuring the OD600 values. The OD600 values were monitored using the Spectrophotometer (Metash, Shanghai, China).

3.5. Detection of AHL Accumulation

Strains were tested for AHL accumulation by cross-feeding and extract assays according to the previous study [37]. In the cross-feeding assay, a P5Y3 agar plate was covered with 50 µL X-gal (20 mg/mL stock solution in dimethylformamide). The AHL reporter strain A136 and the tested strains were streaked side by side on the agar plates. Plates were incubated for 24 h, when the activation of the reporter was recorded. A136 versus A136 was used as negative control.
In the extract assay, AHL signals in culture broths were extracted three times by equal volume of ethyl acetate (EA). The EA extracts were combined and evaporated at 55 °C to dry under reduced pressure. The extracts were re-dissolved in 1 mL of EA and passed through a sodium sulfate column to remove water. The extracts were spotted onto LB soft agar plates plus X-gal mixed with A136. The plates were incubated for 12 h at 30 °C and the diameters of the blue stains which represented the quantity of AHL signals in bacterial culture were recorded.

3.6. ppGpp Analysis

ppGpp was extracted with formic acid [68]. At 36 h (exponential growth phase) and 72 h (stationary phase) of incubation, bacterial cells were collected by centrifugation and suspended in 1 mL of 0.9% saline. Then 100 µL of 11 M formic acid was added to the suspension. The sample was vigorously mixed and incubated on ice for 30 min. These samples were centrifuged at 10,000× g for 10 min at 4 °C. The supernatant was filtered through 0.2 µm filters and stored at −20 °C until use in HPLC analysis.
To assay ppGpp, 100 µL of the extract was subjected to 1100 Series HPLC (Agilent, Santa Clara, CA, USA) by using a ZORBAX SB-C18 column (4.6 × 250 mm, 5 µm, Agilent) at a flow rate of 1.0 mL/min. The mobile phase (pH 6.0) consisted of 125 mM KH2PO4, 10 mM tetrabutyl ammonium dihydrogen phosphate, 60 mL/L methanol, and 1 g/L KOH [68]. The eluted nucleotides were monitored at 254 nm and identified by comparison with the retention time of 100 µM ppGpp standards (TriLink Biosciences, San Diego, CA, USA). The ppGpp standard was eluted at 71 min under the current conditions.

3.7. Identification of AHL Degradation of ∆rsh in the Exponential Growth Phase

To determine whether AHL was degraded by ∆rsh in the exponential growth phase, ∆rsh was incubated with 2 µM medium-chain AHL (C8-AHL and 3-OH-C8-AHL) for 24 h, 48 h and 72 h, after which the EA extracts were spotted onto AHL reporter plates [69]. The residual AHL was detected by A136. To avoid the influence of the AHL produced by US6-1 in the exponential growth phase, novI deletion mutant, which could not produce AHL, was used as positive control. Blank medium with AHL was used as negative control.

3.8. RNA Extraction and RNA-seq

Cultures of US6-1, ∆rsh and ∆rsh (pCM62-rsh) after 24 h, 36 h, 48 h and 72 h of static incubation were frozen in liquid nitrogen and stored at −80 °C. Total RNA extraction was performed with RNAprep pure Cell/Bacteria Kit (Tiangen biotech, Beijing, China) according to the manufacturer’s instructions. RNA concentration and purity were determined at 230 nm using a NanoDrop ND-1000 (Thermo Scientific, Waltham, MA, USA). Genomic DNA contamination was removed and cDNA was synthesized using FastKing gDNA Dispelling RT SuperMix (Tiangen biotech, Beijing, China).
Samples of cDNA of US6-1 and ∆rsh at 36 h of incubation (exponential phase) were chosen for RNA-seq analysis. Library construction and sequencing were performed on a BGISEQ-500 platform by Beijing Genomic Institution (Shenzhen, China). All the raw sequencing reads were filtered to remove low quality reads and reads with adaptors, reads in which unknown bases are more than 10%. Clean reads were then obtained. These reads were stored as FASTQ format and then deposited in the NCBI Sequence Read Archive (http://trace.ncbi.nlm.nih.gov/Traces/sra, 22 May 2018) under the accession number SRP148564. HISAT [70] was used to map clean reads to genome of US6-1. For gene expression analysis, the matched reads were calculated and then normalized to reads per kilobaseper million mapped reads using RESM software [71]. The significance of the differential expression of genes was defined according to the combination of the absolute value of the fold change ≥2 and an adjusted p value ≤ 0.05 using DESeq2 algorithm [72]. KEGG-based annotation and pathway enrichment analysis was performed using the KEGG pathway database (http://www.genome.jp/kegg/, 25 September 2017). All these KEGG terms were decided by a Fisher’s exact test with phyper function in R language [42]. An adjust p value of 0.01 was used as the threshold to obtain significantly over-represented KEGG terms.

3.9. Quantitative Real-Time Polymerase Chain Reaction (qRT-PCR)

Quantitative real-time PCR (qRT-PCR) was performed according to protocols described previously [73]. cDNA samples were used as the templates for amplification by using SYBR Premix Ex TaqTM Kit (Tli RNaseH Plus) (TaKaRa, Dalian, China) in Applied Biosystems StepOnePlusTM Real-Time PCR System (Thermo Scientific, Waltham, MA, USA). Primers were designed on the Sangon website (http://www.sangon.com/, 14 January 2018) and listed in Table S4. The following PCR program was used: 95 °C for 30 s, followed by 40 cycles of 95 °C for 5 s, 60 °C for 30 s. A heat dissociation curve (60–95 °C) was checked after the final PCR cycle to determine the specificity of the PCR amplification. The gene expression levels of derivatives of US6-1 relative to the wild-type strain were analyzed using the 2−∆∆Ct analysis method [74] (∆rsh vs. US6-1 or the complementary strain vs. US6-1). The 16S rRNA gene was used as internal references to normalize cDNA templates. Negative controls with nuclease-free water as templates for each primer set were included in each run. The expression profiles obtained from the RNA-seq were validated by qRT-PCR of 39 representative genes involved in functional groups including AHL production, sigma factor synthesis, RNA degradation, EPS biosynthesis, PAH degradation, sphingolipid production, cell division and shape, GTP synthesis and other functions. The RNA-seq data were considered valid if they met both two requirements. One was that the gene expression (∆rsh vs. US6-1) was regulated in the same direction (up or down) in both RNA-seq data and qRT-PCR, and the fold change of genes tested by qRT-PCR was log2(x) > 1 or log2(1/x) < −1 (i.e., a plain fold change >2) with statistical differences (p value < 0.05) [75]. Another was that the gene expression (the complementary strain vs. US6-1) by qRT-PCR was not different significantly or was regulated in the opposite direction in the RNA-seq data. The above valid DEGs were chosen to be clustered. The heat map of their log2 expression ratios in the RNA-seq data in strain US6-1 and ∆rsh was drawn by the software HemI [43].

3.10. Congo Red Binding Assay

The assay to evaluate the EPS production followed the method described previously with minor modification [76]. Cultures were inoculated from a single colony and grown to an OD600 of 1 in P5Y3 broth; 10 µL of suspensions were spotted on P5Y3 plates containing 40 µg/mL Congo red (Solarbio, Beijing, China). The plates were grown at 30 °C to assess the morphology of colony biofilm. For quantitative analysis, strains were first cultured in static P5Y3 broth. Then, the bacterial mass was collected at 96 h by centrifuging at 8000 rpm for 5 min and the supernatant was discarded. Determination of biomass was performed gravimetrically as cell wet weight (g). The precipitate was suspended in 1 mL of 100 μg/mL Congo red in 0.9% saline and then incubated for 90 min with shaking at 30 rpm at room temperature. Centrifugation was performed again to separate the mass and solution, and then the OD490 of the supernatant was measured. The percentage of Congo red left in the supernatant was calculated by relating to the OD490 of 100 μg/mL Congo red in 0.9% saline.

3.11. Statistical Analysis

All assays were performed in triplicate and data were expressed as the means and standard deviations (mean ± SD). Analysis of statistical differences was conducted with Student’s t-test.

4. Conclusions

This is the first transcriptome-wide study of the Rsh regulon in sphingomonads, which is an important step towards understanding the regulatory system of stringent response in sphingomonads. Our study showed that there was a wide range of genes in the RshUS6–1 regulon, including those involved in common traits of sphingomonads such as EPS biosynthesis, PAH degradation and sphingolipid biosynthesis. Furthermore, we focused on the potential molecular mechanisms of RshUS6–1-dependent AHL accumulation. Essential genes for AHL production (novI and novR) were positively regulated by RshUS6–1 in the exponential growth phase. Several factors including the ECF sigma factor, DksA, ATP-dependent Lon protease and RNA degradation enzymes might be involved in the ppGpp-dependent expression of novI and novR. Future studies will focus on the validation of the above proposed mechanisms, which might provide an insight into the complicated cross-talk between stringent response and QS in sphingomonads.

Supplementary Materials

The following are available online at https://www.mdpi.com/1422-0067/19/9/2631/s1, Table S1: Results of mapping clean reads of RNA-Seq to the reference genome of US6-1; Table S2: Complete list of DEGs according to RNA-seq (∆rsh vs. US6-1); Table S3: Validation of the RNA-seq data by qRT-PCR of 39 representative genes; Table S4: Primers used in this study.

Author contribution

The authors’ responsibilities were as follows: Conceptualization, Y.H.; Formal analysis, H.L.; Supervision, Y.H.; Writing—original draft, H.L.

Acknowledgments

This work was supported financially by the National Natural Science Foundation of China 21577121 and the 973 Program (2014CB441103). We thanked Yanhua Zeng for her advices for the study.

Conflict of interest

The authors declare no conflict of interest.

Abbreviations

AHLN-acyl-l-homoserine Lactone
QSQuorum Sensing
DEGsDifferentially Expressed Genes
PAHPolycyclic Aromatic Hydrocarbon
ECFExtracytoplasmic Function
SPTSerine Palmitoyltransferase
EPSExopolysaccharide

References

  1. Balsalobre, C. Concentration matters!! ppGpp, from a whispering to a strident alarmone. Mol. Microbiol. 2011, 79, 827–829. [Google Scholar] [CrossRef] [PubMed] [Green Version]
  2. Potrykus, K.; Cashel, M. (p)ppGpp: Still magical? Annu. Rev. Microbiol. 2008, 62, 35–51. [Google Scholar] [CrossRef] [PubMed]
  3. Hauryliuk, V.; Atkinson, G.C.; Murakami, K.S.; Tenson, T.; Gerdes, K. Recent functional insights into the role of (p)ppGpp in bacterial physiology. Nat. Rev. Microbiol. 2015, 13, 298–309. [Google Scholar] [CrossRef] [PubMed] [Green Version]
  4. Durfee, T.; Hansen, A.M.; Zhi, H.; Blattner, F.R.; Jin, D.J. Transcription profiling of the stringent response in Escherichia coli. J. Bacteriol. 2008, 190, 1084–1096. [Google Scholar] [CrossRef] [PubMed]
  5. Geiger, T.; Francois, P.; Liebeke, M.; Fraunholz, M.; Goerke, C.; Krismer, B.; Schrenzel, J.; Lalk, M.; Wolz, C. The stringent response of Staphylococcus aureus and its impact on survival after phagocytosis through the induction of intracellular PSMs expression. PLoS Pathog. 2012, 8. [Google Scholar] [CrossRef] [PubMed]
  6. Vercruysse, M.; Fauvart, M.; Jans, A.; Beullens, S.; Braeken, K.; Cloots, L.; Engelen, K.; Marchal, K.; Michiels, J. Stress response regulators identified through genome-wide transcriptome analysis of the (p)ppGpp-dependent response in Rhizobium etli. Genome Biol. 2011, 12. [Google Scholar] [CrossRef] [PubMed] [Green Version]
  7. Stolz, A. Molecular characteristics of xenobiotic-degrading sphingomonads. Appl. Microbiol. Biotechnol. 2009, 81, 793–811. [Google Scholar] [CrossRef] [PubMed]
  8. Huang, Y.L.; Feng, H.; Lu, H.; Zeng, Y.H. Novel 16S rDNA primers revealed the diversity and habitats-related community structure of sphingomonads in 10 different niches. Anton. Leeuw. 2017, 110, 877–889. [Google Scholar] [CrossRef] [PubMed]
  9. Alvarez, A.; Benimeli, C.S.; Saez, J.M.; Fuentes, M.S.; Cuozzo, S.A.; Polti, M.A.; Amoroso, M.J. Bacterial bio-resources for remediation of hexachlorocyclohexane. Int. J. Mol. Sci. 2012, 13, 15086–15106. [Google Scholar] [CrossRef] [PubMed]
  10. Yamamoto, A.; Yano, I.; Masui, M.; Yabuuchi, E. Isolation of a novel sphingoglycolipid containing glucuronic acid and 2-hydroxy fatty acid from Flavobacterium devorans ATCC 10829. J. Biochem. 1978, 83, 1213–1216. [Google Scholar] [CrossRef] [PubMed]
  11. Kawasaki, S.; Moriguchi, R.; Sekiya, K.; Nakai, T.; Ono, E.; Kume, K.; Kawahara, K. The cell envelope structure of the lipopolysaccharide-lacking gram-negative bacterium Sphingomonas paucimobilis. J. Bacteriol. 1994, 176, 284–290. [Google Scholar] [CrossRef] [PubMed]
  12. Francez-Charlot, A.; Kaczmarczyk, A.; Vorholt, J.A. The branched CcsA/CckA-ChpT-CtrA phosphorelay of Sphingomonas melonis controls motility and biofilm formation. Mol. Microbiol. 2015, 97, 47–63. [Google Scholar] [CrossRef] [PubMed]
  13. Pollock, T.J.; Armentrout, R.W. Planktonic/sessile dimorphism of polysaccharide-encapsulated sphingomonads. J. Ind. Microbiol. Biotechnol. 1999, 23, 436–441. [Google Scholar] [CrossRef] [PubMed]
  14. Fida, T.T.; Moreno-Forero, S.K.; Heipieper, H.J.; Springael, D. Physiology and transcriptome of the polycyclic aromatic hydrocarbon-degrading Sphingomonas sp. LH128 after long-term starvation. Microbiology 2013, 159, 1807–1817. [Google Scholar] [CrossRef] [PubMed]
  15. Tay, S.B.; Yew, W.S. Development of quorum-based anti-virulence therapeutics targeting Gram-negative bacterial pathogens. Int. J. Mol. Sci. 2013, 14, 16570–16599. [Google Scholar] [CrossRef] [PubMed]
  16. Van Delden, C.; Comte, R.; Bally, M. Stringent response activates quorum sensing and modulates cell density-dependent gene expression in Pseudomonas aeruginosa. J. Bacteriol. 2001, 183, 5376–5384. [Google Scholar] [CrossRef] [PubMed]
  17. Erickson, D.L.; Lines, J.L.; Pesci, E.C.; Venturi, V.; Storey, D.G. Pseudomonas aeruginosa relA contributes to virulence in Drosophila melanogaster. Infect. Immun. 2004, 72, 5638–5645. [Google Scholar] [CrossRef] [PubMed]
  18. Schafhauser, J.; Lepine, F.; McKay, G.; Ahlgren, H.G.; Khakimova, M.; Nguyen, D. The stringent response modulates 4-hydroxy-2-alkylquinoline biosynthesis and quorum-sensing hierarchy in Pseudomonas aeruginosa. J. Bacteriol. 2014, 196, 1641–1650. [Google Scholar] [CrossRef] [PubMed]
  19. Moris, M.; Braeken, K.; Schoeters, E.; Verreth, C.; Beullens, S.; Vanderleyden, J.; Michiels, J. Effective symbiosis between Rhizobium etli and Phaseolus vulgatis requires the alarmone ppGpp. J. Bacteriol. 2005, 187, 5460–5469. [Google Scholar] [CrossRef] [PubMed]
  20. Zhang, H.B.; Wang, C.; Zhang, L.H. The quormone degradation system of Agrobacterium tumefaciens is regulated by starvation signal and stress alarmone (p)ppGpp. Mol. Microbiol. 2004, 52, 1389–1401. [Google Scholar] [CrossRef] [PubMed]
  21. Wang, C.; Zhang, H.B.; Wang, L.H.; Zhang, L.H. Succinic semialdehyde couples stress response to quorum-sensing signal decay in Agrobacterium tumefaciens. Mol. Microbiol. 2006, 62, 45–56. [Google Scholar] [CrossRef] [PubMed]
  22. Huang, Y.L.; Zeng, Y.H.; Yu, Z.L.; Zhang, J.; Feng, H.; Lin, X.C. In silico and experimental methods revealed highly diverse bacteria with quorum sensing and aromatics biodegradation systems—A potential broad application on bioremediation. Bioresour. Technol. 2013, 148, 311–316. [Google Scholar] [CrossRef] [PubMed]
  23. Gan, H.M.; Gan, H.Y.; Ahmad, N.H.; Aziz, N.A.; Hudson, A.O.; Savka, M.A. Whole genome sequencing and analysis reveal insights into the genetic structure, diversity and evolutionary relatedness of luxI and luxR hornologs in bacteria belonging to the Sphingomonadaceae family. Front. Cell. Infect. Microbiol. 2015, 4, 188. [Google Scholar] [CrossRef] [PubMed]
  24. Lyu, Y.H.; Zheng, W.; Zheng, T.L.; Tian, Y. Biodegradation of polycyclic aromatic hydrocarbons by Novosphingobium pentaromativorans US6-1. PLoS ONE 2014, 9, e101438. [Google Scholar] [CrossRef] [PubMed]
  25. Choi, D.H.; Kwon, Y.M.; Kwon, K.K.; Kim, S.J. Complete genome sequence of Novosphingobium pentaromativorans US6-1(T). Stand. Genomic Sci. 2015, 10, 107. [Google Scholar] [CrossRef] [PubMed]
  26. Steinchen, W.; Bange, G. The magic dance of the alarmones (p)ppGpp. Mol. Microbiol. 2016, 101, 531–544. [Google Scholar] [CrossRef] [PubMed] [Green Version]
  27. Yuan, J.; Amend, A.; Borkowski, J.; Demarco, R.; Bailey, W.; Liu, Y.; Xie, G.C.; Blevins, R. Multiclustal: A systematic method for surveying Clustal W alignment parameters. Bioinformatics 1999, 15, 862–863. [Google Scholar] [CrossRef] [PubMed]
  28. Hall, B.G. Building phylogenetic trees from molecular data with MEGA. Mol. Biol. Evol. 2013, 30, 1229–1235. [Google Scholar] [CrossRef] [PubMed]
  29. Saitou, N.; Nei, M. The neighbor-joining method—A new method for reconstructing phylogenetic trees. Mol. Biol. Evol. 1987, 4, 406–425. [Google Scholar] [PubMed]
  30. Felsenstein, J. Confidence-limits on phylogenies—An approach using the bootstrap. Evolution 1985, 39, 783–791. [Google Scholar] [CrossRef] [PubMed]
  31. Zhang, S.R.; Lin, G.M.; Chen, W.L.; Wang, L.; Zhang, C.C. ppGpp metabolism is involved in heterocyst development in the cyanobacterium Anabaena sp. strain PCC 7120. J. Bacteriol. 2013, 195, 4536–4544. [Google Scholar] [CrossRef] [PubMed]
  32. Cashel, M.; Gallant, J. Two compounds implicated in the function of the RC gene of Escherichia coli. Nature 1969, 221, 838–841. [Google Scholar] [CrossRef] [PubMed]
  33. Gan, H.M.; Buckley, L.; Szegedi, E.; Hudson, A.O.; Savka, M.A. Identification of an rsh Gene from a Novosphingobium sp. necessary for quorum-sensing signal accumulation. J. Bacteriol. 2009, 191, 2551–2560. [Google Scholar] [CrossRef] [PubMed]
  34. Primm, T.P.; Andersen, S.J.; Mizrahi, V.; Avarbock, D.; Rubin, H.; Barry, C.E. The stringent response of Mycobacterium tuberculosis is required for long-term survival. J. Bacteriol. 2000, 182, 4889–4898. [Google Scholar] [CrossRef] [PubMed]
  35. Mechold, U.; Cashel, M.; Steiner, K.; Gentry, D.; Malke, H. Functional analysis of a relA/spoT gene homolog from Streptococcus equisimilis. J. Bacteriol. 1996, 178, 1401–1411. [Google Scholar] [CrossRef] [PubMed]
  36. Calderón-Flores, A.; Du Pont, G.; Huerta-Saquero, A.; Merchant-Larios, H.; Servín-González, L.; Durán, S. The stringent response is required for amino acid and nitrate utilization, nod factor regulation, nodulation, and nitrogen fixation in Rhizobium etli. J. Bacteriol. 2005, 187, 5075–5083. [Google Scholar] [CrossRef] [PubMed]
  37. Huang, Y.L.; Ki, J.S.; Case, R.J.; Qian, P.Y. Diversity and acyl-homoserine lactone production among subtidal biofilm-forming bacteria. Aquat. Microb. Ecol. 2008, 52, 185–193. [Google Scholar] [CrossRef] [Green Version]
  38. Liu, K.Q.; Bittner, A.N.; Wang, J.D. Diversity in (p)ppGpp metabolism and effectors. Curr. Opin. Microbiol. 2015, 24, 72–79. [Google Scholar] [CrossRef] [PubMed] [Green Version]
  39. Magnusson, L.U.; Farewell, A.; Nystrom, T. ppGpp: a global regulator in Escherichia coli. Trends Microbiol. 2005, 13, 236–242. [Google Scholar] [CrossRef] [PubMed]
  40. Eymann, C.; Homuth, G.; Scharf, C.; Hecker, M. Bacillus subtilis functional genomics: global characterization of the stringent response by proteome and transcriptome analysis. J. Bacteriol. 2002, 184, 2500–2520. [Google Scholar] [CrossRef] [PubMed]
  41. Bowden, S.D.; Eyres, A.; Chung, J.C.S.; Monson, R.E.; Thompson, A.; Salmond, G.P.C.; Spring, D.R.; Welch, M. Virulence in Pectobacterium atrosepticum is regulated by a coincidence circuit involving quorum sensing and the stress alarmone, (p)ppGpp. Mol. Microbiol. 2013, 90, 457–471. [Google Scholar] [CrossRef] [PubMed]
  42. Karunakaran, D.K.P.; Al Seesi, S.; Banday, A.R.; Baumgartner, M.; Olthof, A.; Lemoine, C.; Măndoiu, I.I.; Kanadia, R.N. Network-based bioinformatics analysis of spatio-temporal RNA-Seq data reveals transcriptional programs underpinning normal and aberrant retinal development. BMC Genomics 2016, 17, 495. [Google Scholar] [CrossRef] [PubMed] [Green Version]
  43. Deng, W.K.; Wang, Y.B.; Liu, Z.X.; Cheng, H.; Xue, Y. HemI: A toolkit for illustrating heatmaps. PLoS ONE 2014, 9, e111988. [Google Scholar] [CrossRef] [PubMed]
  44. Galloway, W.R.J.D.; Hodgkinson, J.T.; Bowden, S.D.; Welch, M.; Spring, D.R. Quorum sensing in Gram-negative bacteria: Small-molecule modulation of AHL and AI-2 quorum sensing pathways. Chem. Rev. 2011, 111, 28–67. [Google Scholar] [CrossRef] [PubMed]
  45. Dalebroux, Z.D.; Swanson, M.S. ppGpp: Magic beyond RNA polymerase. Nat. Rev. Microbiol. 2012, 10, 203–212. [Google Scholar] [CrossRef] [PubMed]
  46. Liu, X.X.; Ji, L.; Wang, X.; Li, J.R.; Zhu, J.L.; Sun, A.H. Role of RpoS in stress resistance, quorum sensing and spoilage potential of Pseudomonas fluorescens. Int. J. Food Microbiol. 2018, 270, 31–38. [Google Scholar] [CrossRef] [PubMed]
  47. Gu, D.; Guo, M.; Yang, M.J.; Zhang, Y.X.; Zhou, X.H.; Wang, Q.Y. A sigma(E)-mediated temperature gauge controls a switch from LuxR-mediated virulence gene expression to thermal stress adaptation in Vibrio alginolyticus. PLoS Pathog. 2016, 12, e1005645. [Google Scholar] [CrossRef] [PubMed]
  48. Li, J.; Overall, C.C.; Johnson, R.C.; Jones, M.B.; McDermott, J.E.; Heffron, F.; Adkins, J.N.; Cambronne, E.D. ChIP-Seq Analysis of the sigma(E) regulon of Salmonella enterica serovar Typhimurium reveals new genes implicated in heat shock and oxidative stress response. PLoS ONE 2015, 10, e0138466. [Google Scholar] [CrossRef]
  49. Devescovi, G.; Venturi, V. The Burkholderia cepacia rpoE gene is not involved in exopolysaccharide production and onion pathogenicity. Can. J. Microbiol. 2006, 52, 260–265. [Google Scholar] [CrossRef] [PubMed]
  50. Magnusson, L.U.; Gummesson, B.; Joksimović, P.; Farewell, A.; Nyström, T. Identical, independent, and opposing roles of ppGpp and DksA in Escherichia coli. J. Bacteriol. 2007, 189, 5193–5202. [Google Scholar] [CrossRef] [PubMed]
  51. Jude, F.; Köhler, T.; Branny, P.; Perron, K.; Mayer, M.P.; Comte, R.; van Delden, C. Posttranscriptional control of quorum-sensing-dependent virulence genes by DksA in Pseudomonas aeruginosa. J. Bacteriol. 2003, 185, 3558–3566. [Google Scholar] [CrossRef] [PubMed]
  52. Takaya, A.; Tabuchi, F.; Tsuchiya, H.; Isogai, E.; Yamamoto, T. Negative regulation of quorum-sensing systems in Pseudomonas aeruginosa by ATP-dependent Lon protease. J. Bacteriol. 2008, 190, 4181–4188. [Google Scholar] [CrossRef] [PubMed]
  53. Baumgardt, K.; Charoenpanich, P.; Mcintosh, M.; Schikora, A.; Stein, E.; Thalmann, S.; Kogel, K.H.; Klug, G.; Becker, A.; Evguenieva-Hackenberg, E. RNase E affects the expression of the acyl-homoserine lactone synthase gene sinI in Sinorhizobium meliloti. J. Bacteriol. 2014, 196, 1435–1447. [Google Scholar] [CrossRef] [PubMed]
  54. McIntosh, M.; Stone, B.A.; Stanisich, V.A. Curdlan and other bacterial (1 → 3)-β-d-glucans. Appl. Microbiol. Biotechnol. 2005, 68, 163–173. [Google Scholar] [CrossRef] [PubMed]
  55. Wells, D.H.; Long, S.R. The Sinorhizobium meliloti stringent response affects multiple aspects of symbiosis. Mol. Microbiol. 2002, 43, 1115–1127. [Google Scholar] [CrossRef] [PubMed]
  56. Yun, S.H.; Choi, C.W.; Lee, S.Y.; Lee, Y.G.; Kwon, J.; Leem, S.H.; Chung, Y.H.; Kahng, H.Y.; Kim, S.J.; Kwon, K.K.; et al. Proteomic characterization of plasmid pLA1 for biodegradation of polycyclic aromatic hydrocarbons in the marine bacterium, Novosphingobium pentaromativorans US6-1. PLoS ONE 2014, 9, e90812. [Google Scholar] [CrossRef] [PubMed]
  57. Raman, M.C.C.; Johnson, K.A.; Clarke, D.J.; Naismith, J.H.; Campopiano, D.J. The serine palmitoyltransferase from Sphingomonas wittichii RW1: An interesting link to an unusual acyl carrier protein. Biopolymers 2010, 93, 811–822. [Google Scholar] [CrossRef] [PubMed]
  58. Ikushiro, H.; Hayashi, H.; Kagamiyama, H. A water-soluble homodimeric serine palmitoyltransferase from Sphingomonas paucimobilis EY2395T Strain. J. Biol. Chem. 2001, 276, 18249–18256. [Google Scholar] [CrossRef] [PubMed]
  59. An, D.D.; Na, C.Z.; Bielawski, J.; Hannun, Y.A.; Kasper, D.L. Membrane sphingolipids as essential molecular signals for Bacteroides survival in the intestine. Proc. Natl. Acad. Sci. USA 2011, 108, 4666–4671. [Google Scholar] [CrossRef] [PubMed]
  60. Eguchi, M.; Nishikawa, T.; MacDonald, K.; Cavicchioli, R.; Gottschal, J.C.; Kjelleberg, S. Responses to stress and nutrient availability by the marine ultramicrobacterium Sphingomonas sp. strain RB2256. Appl. Environ. Microbiol. 1996, 62, 1287–1294. [Google Scholar] [PubMed]
  61. Vanoverbeek, L.S.; Eberl, L.; Givskov, M.; Molin, S.; Vanelsas, J.D. Survival of, and induced stress resistance in, carbon-starved Pseudomonas-fluorescens cells residing in soil. Appl. Environ. Microbiol. 1995, 61, 4202–4208. [Google Scholar]
  62. Simon, R.; Priefer, U.; Pühler, A. A broad host range mobilization system for in vivo genetic engineering: Transposon mutagenesis in Gram negative bacteria. Nat. Biotechnol. 1983, 1, 784–791. [Google Scholar] [CrossRef]
  63. Mclean, R.J.C.; Whiteley, M.; Stickler, D.J.; Fuqua, W.C. Evidence of autoinducer activity in naturally occurring biofilms. FEMS Microbiol. Lett. 1997, 154, 259–263. [Google Scholar] [CrossRef] [PubMed]
  64. Kaczmarczyk, A.; Vorholt, J.A.; Francez-Charlot, A. Markerless gene deletion system for sphingomonads. Appl. Environ. Microbiol. 2012, 78, 3774–3777. [Google Scholar] [CrossRef] [PubMed]
  65. Marx, C.J.; Lidstrom, M.E. Development of improved versatile broad-host-range vectors for use in methylotrophs and other Gram-negative bacteria. Microbiology 2001, 147, 2065–2075. [Google Scholar] [CrossRef] [PubMed] [Green Version]
  66. Hall, T.A. BioEdit: A user-friendly biological sequence alignment editor and analysis program for Windows 95/98/NT. Nucleic Acids Symp. Ser. 1999, 41, 95–98. [Google Scholar]
  67. Camacho, C.; Coulouris, G.; Avagyan, V.; Ma, N.; Papadopoulos, J.; Bealer, K.; Madden, T.L. BLAST plus: Architecture and applications. BMC Bioinform. 2009, 10, 421. [Google Scholar] [CrossRef] [PubMed]
  68. Washio, K.; Lim, S.P.; Roongsawang, N.; Morikawa, M. Identification and characterization of the genes responsible for the production of the cyclic lipopeptide arthrofactin by Pseudomonas sp. MIS38. Biosci. Biotechnol. Biochem. 2010, 74, 992–999. [Google Scholar] [CrossRef] [PubMed]
  69. Gao, J.; Ma, A.Z.; Zhuang, X.L.; Zhuang, G.Q. An N-acyl homoserine lactones synthase in the ammonia-oxidizing bacterium Nitrosospira multiformis. Appl. Environ. Microbiol. 2014, 80, 951–958. [Google Scholar] [CrossRef] [PubMed]
  70. Kim, D.; Langmead, B.; Salzberg, S.L. HISAT: A fast spliced aligner with low memory requirements. Nat. Methods 2015, 12, 357–360. [Google Scholar] [CrossRef] [PubMed]
  71. Li, B.; Dewey, C.N. RSEM: Accurate transcript quantification from RNA-Seq data with or without a reference genome. BMC Bioinform. 2011, 12, 323. [Google Scholar] [CrossRef] [PubMed]
  72. Love, M.I.; Huber, W.; Anders, S. Moderated estimation of fold change and dispersion for RNA-seq data with DESeq2. Genome Biol. 2014, 15, 550. [Google Scholar] [CrossRef] [PubMed]
  73. Zeng, Y.H.; Wang, Y.L.; Yu, Z.L.; Huang, Y.L. Hypersensitive response of plasmid-encoded ahl synthase gene to lifestyle and nutrient by Ensifer adhaerens X097. Front. Microbiol. 2017, 8, 1160. [Google Scholar] [CrossRef] [PubMed]
  74. Schmittgen, T.D.; Livak, K.J. Analyzing real-time PCR data by the comparative CT method. Nat. Protoc. 2008, 3, 1101–1108. [Google Scholar] [CrossRef] [PubMed]
  75. Hanna, N.; Ouahrani-Bettache, S.; Drake, K.L.; Adams, L.G.; Köhler, S.; Occhialini, A. Global Rsh-dependent transcription profile of Brucella suis during stringent response unravels adaptation to nutrient starvation and cross-talk with other stress responses. BMC Genomics 2013, 14, 459. [Google Scholar] [CrossRef] [PubMed]
  76. Liu, H.Z.; Xiao, Y.J.; Nie, H.L.; Huang, Q.Y.; Chen, W.L. Influence of (p)ppGpp on biofilm regulation in Pseudomonas putida KT2440. Microbiol. Res. 2017, 204, 1–8. [Google Scholar] [CrossRef] [PubMed]
Figure 1. Sequence analysis of RshUS6–1 protein. (a) RshUS6–1 domain; (b) amino acid alignment of RelA/SpoT homologs. Line 1: RshUS6–1. Line 2: RshRr2–17. Line 3: RshMtb. Line 4: RshSeq. Line 5: RshRet. Line 6: SpoTEcoli. Line 7: RelAEcoli (see in Materials and Methods). Light grey boxes represent six conserved motifs in HD domain (HD 1: R. HD 2: H. HD 3: HD. HD 4: ED. HD 5: DR. HD 6: N) while dark grey boxes represent five conserved motifs in Syn domain (Syn 1: RxKxxxSxxxK. Syn 2: DxxxxR. Syn 3: YxxxH. Syn 4: ExQIRT. Syn 5: H) [26]; (c) phylogenetic tree based on RelA/SpoT homologs. Sequences, available at NCBI GenBank, were aligned by using the ClustalW algorithm [27] in MEGA version 6.0 [28]. Then a phylogenetic tree was constructed by the neighbor-joining method [29] with 1000 bootstrap replicates [30] after cutting off the redundant sequences at the end, with the use of MEGA version 6.0. The Rsh protein from Anabaena sp. PCC 7120 (accession number BAB77915) was used as outgroup [31]. There were five clusters: C1 for Rsh in Alphaproteobacteria, C2 for SpoT in Gammaproteobacteria, C3 for Rsh in Actinobacteria, C4 for RelA in Gammaproteobacteria, C5 for Rsh in Firmicutes.
Ijms 19 02631 g001
Figure 2. AHL accumulation in US6-1, ∆rsh andrsh (pCM62-rsh). (a) AHL accumulation assay by cross-feeding. P5Y3 agar plate was covered with 50 µL X-gal. The AHL reporter strain A136 and the tested strains were streaked side by side on the agar plates. Plates were incubated for 24 h, when the activation of the reporter was recorded. Strain A136 versus A136 was used as negative control. One representative experiment out of three independent biological replicates is shown. (b) Time course of population density of US6-1 (filled squares), ∆rsh (filled circles) and ∆rsh (pCM62-rsh) (filled triangles) and AHL accumulation of US6-1 (open squares) and ∆rsh (pCM62-rsh) (open triangles) in the extract assay. Fresh colonies of strains were first inoculated into P5Y3 broth at the shaking speed of 200 rpm to an OD600 value of 1. Then 250 µL of this seed culture was re-inoculated into 50 mL of fresh P5Y3 broth and incubated statically. The growth curve was drawn from measuring the OD600 values. AHL signals in cultures were then extracted by ethyl acetate (EA). The extracts were spotted onto LB soft agar plates plus X-gal mixed with A136. The plates were incubated for 12 h at 30 °C and the diameters of blue stains which represented the quantity of AHL signals in bacterial cultures were measured. No AHL was detected in ∆rsh. Values shown are the average of biological triplicate experiments with standard deviations marked with error bars.
Ijms 19 02631 g002
Figure 3. ppGpp accumulation in strain US6-1, ∆rsh and ∆rsh (pCM62-rsh) in different growth phases. Levels of ppGpp in cultures of US6-1 (a,d), ∆rsh (b,e) and ∆rsh (pCM62-rsh) (c,f) in the exponential growth phase (36 h) and in the stationary phase (72 h) were monitored by reverse phase high-performance liquid chromatography (HPLC) analysis. The eluted nucleotides were monitored at 254 nm and identified by comparison with the retention time of 100 µM ppGpp standard. ppGpp standard was eluted at 71 min under the current conditions and the position is indicated by an arrow.
Ijms 19 02631 g003
Figure 4. Differentially expressed genes (DEGs) overview (∆rsh vs. US6-1) in the RNA-seq data. (a) Over-represented Kyoto Encyclopedia of Genes and Genomes (KEGG) categories. KEGG annotation and pathway enrichment analysis was performed using the KEGG pathway database (http://www.genome.jp/kegg/). The p values denote the enriched levels in a KEGG pathway, which was calculated using a Fisher’s exact test [42]. Up- and down-regulated genes (∆rsh vs. US6-1) are represented by red and blue bars respectively, representing the number of genes per functional category. (b) Heat map of log2 expression ratios of specific DEGs involved in AHL production, sigma factor synthesis, RNA degradation, EPS biosynthesis, PAH degradation, sphingolipid production, cell division and shape, GTP synthesis and other functions in strain US6-1 and ∆rsh. Expression values are reflected by red-blue coloring as indicated. The heat map was drawn by the software HemI [43].
Ijms 19 02631 g004
Figure 5. Identification of degradation of the medium-chain AHL by ∆rsh. Strain ∆rsh was incubated with 2 µM C8-AHL (a) and 3-OH-C8-AHL (b) in culture medium for 24 h (early exponential growth phase), 48 h (late exponential growth phase) and 72 h (stationary phase), after which the EA extracts were spotted onto AHL reporter plates mixed with A136. The diameters of the blue stains represent the quantity of residual AHL signals. To avoid the influence of the AHL produced by strain US6-1 in the exponential growth phase, novI deletion mutant (∆novI) which could not produce AHL was used as positive control. Blank medium (BM) with AHL was used as negative control.
Ijms 19 02631 g005
Figure 6. Assessment of EPS production of strain US6-1, ∆rsh and ∆rsh (pCM62-rsh). (a) Colony biofilm morphology of strains on the P5Y3 plates containing 40 μg/mL Congo red. One representative experiment out of three independent biological replicates is shown. The white bar represents 5 mm. (b) Congo red binding assay. The biomass of strains grown in static culture for 96 h was determined gravimetrically as cell wet weigh. The bacterial mass was then mixed with 1 mL of Congo red (100 μg/mL) in 0.9% saline for binding. After removing the biomass, the OD490 of unbound Congo red in supernatant was measured and the percentage of Congo red left in supernatant g−1 was shown. The OD490 of 100 μg/mL Congo red in 0.9% saline was used as the control. The results are averages of three replicates, and the error bars indicate standard deviations. “***” represents p < 0.001.
Ijms 19 02631 g006
Table 1. Relative expression levels of novI and novR by quantitative reverse transcription polymerase chain reaction (qRT-PCR). RNA samples were extracted from bacterial cultures after 24 h, 36 h, 48 h and 72 h. The levels of gene expression in US6-1, ∆rsh, ∆rsh (pCM62-rsh) were normalized to 16S rRNA gene, and the relative levels in ∆rsh and ∆rsh (pCM62-rsh) to that in the wild-type strain (set as value of 1) were reported. Values shown are the average of biological triplicate experiments with standard deviations (mean ± standard deviation (SD)). “*” represents p < 0.05; “**” represents p < 0.01; “***” represents p < 0.001.
GenesStrains24 h36 h48 h96 h
novIUS6-11.166 ± 0.7731.060 ± 0.4661.115 ± 0.6471.039 ± 0.356
rsh0.261 ± 0.0830.011 ± 0.002 *0.020 ± 0.004 *0.026 ± 0.004 **
rsh (pCM62-rsh)0.501 ± 0.085 ***0.648 ± 0.2160.753 ± 0.0973.975 ± 1.547 *
novRUS6-11.012 ± 0.1851.006 ± 0.1291.001 ± 0.0551.029 ± 0.314
rsh0.119 ± 0.018 **0.068 ± 0.005 ***0.547 ± 0.017 ***0.881 ± 0.354
rsh (pCM62-rsh)0.601 ± 0.050 **0.463 ± 0.0760.543 ± 0.0542.486 ± 0.972
Table 2. Bacterial strains and plasmids used in this study.
Strains or PlasmidsRelevant TraitsSource or Reference
Strains
N. pentaromativorans
US6-1Wild type (JCM 12182)Microbe division JCM
rshUS6-1, rshUS6-1 deletion mutant, RifrThis study
rsh (pCM62-rsh)rsh with the plasmid pCM62-rsh, TcrThis study
novIUS6-1, novI deletion mutant, RifrLab stock
E. coli
DH5αF- hsdR17 endA1 thi-1 gyrA96 relA1 supE44∆lacU169 (ψ80dlacZ∆M15)TransGen Biotech
S17-1 (λpir)E. coli K-12 Tpr Smr recA thi hsdRM+ RP4::2-Tc::Mu::Km Tn7, λpir phage lysogen[62]
A. tumefaciens A136 (pCF218) (pCF372)traI-lacZ fusion; AHL biosensor; Tcr Spr[63]
Plasmids
pMD19-TT-vector, AmprTaKaRa, Dalian, China
pAK405Plasmid for allelic exchange and markerless gene deletions; Kmr[64]
pAK405-rshpAK405 with fusion of up- and downstream regions of rshUS6-1; KmrThis study
pCM62Broad-host-range cloning vector; IncP origin of replication; Tcr[65]
pCM62-rshpCM62 with rshUS6-1 ORF and 502 bp of upstream region; TcrThis study

