Article

Deletion of Bmal1 Prevents Diet-Induced Ectopic Fat Accumulation by Controlling Oxidative Capacity in the Skeletal Muscle

1
Laboratory of Health Science, School of Pharmacy, Nihon University, 7-7-1 Narashinodai, Chiba, Funabshi 274-8555, Japan
2
Laboratory of Pharmacology, School of Pharmacy, Nihon University, 7-7-1 Narashinodai, Chiba, Funabshi 274-8555, Japan
3
Laboratory of Organic Chemistry, School of Pharmacy, Nihon University, 7-7-1 Narashinodai, Chiba, Funabshi 274-8555, Japan
4
Division of Biochemistry, Department of Biomedical Sciences, School of Medicine, Nihon University, 30-1 Oyaguchi-Kamicho, Itabashi-ku, Tokyo 173-8610, Japan
5
Biological Clock Research Group, Biomedical Research Institute, National Institute of Advanced Industrial Science and Technology (AIST), Tsukuba, Ibaraki 305-8566, Japan
*
Author to whom correspondence should be addressed.
Int. J. Mol. Sci. 2018, 19(9), 2813; https://doi.org/10.3390/ijms19092813
Submission received: 11 August 2018 / Revised: 12 September 2018 / Accepted: 15 September 2018 / Published: 18 September 2018
(This article belongs to the Special Issue Circadian Rhythms: Molecular and Physiological Mechanisms)

Abstract

:
Brain and muscle arnt-like protein 1 (BMAL1), is a transcription factor known to regulate circadian rhythm. BMAL1 was originally characterized by its high expression in the skeletal muscle. Since the skeletal muscle is the dominant organ system in energy metabolism, the possible functions of BMAL1 in the skeletal muscle include the control of metabolism. Here, we established that its involvement in the regulation of oxidative capacity in the skeletal muscle. Muscle-specific Bmal1 KO mice (MKO mice) displayed several physiological hallmarks for the increase of oxidative capacity. This included increased energy expenditure and oxygen consumption, high running endurance and resistance to obesity with improved metabolic profiles. Also, the phosphorylation status of AMP-activated protein kinase and its downstream signaling substrate acetyl-CoA carboxylase in the MKO mice were substantially higher than those in the Bmal1flox/flox mice. In addition, biochemical and histological studies confirmed the substantial activation of oxidative fibers in the skeletal muscle of the MKO mice. The mechanism includes the regulation of Cacna1s expression, followed by the activation of calcium—nuclear factor of activated T cells (NFAT) axis. We thus conclude that BMAL1 is a critical regulator of the muscular fatty acid level under nutrition overloading and that the mechanism involves the control of oxidative capacity.

Graphical Abstract

1. Introduction

Brain and muscle arnt-like protein 1 (BMAL1), also referred to as Arntl, Arnt3 and, MOP3 is a transcription factor that has a basic-helix-loop-helix (bHLH)/Per-Arnt-Sim (PAS) domain and regulates circadian rhythm of a spectrum of gene expressions [1,2,3]. BMAL1 forms heterodimers with another bHLH/PAS protein, circadian locomotor output cycles kaput (CLOCK) and the complex drives transcription from E-box elements found in the promoter of circadian-responsive genes including period (Per) and cryptochrome (Cry) [4,5,6].
Global Bmal1−/− mice show several severe phenotypes, including changes in the rhythmicity of behavior, life span, body size, activity level and metabolic activity [7,8,9,10]. An extensive circadian cistrome analysis of the liver uncovered the presence of approx. 5900 BMAL1 binding sites in the genome [11,12,13,14]. The binding sites are associated with carbohydrate and lipid metabolism, transcriptional regulation and the cell cycle [11]. These results indicate that, in addition to the control of circadian rhythm in behavior, BMAL1 functions in the regulation of complex physiologic properties.
BMAL1 was originally characterized by its high expression in the brain and the skeletal muscle, suggesting the crucial roles in these tissues [1]. Indeed, several studies revealed the potential roles of BMAL1 in the regulation of muscular functions. First, the introduction of the Bmal1 gene into the skeletal muscle of global Bmal1 KO mice improved their activity level and body size of the mice [15]. Second, expression of the molecular circadian clock genes such as Bmal1 and Clock and the genes related to muscle-specific functions showed a circadian rhythm in the skeletal muscle [16,17,18]. Importantly, most of the diurnal changes in these gene expressions were diminished in the Clock mutant mice [17]. Third, BMAL1 controls intracellular glucose metabolism through the regulation of pyruvate dehydrogenase activity [19,20]. Moreover, the deletion of Bmal1 alone from adult skeletal muscle resulted in reductions in specific tension and increased muscle fibrosis [21].
Given the fact that the skeletal muscle is the dominant organ responsible for energy metabolism, a contribution of BMAL1 to the regulation of fatty acid metabolism is suggested. In this study, to better understand the role of BMAL1 in fatty acid metabolism in the skeletal muscle, mice with the specific deletion of Bmal1 in the skeletal muscle (MKO mice) were subjected to a high fat diet (HFD) challenge. The results demonstrated that the deletion of Bmal1 gene in the skeletal muscle prevents deposition of lipid and insulin resistance in obesity. The mechanism involves the increase of oxidative capacity and fatty acid oxidation activity.

2. Results

2.1. Deletion of Bmal1 Gene Has No Effects on the Body Weight, Behavior, or Muscular Structure

Muscle-specific Bmal1 KO mice (MKO) were generated as described previously [10]. In all experiments, male Bmal1flox/flox mice were used as the control. The phenotypes of the MKO mice showed both similarities and strikingly differences compared to those of the global Bmal1 KO mice [8]. Regarding the body weight and food intake, there were no significant differences between the Bmal1flox/flox mice and MKO mice (Figure 1A,B). However, our evaluation of the tissue weights revealed a significant increase in the weight of the soleus (Sol), as well as trends of increased gastrocnemius weight (GN) and decreased extensor digitorum longus (EDL) weight in the MKO mice compared to the Bmal1flox/flox mice (Figure 1B). The tissue weight of the heart in the MKO mice was slightly but significantly heavier than that in the Bmal1flox/flox mice (Figure 1B). Other tissue weight determined showed no significant differences (Figure 1B). The daily free-moving activity and the length of period in the MKO mice were comparable to those in the Bmal1flox/flox mice (Figure 1C). This result is consistent with previous studies and confirms that the deletion of Bmal1 in the skeletal muscle has no substantial effects on circadian pattern of behavior [21]. The structural analysis by electron microscopy and gene expression analysis of myosin heavy chain isoforms showed no significant differences between the two genotypes of mice (Figure 1D,E).

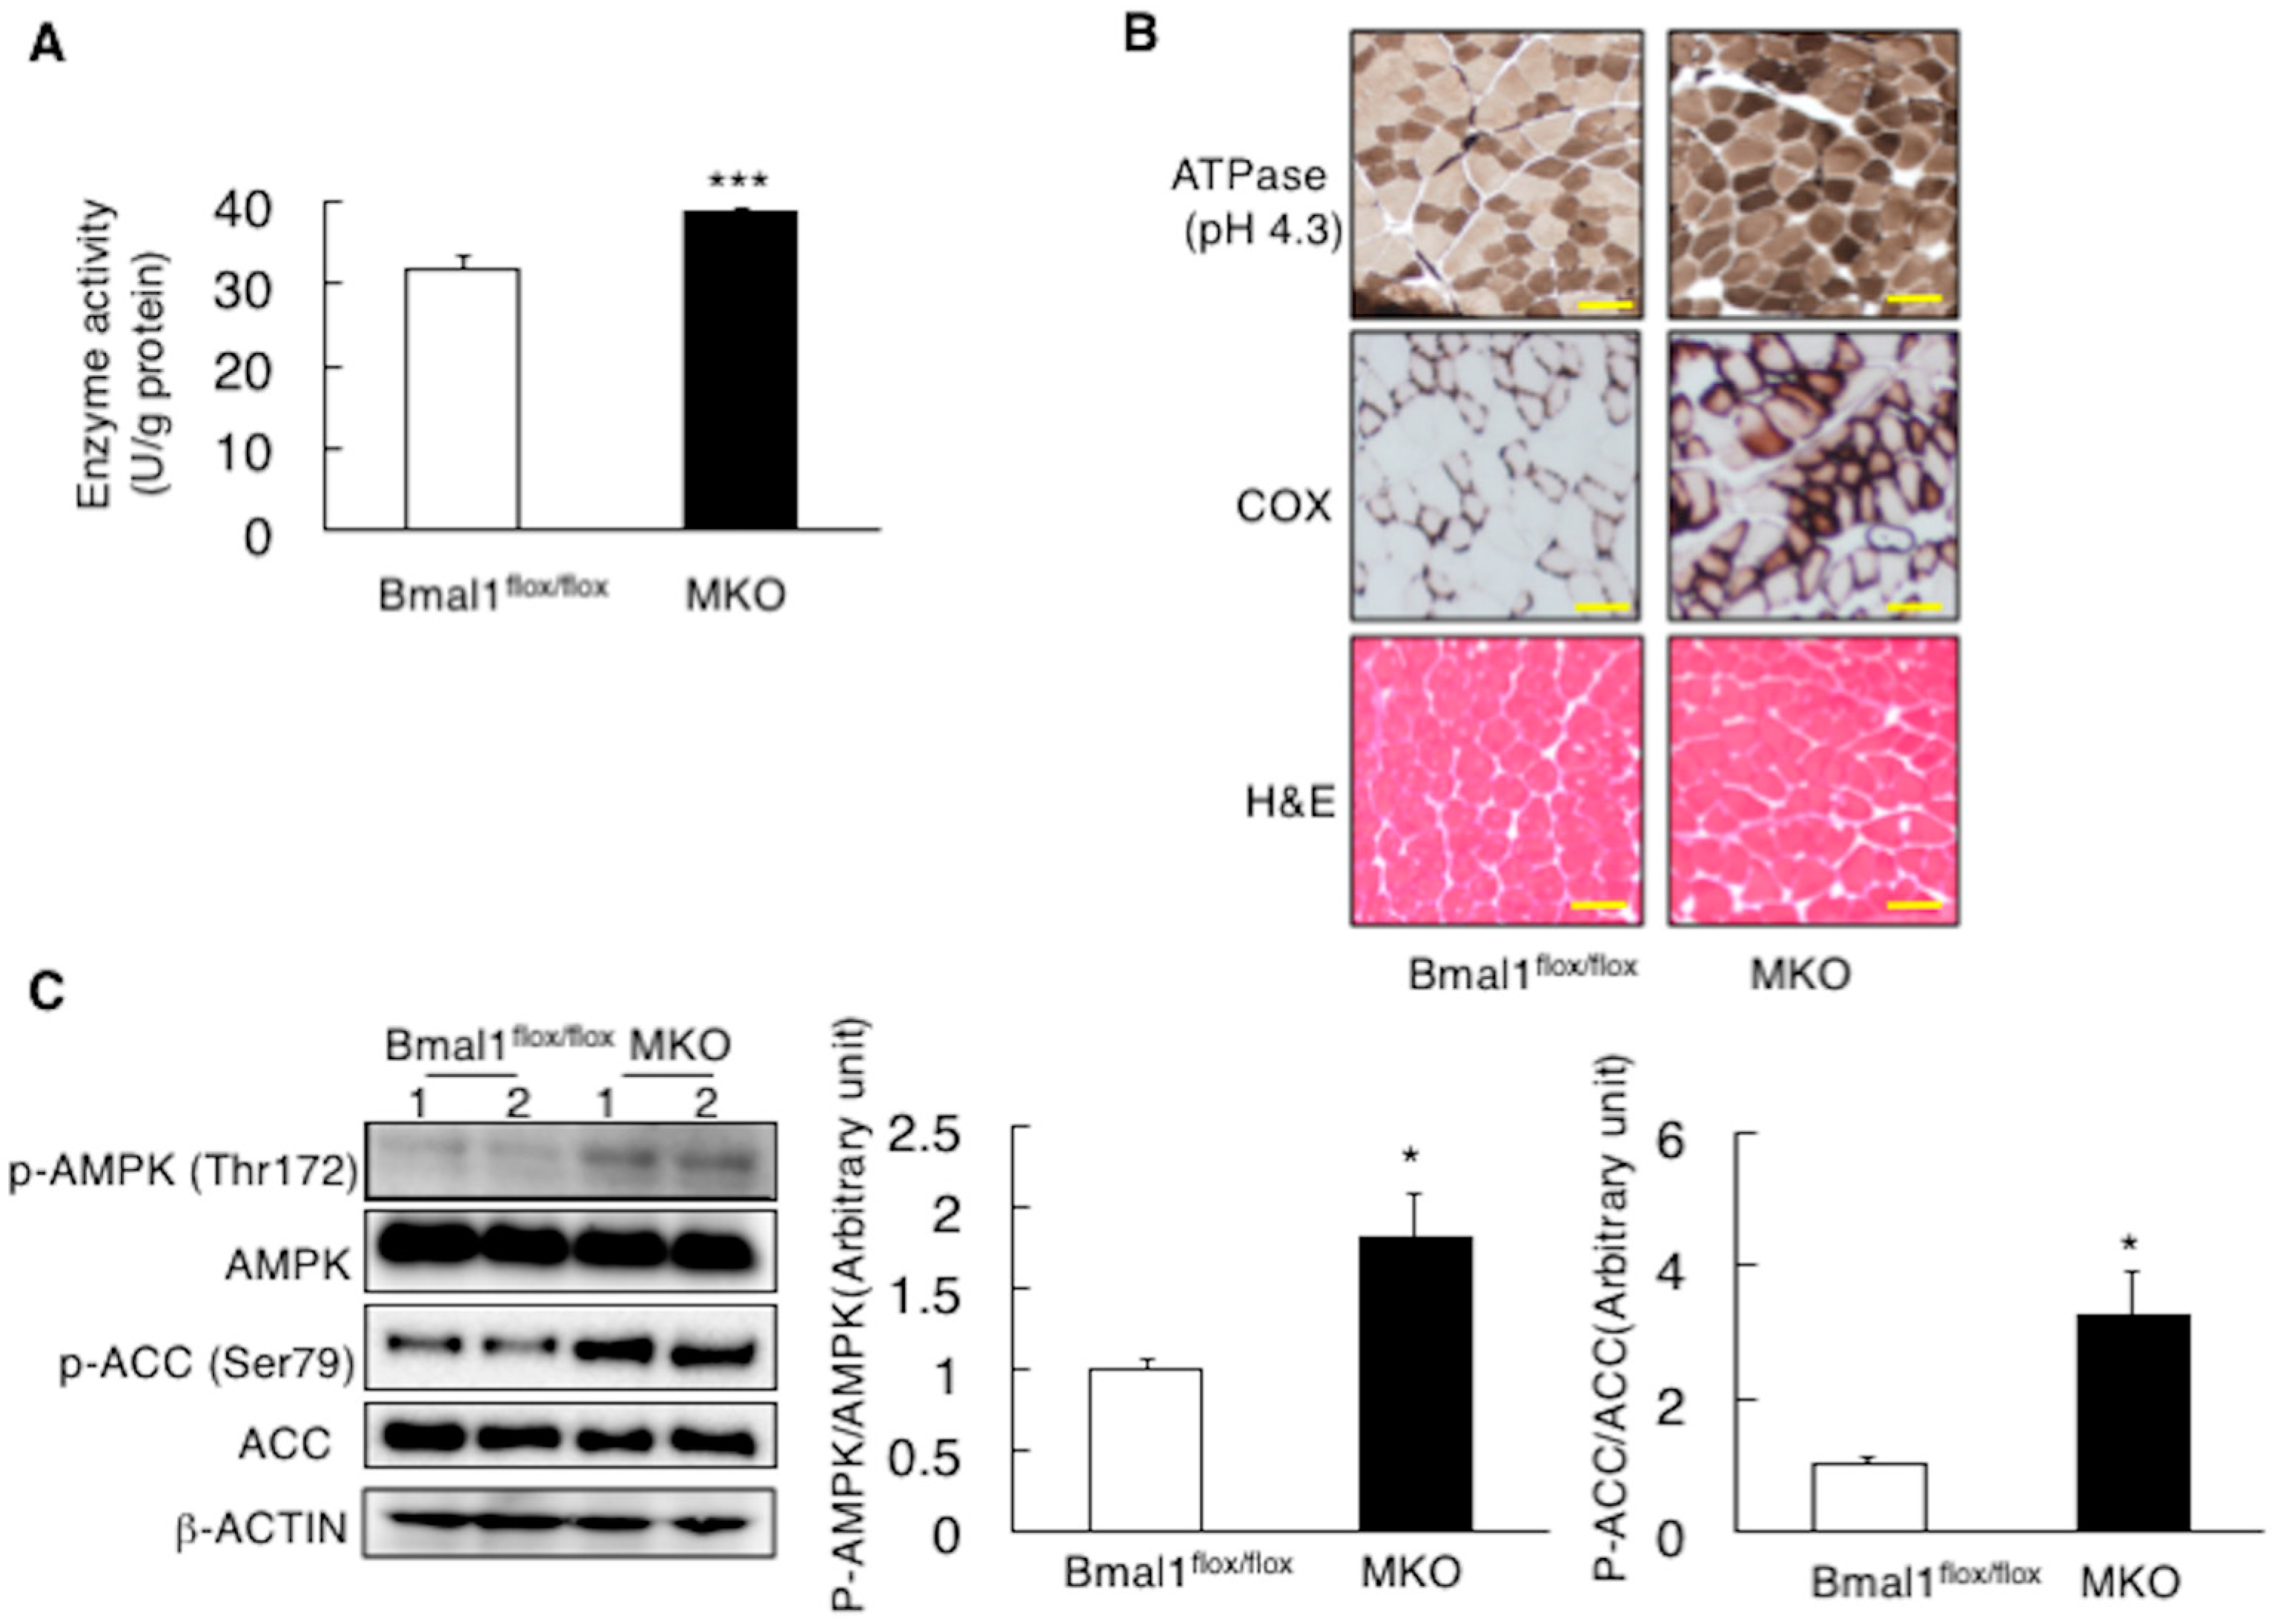
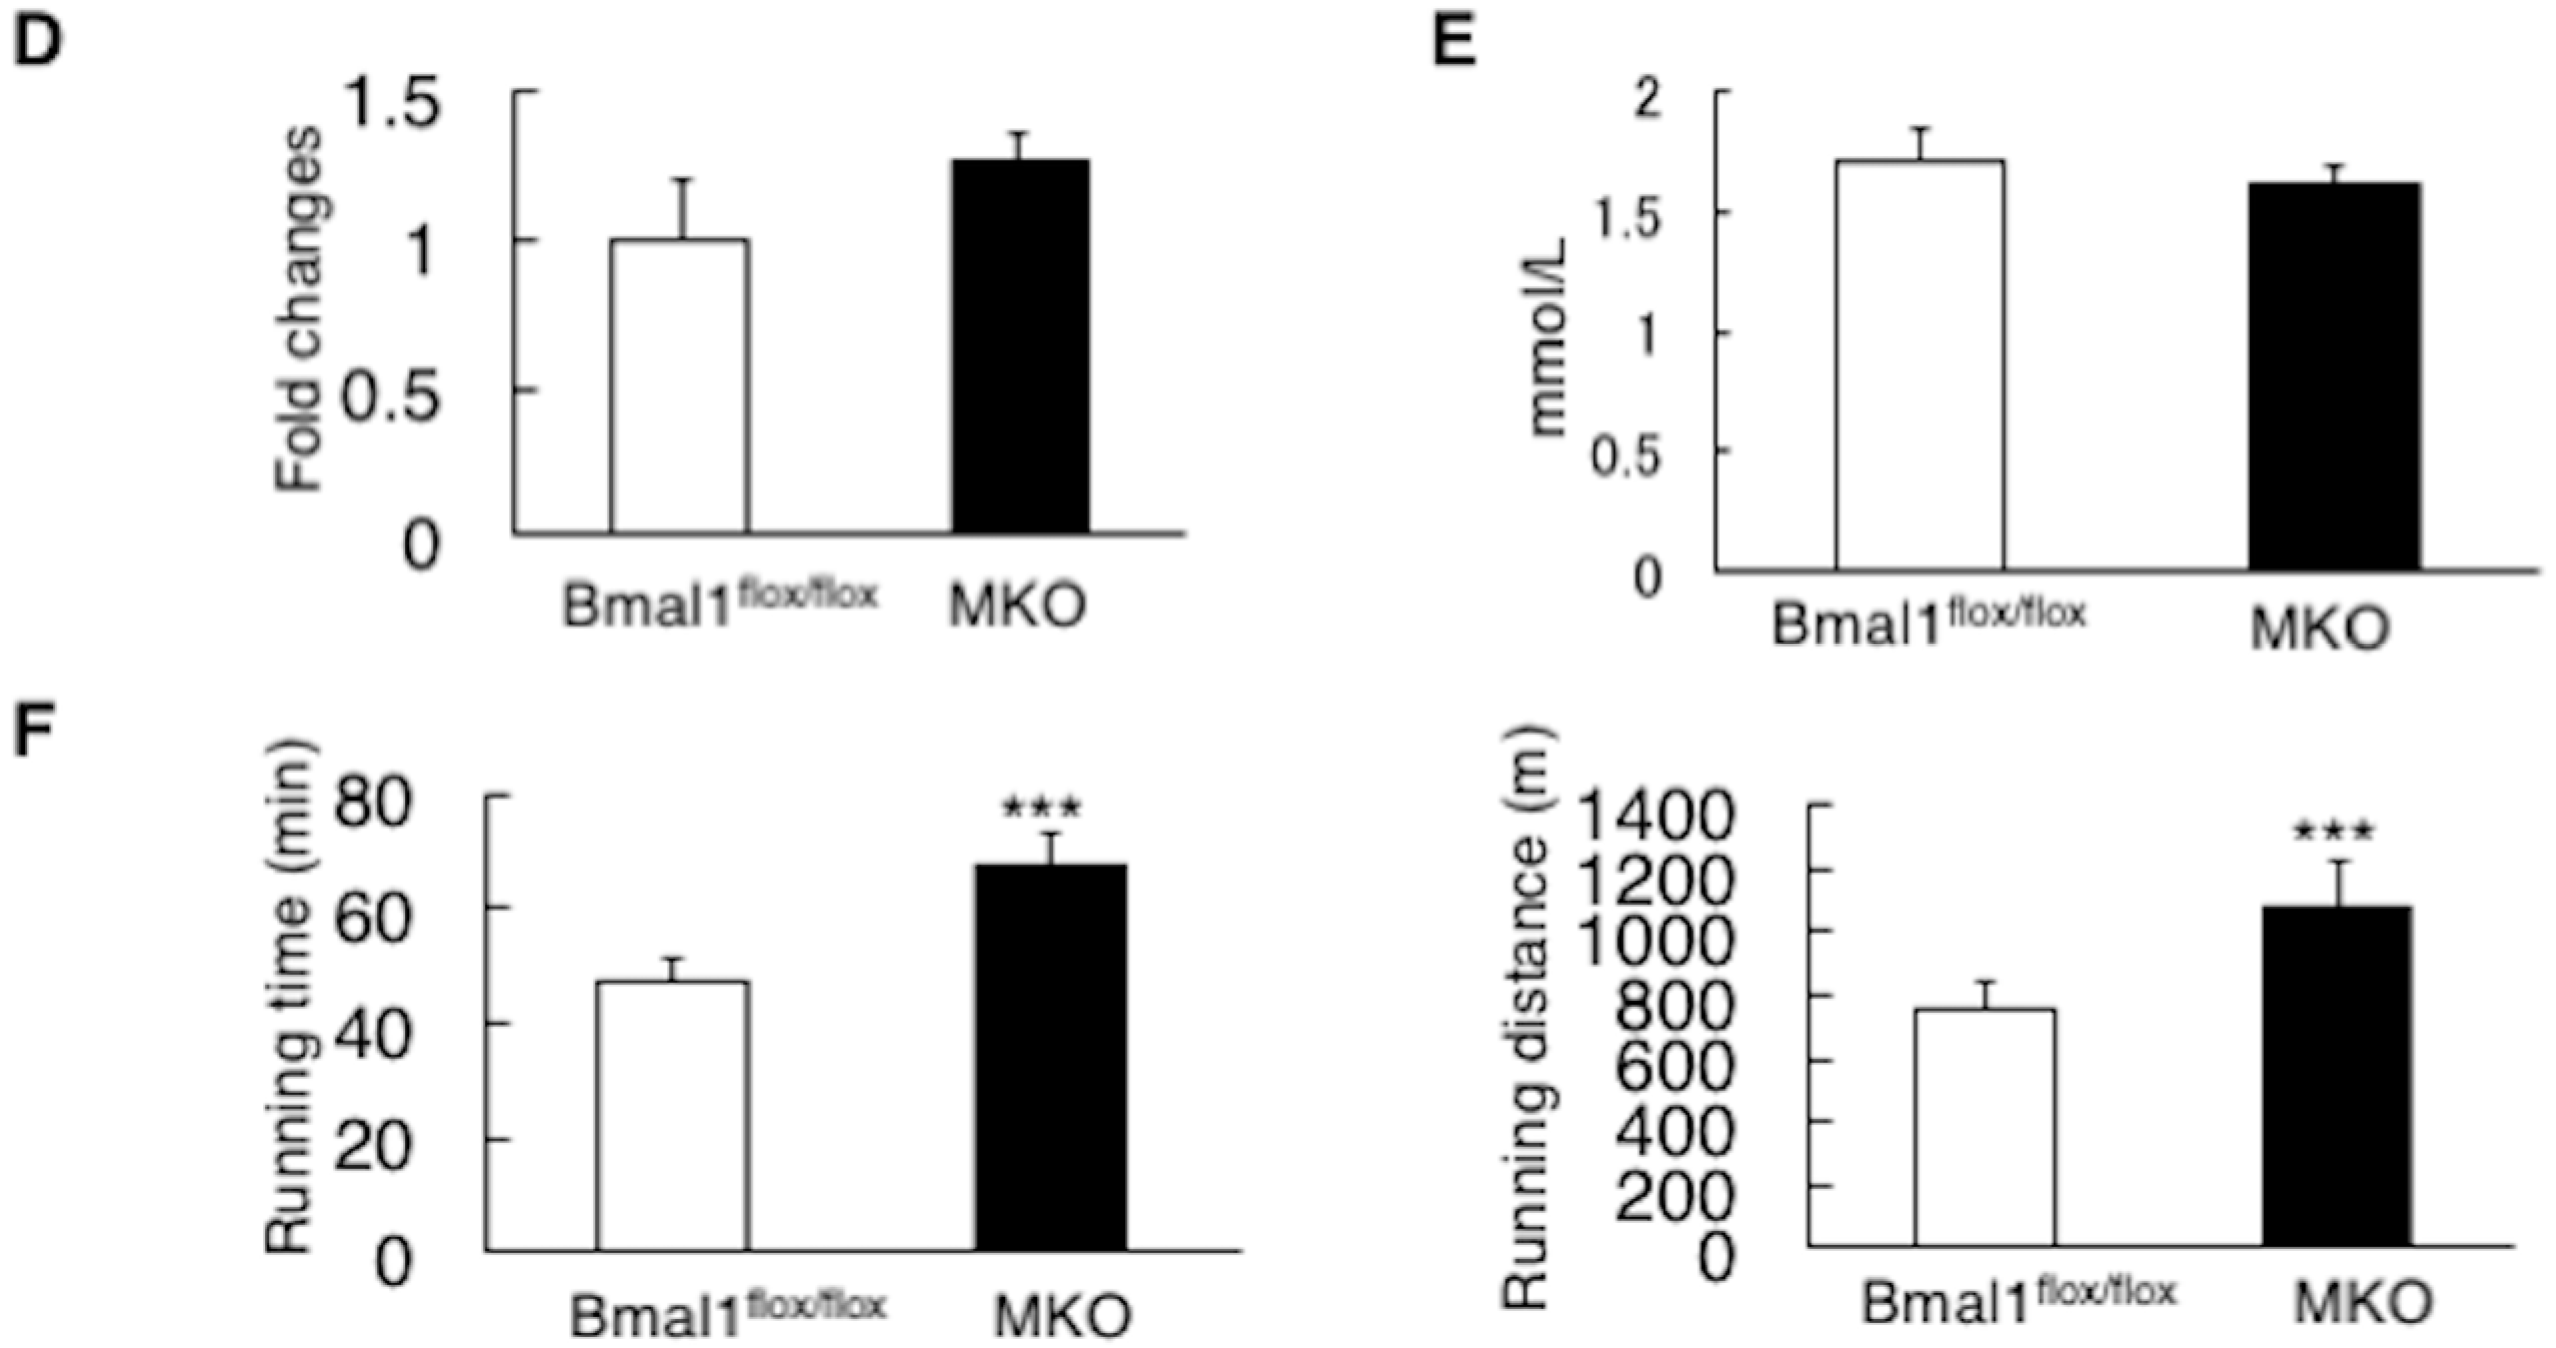
2.2. Deletion of Bmal1 Gene in the Muscle Increases Muscular Oxidative Capacity

To characterize the changes in energy metabolism resulting from the deficiency of Bmal1 in the skeletal muscle, the factors associated with respiration were analyzed. As shown in Figure 2A,B, the value of O2 consumption and CO2 production in the MKO mice was higher than that in Bmal1flox/flox mice during dark phase (Figure 2A,B). Also, during dark phase, the MKO mice displayed the higher energy expenditure and the lowered RQ value compared to the Bmal1flox/flox mice (Figure 2C,D). The result in Figure 3A showed that the activities of 3-hydroxyacyl CoA dehydrogenase, an enzyme responsible for β-oxidation, in the MKO mice was higher than those in the Bmal1flox/flox mice (Figure 3A). Histology with the staining of ATPase (pH 4.3) and cytochrome c oxidase confirmed the substantial activation of oxidative fibers in the MKO mice (Figure 3B). In the regulation of fatty acid oxidation, the activation of AMP-activated protein kinase (AMPK) is a key event. A western blot analysis revealed that the phosphorylation status of AMPK and its downstream signaling substrate acetyl-CoA carboxylase (ACC) in the MKO mice were substantially higher than those in the Bmal1flox/flox mice (Figure 3C). With regards to the mitochondrial DNA copy number in the skeletal muscle, there was no significant difference between the Bmal1flox/flox mice and MKO mice (Figure 3D). Also, the level of 3-hydroxybutyric acid in blood in MKO mice was almost equal to that in Bmal1flox/flox mice (Figure 3E). In a last set of experiment, mice were run on treadmills until exhaustion. Strikingly, the running time and the distance of the MKO mice were able to sustain were significantly increased by 42% (Figure 3F).

2.3. Deletion of the Bmal1 Gene in the Muscle Improves the State of Diet-Induced Obesity

The high oxidative capacity may play a role in obesity resistance. Therefore, the obesity-related features of the MKO mice fed a high fat diet (HFD) were characterized. As shown in Figure 4A, the HFD feeding induced body weight gain in both the Bmal1flox/flox mice and the MKO mice but the degree of weight gain in the MKO mice was smaller than that in the Bmal1flox/flox mice (Figure 4A). The tissue weight of the white adipose tissue (WAT) in the MKO mice fed the HFD was less than that in the Bmal1flox/flox mice (Figure 4B). Obesity induces inflammation in the adipose tissue [22]. The gene expression levels of inflammatory factors (interleukins and Tnfa) in the adipose tissue of the MKO mice were significantly lower than those in the Bmal1flox/flox mice (Figure 4C). The HFD feeding increased the hepatic TG level in both the Bmal1flox/flox mice and the MKO mice and the levels in the two mouse genotypes were comparable (Figure 4D). Ectopic fat accumulation was also observed in the skeletal muscle in both the Bmal1flox/flox mice and MKO mice but the level in the MKO mice was far lesser than that in the Bmal1flox/flox mice (Figure 4D). The levels of serum TG and cholesterol were elevated in the Bmal1flox/flox mice and MKO mice by the HFD feeding and the levels showed no significant difference between the two genotypes (Figure 4E). The level of serum NEFA in the MKO mice was significantly lower than that in the Bmal1flox/flox mice under the HFD feeding condition (Figure 4E). Obesity decreases the circulating adiponectin level, resulting in an increased risk of cardiovascular diseases [23,24]. The serum adiponectin level in the Bmal1flox/flox mice was decreased by HFD feeding but the MKO mice showed steady adiponectin levels (Figure 4E).

2.4. Deletion of the Bmal1 Gene in the Muscle Improves the State of Insulin Sensitivity in Obesity

We next compared the whole-body glucose disposal rate between the two mouse genotypes. Under the condition of chow diet feeding, the score in the glucose tolerance test and insulin tolerance test in the MKO mice was comparable to that in the Bmal1flox/flox mice (Figure 5A,B). The HFD feeding resulted in worse scores on these two parameters in both the Bmal1flox/flox mice and MKO mice but the scores in the MKO mice were significantly better than those in the Bmal1flox/flox mice (Figure 5A,B), while the insulin level during the glucose tolerance test in the MKO mice was almost equal to that in the Bmal1flox/flox mice (Figure 5C). Previous studies reported the decrease of glucose transporter 4 (Glut4) expression by the deletion of Bmal1 in the skeletal muscle of mouse [19,20]. We also observed this reduction of Glut4 expressions in the MKO mice fed the chow diet (Figure 5D). This study also observed the increase of insulin receptor substrate 1 (Irs1) expression level in the MKO mice fed the chow diet (Figure 5D). Therefore, the effects of reduced expression of Glut4 on insulin-dependent glucose uptake may be offset by increased expression of Irs1. Under the HFD condition, the change in the expression level of Glut4 and Irs1 was diminished (Figure 5D). The expression level of insulin receptor in the MKO mice was comparable to that in the Bmal1flox/flox mice under chow diet condition. HFD feeding decreased the expression of insulin receptor in the Bmal1flox/flox mice but not in the MKO mice (Figure 5D). To compare the intracellular insulin signal transduction activity between the Bmal1flox/flox mice and MKO mice, the level of the insulin-induced phosphorylation status of protein kinase B (AKT) in the skeletal muscle was determined (Figure 5E). Similar to the results of the insulin tolerance tests (Figure 5B), the level of phosphorylated AKT in the MKO mice fed the chow diet was comparable to that in the Bmal1flox/flox mice fed the chow diet (Figure 5E). In contrast, under the HFD feeding condition, the phosphorylated AKT level in the MKO mice was significantly higher than that in the Bmal1flox/flox mice (Figure 5E).

2.5. Deletion of the Bmal1 Gene in the Muscle Induces Gene Expression Related to Lipid Metabolism

To understand the mechanism by which the deficiency of Bmal1 improves the level of ectopic fat accumulation in the skeletal muscle (Figure 4D), we determined expression level of genes related to lipid metabolism by performing a qRT-PCR analysis (Figure 6). Under the HFD condition, the MKO mice showed an increased expression of β-oxidation-related genes, fatty acid uptake and vascularization. The genes include peroxisome proliferator-activated receptor alpha (Ppara), very long-chain acyl-CoA dehydrogenase (Vlcad), short-chain acyl-CoAdehydrogenase (Scad), 3-hydroxyacyl CoA dehydrogenase alpha and beta (Hadha and Hadhb), carnitine palmitoyltransferase 1 and 2 (Cpt1 and 2), fatty acid transport protein 1 and 4 (Fatp1 and 4), vascular endothelial growth factor receptor (Flk) and tyrosine kinase with Ig-like loops and Epidermal growth factor homology domains-2 (Tie2) (Figure 6A–C). The HFD feeding also increased the expression level of myoglobin (Mb) and troponin I slow (Tnni1) in the MKO mice (Figure 6D). In contrast, the gene expression of stearoyl coenzyme decarboxylase1 (Scd1), a factor related to fatty acid synthesis, in the MKO mice was significantly lower than that in the Bmal1flox/flox mice (Figure 6E). No significant difference was seen between the Bmal1flox/flox mice and MKO mice in the expression level of genes responsible for mitochondria biosynthesis (Figure 6F).

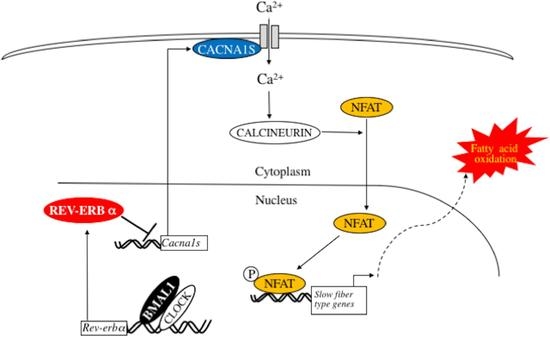
2.6. Deletion of Bmal1 Gene Activates Calcium Signaling in the Skeletal Muscle

The results described above indicate that deletion of Bmal1 in the skeletal muscle increases oxidative capacity, resulting in suppression of diet-induced ectopic fat accumulation (Figure 3, Figure 4, Figure 5 and Figure 6). As shown in Figure 6D, gene expression level of slow fiber genes, such as myoglobin and troponin I slow, is elevated in MKO mice. Thus, to gain the insight by which deletion of Bmal1 increases oxidative capacity in the skeletal muscle, regulatory pathway involved in slow fiber gene expression was determined. Gene expression of slow fiber genes, such as myoglobin and troponin I slow, is regulated by calcium-nuclear factor of activated T cells (NFAT) axis [25,26]. In the MKO mice, the intra-muscular level of Ca2+ was greater than that in the Bmal1flox/flox mice at ZT10, while no significant differences were observed in the serum Ca2+ level (Figure 7A). In response to the elevation of Ca2+ level, NFAT is translocated in the nucleus and phosphorylated at Ser 54 in the activation domain. This phosphorylation at Ser 54 increases the transcriptional activity of NFAT and thus the expression of the target genes such as myoglobin is induced [27]. Western blot analysis of the skeletal muscular proteins revealed accumulation of the phosphorylated-Ser54 form of NFAT1 in the nucleus in the MKO mice (Figure 7B). To increase slow fiber gene expression, phosphorylation of p38 mitogen-activated protein kinase (MAPK) via the activation of AMPK is also required [28,29]. The results in Figure 7C showed the increase in the phosphorylation status of AMPK and p38 MAPK.
In the MKO mice, the expression level of Cacna1s, a major calcium channel in the skeletal muscle, was significantly higher than that in the Bmal1flox/flox mice (Figure 8A). The up-regulation of Cacna1s expression in the absence of Bmal1 suggested that this gene expression might be under negative control of BMAL1, presumably via reverse orientation the c-erbA-1 gene (REV-ERB), a transcriptional suppressor. Reporter gene assay showed Cacna1s promoter activity is inhibited in the presence of REV-ERB α (Figure 8B). Inspection of this region identified two putative retinoic acid receptor-related orphan receptor-responsive element (RORE) at −1474/−1469 and −363/−358 upstream of the transcription start site. Introduction of a mutation in proximal RORE resulted in loss of responsiveness to the REV-ERB α (Figure 8B). The recruitment of the REV-ERB α to Cacna1s/RORE on the genome was confirmed by ChIP assay. In this ChIP assay, mouse Bmal1 promoter region containing RORE (−51 to −5) and a part of mouse Cacna1s gene (−2924 to −2774), which lacks RORE, were used as positive and negative controls, respectively. As shown in Figure 8C, the time-dependent recruitment of the REV-ERB α to the promoter region encompassing Cacna1s/RORE was observed in the skeletal muscle.

3. Discussion

BMAL1 was originally identified as a factor enriched in the skeletal muscle [1]. Rescue of Bmal1 gene in the skeletal muscle of the global Bmal1 KO mice improved the activity level [15], suggesting that BMAL1 plays the functional roles in the skeletal muscle. Since the skeletal muscle is the dominant organ system in energy metabolism, the possible functions of BMAL1 in the skeletal muscle include the control of metabolism. Moorsel et al. recently showed that fat oxidation in human skeletal muscle displays diurnal variation, with the highest activity at 8:00 a.m. and lowest activity at 11:00 p.m. [30]. This day-night shift of fat oxidation activity is inversely related to the level of Bmal1 expression in human skeletal muscle [30]. The results in this study showed that mice lack Bmal1 in the skeletal muscle display physiological hallmarks for the increase of oxidative capacity and fat oxidation activity. This included increased energy expenditure and oxygen consumption, high running endurance and resistance to obesity with improved metabolic profiles (Figure 2, Figure 3, Figure 4, Figure 5 and Figure 6). Also, biochemical and histological studies confirmed the substantial increase of oxidative activity in the skeletal muscle of the MKO mice (Figure 3A–C). Since no significant differences in daily free moving activity, the skeletal structure analyzed by electron microscopy and gene expression of myosin heavy chain isoforms were seen between the Bmal1flox/flox and MKO mice (Figure 1), the marked increase in oxidative capacity represents the changes in metabolic activity in the skeletal muscle of the MKO mice. We were thus led to conclude that BMAL1 is a critical regulator of the muscular fatty acid level under nutrition overloading and that the mechanism involves the control of fatty acid oxidation.
Increase of oxidative capacity is at least partly accounted for by the elevated expression level of slow fiber genes, such as myoglobin and troponin I slow, in the MKO mice (Figure 6D). Expression of slow fiber genes is regulated by calcium-NFAT axis [26]. The results in Figure 7A showed the higher intra-muscular calcium level in MKO mice compared with Bmal1flox/flox mice (Figure 7A). Also, activation of calcium-dependent signaling pathway was observed, as judged by phosphorylation status of NFAT1 (Ser54), AMPK and p38 MAPK, in the skeletal muscle of MKO mice (Figure 7B,C). Furthermore, these phenotypes of MKO mice are similar to those of transgenic mice overexpressing calcineurin, or calmodulin-dependent kinase [31,32]. Therefore, these results indicate that BMAL1 regulates calcium-NFAT axis in the skeletal muscle. Then we further analyzed the factors involved in calcium uptake in the skeletal muscle and found the increased expression of Cacna1s in MKO mice (Figure 8A). CACNA1S, a part of calcium channel, plays role in a signaling pathway determining muscle anabolic or catabolic state and might act as a molecular sensor of muscle activity [33]. Analysis of promoter region of Cacna1s revealed that REV-ERB α—a transcriptional suppressor—regulated by BMAL1, negatively regulates the expression of this gene (Figure 5B–D). Rev-erb α KO mice exhibit the increase of type I fiber in the skeletal muscle [34]. Consequently, we are led to conclude that BMAL1 regulates calcium signaling via the control of gene expression of Cacna1S by REV-ERB α and this activation of calcium-NFAT axis may be responsible for increase of the slow fiber genes expression and oxidative capacity in the MKO mice.
The regulation of metabolism by BMAL1 in peripheral tissues has been demonstrated by studies using a tissue-specific deletion of the Bmal1 gene in mice. Hepatic BMAL1 drives a daily rhythm of hepatic glucose export timed so as to buffer the circulating glucose level [35]. The pancreatic clock regulates β-cell functions, including cell proliferation and insulin secretion [36]. In adipose tissue, deletion of the Bmal1 gene results in obesity with a shift in the diurnal rhythm of food intake [37]. With regard to the skeletal muscle, metabolomics analysis revealed that deletion of the Bmal1 gene leads to reduced glucose oxidation and a diversion of glycolytic intermediates to alternative metabolic pathway [19,20]. This could be partly responsible for the reduced ectopic fat accumulation in the skeletal muscle of MKO mice (Figure 2C). In addition, Schroder et al. showed that loss of Bmal1 in the skeletal muscle increases oxidative fiber type [21]. In the present study, although no substantial increase in the oxidative fiber level was shown by the deletion of Bmal1 in the skeletal muscle as judged by mRNA expression (Figure 1D), the MKO mice exhibited increased aerobic capacity (Figure 4 and Figure 5). These results indicate the activation of oxidative fibers in the skeletal muscle of MKO mice. Thus, BMAL1 is, at least partly, responsible for the regulation of muscle fiber activity and its related metabolic features.
The impaired cell structure and function of the skeletal muscle in the global Bmal1 KO mice was demonstrated [9]. This includes disrupted myofilament and profound mitochondrial pathologies. We did not observe these abnormalities in the skeletal muscle of the MKO mice (Figure 1D). Muscular structure and functions depend not only on cellular status but also on neural innervations, motor neuron function and peripheral metabolic adaptation. As it has been reported, abnormal neuronal activities and immobilization are seen in the global Bmal1 KO mice [7,10]. These past and present results suggest that tissue structure is partly controlled by a central clock via innervation. Alternatively, global Bmal1 KO mice but not the MKO mice, exhibit the impaired insulin secretion [10,36]. The endocrinological differences might therefore generate the structural differences in the muscle between global Bmal1 KO mice and MKO mice.
In this study, we compared the Bmal1flox/flox mice and MKO mice at 16–18-week-old (Figure 1A). The results showed no substantial changes in body composition between genotypes under the chow diet condition. These results are also consistent with the reports by other groups. Dyer et al. also established the non-inducible and the inducible MKO mice [19]. In both lines of mice, no significant difference in body weight was observed by the deletion of Bmal1. The report by Esser’s group showed that the deletion of Bmal1 had no effects on the body composition in 15–17 week-old mice, while the differences in body composition were observed in mice aged at 27 weeks or later [20]. Therefore, the effects of Bmal1 deletion in the skeletal muscle varies with age. Further study is required to elucidate the age-dependent role of BMAL1 in the skeletal muscle.
An association between the molecular circadian clock system and muscular functions has long been suggested [16,17,18]. In the present study, we showed that BMAL1 regulates oxidative capacity, resulting in the control of the ectopic fat level and of insulin sensitivity in the skeletal muscle under over-nutrition conditions. Circadian misalignment in human such as shiftwork increases the risk of obesity and type 2 diabetes [38,39,40,41]. Our present findings showing the regulation of metabolic capacity by BMAL1 in the skeletal muscle provide additional insight into the link between obesity/diabetes and the role of the molecular circadian clock systems in energy metabolism.

4. Materials and Methods

4.1. Animals

All mice used in the experiments were male and 16–18 weeks old. Conditional Bmal1flox/flox mice, which were generated using ES cells derived from C57BL/6J mice and MKO mice were generated as described [10]. In all experiments, littermate Bmal1flox/flox mice were used as control mice. All mice were maintained at 23 ± 1 °C with 50 ± 10% relative humidity under a 12 h light/12 h dark cycle. Food and water were available ad libitum. The experimental protocol was approved by the Ethics Review Committee for Animal Experimentation of Nihon University (approval nos. AP11P009 (15/3/2011), AP12P018 (14/3/2012), AP13P032 (10/3/2013)). Animals were sacrificed and tissues were immediately excised to measure the tissue weight.

4.2. Locomotor Activity Rhythm Analysis

Wheel-running activity was continuously recorded using a Chronobiology Kit (Stanford Software Systems, Stanford, CA, USA). The free moving activity of the mice was recorded with the use of infrared motion sensors positioned directly above each cage and data were continuously recorded using an online system (Melquest, Ltd., Toyama, Japan).

4.3. Metabolic Studies

Energy expenditure was measured by using Oxyletpro system (PANLAB, S.L.U. Barcelona, Spain). The mice were subjected to glucose tolerance testing (GTT) and insulin tolerance tests (ITT) performed by administrating an intraperitoneal injection of dextrose solution (2 g/kg body weight for the mice fed the regular diet and 1 g/kg body weight for the mice fed the high fat diet) or insulin (0.5 U/kg body weight; Eli Lilly, Indianapolis, IN, USA), respectively. Mice were fasted 16 h in GTT and 6 h in ITT, respectively. Glucose levels were monitored before and after the injection with blood glucose strips (Arkray, Kyoto, Japan). Calcium were determined using a commercially available reagent.

4.4. Biochemical Analysis of Blood and Tissue

The blood levels of triglyceride, cholesterol, non-esterified fatty acid (Wako, Osaka, Japan), adiponectin (Otsuka Pharmaceutical Co., Ltd., Tokyo, Japan), 3-hydroxybutyric acid (Abbott Laboratories, IL, USA) and insulin, (Morinaga Institute of Biological Science, Inc., Kanagawa, Japan) were determined with commercial assay kit according to the manufacturer’s instructions.

4.5. Gene Expression (Quantitative Reverse Transcription Polymerase Chain Reaction [qRT-PCR])

Total RNA was extracted with RNAiso Plus (Takara Co., Ltd., Otsu, Japan) according to the manufacturer’s instructions. The cDNA was synthesized from 1.0 µg of total RNA by reverse transcriptase (Wako, Osaka, Japan). Aliquots of cDNA were amplified on a Stratagene MX3000 real-time PCR System using SYBR-Green PCR reagents (Promega, Madison, WI, USA). The mRNA expression levels were normalized against the 36B4 expression and are presented as relative expression levels. The primer sequences used are summarized in Table 1.

4.6. Exercise Performance Test

Prior to the exercise performance test, the mice were acclimated to the treadmill (Melquest, Ltd., Toyama, Japan) with a 5 min run at 7 m/min once per day for 2 days. The exercise test regimen was 10 m/min for the first 60 min, followed by incremental acceleration (1 m/min every 5 min) to a maximum speed of 20 m/min until exhaustion. Exhaustion was defined as failure to run for more than 20 s.

4.7. Histological Analyses

Skeletal muscle tissues were snap-frozen in a dry ice-acetone bath. Cryostat sections were stained with hematoxylin and eosin (H&E). Enzyme activity of myosin-ATPase and cytochrome c oxidase (COX) in frozen sections was evaluated as described [42,43].

4.8. Preparation of Tissue Extract

For the measurement of enzyme activity, the tissue was homogenized in the buffer (10 mM Hepes (pH 7.3), 11.5% sucrose, 0.1% TritonX-100 and 1 mM DTT) with a dounce grinder. After centrifugation for 10 min at 15,000× g, the resulting supernatant was subjected to an assay of the enzyme activity. For the whole tissue extract preparation, the tissue was homogenized in commercial lysis buffer (Cell Signaling Technology, Inc., Danvers, MA, USA) containing 1 mM DTT and phosphatase inhibitor (Roche Diagnostics K. K., Tokyo, Japan) with a dounce grinder. After centrifugation for 15 min at 15,000× g, the resulting supernatant was subjected to the experiments.

4.9. Measurement of 3-Hydroxyacyl CoA Dehydrogenase Activity

The maximal activity of 3-hydroxyacyl-CoA dehydrogenase in the muscle homogenate was assayed by monitoring the decrease in absorbance at 340 nm of NADH in the presence of acetoacetyl-CoA [44].

4.10. Electron Microscopy

The tissue samples were fixed with 2% paraformaldehyde and 2% glutaraldehyde in 0.1 M phosphate buffer (pH 7.4). The samples were then dehydrated, infiltrated and polymerized. Thin sections were cut and stained and images were obtained with a transmission electron microscope (JEM-1200EX; JEOL, Ltd., Tokyo, Japan) and a CCD camera (VELETA; Olympus Soft Imaging Solutions GmbH, Münster, Germany).

4.11. Western Blot Analysis

The proteins were resolved by sodium dodecyl sulfate-polyacrylamide gel electrophoresis (SDS-PAGE), transferred onto the membranes and probed with the antibodies. Immunoreactive proteins were visualized with ECL western blotting detection reagents (Thermo Fisher Scientific, Waltham, MA, USA). Antibodies against AKT and its phosphorylated form, AMPK and its phosphorylated form, Acetyl CoA carboxylase (ACC) and its phosphorylated form, CALCINURIN, NFAT and β-ACTIN were purchased from Cell Signaling Technology (Danvers, MA, USA). Antibodies against SP1 was purchased from Santa Cruz Biotechnology, Inc. (Dallas, TX, USA). Antibodies against phosphorylated (Ser54) NFAT were purchased from Sigma-Aldrich CO. (St. Louis, MO, USA).

4.12. Plasmid Construction, Cell Culture and Cell Transfection

HEK293 cells, obtained from Human Science Research Resources Bank (Osaka, Japan), were maintained in Dulbecco’s modified Eagle medium (DMEM) supplemented with 10% fetal bovine serum. The 5′ regulatory region (−1536 bp to +3 bp) of the mouse Cacna1s gene was amplified by PCR using mouse genomic DNA as the PCR template. The PCR-amplified fragment was cloned into the pGL3-basic vector (Promega). Site-directed mutagenesis was performed by the PCR overextension method and confirmed by DNA sequencing. HEK293 cells were transfected into 48-well plates with FuGene HD (Promega). After 16 h of incubation, the cells lysates were extracted and assayed with a dual luciferase reporter assay system (Promega). The pRL-tk vector (Promega), was used as a normalization control to correct for variable transfection efficiencies.

4.13. Chromatin Immunoprecipitation (ChIP) Assays

The chromatin immunoprecipitation (ChIP) assay was performed essentially as described elsewhere [45] with the modification for the skeletal muscle. In brief, the gastrocnemius of twelve-week-old C57BL/6J male mice was harvested at ZT10 and ZT22, cross-linked in 1% formaldehyde and lysed. The obtained tissue extracts were subjected to immunoprecipitation with an anti-REV-ERB α antibody (PPMX, Tokyo, Japan). Parallel samples were incubated with non-immune IgG as a negative control. The DNA region was amplified and quantitated by qPCR. The following PCR primers were used:
  • Cacna1s −430; 5′-AGAAACTTAATCTCCATCTAAGG-3′,
  • Cacna1s −282; 5′-GTGACTTATTATATCCAGGCTTG-3′,
  • Cacna1s −2924; 5′-TCCTCTGTAAAAAGCAGTACCTGC-3′,
  • Cacna1s −2774; 5′-CAGCCATTAATATCATTTCCTCTG-3′,
  • Bmal1 −53; 5′-GGAAAGTAGGTTAGTGGTGCGAC-3′,
  • and Bmal1 +31; 5′-AAGTCCGGCGCGGGTAAACAGG-3′.

4.14. Statistical Analysis

When applicable, the results are represented as the means ± SD. Statistical analysis was performed with Student’s t-test or a one-way analysis of variance (ANOVA) with Tukey’s post hoc test. A p-value of p < 0.05 was accepted as statistically significant.

Author Contributions

Participated in research design, T.W., Y.I., T.U., M.M., R.N., K.O. and S.S.; Conducted experiments, T.W., Y.I., E.S., Y.K., K.I. and R.N.; Contributed new reagents or analytic tools, T.W., Y.K. and T.U.; Performed data analysis, T.W., Y.I., K.I., M.M., R.N., K.O. and S.S.; Wrote or contributed to the writing of the manuscript, T.W., R.N., K.O. and S.S.

Acknowledgments

This work is in part supported by MEXT/JSPS KAKENHI (Grant Number 23590091, 26670066, 23790158, 26860088, 25460138, 26460634: S.S., T.W., Y.K.), “Private University Research Branding Project” from MEXT (S.S.), A grant for cooperative research in the School of Pharmacy, Nihon University (S.S.), Multidisciplinary Research Grant from Nihon University (S.S.).

Conflicts of Interest

The authors declare no conflict of interest.

Abbreviations

ACCAcetyl-CoA carboxylase
AKTProtein kinase B
AMPKAMP-activated protein kinase.
BMALBrain and muscle arnt-like protein 1
CdCluster of differentiation
CptCarnitine palmitoyl transferase
Dgat1Diacylglycerol O-acyltransferase 1
EDLExtensor digitorum longus
ErraEstrogen-related receptor-α
FatpFatty acid transporter
FasnFatty acid synthase
FlkFetal liver kinase
Glut4Glucose transporter type 4
GNGastrocnemius
HadhHydroxyacyl CoA dehydrogenase
HFDHigh fat diet
IlInterleukin
IrsInsulin receptor substrate
LcadLong-chain acyl-CoA dehydrogenase
MbMyoglobin
McadMedium-chain acyl-CoA dehydrogenase
Mcp1Monocyte chemotactic protein-1
MyHCMyosin heavy chain isoform
NFATNuclear Factor of Activated T cells
Pgc-1Peroxisome proliferator-activated receptor gammer coactivator-1
PparPeroxisome proliferator-activated receptor
Rev-erbReverse orientation the c-erbA-1 gene
RORERetinoic acid receptor-related orphan receptor-responsive element
ScadShort-chain acyl-CoA dehydrogenase
Scd1Stearoyl-coA desaturase 1
SolSoleus
Tie2TEK receptor tyrosine kinase 2
TfamMitochondrial transcription factor A
TnfTumor necrosis factor
Tnni1Troponin I solow
Tnni2Troponin I fast
VlcadVery long-chain acyl-CoA dehydrogenase
WATWhite adipose tissue
ZTZeitgeber time

References

  1. Ikeda, M.; Nomura, M. cDNA cloning and tissue-specific expression of a novel basic helix-loop-helix/PAS protein (BMAL1) and identification of alternatively spliced variants with alternative translation initiation site usage. Biochem. Biophys. Res. Commun. 1997, 233, 258–264. [Google Scholar] [CrossRef] [PubMed]
  2. Hogenesch, J.B.; Gu, Y.Z.; Jain, S.; Bradfield, C.A. The basic-helix-loop-helix-PAS orphan MOP3 forms transcriptionally active complexes with circadian and hypoxia factors. Proc. Natl. Acad. Sci. USA 1988, 95, 5474–5479. [Google Scholar] [CrossRef]
  3. Takahata, S.; Sogawa, K.; Kobayashi, A.; Ema, M.; Mimura, J.; Ozaki, N.; Fujii-Kuriyama, Y. Transcriptionally active heterodimer formation of an Arnt-like PAS protein, Arnt3, with HIF-1a, HLF and clock. Biochem. Biophys. Res. Commun. 1998, 248, 789–794. [Google Scholar] [CrossRef] [PubMed]
  4. Gekakis, N.; Staknis, D.; Nguyen, H.B.; Davis, F.C.; Wilsbacher, L.D.; King, D.P.; Takahashi, J.S.; Weitz, C.J. Role of the clock protein in the mammalian circadian mechanism. Science 1988, 280, 1564–1569. [Google Scholar] [CrossRef]
  5. Yoo, S.H.; Ko, C.H.; Lowrey, P.L.; Buhr, E.D.; Song, E.J.; Chang, S.; Yoo, O.J.; Yamazaki, S.; Lee, C.; Takahashi, J.S. A noncanonical E-box enhancer drives mouse period2 circadian oscillations in vivo. Proc. Natl. Acad. Sci. USA 2005, 102, 2608–2613. [Google Scholar] [CrossRef] [PubMed]
  6. Kumaki, Y.; Ukai-Tadenuma, M.; Uno, K.D.; Nishio, J.; Masumoto, K.H.; Nagano, M.; Komori, T.; Shigeyoshi, Y.; Hogenesch, J.B.; Ueda, H.R. Analysis and synthesis of high-amplitude cis-elements in the mammalian circadian clock. Proc. Natl. Acad. Sci. USA 2008, 105, 14946–14951. [Google Scholar] [CrossRef] [PubMed]
  7. Bunger, M.K.; Walisser, J.A.; Sullivan, R.; Manley, P.A.; Moran, S.M.; Kalscheur, V.L.; Colman, R.J.; Bradfield, C.A. Progressive arthropathy in mice with a targeted disruption of the Mop3/Bmal-1 locus. Genesis 2005, 41, 122–132. [Google Scholar] [CrossRef] [PubMed]
  8. Kondratov, R.V.; Kondratova, A.A.; Gorbacheva, V.Y.; Vykhovanets, O.V.; Antoch, M.P. Early aging and age-related pathologies in mice deficient in BMAL1, the core componentof the circadian clock. Genes Dev. 2006, 20, 1868–1873. [Google Scholar] [CrossRef] [PubMed] [Green Version]
  9. Andrews, J.L.; Zhang, X.; McCarthy, J.J.; McDearmon, E.L.; Hornberger, T.A.; Russell, B.; Campbell, K.S.; Arbogast, S.; Reid, M.B.; Walker, J.R.; et al. CLOCK and BMAL1 regulate MyoD and are necessary for maintenance of skeletal muscle phenotype and function. Proc. Nat. Acad. Sci. USA 2010, 107, 19090–19095. [Google Scholar] [CrossRef] [PubMed] [Green Version]
  10. Shimba, S.; Ogawa, T.; Hitosugi, S.; Ichihashi, Y.; Nakadaira, Y.; Kobayashi, M.; Tezuka, M.; Kosuge, Y.; Ishige, K.; Ito, Y.; et al. Deficient of a clock gene, brain and muscle Arnt-like protein-1 (BMAL1), induces dyslipidemia and ectopic fat formation. PLoS ONE 2011, 6, e25231. [Google Scholar] [CrossRef] [PubMed]
  11. Hatanaka, F.; Matsubara, C.; Myung, J.; Yoritaka, T.; Kamimura, N.; Tsutsumi, S.; Kanai, A.; Suzuki, Y.; Sassone-Corsi, P.; Aburatani, H.; et al. Genome-wide profiling of the core clock protein BMAL1 targets reveals a strict relationship with metabolism. Mol. Cell. Biol. 2010, 30, 5636–5648. [Google Scholar] [CrossRef] [PubMed]
  12. Rey, G.; Cesbron, F.; Rougemont, J.; Reinke, H.; Brunner, M.; Naef, F. Genome-wide and phase-specific DNA-binding rhythms of BMAL1 control circadian output functions in mouse liver. PLoS Biol. 2011, 9, e1000595. [Google Scholar] [CrossRef] [PubMed]
  13. Koike, N.; Yoo, S.H.; Huang, H.C.; Kumar, V.; Lee, C.; Kim, T.K.; Takahashi, J.S. Transcriptional architecture and chromatin landscape of the core circadian clock in mammals. Science 2012, 338, 349–354. [Google Scholar] [CrossRef] [PubMed]
  14. Yoshitane, H.; Ozaki, H.; Terajima, H.; Du, N.H.; Suzuki, Y.; Fujimori, T.; Kosaka, N.; Shimba, S.; Sugano, S.; Takagi, T.; et al. CLOCK-controlled polyphonic regulation of circadian rhythms through canonical and noncanonical E-boxes. Mol. Cell. Biol. 2014, 34, 1776–1787. [Google Scholar] [CrossRef] [PubMed]
  15. McDearmon, E.L.; Patel, K.N.; Ko, C.H.; Walisser, J.A.; Schook, A.C.; Chong, J.L.; Wilsbacher, L.D.; Song, E.J.; Hong, H.K.; Bradfield, C.A.; et al. Dissecting the functions of the mammalian clock protein BMAL1 by tissue-specific rescue in mice. Science 2006, 314, 1304–1308. [Google Scholar] [CrossRef] [PubMed]
  16. Zambon, A.C.; McDearmon, E.L.; Salomonis, N.; Vranizan, K.M.; Johansen, K.L.; Adey, D.; Takahashi, J.S.; Schambelan, M.; Conklin, B.R. Time- and exercise-dependent gene regulation in human skeletal muscle. Genome Biol. 2003, 4, R61. [Google Scholar] [CrossRef] [PubMed]
  17. McCarthy, J.J.; Andrews, J.L.; McDearmon, E.L.; Campbell, K.S.; Barber, B.K.; Miller, B.H.; Walker, J.R.; Hogenesch, J.B.; Takahashi, J.S.; Esser, K.A. Identification of the circadian transcriptome in adult mouse skeletal muscle. Physiol. Genom. 2007, 31, 86–95. [Google Scholar] [CrossRef] [PubMed] [Green Version]
  18. Martin, A.M.; Elliott, J.A.; Duffy, P.; Blake, C.M.; Ben Attia, S.; Katz, L.M.; Browne, J.A.; Gath, V.; McGivney, B.A.; Hill, E.W.; et al. Circadian regulation of locomotor activity and skeletal muscle gene expression in the horse. J. Appl. Physiol. 2010, 109, 1328–1336. [Google Scholar] [CrossRef] [PubMed] [Green Version]
  19. Dyar, K.A.; Ciciliot, S.; Wright, L.E.; Biensø, R.S.; Tagliazucchi, G.M.; Patel, V.R.; Forcato, M.; Paz, M.I.; Gudiksen, A.; Solagna, F.; et al. Muscle insulin sensitivity and glucose metabolism are controlled by the intrinsic muscle clock. Mol. Metab. 2014, 3, 29–41. [Google Scholar] [CrossRef] [PubMed]
  20. Harfmann, B.D.; Schroder, E.A.; Kachman, M.T.; Hodge, B.A.; Zhang, X.; Esser, K.A. Muscle-specific loss of Bmal1 leads to disrupted tissue glucose metabolism and systemic glucose homeostasis. Skelet. Muscle 2016, 6, 12. [Google Scholar] [CrossRef] [PubMed]
  21. Schroder, E.A.; Harfmann, B.D.; Zhang, X.; Srikuea, R.; England, J.H.; Hodge, B.A.; Wen, Y.; Riley, L.A.; Yu, Q.; Christie, A.; et al. Intrinsic muscle clock is necessary for musculoskeletal health. J. Physiol. 2015, 593, 5387–5404. [Google Scholar] [CrossRef] [PubMed] [Green Version]
  22. Olefsky, J.M.; Glass, C.K. Macrophages, inflammation and insulin resistance. Annu. Rev. Physiol. 2010, 72, 219–246. [Google Scholar] [CrossRef] [PubMed]
  23. Arita, Y.; Kihara, S.; Ouchi, N.; Takahashi, M.; Maeda, K.; Miyagawa, J.; Hotta, K.; Shimomura, I.; Nakamura, T.; Miyaoka, K.; et al. Paradoxical decrease of an adipose-specific protein, adiponectin, in obesity. Biochem. Biophys. Res. Commun. 1999, 257, 79–83. [Google Scholar] [CrossRef] [PubMed]
  24. Hotta, K.; Funahashi, T.; Arita, Y.; Takahashi, M.; Matsuda, M.; Okamoto, Y.; Iwahashi, H.; Kuriyama, H.; Ouchi, N.; Maeda, K.; et al. Plasma concentrations of a novel, adipose-specific protein, adiponectin, in type 2 diabetic patients. Arterioscler. Thromb. Vasc. Biol. 2000, 20, 1595–1599. [Google Scholar] [CrossRef] [PubMed]
  25. Schulz, R.A.; Yutzey, K.E. Calcineurin signaling and NFAT activation in cardiovascular and skeletal muscle development. Dev. Biol. 2004, 266, 1–16. [Google Scholar] [CrossRef] [PubMed]
  26. Bassel-Duby, R.; Olson, E.N. Signaling pathways in skeletal muscle remodeling. Annu. Rev. Biochem. 2006, 75, 19–37. [Google Scholar] [CrossRef] [PubMed]
  27. Okamura, H.; Aramburu, J.; García-Rodríguez, C.; Viola, J.P.; Raghavan, A.; Tahiliani, M.; Zhang, X.; Qin, J.; Hogan, P.G.; Rao, A. Concerted dephosphorylation of the transcription factor NFAT1 induces a conformational switch that regulates transcriptional activity. Mol. Cell 2000, 6, 539–550. [Google Scholar] [CrossRef]
  28. Zhao, M.; New, L.; Kravchenko, V.V.; Kato, Y.; Gram, H.; di Padova, F.; Olson, E.N.; Ulevitch, R.J.; Han, J. Regulation of the MEF2 family of transcription factors by p38. Mol. Cell. Biol. 1999, 19, 21–30. [Google Scholar] [CrossRef] [PubMed]
  29. Michael, L.F.; Wu, Z.; Cheatham, R.B.; Puigserver, P.; Adelmant, G.; Lehman, J.J.; Kelly, D.P.; Spiegelman, B.M. Restoration of insulin-sensitive glucose transporter (GLUT4) gene expression in muscle cells by the transcriptional coactivator PGC-1. Proc. Natl. Acad. Sci. USA 2001, 98, 3820–3825. [Google Scholar] [CrossRef] [PubMed] [Green Version]
  30. Van Moorsel, D.; Hansen, J.; Havekes, B.; Scheer, F.A.; Jörgensen, J.A.; Hoeks, J.; Schrauwen-Hinderling, V.B.; Duez, H.; Lefebvre, P.; Schaper, N.C.; et al. Demonstration of a day-night rhythm in human skeletal muscle oxidative capacity. Mol. Metab. 2016, 5, 635–645. [Google Scholar] [CrossRef] [PubMed]
  31. Naya, F.J.; Mercer, B.; Shelton, J.; Richardson, J.A.; Williams, R.S.; Olson, E.N. Stimulation of slow skeletal muscle fiber gene expression by calcineurin in vivo. J. Biol. Chem. 2000, 275, 4545–4548. [Google Scholar] [CrossRef] [PubMed]
  32. Wu, H.; Kanatous, S.B.; Thurmond, F.A.; Gallardo, T.; Isotani, E.; Bassel-Duby, R.; Williams, R.S. Regulation of mitochondrial biogenesis in skeletal muscle by CaMK. Science 2002, 296, 349–352. [Google Scholar] [CrossRef] [PubMed]
  33. Piétri-Rouxel, F.; Gentil, C.; Vassilopoulos, S.; Baas, D.; Mouisel, E.; Ferry, A.; Vignaud, A.; Hourdé, C.; Marty, I.; Schaeffer, L.; et al. DHPR alpha1S subunit controls skeletal muscle mass and morphogenesis. EMBO J. 2010, 29, 643–654. [Google Scholar] [CrossRef] [PubMed]
  34. Pircher, P.; Chomez, P.; Yu, F.; Vennstrom, B.; Larsson, L. Aberrant expression of myosin isoforms in skeletal muscles from mice lacking the rev-erbA α orphan receptor gene. Am. J. Physiol. Regul. Integr. Comp. Physiol. 2005, 288, R482–R490. [Google Scholar] [CrossRef] [PubMed]
  35. Lamia, K.A.; Storch, K.F.; Weitz, C.J. Physiological significance of a peripheral tissue circadian clock. Proc. Natl. Acad. Sci. USA 2008, 105, 15172–15177. [Google Scholar] [CrossRef] [PubMed] [Green Version]
  36. Marcheva, B.; Ramsey, K.M.; Buhr, E.D.; Kobayashi, Y.; Su, H.; Ko, C.H.; Ivanova, G.; Omura, C.; Mo, S.; Vitaterna, M.H.; et al. Disruption of the clock components CLOCK and BMAL1 leads to hypoinsulinaemia and diabetes. Nature 2010, 466, 627–631. [Google Scholar] [CrossRef] [PubMed] [Green Version]
  37. Paschos, G.K.; Ibrahim, S.; Song, W.L.; Kunieda, T.; Grant, G.; Reyes, T.M.; Bradfield, C.A.; Vaughan, C.H.; Eiden, M.; Masoodi, M.; et al. Obesity in mice with adipocyte-specific deletion of clock component Arntl. Nat. Med. 2012, 18, 1768–1777. [Google Scholar] [CrossRef] [PubMed] [Green Version]
  38. Karlsson, B.; Knutsson, A.; Lindahl, B. Is there an association between shift work and having a metabolic syndrome? Results from a population based study of 27,485 people. Occup. Environ. Med. 2001, 58, 747–752. [Google Scholar] [CrossRef] [PubMed]
  39. Ruger, M.; Scheer, F.A. Effects of circadian disruption on the cardiometabolic system. Rev. Endocr. Metab. Disord. 2009, 10, 245–260. [Google Scholar] [CrossRef] [PubMed] [Green Version]
  40. Gan, Y.; Yang, C.; Tong, X.; Sun, H.; Cong, Y.; Yin, X.; Li, L.; Cao, S.; Dong, X.; Gong, Y.; et al. Shift work and diabetes mellitus: A meta-analysis of observational studies. Occup. Environ. Med. 2015, 72, 72–78. [Google Scholar] [CrossRef] [PubMed]
  41. Buchvold, H.V.; Pallesen, S.; Oyane, N.M.; Bjorvatn, B. Associations between night work and BMI, alcohol, smoking, caffeine and exercise a cross-sectional study. BMC Pub. Health 2015, 15, 1112. [Google Scholar] [CrossRef] [PubMed]
  42. Ogilvie, R.W.; Feeback, D.L. A metachromatic dye-ATPase method for the simultaneous identification of skeletal muscle fibre types I, IIA, IIB and IIC. Stain Technol. 1990, 65, 231–241. [Google Scholar] [CrossRef] [PubMed]
  43. Seligman, A.M.; Karnovsky, M.J.; Wasserkrug, H.L.; Hanker, J.S. Nondroplet ultrastructural demonstration of cytochrome oxidase activity with a polymerizing osmiophilic reagent, diaminobenzidine (DAB). J. Cell Biol. 1968, 38, 1–14. [Google Scholar] [CrossRef] [PubMed]
  44. Bass, A.; Brdiczca, D.; Eyer, P.; Hofer, S.; Pette, D. Metabolic differentiation of distinct muscle types at the level of enzymatic organization. Eur. J. Biochem. 1969, 10, 198–206. [Google Scholar] [CrossRef] [PubMed]
  45. Wada, T.; Sunaga, H.; Ohkawara, R.; Shimba, S. Aryl hydrocarbon receptor modulates NADPH oxidase activity via direct transcriptional regulation of p40phox expression. Mol. Pharmacol. 2013, 83, 1133–1140. [Google Scholar] [CrossRef] [PubMed]
Figure 1. Deletion of Bmal1 gene in the muscle has no effects on the body weight, behavior and muscular structure of the mice. (A) The body weights (left) and the daily calorie intake (right) of the Bmal1flox/flox mice and muscle-specific Bmal1 knockout (MKO) mice (n = 5). (B) The relative tissue weight to the body weight (n = 5). EDL, extensor digitorum longus. GN, gastrocnemius; Sol, soleus; WAT, white adipose tissue. (C) The free moving activity of male Bmal1flox/flox mice and MKO mice measured with the infrared motion sensors (n = 11) (left). The period length of the Bmal1flox/flox mice and MKO mice (n = 11) (right). (D) Electron micrographs of muscle cross-sections (× 4860). (E) Gene expressions level of myosin heavy chain isoforms in the Bmal1flox/flox mice and MKO mice (n = 5). * p < 0.05 relative to Bmal1flox/flox mice.
Ijms 19 02813 g001
Figure 2. Deletion of the Bmal1 gene in the muscle increased energy expenditure. (A) Oxygen consumption (VO2) (n = 5). (B) Carbon dioxide production (VCO2) (n = 5). (C) Energy expenditure. (D) Respiratory quotient (RQ). *** p < 0.001 relative to Bmal1flox/flox mice.
Ijms 19 02813 g002
Figure 3. Deletion of Bmal1 gene in the muscle increases muscular oxidative capacity. (A) Activity of 3-hydroxyacyl CoA dehydrogenase in the skeletal muscle at ZT10 (n = 6). (B) A representative image of the myosin-ATPase staining, the cytochrome c oxidase (COX) staining and hematoxylin & eosin (H&E) staining. Scale bar is 100 µm. (C) A representative Western blot of tissue extracts of the skeletal muscle at ZT10. Lanes 1 and 2 were run using samples from two different male mice (Left). Band intensity was analyzed with ImageJ (n = 4) (Right). (D) The mitochondrial DNA copy number in the skeletal muscle (n = 6). (E) Blood 3-hydroxybutyric acid level (n = 6). (F) Exercise training in the forced treadmill exercise test (n = 6). * p < 0.05, *** p < 0.001 relative to Bmal1flox/flox mice.
Ijms 19 02813 g003aIjms 19 02813 g003b
Figure 4. Deletion of the Bmal1 gene in the muscle improves the state of obesity induced by high fat diet (HFD) feeding. (A) The body weight of male Bmal1flox/flox mice and MKO mice under high fat diet (HFD) feeding condition (n = 6) (Left). A representative image of mice fed the HFD for 4 weeks (Right). (B) The relative tissue weight to body weight of the mice fed the HFD for 4 weeks (Left). A representative image of epididymal white adipose tissue of mice fed the HFD for 4 weeks (Right). (C) Gene expression in the white adipose tissue. # p < 0.05 relative to the Bmal1flox/flox mice fed the chow diet. (D) Triglyceride (TG) contents in the liver (left) and the skeletal muscle (right) from male Bmal1flox/flox mice and MKO mice fed the chow diet or HFD for 4 weeks. (E) Level of TG, cholesterol, non-esterified fatty acids (NEFA) and adiponectin in serum. In panel A and B, * p < 0.05, *** p < 0.001 relative to Bmal1flox/flox mice. In panel (CE), # p < 0.05 relative to the Bmal1flox/flox mice fed the chow diet. * p < 0.05 relative to the Bmal1flox/flox mice fed the HFD.
Ijms 19 02813 g004
Figure 5. Deletion of the Bmal1 gene in the muscle improves the state of insulin sensitivity in obesity. Bmal1flox/flox mice and MKO mice were fed the chow diet or the HFD for 4 weeks before being analyzed (n = 6). (A) Glucose tolerance test. (B) Insulin tolerance test. The area under the curve (AUC) was calculated for respective group. (C) The level of serum insulin during the glucose tolerance test of mice fed the HFD for 4 weeks. (D) Gene expression in the skeletal muscle. (E) (Left) A representative Western blot of phosphorylated AKT (pAKT) and total AKT in the skeletal muscle of Bmal1flox/flox mice and MKO mice. The skeletal muscle was isolated from mice after 15 min of insulin administration. (Right) Band intensity was analyzed with ImageJ (n = 4). In panel ((A,B) (top)) * p < 0.05, *** p < 0.001 relative to the Bmal1flox/flox mice on the same diet. In panel ((A) (bottom), (B) (bottom)) and (D), # p < 0.05 relative to Bmal1flox/flox mice fed the chow diet. * p < 0.05 relative to the Bmal1flox/flox mice fed the HFD. In Panel (E), # p < 0.05 relative to the Bmal1flox/flox mice fed the chow diet. * p < 0.05 relative to the Bmal1flox/flox mice fed the HFD with insulin administration.
Ijms 19 02813 g005aIjms 19 02813 g005b
Figure 6. Deletion of Bmal1 gene in the muscle increases the gene expression related to β-oxidation, fatty acid uptake and vascularization. Bmal1flox/flox mice and MKO mice were fed the chow diet or the HFD for 4 weeks before being analyzed (n = 6). Gene expression in the mouse skeletal muscle was analyzed by qRT-PCR. (A) The expression of genes involved in β-oxidation. (B) The expression of genes involved in fatty acid uptake. (C) The expression of genes involved in vascularization. (D) The expression of myoglobin and troponin. (E) The expression of genes involved in lipogenesis. (F) The expression of genes involved in mitochondria biogenesis. # p < 0.05 relative to Bmal1flox/flox mice fed the chow diet. * p < 0.05 relative to the Bmal1flox/flox mice fed the HFD.
Ijms 19 02813 g006
Figure 7. Deletion of Bmal1 gene in the muscle activates calcium-dependent signaling pathway. (A) The level of Ca2+ in the skeletal muscles (left) and serum (right) at ZT10 and 22 (n = 6). (B) A representative Western blot of cytoplasmic and nuclear proteins of the skeletal muscle isolated at ZT10. (C) A representative Western blot of tissue extracts of the skeletal muscle isolated at ZT10 (Left). Band intensity was analyzed with ImageJ (n = 4) (Right). In panel (B,C), lanes 1 and 2 were run using samples from two different mice. * p < 0.05 relative to the Bmal1flox/flox mice.
Ijms 19 02813 g007
Figure 8. Cacna1s is a target gene of REV-REB α in the skeletal muscle. (A) Expressions of Cacna1s gene in the skeletal muscle of male Bmal1flox/flox mice and MKO mice (n = 5). (B) Luciferase activity in HEK293 cells transfected with the reporter plasmids containing the Cacna1s promoter or its mutant variant in the presence of REV-ERB α or empty expression vector (pcDNA3.1) (n = 5). The positions of the putative RORE are labeled. Normalized luciferase activity in cells transfected with empty expression vector (pcDNA3.1) was arbitrarily set at 1. (C) ChIP analysis of the interaction between REV-ERB α and the region containing the Cacna1s/RORE in the mouse skeletal muscle at ZT10 and ZT22 (n = 4). * p < 0.05, *** p < 0.001 relative to the Bmal1flox/flox mice (A), or pcDNA 3.1-transfected cells (B) (t-test). In panel (C), # p < 0.05 relative to non-immune IgG at ZT10. * p < 0.05 relative to anti-REV-ERB α antibody at ZT10.
Ijms 19 02813 g008
Table 1. Primer sequences.
GeneForward (5′-3′)Reverse (5′-3′)
36B4GCACTTTCGCTTTCTGGAGGGTGTCTGACTTGGTGCTTTGGCGGGATTAG
Cacna1sCCACACAGGGTAGCATGTAATCTCAGCTCCTCGTTAGCTT
Cd36TGCTGGAGGTGTTATTGGTGTGGGTTTTGCACATCAAAGA
Cd68CTTCCCACAGGCAGCACAGAATGATGAGAGGCAGCAAGAGG
Cpt1bGTCGCTTCTTCAACGTCTGGAAGAAAGCAGCACGTTCGAT
Cpt2TCCTCGATCAAGATGGGAACGATCCTTCATCGGGAAGTCA
Dgat1TGTGTGGTGATGCTGATCCTGAGTGCCAGGCGCTTCTCAATCTGAAAT
ErraGGAGGACGGCAGAAGTACAAAGCGACACCAGAGCGTTCAC
F4/80GTTTGGCTATGGGCTTCCAGTCGCAAGGAGGACAGAGTTTATGGTG
FasnTGCTCCCAGCTGCAGGCGCCCGGTAGCTCTGGGTGTA
Fatp1TGGTCAAGGTCAATGAGGACACGAACGCTGTGGGCAATCTTCTTGTTG
Fatp4TAGCCGCATCCTGTCCTTTGTGTACTTCTTGTTGTTGGCACCCTGGTT
FlkCCCGCATGAAATTGAGCTATAAACATCTTCGCCACAGTCC
Glut4GCTTTGTGGCCTTCTTTGAGCGGCAAATAGAAGGAAGACG
HadhaTGTGCCTGCTGCATTTGACAACAAGGCCTTTGCTCTGCTT
HadhbAGCTGCACTTTCGGGTTTGTAACAGCTGTGGTCATGGCTT
Il-1bCAACCAACAAGTGATATTCTCCATGGATCCACACTCTCCAGCTGCA
Il-6ACAACCACGGCCTTCCCTACTCACGATTTCCCAGAGAACATG
Il-10ACTTGGGTTGCCAAGCCTTAAGAAATCGATGACAGCGCCT
Insulin receptorAAAGTTTGCCCAACCATCTGGTGAAGGTCTTGGCAGAAGC
Irs1GCTCTAGTGCTTCCGTGTCCGTTGCCACCCCTAGACAAAA
LcadATGGCAAAATACTGGGCATCTCTTGCGATCAGCTCTTTCA
MbCCTGGGTACCATCCTGAAGAGAGCATCTGCTCCAAAGTCC
McadCGCTCTTAGGACTACTTGCTAACCATGGTATTTACATGCAATGGACAG
Mcp1CTTCTGGGCCTGCTGTTCACCAGCCTACTCATTGGGATCA
MyHC IGCCTGGGCTTACCTCTCTATCACCTTCTCAGACTTCCGCAGGAA
MyHC IIaCAGCTGCACCTTCTCGTTTGCCCGAAAACGGCCATCT
MyHC IIbCAATCAGGAACCTTCGGAACACGTCCTGGCCTCTGAGAGCAT
MyHC IIxGGACCCACGGTCGAAGTTGCCCGAAAACGGCCATCT
Pgc1aGATGGCACGCAGCCCTATCTCGCACGGAGAGTTAAAGGAA
Pgc1bAACCCAACCAGTCTCACACAGGATGCTGTCCTTGTGGGTAGG
PparaATGCCAGTACTGCCCTTTTCGGCCTTGACCTTGTTCATGT
ScadCCACCAGACAAGACCGATTTTCAATGAGGTATGGCACC
Scd1TGGGTTGGCTGCTTGTGGCGTGGGCAGGATGAAG
TfamCAAGTCAGCTGATGGGTATGGTTTCCCTGAGCCGAATCATCC
Tie2TTGAAGTGACGAATGAGATATTTAGAGCTGTCTGGCTT
TnfaCGTCAGCCGATTTGCTATCTCGGACTCCGCAAAGTCTAAG
Tnni1TCATGCTGAAGAGCCTGATGGGAGGCATTTGGCTTCAATA
Tnni2CTGAGGGGCAAGTTCAATAAGGTCCCGTTCCTTCTCAGT
VlcadTCATTGCCAAGGGCGGTTGATTTTGCTGATGGCGGCTTCTA

