Article

Comparative Transcriptome Analysis Reveals an Efficient Mechanism for α -Linolenic Acid Synthesis in Tree Peony Seeds

1
College of Landscape Architecture and Arts, Northwest A&F University, Yangling 712100, China
2
Department of Biological Sciences, East Tennessee State University, Johnson City, TN 37614, USA
3
Gansu Forestry Science and Technology Extend Station, Lanzhou 730046, China
*
Authors to whom correspondence should be addressed.
These authors contributed equally to this work.
Int. J. Mol. Sci. 2019, 20(1), 65; https://doi.org/10.3390/ijms20010065
Submission received: 17 November 2018 / Revised: 14 December 2018 / Accepted: 21 December 2018 / Published: 24 December 2018
(This article belongs to the Special Issue Seed Development, Dormancy and Germination)

Abstract

:
Tree peony (Paeonia section Moutan DC.) species are woody oil crops with high unsaturated fatty acid content, including α-linolenic acid (ALA/18:3; >40% of the total fatty acid). Comparative transcriptome analyses were carried out to uncover the underlying mechanisms responsible for high and low ALA content in the developing seeds of P. rockii and P. lutea, respectively. Expression analysis of acyl lipid metabolism genes revealed upregulation of select genes involved in plastidial fatty acid synthesis, acyl editing, desaturation, and triacylglycerol assembly in seeds of P. rockii relative to P. lutea. Also, in association with ALA content in seeds, transcript levels for fatty acid desaturases (SAD, FAD2, and FAD3), which encode enzymes necessary for polyunsaturated fatty acid synthesis, were higher in P. rockii compared to P. lutea. Furthermore, the overexpression of PrFAD2 and PrFAD3 in Arabidopsis increased linoleic and ALA content, respectively, and modulated the final ratio 18:2/18:3 in the seed oil. In conclusion, we identified the key steps and validated the necessary desaturases that contribute to efficient ALA synthesis in a woody oil crop. Together, these results will aid to increase essential fatty acid content in seeds of tree peonies and other crops of agronomic interest.

Graphical Abstract

1. Introduction

Tree peony belongs to the section Moutan DC, genus Paeonia, and family Paeoniaceae and is endemic to China. Recently, tree peony has attracted wide research interests due to the high amount of polyunsaturated fatty acids (PUFAs, >90%) in its seeds [1]. The α-linolenic acid (ALA, 18:3) content of peony seed oil (>40%) is higher than that of conventional vegetable oils derived from corn (1%), soybean (8%), and rapeseed (11%) [2]. ALA is an essential omega-3 fatty acid (FA) for human health and nutrition, as it cannot be synthesized by humans and can only be obtained from diet [3]. Thus, ALA plays an important role in prevention of heart diseases, hypertension, diabetes, and obesity [4,5]. Identifying and engineering plants to generate high levels of omega-3 FAs is a pertinent approach to meet the increasing dietary needs of humans [6]. To this extent, we aimed to elucidate the mechanisms by which tree peony species accumulate ALA in its seeds and develop tree peony species as an alternative source for the production of omega-3 FAs.
In plants, FA synthesis in plastid and triacylglycerol (TAG) assembly in the endoplasmic reticulum (ER) are the two major events in storage lipid accumulation. Typically, FA biosynthesis is catalyzed by the FA synthase complex and requires several steps to synthesize palmitoyl-acyl carrier protein (16:0-ACP) from acetyl-CoA. Palmitoyl-ACP can be further elongated to stearoyl-ACP (18:0-ACP) by the addition of two carbon atoms from acetyl-CoA [7]. In plastid, most of the 18:0-ACP is desaturated to oleoyl-ACP (18:1-ACP) by a soluble stearoyl-ACP desaturase (SAD) [8]. Acyl-ACP thioesterases, mainly FATA, and FATB hydrolyze acyl-ACPs, mostly oleic acid (OA, 18:1), and a small amount of palmitic acid (PA, 16:0) and stearic acid (SA, 18:0) to release free FAs in the plastid stroma [9,10]. These FAs are activated to acyl-CoAs before entering into ER where they can be incorporated into membrane glycerolipids and storage lipids by sequential esterification of glycerol-3-phosphate (G3P) [9]. First, acylation of G3P is catalyzed by the glycerol-3-phosphate acyltransferase (GPAT) at sn-1 to form lysophosphatidic acid (LPA), followed by a second acylation by LPA acyltransferase (LPAAT) at sn-2 to produce phosphatidic acid (PA). Third, acylation requires dephosphorylation of PA by a PA phosphatase (PAP) to generate diacylglycerol (DAG), which can be used as a substrate for Kennedy pathway by diacylglycerol acyltransferase (DGAT) to produce TAG [11]. TAG can also be formed by the transfer of acyl groups from phosphatidylcholine (PC) to DAG by the phospholipid: diacylglycerol acyltransferase (PDAT) [12,13].
In mature seeds, desaturation of OA to linoleic acid (LA,18:2) and subsequently to ALA are catalyzed by two ER-localized FA desaturases (FAD2 and FAD3), respectively [14,15]. These desaturases use phospholipids as acyl substrates, and NADH, NADH-cytochrome b5 reductase and Cyt b5 as electron donors [8]. As membrane-bound proteins, they contain three conserved histidine (His) clusters that contain His boxes comprising eight His residues [16,17]. Desaturase genes have been characterized in many plant species, including Arabidopsis [15,18], soybean [19], rapeseed [20], and cotton [21]. Only a single FAD2 gene was found in Arabidopsis [14], while in most other plant species, FAD2 is encoded by small or large gene families, and their expression can be tissue-specific or constitutive. For instance, the expression of two FAD2 genes in olive and grape are constitutive in different organs but specific in seeds [22,23]. Similarly, among the three FAD2 genes in cotton and sunflower, only one of them is seed-specific, while the other two are ubiquitous [24,25]. Omega-3 FAD3 in microsomes, encoded by the FAD3 gene, is the major contributor to ALA content in seeds [18]. In soybean, while three FAD3 genes contribute to ALA content in seeds [19], in flax [26] and perilla [5] it is controlled by two FAD3 genes. In tree peonies, the expression levels of putative FAD2 and FAD3 were positively correlated with ALA content suggesting their role in synthesis of ALA via PC-derived pathway [1].
Recent transcriptomics of oil-rich tissues of oil palm [27], Sacha inchi [28], peanut [29], avocado [30], perilla [31], and various oilseeds [32], including tree peony seeds [1], led to the identification of key genes and regulators of TAG biosynthesis. The seed development process of tree peonies is complex, however, and the ALA accumulation is development- and species-dependent [1]. Here, we compared the developing seed transcriptome of Paeonia rockii and Paeonia lutea, a high and low ALA accumulating species, respectively. The RNA-seq data were analyzed to identify key metabolic steps that contribute to differential ALA accumulation. The data also led us to further clone FAD2 and FAD3 and characterize their role in ALA biosynthesis.

2. Results and Discussion

Among the developing seeds of nine wild tree peony species that were previously analyzed, seeds from P. rockii contained the highest FA content (271.82 mg/g seed DW), while P. lutea had the lowest (150.09 mg/g seed DW) [1]. In addition to ALA being the major contributor for the difference in FA content in the seeds of the two species, there is also phenotypic variation in terms of size and color (Figure 1). The seeds of P. rockii are significantly smaller and weigh less than those of P. lutea during mid and late stages of development (Figure 1C). Interestingly, while P. rockii seeds are pale yellow in color and darken during maturation (Figure 1A), seeds of P. lutea are very dark from the early stages itself (Figure 1B). Various studies on cultivated varieties of brassica, including quantitative trait loci mapping [33,34] and flax oil seeds [35], identified a strong negative correlation between dark seed coat (flavonoid content) and oil content. The correlation, if any, of lower FA and ALA content of P. lutea seeds, relative to P. rockii is associated with its dark seed color—and possible interaction between the lipid and flavonoid biosynthesis pathway—is yet to be determined. Here, the comparison of seed transcriptomes of both species during development was limited to identifying crucial steps and the characterization of key enzymes, including desaturases involved in ALA synthesis.

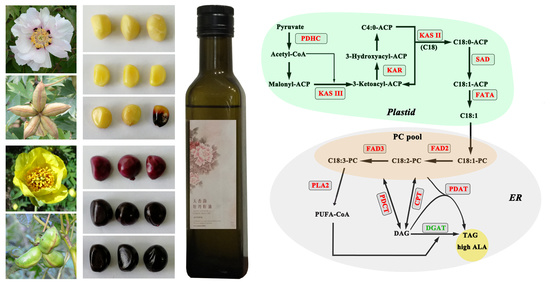
2.1. Transcriptome Data Reveals Lipid Pathways Associated with High ALA Content in Seeds

To identify key genes involved in ALA synthesis, three seed developmental stages of P. rockii and P. lutea (Figure 2B,C), with differential ALA accumulation (Figure 1C) were selected. Their transcriptome yielded over 271 million reads with 64,044 and 47,322 unigenes (https://www.ncbi.nlm.nih.gov/sra/SRP150148) for P. lutea and P. rockii, respectively (Table S1; Figure S1). The transcriptomes were primarily annotated by BLASTX search against the NCBI nonredundant (Nr) protein database [36] and SwissProt (Table S1) [37]. In BLASTX homology search with the cutoff E-value set at 10−6, 22,533 unigenes (35.2%) for P. lutea and 24,860 unigenes (52.5%) for P. rockii were identified. For both species, the three top-hit species were Vitis vinifera, Juglans regia, and Theobroma cacao (Figure S2). A total of 45,205 and 49,563 unigenes for P. lutea and P. rockii, respectively, were assigned at least one gene ontology (GO) terms. For both species, the most highly represented terms for the category of biological process were metabolic, cellular, and single-organism processes; catalytic activity and binding in the molecular function category; and cell, membrane, and organelle in the cellular component category (Figure S3).
Considering the interest in ALA and TAG biosynthesis in general, the lipid database with information for over 740 genes encoding proteins involved in acyl lipid metabolism (http://aralip.plantbiology.msu.edu/, accessed on November 2014) [38] was used to identify associated unigenes in tree peony transcriptome (Table S2). More than 600 unigenes from each species were annotated as homologs to lipid metabolism genes and were categorized into 18 associated pathway groups by KEGG analysis (Table S2). More than two-thirds of these unigenes in both species were represented in seven categories that primarily contribute to glycerolipid and FA metabolism (Figure 2A). The total transcript levels during seed development, expressed as reads per kilobase per million (RPKM), for five of these seven categories were significantly higher in P. rockii than in P. lutea (Figure 2A and Table S2). Although some of the unigenes may overlap among the categories in KEGG analysis, it is noteworthy that the expression levels for genes involved in synthesis of FAs, particularly ALA and other unsaturated FAs, were significantly higher in the seed transcriptome of species that is richer in oil and specifically ALA content. Such a pattern of higher and differential expression levels for genes specifically encoding for enzymes involved in acyl lipid metabolism is consistent with transcriptome analyses of oil-rich seed and nonseed tissues [27,30,32].
Comprehensive transcriptome studies have previously demonstrated that the synthesis of TAG primarily involves at least 28 genes encoding for enzymes in FA biosynthesis in the plastid and TAG assembly in the ER [27,30,32], excluding oleosins, the packaging proteins (Tables S3 and S4). The total RPKM values of these unigenes in plastid and ER, annotated as homologs to TAG biosynthesis genes and expressed during seed development were compared between the two species (Figure 2B,C). Interestingly, despite the higher ALA content in P. lutea at 20 days, the total transcript levels in the plastid and ER remained similar between the species, which perhaps reflects the similar total oil content in seeds during their early developmental stages [1]. The ALA amount, however, was significantly higher in P. rockii compared to P. lutea during the later stages (60 and 80 days; Figure 1C). By 80 days, ALA content in P. rockii seeds was 2.4-fold higher than of P. lutea (p < 0.01; Figure 1C), which coincides with the significantly higher expression of FA synthesis genes in P. rockii than in P. lutea (p < 0.01; Figure 2B). In the ER, significant differences in seed transcript levels between the two species were noted only at 80 days (Figure 2C). Although the transcript levels may not always reflect enzyme activity, several studies have shown a tight correlation between the expression of select genes encoding for oil biosynthesis and oil content [27,30,32]. These data suggest that, in P. rockii, key genes involved in FA synthesis in plastid are upregulated during 60–80 days (Figure 1B) and TAG accumulation in the ER at 80 days (Figure 2C), the time point at which accumulation of ALA has peaked (Figure 1C).

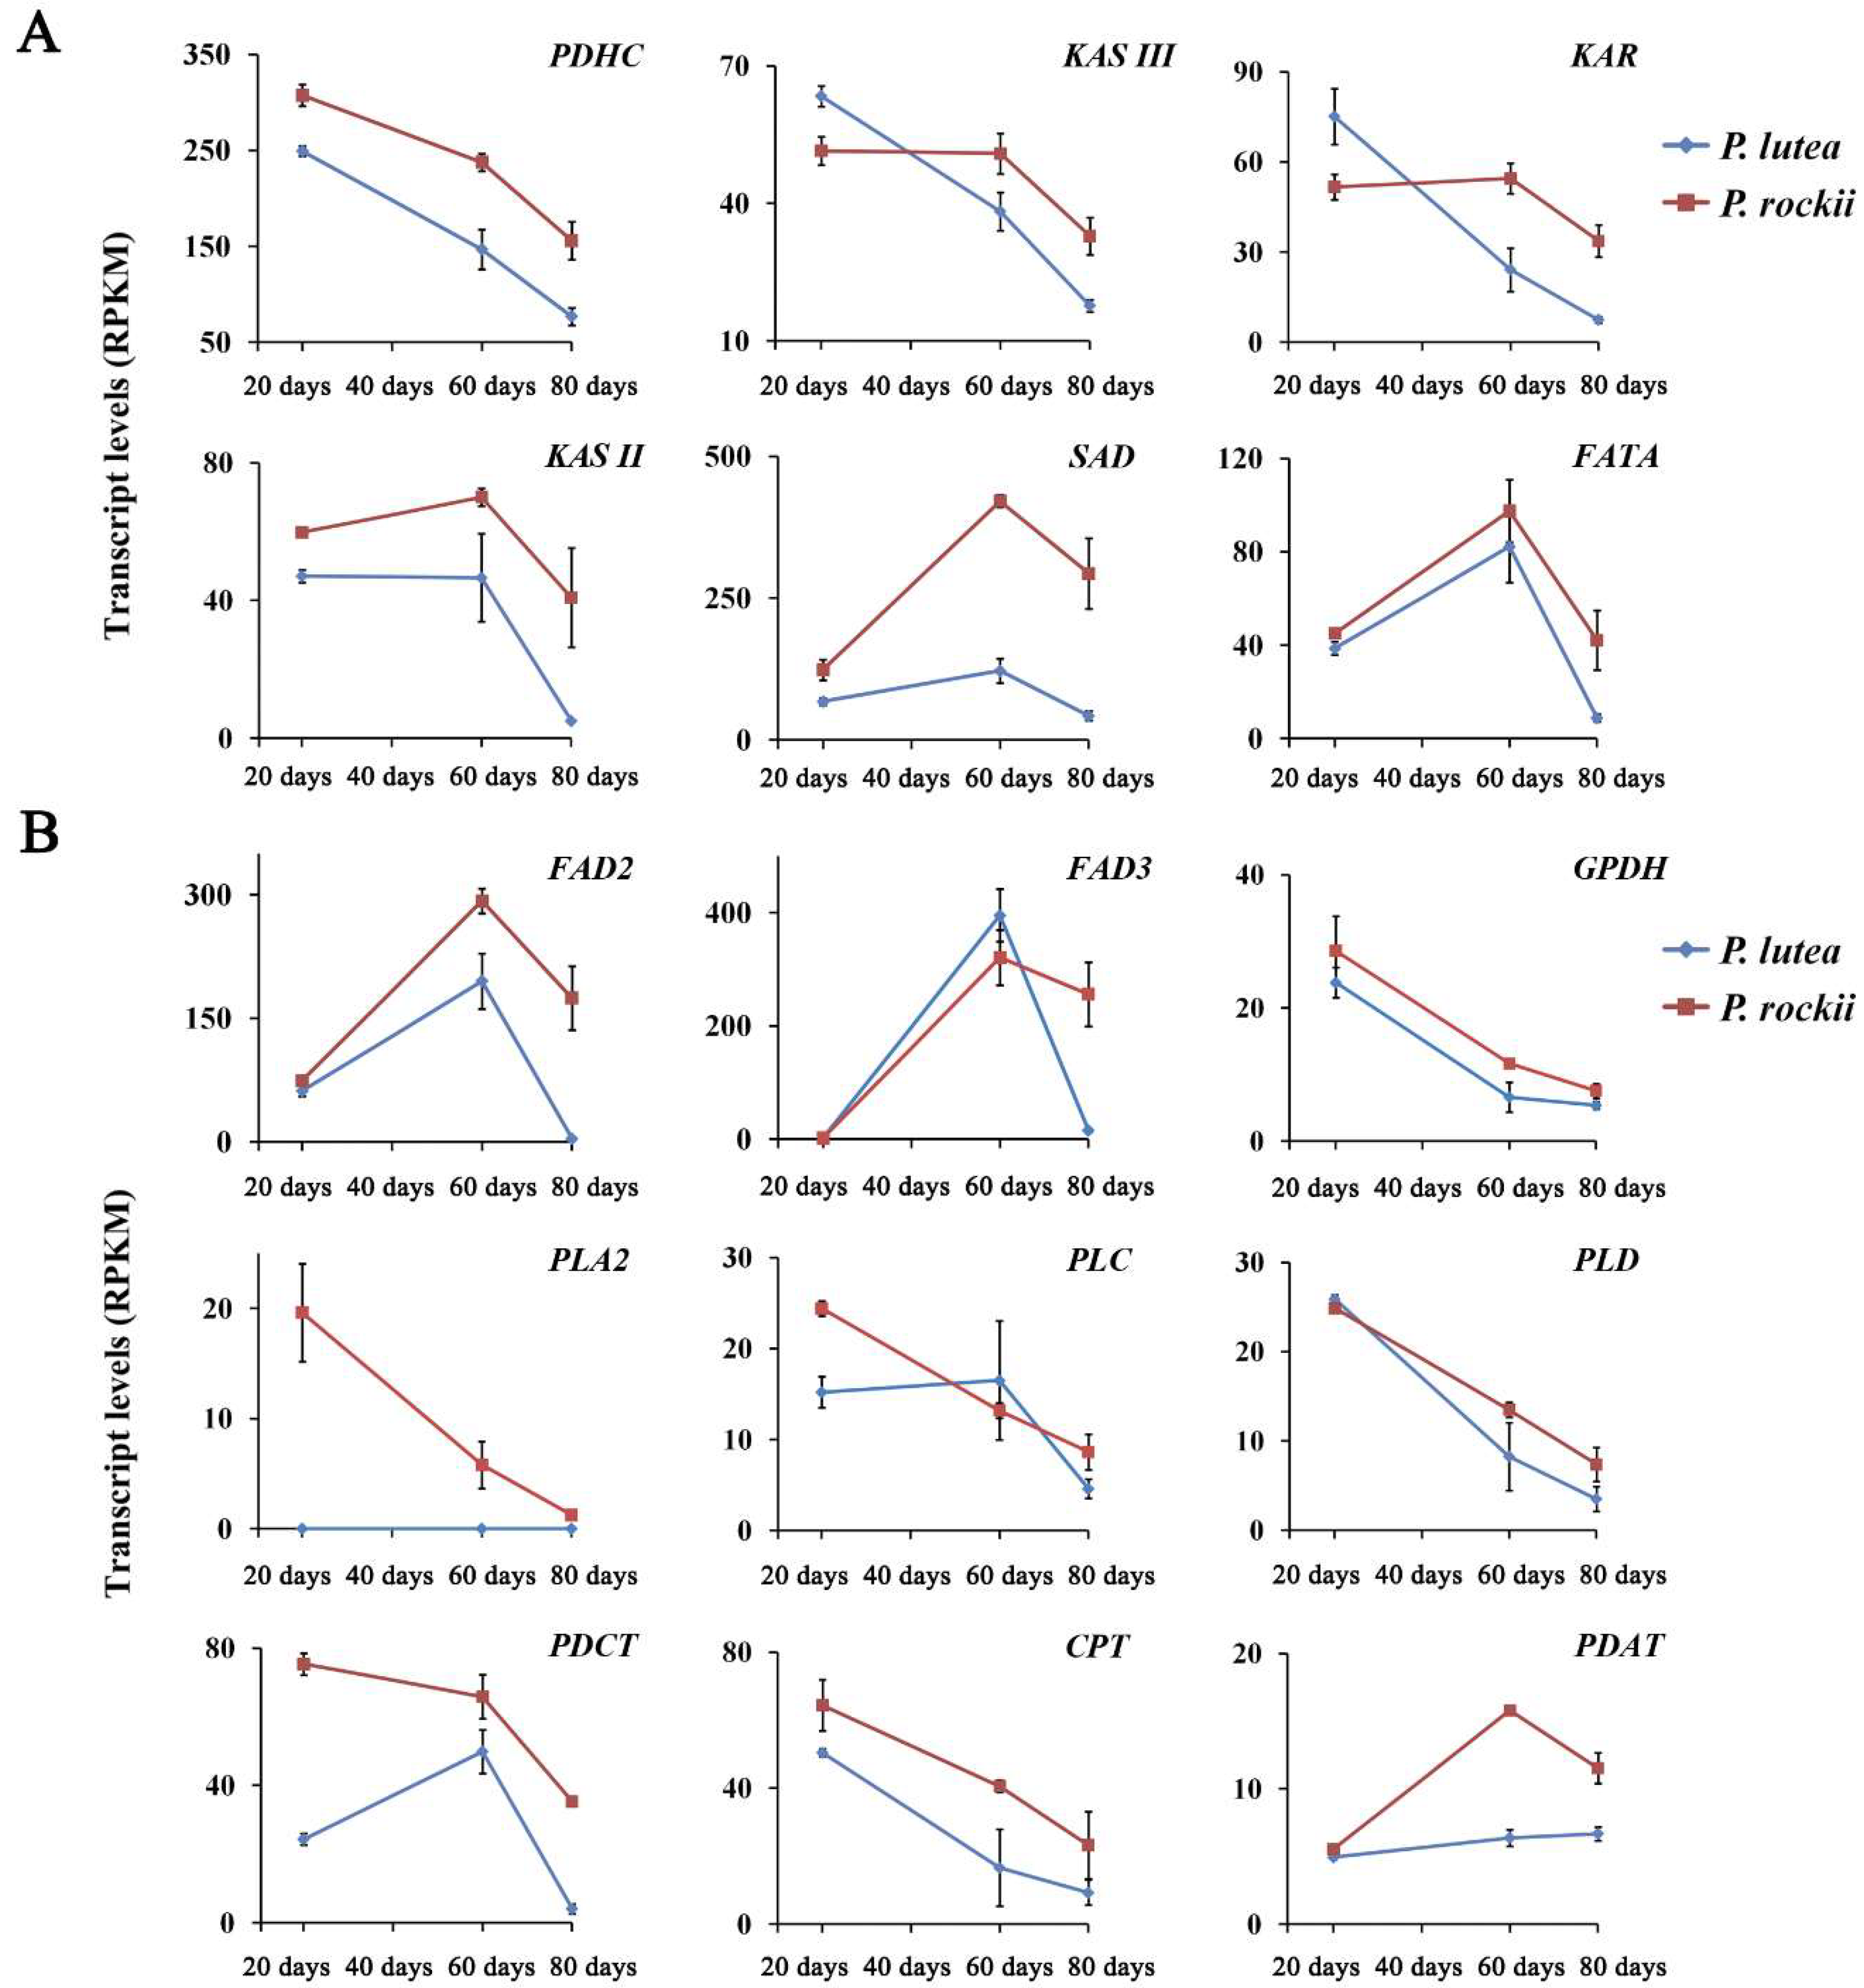
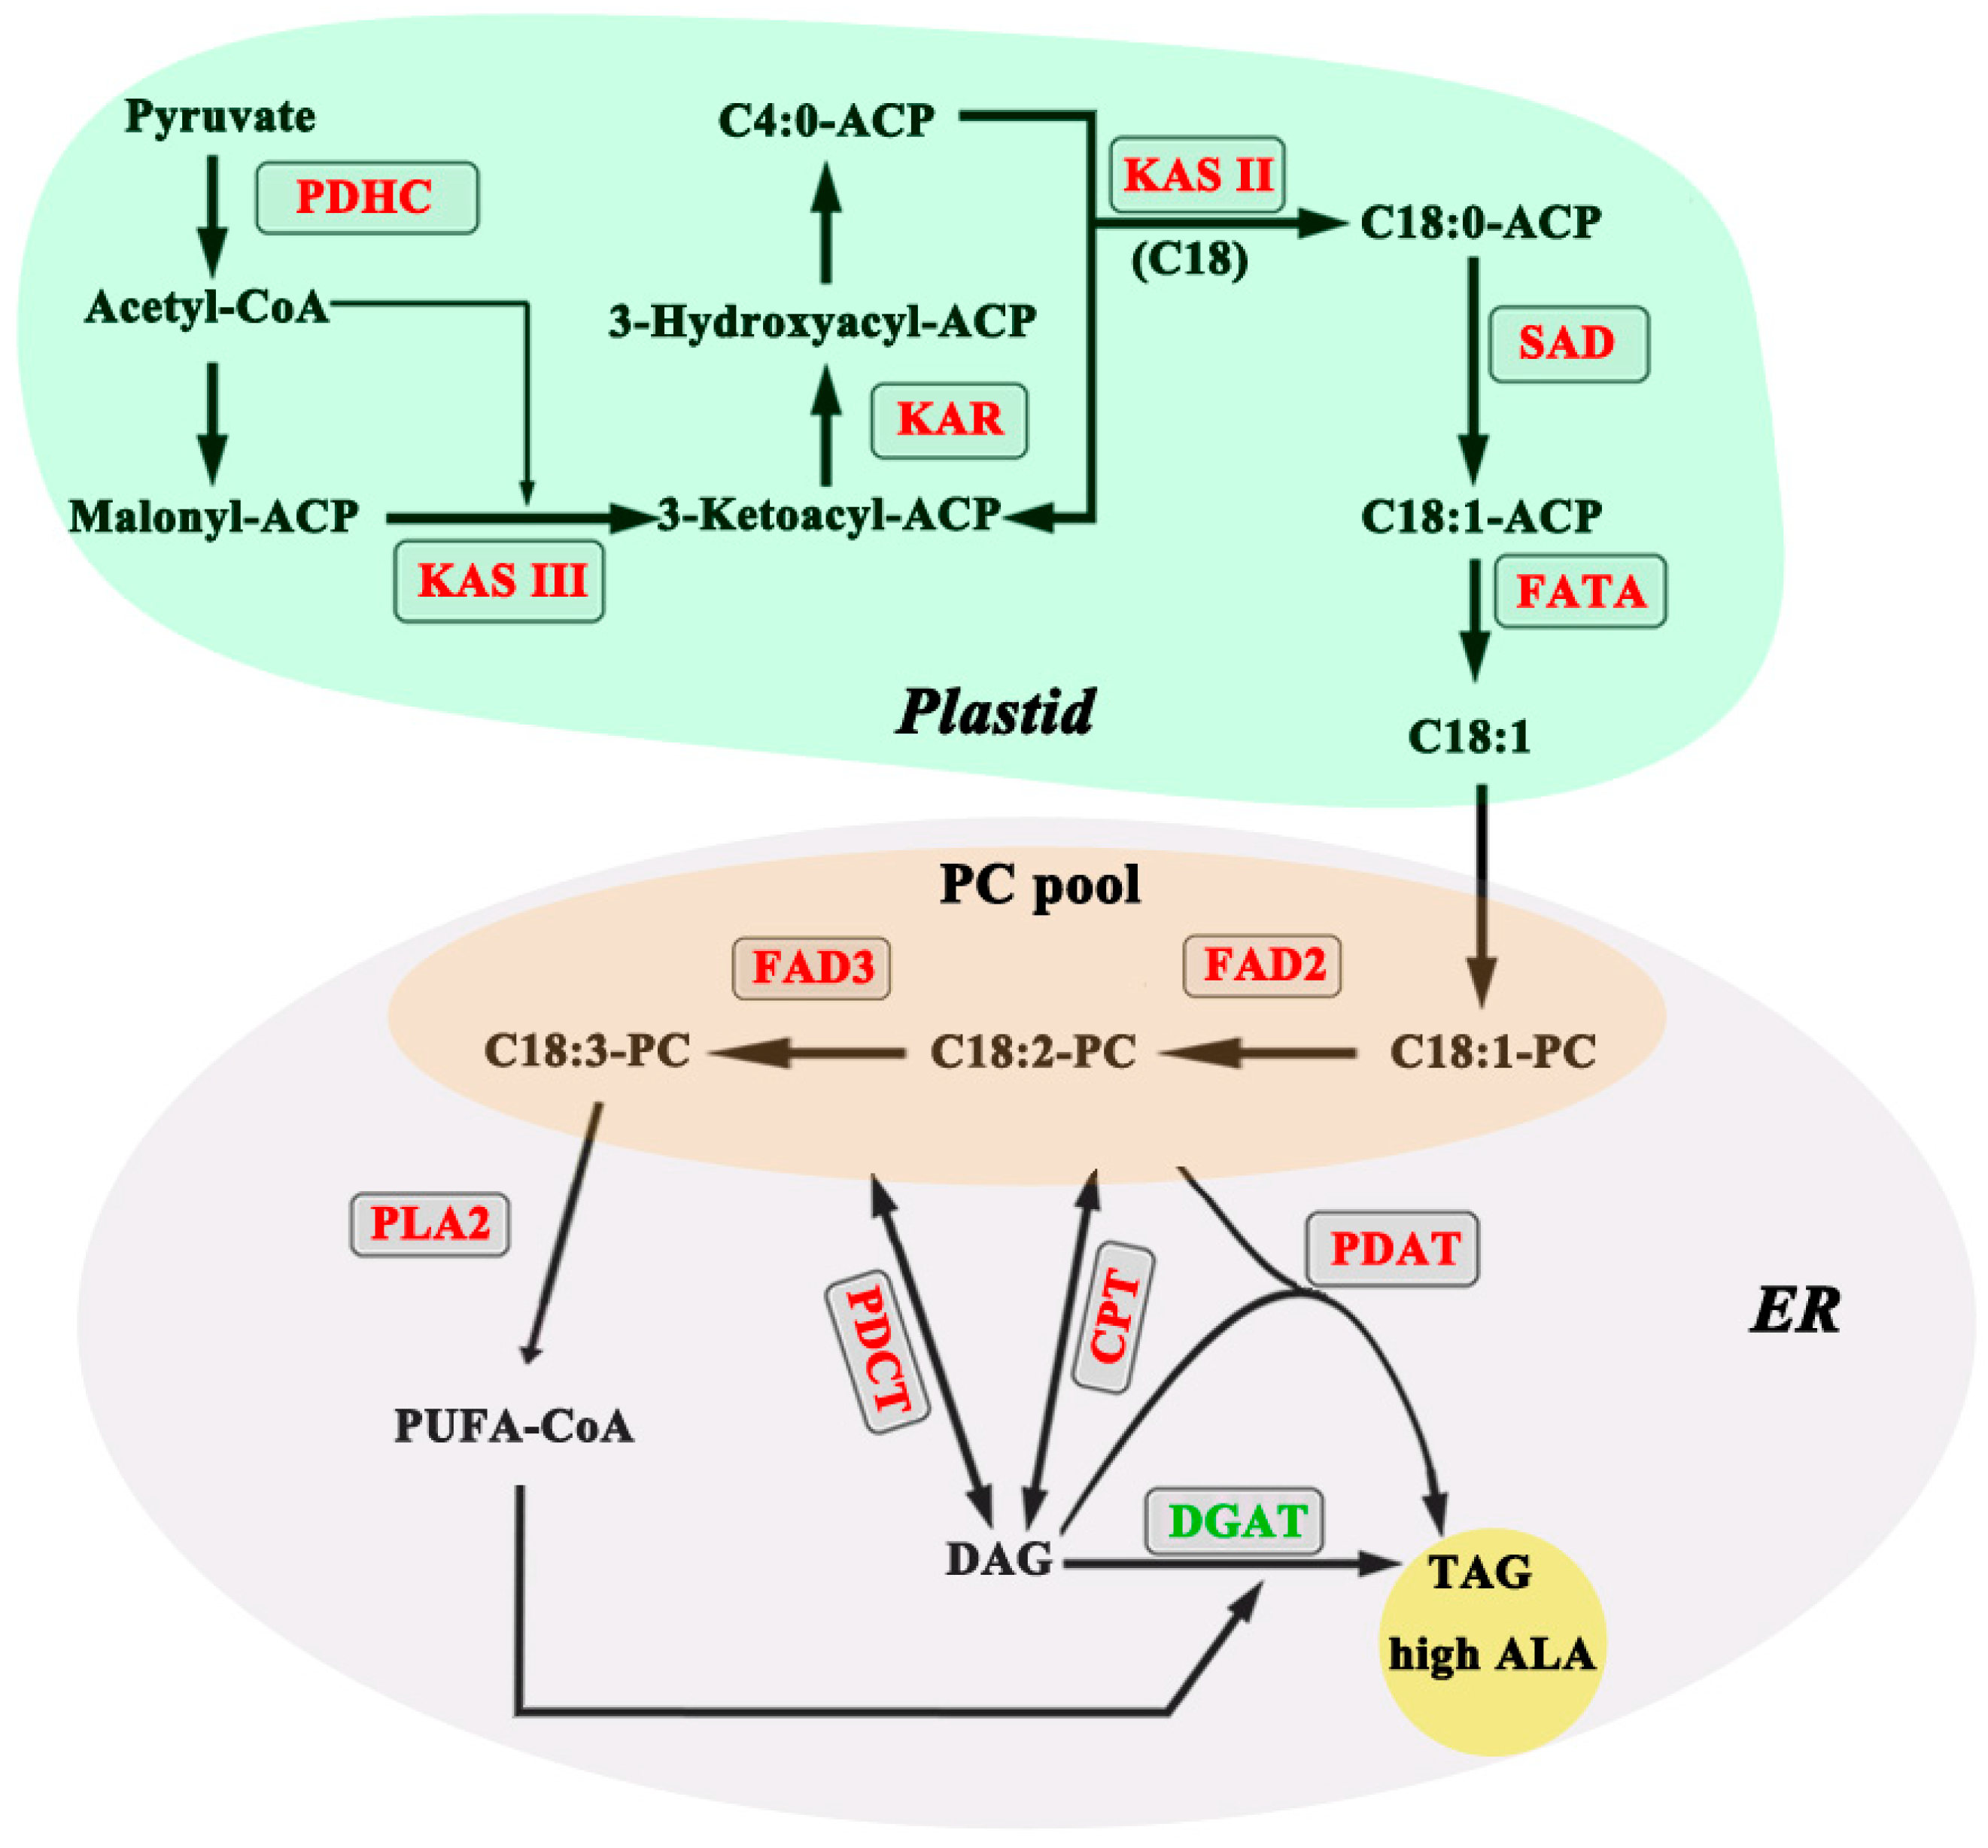
2.2. Gene Expression for Select Enzymes in TAG Metabolism Is Associated with High ALA Content

Since there were significant differences between the two species in their ALA content and lipid gene expression in plastid during 60–80 days, transcript levels for 14 plastidial genes during that period of seed development were compared (Table S4). Among the 14 plastidial FA synthesis genes, only six of them were significantly upregulated in P. rockii by at least 1.5-fold, relative to P. lutea, during 60–80 days developmental period (Figure 3A,B). Similarly, among 14 ER genes, expression for nine genes was more than1.5-fold higher in P. rockii relative to P. lutea at 80 days (Figure 4A,B), the time period at which ALA content and gene expression in ER between the species were significantly different (Figure 2C). A significantly higher expression for select genes in P. rockii than in P. lutea suggests that only a few genes in the plastid and ER, among the possible 28 genes are likely to contribute to the more active TAG metabolism and higher oil/ALA content in P. rockii.
A higher rate of FA accumulation in tree peonies occurs mostly during 20–60 days after pollination (DAP) of developing seeds [1]. In association, most core enzymes of FA synthesis in the plastid and TAG assembly in the ER showed higher transcript levels at 20 and 60 days relative to 80 days (Figure 5A,B), which coincides with seed maturation. Comparing the temporal expression profile of the six plastidial and nine ER genes that were significantly higher in P. rockii (Figure 3B and Figure 4B) during the period of oil accumulation revealed that the differences were mostly limited to two expression patterns: (1) the transcript levels for these upregulated genes in P. rockii were either several-fold higher, and/or (2) decreased at a lower rate, relative to P. lutea, during the highest oil accumulation period (Figure 5A,B). Among the FA synthesis genes in the plastid, the average transcript levels for pyruvate dehydrogenase complex (PDHC), β-ketoacyl-ACP synthase (KAS) II and III, and reductase (KAR), stearoyl-ACP desaturase (SAD) and fatty acyl thioesterase A (FATA) were significantly higher in P. rockii than P. lutea (Figure 3B and Figure 5A).
The expression of PDHC is associated with enzyme activity that drives the committed step in FA synthesis by generating acetyl-CoA. High expression levels for PDHC have been highly correlated with de novo FA synthesis and high oil content in seed and nonseed tissues. Particularly, accumulation of transcripts for E1β subunit of PDHC was strongly correlated with the formation of lipid within the developing embryo in Arabidopsis [39]; in P. rockii, its expression levels were 3.2-fold higher than in P. lutea at 80 days (Table S4). Genes KASIII and KAR encode for enzymes that act on immediate downstream steps to acetyl-CoA synthesis in FA biosynthesis. Specifically, while KASIII is a rate-limiting enzyme catalyzes the initial condensation reaction between acetyl-CoA and malonyl-ACP to produce 3-ketoacyl-ACP, KAR subsequently reduces it to 3-hydroxyacyl-ACP. Overexpression of KASIII, although reduced the rate of FA synthesis, an increase in palmitic acid was noted in seeds of rapeseed [40] and jatropha [41]. In P. rockii, the expression levels for KASII were also high (Figure 5A), suggesting its synergistic role with KASIII in both enhancing the palmitic acid content and in its subsequent elongation to stearic acid. As such, overexpression of JcKASII in Arabidopsis kasII mutant increased 18-carbon FAs but decreased 16-carbon acyl chains in leaves and seeds [42].
Expression levels of KASII, SAD, and FATA are expected to affect FA chain length, saturation, and the relative proportion of 16:0 and 18:1 [43], respectively. The enzyme SAD is responsible for introducing the first double bond into 18:0-ACP to produce 18:1Δ9-ACP, an essential precursor for feeding the acyl editing process leading to ALA synthesis. Thus, while higher levels of KASII are expected to result in increased 18:0-ACP, SAD expression will result in its desaturation and FATA in termination and release of 18:1 free FA. Expression level for all the three genes is more than 4.5-fold higher in P. rockii than in P. lutea at 80 days (Table S4), suggesting their strong influence in production of 18:1 as the preferred end product of plastidial FA biosynthesis. The temporal expression profile was also very similar between the three genes, with the highest expression levels noted at 60 days (Figure 5A). The higher expression levels of SAD have been correlated with 18:1 accumulation in avocado mesocarp [30]. Among the thioesterases A and B, FATA is known to prefer oleoyl-ACP as a substrate [44]. Higher transcript levels for FATA in P. rockii also suggests 18:1 as the main product of plastidial FA synthesis. These results together imply that at least six genes in the plastid might play a key role in higher oil content in P. rockii, and SAD could be the first key enzyme that drives ALA synthesis in tree peony seeds by providing the 18:1 precursor.
Although nine genes showed significant upregulation in TAG assembly in the ER at 80 days for P. rockii, relative to P. lutea, temporal profile (Figure 5B) suggests that desaturases and enzymes involved in acyl editing might be crucial in determining the final TAG content and composition as discussed below. The temporal profile for some of the unigenes related to Kennedy pathway (GPDH, LPAAT, PAP) and two phospholipases (PLC, PLD) was similar between P. lutea and P. rockii (Figure 5B). Curiously, the expression levels for GPAT were not only higher in P. lutea during the early stages of seed development but DGAT levels also remained higher and stable during 20 to 60 days, and further increased by 80 days (Figure 4B and Table S4). These data might suggest that increase in TAG and ALA content in P. rockii is likely achieved through a route alternate to the Kennedy pathway.

2.3. Acyl Editing and Head Group Exchange Drives PUFA Synthesis in P. rockii

Membrane lipid, PC is a central intermediate in the flux of FAs and/or DAG substrates into TAG synthesis. The esterification of newly synthesized acyl-CoA to PC occurs via acyl-CoA:lyso-PC acyltransferase (LPCAT) [45]. Generally, the sn-1 position of PC is esterified with saturated or monounsaturated FA and sn-2 with PUFAs. The appropriate acyl composition of PC is further achieved after de novo synthesis and modification, which involves deacylation and reacylation cycles. At least 50% of the nascent PC undergoes deacylation of sn-2 position to produce lyso-PC by the action of PLA2 followed by a reacylation with the action of LPCAT. Free FAs released by the hydrolysis of phospholipids at the sn-2 position by PLA2 enter the acyl-CoA pool for TAG assembly (Figure 4A). Such acyl flux is crucial for the production of TAG containing high levels of PUFAs and thus both PLA2 and LPCAT serve as key enzymes in the process of converting PUFA-PC into PUFA-CoA [45,46,47].
The temporal expression profile of PLA2 in P. rockii indicates that the levels are higher at early stages of seed development compared to the later time points but interestingly transcripts for PLA2 were not detected in P. lutea (Figure 5B). A specific PLA2, identified through transcriptome study of castor endosperm [32] was shown to play a significant role in acyl editing and thus contributing to hydroxy FA accumulation in castor [48]. Similarly, LPCAT enzymes from several plant species including Arabidopsis [49], Ricinus communis [50], and Brassica napus [51] were cloned and characterized and shown to be crucial for PUFA synthesis. In N. benthamiana, two LPCATs were shown to prefer C18:3 PUFA as an acyl donor [52]. Interestingly, the transcript levels of LPCAT were significantly higher in P. lutea than in P. rockii, especially during 60 and 80 days developmental stages (Figure 5B). All this suggests that LPCAT may not be a rate-limiting enzyme for ALA synthesis in tree peony, and more active acyl editing/remodeling pathway in P. rockii might allow for flux of C18:3 to enter the acyl-CoA pool or C18:3-PC for TAG assembly.
In addition to acyl editing, the majority of acyl flux through PC for TAG synthesis is controlled by the exchange phosphocholine headgroup between PC and DAG. There are at least three routes to generate DAG from C18-PC (Figure 4A) [45]. First, a lipase-based mechanism utilizing PLC, or PLD plus PAP; second, via PDCT which exchanges phosphocholine between DAG and PC [53]; and third, the reverse reaction of CPT [54]. While the transcript levels of PLC, PLD, and PAP did not differ significantly between the two species, it is noteworthy that the average transcript levels of PDCT and CPT were two-fold higher than in P. lutea (Figure 2A; Table S4). Interestingly, in P. rockii, the RPKM for PDCT and CPT were three- to five-fold higher than the transcripts for PLC, PLD, and PAP. Furthermore, the temporal expression profile of both PDCT and CPT suggests higher activity during 20–60 days of seed development (Figure 5B), which coincides with high rate of oil biosynthesis (Figure 1C) [1]. Thus, unlike in P. lutea, P. rockii might have more than one effective PUFA-PC pathway to generate DAG necessary for TAG synthesis (Figure 4A). Significantly higher expression for PDCT and CPT—not only relative to PLC, PLD, and PAP but also P. lutea (Figure 4B and Figure 5B)—suggests that the exchange of phosphocholine between DAG and PC is preferably mediated by those two enzymes for C18 PUFA synthesis [12,55].

2.4. An Acyl-CoA Independent Pathway May Be a Preferred Terminal Step in ALA Accumulation

Acyltransferases DGAT and PDAT are two important rate limiting enzymes in TAG synthesis and regulating their expression can affect the ALA content in plants. Silencing of DGAT1 in Camelina using artificial microRNA gave a substantial increase in ALA content in seeds [56]. In Arabidopsis dgat1 knockout, PDAT1 expression was upregulated by 65% and there was also an increased ALA content in seeds from 18 to 40% compared to wildtype [57]. Interestingly, while overexpression of intrinsic PDAT1 neither changed the FA profile nor lipid content in Arabidopsis thaliana [58], it is considered to mediate TAG synthesis and contribute up to 75% of wildtype oil levels in the absence of DGAT1 [13]. Furthermore, the acyl composition of TAG was also highly enhanced with PUFAs at the sn-3 position [59]. Similarly, overexpression of LuPDAT1 (Linum usitatissimum L.) in Arabidopsis also resulted in an enhanced ALA content [60], which supports that PDAT1 contributes to the transfer of ALA, from the sn-2 position of PC to the sn-3 position of DAG [57]. In P. rockii, the transcript level for PDAT was significantly higher than in P. lutea, and the converse was true for DGAT expression (Figure 4B and Figure 5B; Table S4). The ALA accumulation pattern (Figure 1C) correlates with that of the PDAT expression, suggesting that an acyl-CoA independent pathway is the likely route for PUFA synthesis in tree peony seeds. The lower expression level of DGAT in P. rockii might drive more FAs into PC, which will subsequently aid in accumulation of more ALA into TAG. On the contrary, in P. lutea, the higher expression level of DGAT and the lower expression level of PDAT is likely to decrease the ALA accumulation in TAG. The higher expression of Camelina sativa PDAT1-A in seeds and ectopically in leaves also increased the ALA content by 45% compared with wildtype [61]. These data together suggest that PDAT expression levels and the ratio of PDAT/DGAT might determine the final ALA content in TAG.

2.5. Desaturases Play a Key Role in Driving the ALA Content in Seeds

The 18:1-ACP generated by SAD in the plastid is transported to ER as 18:1-CoA and incorporated into PC where it can be further desaturated to 18:3-PC by the action of FAD2 and FAD3, which introduce the second and third double bond into 18:1-PC, sequentially [62]. In P. rockii, more than 45% of the transcripts encoding for FA and TAG biosynthesis pathway proteins were mapped to SAD, FAD2, and FAD3 at 60 and 80 days (Table S4). In addition, their transcript levels in both species increased from 20 to 60 days (Figure 5A,B), coinciding with their ALA accumulation pattern (Figure 1C). In P. lutea, however, the expression levels of all the three desaturases reduced faster in seeds from 60 to 80 days than in P. rockii (Figure 5B). The major differences in expression of FAD2 and FAD3 were mainly temporal suggesting that the desaturase genes were more effective with sustained expression in P. rockii than in P. lutea.
To further confirm the significance of the three desaturases associated with FA desaturation, their expression levels were evaluated in four stages of developing seeds using qRT-PCR. Both FAD2 and FAD3 levels in P. rockii were significantly higher than in P. lutea (Figure 6). Consistent with transcriptomic data (Figure 5B), these two genes were highly expressed in P. rockii, and lowly in P. lutea at 80 days (Figure 6). In 40 and 80 days seed, the SAD was highly expressed in P. rockii than in P. lutea (Figure 6). Both RNA-seq and qRT-PCR results showed that the transcripts of FAD2 and FAD3 were higher at 60 and 80 days in P. rockii, while in P. lutea, although they were higher at 60 days, expression reduced to very low levels at 80 days (Figure 5B and Figure 6). The temporal profile of FAD2 and FAD3 expression also agreed with the ALA accumulation pattern during the seed development of both peony species (Figure 1C) suggesting their control in ALA content. Similar transcriptome analysis of developing seed of perilla also revealed that the expression profile of FAD3 gene is correlated with ALA synthesis in seed [31].

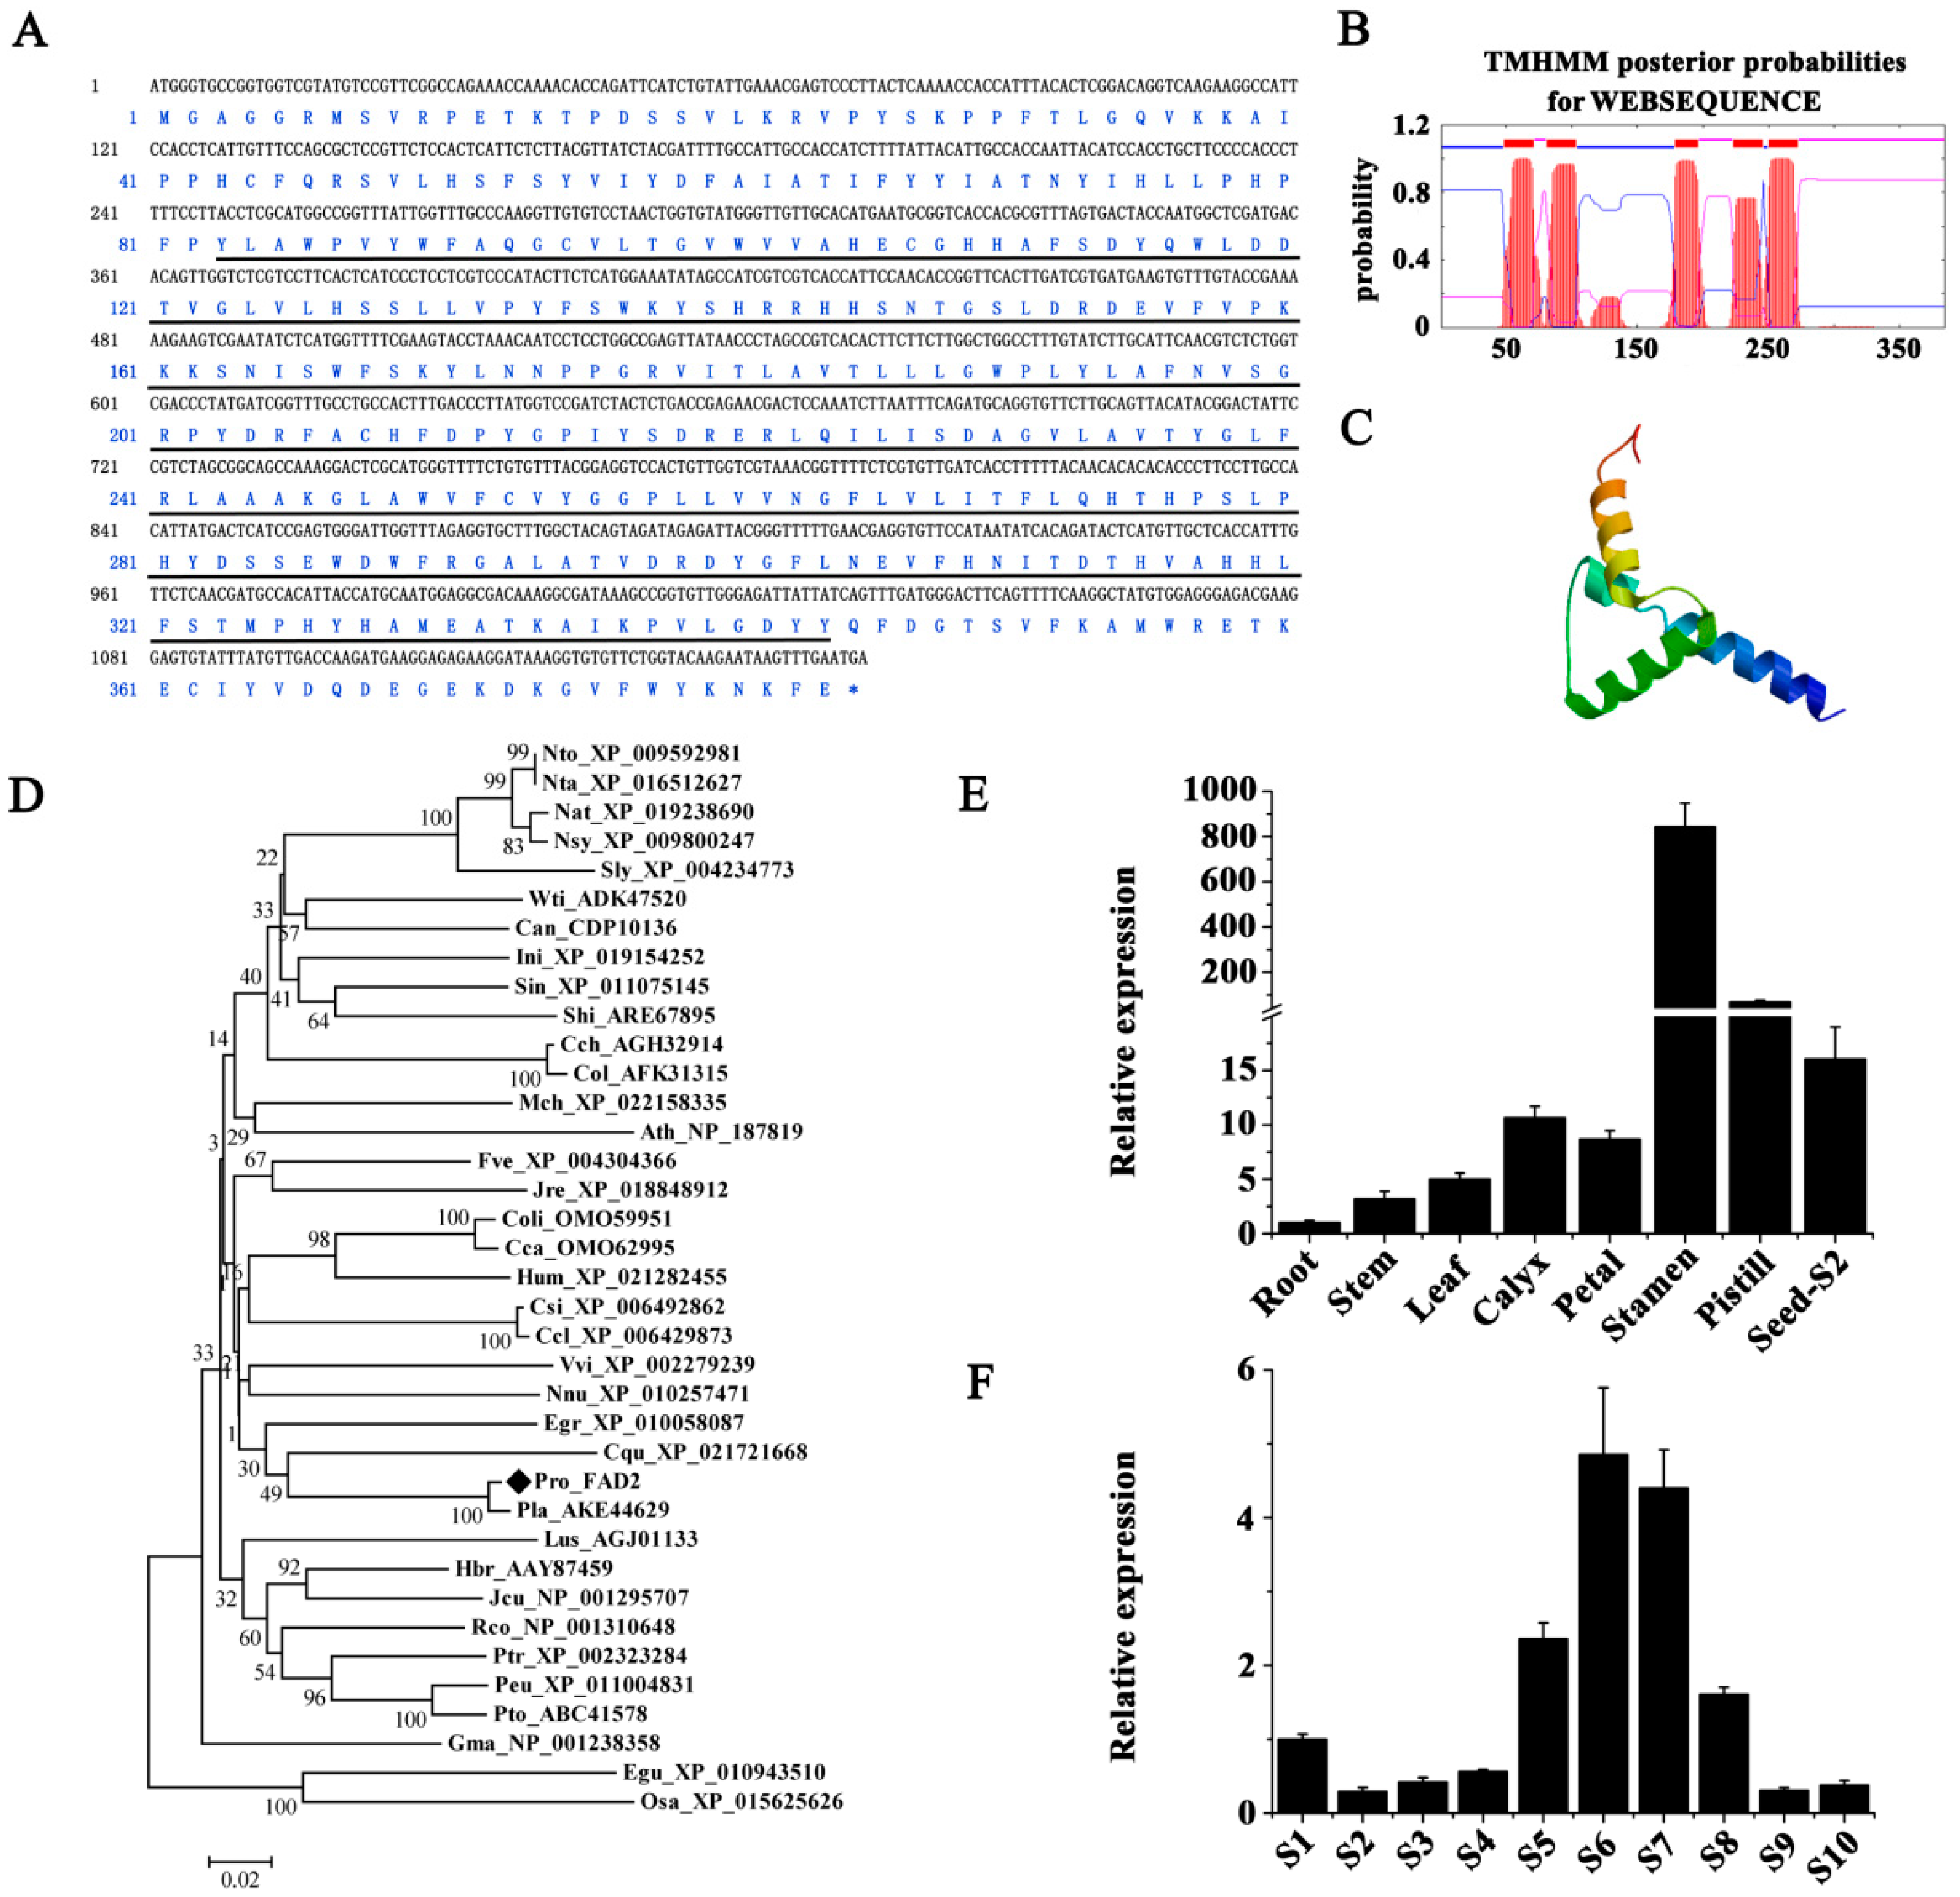
2.6. Molecular Cloning and Expression Analysis of PrFAD2 and PrFAD3

To investigate the role of critical desaturase genes in PUFA biosynthesis in ER, full-length coding DNA sequences of 1155 bp and 1308 bp, corresponding to putative PrFAD2 (GenBank accession No. MG845869) and PrFAD3 (GenBank accession No. MG845868), respectively, were identified in P. rockii. Their deduced amino acids shared a highly conserved 1-acyl-sn-glycerol-3-phosphate acyltransferase-related domain (Figure 7A and Figure 8A). Transmembrane domain prediction analysis revealed five and three transmembrane regions in deduced polypeptides encoded by PrFAD2 and PrFAD3 (Figure 7B and Figure 8B), respectively. Both FAD2 and FAD3 enzymes generally contain six [14,16] and four [17,63] transmembrane domains, respectively. Analysis of protein tertiary structure indicated that PrFAD2 consisted of four α-helices (Figure 7C), while PrFAD3 contained three α-helices (Figure 8C). Phylogenetic analyses of PrFAD2 showed that it is closely associated with FAD2 proteins from P. lactiflora (AKE44629), Eucalyptus grandis (XP_010058087), Citrus sinensis (XP_006492862), and C. clementine (XP_006429873) (Figure 7D). On the other hand, PrFAD3 showed 97.7%, 79.8%, and 74.1% similarity with the FAD3 homologs from P. lactiflora (AJA36814) and V. vinifera (XP_002277573 and XP_010650893), respectively (Figure 8D).
To study tissue-specific expression of PrFAD2 and PrFAD3, transcript levels in seeds at various developmental stages and other tissues in P. rockii were analyzed by qRT-PCR. Transcripts of both genes were detected in all the tissues tested; PrFAD2 was constitutively expressed in floral and fruit tissues (calyxes, petals, stamens, pistils, and seeds) at a higher level than in leaves, stems, and roots, and stamens had a maximum transcript abundance (Figure 7E). A similar ubiquitous expression pattern for FAD2 gene was observed in other plants such as in cotton and maize [64,65]. A marked increase in PrFAD2 transcripts, however, occurred during seed development, with a peak at 80 days (S8) followed by a sharp decline (Figure 7F). The pistils and seeds exhibited significantly higher constitutive expression levels of PrFAD3 than other tissues, with pistils and calyxes being highest and lowest, respectively (Figure 8E). Transcripts for PrFAD3 rapidly and dramatically increased at different developmental stages of seeds, also reaching a peak at 80 days (S8) followed by a gradual reduction at 90 days (S9) and 100 days (S10) after pollination (Figure 8F). The expression pattern of FAD3 of chia and perilla in different organs showed that while FAD3 was expressed at varying levels in different organs, it was mostly expressed in the late stage of seed development, the period during which ALA was typically accumulated [66].

2.7. Overexpression of PrFAD2 and PrFAD3 Affects the ALA/LA Ratio in Arabidopsis Seeds

For a final validation of the biological functions of PrFAD2 and PrFAD3, transgenic Arabidopsis plants with constitutive overexpression of these two genes under the control of CaMV 35S promoter were generated. Three T2 homozygous lines with highest expression of PrFAD2 (#17, #51, and #58) or PrFAD3 (#10, #14, and #26), as determined via semi-quantitative RT-PCR, were selected for seed FA analysis (Figure 9A,C). Overexpression of PrFAD2 resulted in a remarkable reduction in the ratio of ALA/LA (Figure 9A), but increased in transgenic lines overexpressing PrFAD3, compared to wildtype (Figure 9C). Furthermore, PrFAD2-overexpressing transgenic lines displayed elevated levels of C16:0, C18:0, and C18:2 but decreased levels of C18:1 and C20:0 (Figure 9B), while an obvious increase in C16:0, C18:1, C18:3, and C20:1 but decline in C18:2 and C20:0 levels were detected in Arabidopsis with PrFAD3 overexpression (Figure 9D). These results demonstrate that PrFAD2 and PrFAD3 have opposing impact on ALA/LA ratio and alter FA composition of seed. FAD2 gene from V. labrusca functionally complemented the Arabidopsis fad2 mutant [23]. In olive, higher expression of FAD2 gene was associated with increased LA content [22], while the expression of FAD2 from Vernicia fordii in yeast affected unsaturated FA metabolism [67]. Oil palm FAD2 gene was found to only accept oleic acid as a substrate [68]. Conversely, in Sacha inchi, the expression level of FAD3 gene in seeds was higher than in other organs and positively correlated with the higher percentage of ALA content in seed oil [28]. In addition, when FAD3 gene from Salvia hispanica and Perilla frutescens was overexpressed in yeast and was grown in media supplemented with LA, transformed yeast utilized LA and produced a significant amount of ALA compared to wildtype yeast [66]. Together with the various observations made in plants, the role of peony FAD2 and FAD3 genes in LA and ALA acid synthesis, respectively can be ascertained unequivocally.

3. Materials and Methods

3.1. Plant Material

Among the two tree peony species used in this study, P. rockii grows about 0.8 to 2 m in height with 15–21 leaflets. The flowers are white, pink or red with purple patches on the bottom of the petals, and fruits are composed of five carpels (Figure 1A). P. rockii is mainly distributed in Shaanxi, Gansu, and Hubei, China. Plants of P. lutea grow 0.5–1.6 m in height and bear nine leaflets; flowers are yellow, the number of carpels is 3–6 (Figure 1B); mainly distributed in Yunnan, Xizang, Sichuan, China. Seeds from P. rockii, and P. lutea varied in their size and color during seed development (Figure 1). Among them, the seed color is darker and the seed is larger in P. lutea (Figure 1).
Seeds of P. rockii and P. lutea were collected in 2015 at the Wild Tree Peony Germplasm Repository, Gansu Forestry Science and Technology Extension Station, China (36°03′ N, 103°40′ E). Wild tree peony seeds were introduced to the germplasm repository and were cultivated under same environmental and cultivation conditions for 13 years. We monitored their seed development process from pollination until maturation from May to August 2015. Pods from two wild species were collected all the developmental stages (S1 to S10) from 0 to 100 days at 10 days intervals. The ALA content of two wild species seeds was measured by GC-MS as previously described [1]. For the transcriptome sampling, seeds of P. rockii and P. lutea at three developing stages (20, 60, 80 days) were collected from the same individual, and pods with the same developing stage from three plants comprised of two replicates. For qRT-PCR, seeds from ten developing stages (S1 to S10) and other tissues (root, stem, leaf, calyx, petal, stamen, and pistil) of P. rockii were collected from three plants comprised of three replicates. All samples were flash frozen in liquid nitrogen and stored at −80 °C.

3.2. RNA Extraction, Sequencing and De Novo Assembly

Total RNA was extracted from seeds of P. rockii and P. lutea collected at 20, 60 and 80 days separately using the TIANGEN RNA Prep Pure Plant kit (Tiangen Biotech Co. Ltd., Beijing, China) following the manufacturer’s instructions, and mRNA was enriched by Oligo (dT) magnetic beads. RNA integrity was evaluated with an RNase free agarose gel electrophoresis, and the yield and quality of the RNA samples were determined using a 2100 Bioanalyzer (Agilent Technologies, Santa Clara, CA). The cDNA library was constructed by using a NEBNext® UltraTM RNA Library Prep Kit for Illumina (NEB, Ipswich, MA, USA), and it was sequenced using an Illumina HiSeqTM 4000 platform (Illumina Inc., San Diego, CA, USA) by Gene Denovo Biotechnology Co. (Guangzhou, China). Before assembly, adapter sequences, more than 10% of unknown nucleotides (N), and low-quality reads containing more than 40% of low quality (Q-value ≤ 10) bases were removed from the raw reads to gain more reliable results. After that, the high-quality clean reads from all samples of the same wild species were merged together and assembled using Trinity package [69] to construct unique consensus sequences as the reference sequences.

3.3. Normalization of Gene Expression Levels and Identification of Differentially Expressed Genes

The SOAP aligner v.2.21 tool (http://soap.genomics.org.cn/soapaligner.html#down2, accessed on May 2010) was used to align sequencing reads to the reference sequences. To eliminate the influence of different sequencing discrepancies and gene lengths on the gene expression calculation, the expression level of each gene was measured as RPKM (Reads Per kb per Million reads) based on the number of uniquely mapped reads. The longest transcript was selected to calculate the RPKM for genes with more than one alternative transcript.
To infer the transcriptional changes during seed development in the two tree peony species, differentially expressed genes (DEGs) after 60 and 80 days of pollination were identified by comparing the expression levels at 60 days with those at 20 days and the level at 80 days with those at 60 days in P. rockii and P. lutea, respectively. The false discovery rate (FDR) was calculated to adjust the threshold of p-value [70] to correct for multiple testing. Transcripts with a fold change ≥ 2 and an FDR < 0.05 in a comparison as differentially expressed between the two time points [71].

3.4. Functional Annotation, GO and KEGG Classification

All expressed genes were functional annotated against four databases, including NCBI nonredundant protein database (NR), Kyoto Encyclopedia of Genes and Genomes (KEGG), Universal Protein (UniProt), and Eukaryotic Orthologous Groups (KOG), by BLASTX searches (E-value < 10−5) in Blast2GO [72]. For the gene matched to multiple protein sequences, the protein with the highest similarity score was considered as the optimal annotation.
GO functional classification of the DEGs was implemented by the WEGO [73], in order to demonstrate the distribution difference of gene functions between the two species into the three main ontology categories: molecular function, cellular component and biological process. Over-presented GO terms were identified using a hypergeometric test with a significance threshold of 0.05 after the Benjamini and Hochberg FDR correction. KEGG enrichment analysis of the DEGs was performed using the KOBAS 2.0 software [74].

3.5. Quantitative Real-Time PCR

Quantitative real-time PCR (qRT-PCR) was performed by using a SYBR® Premix Ex Taq™ kit (DRR041A, Takara, Dalian, China) in a StepOne™ Real-Time PCR System (Applied Biosystems, Foster City, CA). The qRT-PCR reaction systems were as follows: 95 °C for 15 s, followed by 40 cycles of 95 °C for 5 s, 58 °C for 30 s, and 72 °C for 31 s. The fluorescence data were collected and analyzed with StepOne™ analysis software during the 72 °C step. 18S–26S internal transcribed spacer (ITS) was used as a reference gene to normalize the expression data, and the 2△△Ct values were shown as relative expression levels [75]. AtActin7 was used as an endogenous control gene to normalize the semi-quantitative RT-PCR analysis of PrFADs in the wildtype and 35S::PrFADs plants. All primers used for the assessment of transcript levels were listed in Table S4.

3.6. Cloning and in Silico Analysis of Desaturases

Based on transcriptome data, the full-length open reading frames of putative PrFAD2 and PrFAD3 were identified, PCR-amplified from 40 days seeds of P. rockii using specific primers (Table S5) and cloned into pUCm-T vector (SK2212, Sangon, Shanghai, China) for sequencing and expression into binary vector. Blast (http://blast.ncbi.nlm.nih.gov, accessed on April 2010) was used for homology search of sequences at nucleotide and protein levels. TMHMM2.0 (http://www.cbs.dtu.dk/services/, accessed on October 2011) was used for transmembrane prediction analysis of PrFAD2 and PrFAD3. Red lines indicate the transmembrane, blue lines indicate the inside, pink lines indicate the outside. The tertiary structure prediction was conducted using Phyre Version 0.2 (Imperial College London, South Kensington Campus, London SW72AZ, UK) [76]. Based on multiple sequence alignment by MUSCLE (http://www.ebi.ac.uk/Tools/msa/muscle/, accessed on June 2013), and the neighbor-joining method with MEGA software (version 5.1, Tokyo Metropolitan University, Hachioji, Tokyo, Japan) [77] was used to construct the phylogenic tree. Boot-strap values as a percentage of 1000 replicates are indicated at corresponding branch nodes. Scale bar represents the number of amino acid substitutions per site.

3.7. Overexpression and Stable Transformation

Both PrFAD2 and PrFAD3 were ligated into the KpnI-PstI and SalI-PstI restriction sites, respectively of binary vector pCAMBIA1300 under the control of the CaMV 35S promoter. The generated 35S::PrFAD2 and 35S::PrFAD3 constructs were transformed into wildtype Arabidopsis using the floral dip method [78]. The harvested seeds were planted on 1/2 MS plates containing 20 mg/L hygromycin and placed in plant growth chamber (RXZ, Jiangnan Instrument, Ningbo, China) at 22 ± 2 °C under a 14/10 h light/dark (120 μmol·m−2·s−1) cycle. Hygromycin-resistant seedlings with well-established roots and green leaves were selected as T0 transformants, and transferred to moistened potting soil from the 1/2 MS plates. The positive transformants were confirmed by PCR. Independent transgenic lines exhibiting a 3:1 segregation of 20 mg/L hygromycin resistance in the T1 generation were selected. Homozygous T2 transgenic lines showing 100% survival on hygromycin-containing medium were finally established. Mature Arabidopsis seeds were collected from T2 homozygous lines for further analysis. All experimental plants (including controls) were grown at the same time in the same location. The FA measurement of homozygous transgenic lines seeds was measured by GC-MS as described previously [79].

3.8. Statistical Analysis

All experiments included three biological replicates and technical replicates as previously indicated. Mean ± standard deviation (SD) was determined, and unless otherwise noted, one-way analysis of variance was carried out using SPSS (version 17.0 for Windows; SPSS Inc, Chicago, IL, USA). Unless otherwise noted, asterisk (*) indicates significant differences at p < 0.05 level of least significant difference (LSD) test between two species or test groups; different small letters indicate significant differences at p < 0.05 level of LSD test between two species at the same time point; different capital letters indicate significant differences at p < 0.05 level among different time points in the same genotype.

4. Conclusions

In plants, the final TAG content and composition is majorly influenced by the end product of plastidial FA biosynthesis, the acyl editing through PC-derived pathway and their assembly in the ER. In this study, we identified that six key plastidial genes, PDHC, KASIII, KAR, KASII, SAD, and FATA are likely driving the generation of 18:1 acyl group as the major product that feeds into ALA synthesis in the ER. In peony seeds, acyl editing and PDAT-mediated TAG assembly are likely to play a key role in subsequent ALA accumulation. Both FAD2 and FAD3 are the two most important desaturase enzymes that contribute to PUFA synthesis through acyl editing in PC-derived pathway in the ER. The regulation of FAD2 and FAD3 determines the final seed oil composition, especially the ratio of LA to ALA. By cloning FAD2 and FAD3 from P. rockii and their overexpression in Arabidopsis, we showed the role of these two desaturases in modulating the ALA/LA ratio in seeds. In addition to affecting PUFA composition, overexpression of PrFAD2 and PrFAD3 in Arabidopsis significantly increased the LA and ALA production, respectively (Figure 9). These results indicate that FAD2 and FAD3 via acyl editing mechanisms control the level of ALA in tree peony seeds.
Overall, our study concludes that the high ALA content in P. rockii, relative to P. lutea (Figure 10), is result of four major steps in the production of ALA. First, plastid FA synthesis seems to serve as a source by primarily providing C18:1 for further incorporation into PC in the ER. Second, the acyl editing pathway allows for desaturation of C18:1-PC by FAD2 and FAD3 sequentially to produce C18:3-PC. Third, ALA from PC is incorporated into DAG by different exchange routes including PLA2, PDCT, and CPT. Finally, DGAT and PDAT might function in an opposing manner controlling the final step in TAG assembly. We conclude that, along with the role of desaturases, modulation of lower DGAT and higher PDAT expression levels are expected to enhance ALA content of TAG in tree peony seeds. Further characterization of these key metabolic steps and their regulation by genetic manipulation are expected to generate tools to increase the ALA production not only in tree peony seeds but also in other oilseeds of agronomic interest.

Supplementary Materials

Supplementary materials can be found at https://www.mdpi.com/1422-0067/20/1/65/s1. Figure S1. Length distribution of unigenes for two Paeonia species. Figure S2. Top-hit species distribution for sequences from two Paeonia species. Figure S3. Comparative distribution of GO terms between the two Paeonia species. Figure S4. Comparison of relative transcript levels for 10 genes by qRT-PCR and RNA-seq. Figure S5. Correlation analysis between qRT-PCR and RNA-seq data. Table S1. Summary of reference seed transcriptome assembly and annotation. Table S2. Summary of major lipid pathways with unigenes and total expression levels. Table S3. The expression (RPKM values) of lipid metabolism genes in seeds of the two Paeonia species. Table S4. Annotation and transcript levels for select genes associated with lipid metabolism in seeds plastid and endoplasmic reticulum. Table S5. Primers used in this study. Table S6. Species used in phylogenetic analysis.

Author Contributions

Y.Z., L.N. and A.K. designed the experiment. Q.Z., R.Y. and D.S. performed the experiment. Q.Z., Y.Z., L.N. and A.K. analyzed the data and wrote the manuscript. M.M.R., L.X., J.H. and L.H. revised the manuscript. All authors read and approved the final manuscript.

Funding

This work was supported by National Science Foundation of China (Project No. 31800599), China Postdoctoral Science Foundation (Project No. 2018M631211), and The National Forestry Public Welfare Research Project of China (Project No. 201404701).

Conflicts of Interest

The authors declare no conflict of interest.

Abbreviations

ALAα-linolenic acid
LAlinoleic acid
FADfatty acid desaturases
PUFAspolyunsaturated fatty acids
TAGtriacylglycerol
PCphosphatidylcholine
SADstearoyl-ACP desaturase
DEGsdifferentially expressed genes
qRT-PCRquantitative real-time PCR
ITSinternal transcribed spacer
RPKMreads per kilobase per million

References

  1. Zhang, Q.Y.; Yu, R.; Xie, L.H.; Rahman, M.M.; Kilaru, A.; Niu, L.X.; Zhang, Y.L. Fatty acid and associated gene expression analyses of three tree peony species reveal key genes for ALA synthesis in seeds. Front. Plant Sci. 2018, 9, 106. [Google Scholar] [CrossRef] [PubMed]
  2. Radovanovic, N.; Thambugala, D.; Duguid, S.; Loewen, E.; Cloutier, S. Functional characterization of flax fatty acid desaturase FAD2 and FAD3 isoforms expressed in yeast reveals a broad diversity in activity. Mol. Biotechnol. 2014, 56, 609–620. [Google Scholar] [CrossRef] [PubMed]
  3. Warude, D.; Joshi, K.; Harsulkar, A. Polyunsaturated fatty acids: Biotechnology. Crit. Rev. Biotechnol. 2006, 26, 83–93. [Google Scholar] [CrossRef] [PubMed]
  4. Egert, S.; Baxheinrich, A.; Lee-Barkey, Y.H.; Tschoepe, D.; Wahrburg, U.; Stratmann, B. Effects of an energy-restricted diet rich in plant-derived α-linolenic acid on systemic inflammation and endothelial function in overweight-to-obese patients with metabolic syndrome traits. Br. J. Nutr. 2014, 112, 1315–1322. [Google Scholar] [CrossRef] [PubMed] [Green Version]
  5. Kim, M.J.; Go, Y.S.; Ahn, S.J.; Chung, C.H.; Suh, M.C. Functional complementation of a periila ω3 fatty acid desaturase under the seed-specific SeFAD2 promoter. J. Plant Biol. 2008, 51, 174–179. [Google Scholar] [CrossRef]
  6. Amjad Khan, W.; Chun-Mei, H.; Khan, N.; Iqbal, A.; Lyu, S.W.; Shah, F. Bioengineered Plants Can Be a Useful Source of Omega-3 Fatty Acids. BioMed Res. Int. 2017. [Google Scholar] [CrossRef]
  7. Harwood, J.L. Recent advances in the biosynthesis of plant fatty acids. Biochim. Biophys. Acta 1996, 1301, 7–56. [Google Scholar] [CrossRef]
  8. Shanklin, J.; Cahoon, E.B. Desaturation and related modifications of fatty acids. Annu. Rev. Plant Physiol. 1998, 49, 611–641. [Google Scholar] [CrossRef]
  9. Chapman, K.D.; Ohlrogge, J.B. Compartmentation of triacylglycerol accumulation in plants. J. Biol. Chem. 2012, 287, 2288–2294. [Google Scholar] [CrossRef]
  10. Aznar-Moreno, J.A.; Venegas Calerón, M.; Martínez-Force, E.; Garcés, R.; Mullen, R.; Gidda, S.K.; Salas, J.J. Sunflower (Helianthus annuus) long-chain acyl-coenzyme A synthetases expressed at high levels in developing seeds. Physiol. Plant 2014, 150, 363–373. [Google Scholar] [CrossRef]
  11. Coleman, R.A.; Lee, D.P. Enzymes of triacylglycerol synthesis and their regulation. Prog. Lipid Res. 2004, 43, 134–176. [Google Scholar] [CrossRef]
  12. Bates, P.D.; Browse, J. The significance of different diacylgycerol synthesis pathways on plant oil composition and bioengineering. Front. Plant Sci. 2012, 3, 147. [Google Scholar] [CrossRef] [PubMed]
  13. Zhang, M.; Fan, J.; Taylor, D.C.; Ohlrogge, J.B. DGAT1 and PDAT1 acyltransferases have overlapping functions in Arabidopsis triacylglycerol biosynthesis and are essential for normal pollen and seed development. Plant Cell 2009, 21, 3885–3901. [Google Scholar] [CrossRef] [PubMed]
  14. Okuley, J.; Lightner, J.; Feldmann, K.; Yadav, N.; Lark, E. Arabidopsis FAD2 gene encodes the enzyme that is essential for polyunsaturated lipid synthesis. Plant Cell 1994, 6, 147–158. [Google Scholar] [CrossRef] [PubMed]
  15. Arondel, V.; Lemieux, B.; Hwang, I.; Gibson, S.; Goodman, H.M.; Somerville, C.R. Map-based cloning of a gene controlling omega-3 fatty acid desaturation in Arabidopsis. Science 1992, 258, 1353–1355. [Google Scholar] [CrossRef] [PubMed]
  16. Shanklin, J.; Whittle, E.; Fox, B.G. Eight histidine residues are catalytically essential in a membrane-associated iron enzyme; stearoyl-CoA desaturase; and are conserved in alkane hydroxylase and xylene monooxygenase. Biochemistry 1994, 33, 12787–12794. [Google Scholar] [CrossRef] [PubMed]
  17. Los, D.A.; Murata, N. Structure and expression of fatty acid desaturases. Biochim. Biophys. Acta 1998, 1394, 3–15. [Google Scholar] [CrossRef]
  18. Yadav, N.S.; Wierzbicki, A.; Aegerter, M.; Caster, C.S.; Pérez-Grau, L.; Kinney, A.J.; Hitz, W.D.; Booth, J.R., Jr.; Schweiger, B.; Stecca, K.L.; et al. Cloning of higher plant ω-3 fatty acid desaturases. Plant Physiol. 1993, 103, 467–476. [Google Scholar] [CrossRef] [PubMed]
  19. Bilyeu, K.D.; Palavalli, L.; Sleper, D.A.; Beuselinck, P.R. Three microsomal omega-3 fatty-acid desaturase genes contribute to soybean linolenic acid levels. Crop Sci. 2003, 43, 1833–1838. [Google Scholar] [CrossRef]
  20. Reed, D.W.; Schäfer, U.A.; Covello, P.S. Characterization of the Brassica napusextraplastidial linoleate desaturase by expression in Saccharomyces cerevisiae. Plant Physiol. 2000, 122, 715–720. [Google Scholar] [CrossRef]
  21. Yurchenko, O.O.; Park, S.; Ilut, D.C.; Inmon, J.J.; Millhollon, J.C.; Liechty, Z.; Page, J.T.; Jenks, M.A.; Chapman, K.D.; Udall, J.A.; et al. Genome-wide analysis of the omega-3 fatty acid desaturase gene family in Gossypium. BMC Plant Biol. 2014, 14, 312. [Google Scholar] [CrossRef] [PubMed]
  22. Hernández, M.L.; Mancha, M.; Martínez-Rivas, J.M. Molecular cloning and characterization of genes encoding two microsomal oleate desaturases (FAD2) from olive. Phytochemistry 2005, 66, 1417–1426. [Google Scholar] [CrossRef] [PubMed]
  23. Lee, K.R.; Kim, S.H.; Go, Y.S.; Jung, S.M.; Roh, K.H.; Kim, J.B.; Suh, M.C.; Lee, S.; Kim, H.U. Molecular cloning and functional analysis of two FAD2 genes from American grape (Vitis labrusca L.). Gene 2012, 509, 189–194. [Google Scholar] [CrossRef] [PubMed]
  24. Martínez-Rivas, J.M.; Sperling, P.; Lühs, W.; Heinz, E. Spatial and temporal regulation of three different microsomal oleate desaturase genes (FAD2) from normal-type and high-oleic varieties of sunflower (Helianthus annuus L.). Mol. Breed. 2001, 8, 159–168. [Google Scholar] [CrossRef]
  25. Pirtle, I.L.; Kongcharoensuntorn, W.; Nampaisansuk, M.; Knesek, J.E.; Chapman, K.D.; Pirtle, R.M. Molecular cloning and functional expression of the gene for a cotton Δ-12 fatty acid desaturase (FAD2). Biochim. Biophys. Acta 2001, 1522, 122–129. [Google Scholar] [CrossRef]
  26. Vrinten, P.; Hu, Z.; Munchinsky, M.A.; Rowland, G.; Qiu, X. Two FAD3 desaturase genes control the level of linolenic acid in flax seed. Plant Physiol. 2005, 139, 79–87. [Google Scholar] [CrossRef] [PubMed]
  27. Bourgis, F.; Kilaru, A.; Cao, X.; Ngando-Ebongue, G.F.; Drira, N.; Ohlrogge, J.B.; Arondel, V. Comparative transcriptome and metabolite analysis of oil palm and date palm mesocarp that differ dramatically in carbon partitioning. Proc. Natl. Acad. Sci. USA 2011, 108, 12527–12532. [Google Scholar] [CrossRef] [PubMed] [Green Version]
  28. Hu, X.D.; Pan, B.Z.; Fu, Q.; Niu, L.; Chen, M.S.; Xu, Z.F. De novo transcriptome assembly of the eight major organs of Sacha Inchi (Plukenetia volubilis) and the identification of genes involved in α-linolenic acid metabolism. BMC Genom. 2018, 19, 380. [Google Scholar] [CrossRef] [PubMed]
  29. Zhang, J.; Liang, S.; Duan, J.; Wang, J.; Chen, S.; Cheng, Z.; Zhang, Q.; Liang, X.; Li, Y. De novo assembly and characterisation of the transcriptome during seed development; and generation of genic-SSR markers in peanut (Arachis hypogaea L.). BMC Genom. 2012, 13, 90. [Google Scholar] [CrossRef] [PubMed]
  30. Kilaru, A.; Cao, X.; Dabbs, P.B.; Sung, H.J.; Rahamn, M.M.; Thrower, N.; Zynda, G.; Podicheti, R.; Ibarra-Laclette, E.; Herrera-Estrella, L.; et al. Oil biosynthesis in a basal angiosperm: Transcriptome analysis of Persea Americana mesocarp. BMC Plant Biol. 2015, 15, 203. [Google Scholar] [CrossRef] [PubMed]
  31. Kim, H.U.; Lee, K.R.; Shim, D.; Lee, J.H.; Chen, G.Q.; Hwang, S. Transcriptome analysis and identification of genes associated with ω-3 fatty acid biosynthesis in Perilla frutescens (L.) var. frutescens. BMC Genom. 2016, 17, 474. [Google Scholar] [CrossRef] [PubMed]
  32. Troncoso-Ponce, M.A.; Kilaru, A.; Cao, X.; Durrett, T.P.; Fan, J.; Jensen, J.K.; Thrower, N.A.; Pauly, M.; Wilkerson, C.; Ohlrogge, J.B. Comparative deep transcriptional profiling of four developing oilseeds. Plant J. 2011, 68, 1014–1027. [Google Scholar] [CrossRef] [PubMed] [Green Version]
  33. Rahman, M.; McVetty, P. A review of Brassica seed color. Can. J. Plant Sci. 2011, 91, 437–446. [Google Scholar] [CrossRef]
  34. Qu, C.; Hasan, M.; Lu, K.; Liu, L.; Zhang, K.; Fu, F.; Wang, M.; Liu, S.; Bu, H.; Wang, R.; et al. Identification of QTL for seed coat colour and oil content in Brassica napus by association mapping using SSR markers. Can. J. Plant Sci. 2015, 95, 387–395. [Google Scholar] [CrossRef] [Green Version]
  35. Diederichsen, A.; Raney, J.P. Seed colour, seed weight and seed oil content in Linum usitatissimum accessions held by Plant Gene Resources of Canada. Pant Breed. 2006, 125, 372–377. [Google Scholar] [CrossRef]
  36. Pruitt, K.D.; Tatusova, T.; Maglott, D.R. NCBI Reference Sequence (RefSeq): A curated non-redundant sequence database of genomes; transcripts and proteins. Nucleic Acids Res. 2005, 33, D501–D504. [Google Scholar] [CrossRef] [PubMed]
  37. UniProt Consortium. UniProt: A hub for protein information. Nucleic Acids Res. 2015, 43, D204–D212. [Google Scholar] [CrossRef]
  38. Beisson, F.; Koo, A.J.; Ruuska, S.; Schwender, J.; Pollard, M.; Thelen, J.J.; Paddock, T.; Salas, J.J.; Savage, L.; Milcamps, A.; et al. Arabidopsis genes involved in acyl lipid metabolism. A 2003 census of the candidates; a study of the distribution of expressed sequence tags in organs; and a web-based database. Plant Physiol. 2003, 132, 681–697. [Google Scholar] [CrossRef]
  39. Ke, J.; Behal, R.H.; Back, S.L.; Nikolau, B.J.; Wurtele, E.S.; Oliver, D.J. The role of pyruvate dehydrogenase and acetyl-coenzyme A synthetase in fatty acid synthesis in developing Arabidopsis seeds. Plant Physiol. 2000, 123, 497–508. [Google Scholar] [CrossRef]
  40. Dehesh, K.; Tai, H.; Edwards, P.; Byrne, J.; Jaworski, J.G. Overexpression of 3-ketoacyl-acyl-carrier protein synthase IIIs in plants reduces the rate of lipid synthesis. Plant Physiol. 2001, 125, 1103–1114. [Google Scholar] [CrossRef]
  41. Yu, N.; Xiao, W.F.; Zhu, J.; Chen, X.Y.; Peng, C.C. The Jatropha curcas KASIII gene alters fatty acid composition of seeds in Arabidopsis thaliana. Biol. Plant. 2015, 59, 773–782. [Google Scholar] [CrossRef]
  42. Wei, Q.; Li, J.; Zhang, L.; Wu, P.; Chen, Y.; Li, M.; Jiang, H.; Wu, G. Cloning and characterization of a β-ketoacyl-acyl carrier protein synthase II from Jatropha curcas. J. Plant Physiol. 2012, 169, 816–824. [Google Scholar] [CrossRef] [PubMed]
  43. Cahoon, E.B.; Clemente, T.E.; Damude, H.G.; Kinney, A.J. Modifying vegetable oils for food and non-food purposes. In Oil Crops; Vollmann, J., Rajcan, I., Eds.; Springer: New York, NY, USA, 2010; pp. 31–56. [Google Scholar]
  44. Salas, J.J.; Ohlrogge, J.B. Characterization of substrate specificity of plant FatA and FatB acyl-ACP thioesterases. Arch. Biochem. Biophys. 2002, 403, 25–34. [Google Scholar] [CrossRef]
  45. Bates, P.D.; Stymne, S.; Ohlrogge, J. Biochemical pathways in seed oil synthesis. Curr. Opin. Plant Biol. 2013, 16, 358–364. [Google Scholar] [CrossRef] [PubMed] [Green Version]
  46. Lee, K.R.; Chen, G.Q.; Kim, H.U. Current progress towards the metabolic engineering of plant seed oil for hydroxy fatty acids production. Plant Cell Rep. 2015, 34, 603–615. [Google Scholar] [CrossRef] [PubMed]
  47. Wallis, J.G.; Watts, J.L.; Browse, J. Polyunsaturated fatty acid synthesis: What will they think of next? Trends Biochem. Sci. 2002, 27, 467–473. [Google Scholar] [CrossRef]
  48. Bayon, S.; Chen, G.C.; Weselake, R. A Small Phospholipase A2-α from Castor Catalyzes the Removal of Hydroxy Fatty Acids from Phosphatidylcholine in Transgenic Arabidopsis Seeds. Plant Physiol. 2015, 167, 1259–1270. [Google Scholar] [CrossRef] [PubMed]
  49. Wang, X.; Xu, R.; Wang, R.; Liu, A. Transcriptome analysis of Sacha Inchi (Plukenetia volubilis L.) seeds at two developmental stages. BMC Genom. 2012, 13, 716. [Google Scholar] [CrossRef]
  50. Arroyo-Caro, J.M.; Chileh, T.; Alonso, D.L.; García-Maroto, F. Molecular characterization of a lysophosphatidylcholine acyltransferase gene belonging to the MBOAT family in Ricinus communis L. Lipids 2013, 48, 663–674. [Google Scholar] [CrossRef]
  51. Zheng, Q.; Li, J.Q.; Kazachkov, M.; Liu, K.; Zou, J. Identification of Brassica napus lysophosphatidylcholine acyltransferase genes through yeast functional screening. Phytochemistry 2012, 75, 21–31. [Google Scholar] [CrossRef] [Green Version]
  52. Zhang, D.; Jasieniecka-Gazarkiewicz, K.; Wan, X.; Luo, L.; Zhang, Y.; Banas, A.; Jiang, M.; Gong, Y. Molecular characterization of two lysophospholipid: Acyl-CoA acyltransferases belonging to the MBOAT family in nicotiana benthamiana. PLoS ONE 2015, 10, e0144653. [Google Scholar] [CrossRef] [PubMed]
  53. Lu, C.; Xin, Z.; Ren, Z.; Miquel, M.; Browse, J. An enzyme regulating triacylglycerol composition is encoded by the ROD1 gene of Arabidopsis. Proc. Natl. Acad. Sci. USA 2009, 106, 18837–18842. [Google Scholar] [CrossRef] [PubMed]
  54. Slack, C.R.; Roughan, P.G.; Browse, J.A.; Gardiner, S.E. Some properties of cholinephosphotransferase from developing safflower cotyledons. Biochim. Biophys. Acta 1985, 833, 438–448. [Google Scholar] [CrossRef]
  55. Dahlqvist, A.; Ståhl, U.; Lenman, M.; Banas, A.; Lee, M.; Sandager, L.; Ronne, H.; Stymne, S. Phospholipid: Diacylglycerol acyltransferase: An enzyme that catalyzes the acyl-CoA-independent formation of triacylglycerol in yeast and plants. Proc. Natl. Acad. Sci. USA 2000, 97, 6487–6492. [Google Scholar] [CrossRef] [PubMed]
  56. Marmon, S.K.; Sturtevant, D.; Herrfurth, C.; Chapman, K.D.; Stymne, S.; Feussner, I. Two acyltransferases contribute differently to linolenic acid levels in seed oil. Plant Physiol. 2017, 173, 2081–2095. [Google Scholar] [CrossRef] [PubMed]
  57. Xu, J.; Carlsson, A.S.; Francis, T.; Zhang, M.; Hoffman, T.; Giblin, M.E.; Taylor, D.C. Triacylglycerol synthesis by PDAT1 in the absence of DGAT1 activity is dependent on re-acylation of LPC by LPCAT2. BMC Plant. Biol. 2012, 12, 4. [Google Scholar] [CrossRef]
  58. Ståhl, U.; Carlsson, A.S.; Lenman, M.; Dahlqvist, A.; Huang, B.; Banaś, W.; Banaś, A.; Stymne, S. Cloning and functional characterization of a phospholipid: Diacylglycerol acyltransferase from Arabidopsis. Plant Physiol. 2004, 135, 1324–1335. [Google Scholar] [CrossRef]
  59. Katavic, V.; Reed, D.W.; Taylor, D.C.; Giblin, E.M.; Barton, D.L.; Zou, J.; Mackenzie, S.L.; Covello, P.S.; Kunst, L. Alteration of seed fatty acid composition by an ethyl methanesulfonate-induced mutation in Arabidopsis thaliana affecting diacylglycerol acyltransferase activity. Plant Physiol. 1995, 108, 399–409. [Google Scholar] [CrossRef]
  60. Pan, X.; Siloto, R.M.; Wickramarathna, A.D.; Mietkiewska, E.; Weselake, R.J. Identification of a pair of phospholipid: Diacylglycerol acyltransferases from developing flax (Linum usitatissimum L.) seed catalyzing the selective production of trilinolenin. J. Biol. Chem. 2013, 288, 24173–24188. [Google Scholar] [CrossRef]
  61. Yuan, L.; Mao, X.; Zhao, K.; Ji, X.; Ji, C.; Xue, J.; Li, R. Characterisation of phospholipid: Diacylglycerol acyltransferases (PDATs) from Camelina sativa and their roles in stress responses. Biol. Open 2017, 6, 1024–1034. [Google Scholar] [CrossRef]
  62. Bhunia, R.K.; Chakraborty, A.; Kaur, R.; Maiti, M.K.; Sen, S.K. Enhancement of α-linolenic acid content in transgenic tobacco seeds by targeting a plastidial ω-3 fatty acid desaturase (fad7) gene of Sesamum indicum to ER. Plant Cell Rep. 2016, 35, 213–226. [Google Scholar] [CrossRef]
  63. Murphy, D.J. Production of novel oils in plants. Curr. Opin. Biotechnol. 1999, 10, 175–180. [Google Scholar] [CrossRef]
  64. Tao, F.; Zhu, S.W.; Fan, J.; Cheng, B.J. Cloning and sequence analysis of maize FAD2 gene. J. Plant Physiol. Mol. Biol. 2006, 32, 649–656. [Google Scholar]
  65. Zhang, D.; Pirtle, I.L.; Park, S.J.; Nampaisansuk, M.; Neogi, P.; Wanjie, S.W.; Pirtle, R.M.; Chapman, K.D. Identification and expression of a new delta-12 fatty acid desaturase (FAD2-4) gene in upland cotton and its functional expression in yeast and Arabidopsis thaliana plants. Plant Physiol. Biochem. 2009, 47, 462–471. [Google Scholar] [CrossRef] [PubMed]
  66. Xue, Y.; Chen, B.; Win, A.N.; Fu, C.; Lian, J.; Liu, X.; Wang, R.; Zhang, X.; Chai, Y. Omega-3 fatty acid desaturase gene family from two ω-3 sources; Salvia hispanica and Perilla frutescens: Cloning; characterization and expression. PLoS ONE 2018, 13, e0191432. [Google Scholar] [CrossRef] [PubMed]
  67. Chen, Y.; Cui, Q.; Xu, Y.; Yang, S.; Gao, M.; Wang, Y. Effects of tung oilseed FAD2 and DGAT2 genes on unsaturated fatty acid accumulation in Rhodotorula glutinis and Arabidopsis thaliana. Mol. Genet. Genom. 2015, 290, 1605–1613. [Google Scholar] [CrossRef] [PubMed]
  68. Sun, R.; Gao, L.; Yu, X.; Zheng, Y.; Li, D.; Wang, X. Identification of a Δ12 fatty acid desaturase from oil palm (Elaeis guineensis Jacq.) involved in the biosynthesis of linoleic acid by heterologous expression in Saccharomyces cerevisiae. Gene 2016, 591, 21–26. [Google Scholar] [CrossRef] [PubMed]
  69. Grabherr, M.G.; Haas, B.J.; Yassour, M.; Levin, J.Z.; Thompson, D.A.; Amit, I.; Adiconis, X.; Fan, L.; Raychowdhury, R.; Zeng, Q.; et al. Full-length transcriptome assembly from RNA-Seq data without a reference genome. Nat. Biotechnol. 2011, 29, 644. [Google Scholar] [CrossRef]
  70. Rajkumar, A.P.; Qvist, P.; Lazarus, R.; Lescai, F.; Ju, J.; Nyegaard, M.; Mors, O.; Børglum, A.D.; Li, Q.; Christensen, J.H. Experimental validation of methods for differential gene expression analysis and sample pooling in RNA-seq. BMC Genom. 2015, 16, 548. [Google Scholar] [CrossRef]
  71. Audic, S.; Claverie, J.M. The significance of digital gene expression profiles. Genome Res. 1997, 7, 986–995. [Google Scholar] [CrossRef]
  72. Conesa, A.; Götz, S.; García-Gómez, J.M.; Terol, J.; Talón, M.; Robles, M. Blast2GO: A universal tool for annotation; visualization and analysis in functional genomics research. Bioinformatics 2005, 21, 3674–3676. [Google Scholar] [CrossRef] [PubMed]
  73. Ye, J.; Fang, L.; Zheng, H.; Zhang, Y.; Chen, J.; Zhang, Z.; Wang, J.; Li, S.; Li, R.; Bolund, L.; et al. WEGO: A web tool for plotting GO annotations. Nucleic Acids Res. 2006, 34, W293–W297. [Google Scholar] [CrossRef] [PubMed]
  74. Mao, X.; Cai, T.; Olyarchuk, J.G.; Wei, L. Automated genome annotation and pathway identification using the KEGG Orthology (KO) as a controlled vocabulary. Bioinformatics 2005, 21, 3787–3793. [Google Scholar] [CrossRef] [PubMed] [Green Version]
  75. Livak, K.J.; Schmittgen, T.D. Analysis of relative gene expression data using real-time quantitative PCR and the 2−ΔΔCT method. Methods 2001, 25, 402–408. [Google Scholar] [CrossRef] [PubMed]
  76. Kelley, L.A.; Sternberg, M.J. Protein structure prediction on the Web: A case study using the Phyre server. Nat. Protoc. 2009, 4, 363. [Google Scholar] [CrossRef] [PubMed]
  77. Tamura, K.; Peterson, D.; Peterson, N.; Stecher, G.; Nei, M.; Kumar, S. MEGA5: Molecular evolutionary genetics analysis using maximum likelihood; evolutionary distance; and maximum parsimony methods. Mol. Biol. Evol. 2011, 28, 2731–2739. [Google Scholar] [CrossRef]
  78. Clough, S.J.; Bent, A.F. Floral dip: A simplified method for Agrobacterium-mediated transformation of Arabidopsis thaliana. Plant J. 1998, 16, 735–743. [Google Scholar] [CrossRef]
  79. Zhang, Q.Y.; Yu, R.; Sun, D.Y.; Bai, Z.Z.; Li, H.; Xue, L.; Zhang, Y.L.; Niu, L. PrLPAAT4, a putative lysophosphatidic acid acyltransferase from Paeonia rockii, plays an important role in seed fatty acid biosynthesis. Molecules 2017, 22, 1694. [Google Scholar] [CrossRef]
Figure 1. Phenotypic variation between the two tree peony species. (A) The flower, fruit and developing seeds of P. rockii and (B) P. lutea; (C) seed variation analysis. Different small letters indicate significant differences between the species at the same time point at p < 0.05 level, as determined by the least significant differences test. Different capital letters indicate significant differences among different time points for the same species.
Ijms 20 00065 g001
Figure 2. Transcriptome analyses of developing seeds of P. lutea and P. rockii. Total transcript levels for unigenes representing the (A) top seven lipid pathways (Table S2), (B) fatty acid synthesis in the plastid and (C) triacylglycerol assembly in the endoplasmic reticulum (ER; Table S4). RPKM: reads per kilobase per million. The asterisks indicate significant differences (* p < 0.05, Student’s t-test). Different small letters indicate significant differences between the species at the same time point at p < 0.05 level, as determined by the least significant differences test. Different capital letters indicate significant differences among different time points for the same species.
Ijms 20 00065 g002
Figure 3. Differential lipid gene expression in plastid between the two species. (A) Schematic outline of the genes encoding for fatty acid biosynthesis in plastid and (B) their total RPKM during 60 to 80 days of developing seeds. For gene abbreviations see Table S4. Genes represented in red letters indicate significant difference in their expression levels between the two species, with a ratio of P. rockii to P. lutea ≥1.5, and genes represented in green letters indicate the P. rockii is significantly lower than P. lutea in their expression levels. RPKM: reads per kilobase per million. The asterisks indicate significant differences (* p < 0.05, Student’s t-test).
Ijms 20 00065 g003
Figure 4. Differential lipid gene expression in endoplasmic reticulum (ER) between the two species. (A) Schematic outline of genes encoding for triacylglycerol assembly in ER and their (B) transcript levels in matured seeds (80 days). For gene abbreviations see Table S4. Genes represented in red letters indicate significant difference in their expression levels between the two species, with a ratio of P. rockii to P. lutea ≥1.5; and genes represented in green letters indicate the P. rockii is significantly lower than P. lutea in their expression levels. RPKM: reads per kilobase per million. The asterisks indicate significant differences (* p < 0.05, Student’s t-test).
Ijms 20 00065 g004
Figure 5. Comparison of expression pattern for select genes upregulated in P. rockii with P. lutea in (A) plastid and (B) endoplasmic reticulum.
Ijms 20 00065 g005
Figure 6. Validation of expression pattern for desaturases by qPCR. For gene abbreviations see Table S4. Different small letters indicate significant differences between the species at the same time point at p < 0.05 level, as determined by the least significant differences test. Different capital letters indicate significant differences among different time points for the same species.
Ijms 20 00065 g006
Figure 7. Identification, characterization, and expression analysis of PrFAD2 in P. rockii. (A) Nucleotide and deduced amino acid sequence of PrFAD2. Solid lines indicate the conserved 1-acyl-sn-glycerol-3-phosphate acyltransferase-related domain. Prediction of the (B) transmembrane domains and (C) tertiary structure of PrFAD2 protein. (D) Phylogenetic comparison of the FAD2 proteins in plants (refer to Table S6 for complete names of the plant species). (E) Tissue-specific expression of PrFAD2. (F) PrFAD2 expression during P. rockii seed development. S1 to S10 indicate ten time points from 0 to 100 days at 10 days intervals. 18S–26S ITS was used as an internal control.
Ijms 20 00065 g007
Figure 8. Identification, characterization, and expression analysis of PrFAD3 in P. rockii. (A) Nucleotide and deduced amino acid sequence of PrFAD3. Solid lines indicate the conserved 1-acyl-sn-glycerol-3-phosphate acyltransferase-related domain. Prediction of the (B) transmembrane domains and (C) tertiary structure of PrFAD3 protein. (D) Phylogenetic comparison of the FAD3 proteins in plants (refer to Table S6 for complete names of the plant species). (E) Tissue-specific expression of PrFAD3. (F) PrFAD3 expression during P. rockii seed development. S1 to S10 indicate ten time points from 0 to 100 days at 10 days intervals. 18S–26S ITS was used as an internal control.
Ijms 20 00065 g008
Figure 9. Overexpression of PrFAD2 and PrFAD3 in the wild-type Arabidopsis seeds. (A) Semi-quantitative RT-PCR and ALA/LA ratio, and (B) FA composition analyses of 14 days wildtype and 35S::PrFAD2 (#17, #51 and #58) seeds. (C) Semi-quantitative RT-PCR and ALA/LA ratio, and (D) FA composition analyses of 14 days wildtype and 35S::PrFAD3 (#10, #14, and #26) seeds. AtActin7 was used as an endogenous control for semi-quantitative RT-PCR. The asterisks indicate significant differences (** p < 0.01; Student’s t-test). Different small letters indicate significant differences at p < 0.05 level.
Ijms 20 00065 g009
Figure 10. Schematic diagram of high α-linolenic acid (ALA) production. Genes represented in red letters indicate significant difference in expression levels between the two species, with a ratio of P. rockii to P. lutea ≥ 1.5; and genes represented in green letters indicate the P. rockii is significantly lower than P. lutea in expression levels. For abbreviations see Table S4.
Ijms 20 00065 g010

