Dioxin and Related Compound Detection: Perspectives for Optical Monitoring
by
 , and
, and
Barbara Patrizi
1,2 ,
,
Mario Siciliani de Cumis
1,3,*, 
Silvia Viciani
1,2 and
Francesco D’Amato
1,2 1
National Institute of Optics-National Research Council (INO-CNR), Via Madonna del Piano, 10, 50019 Sesto Fiorentino, Italy
2
European Laboratory for Non-Linear Spectroscopy (LENS), Via Nello Carrara n. 1, 50019 Sesto Fiorentino, Italy
3
Italian Space Agency, Contrada Terlecchia snc, 75100 Matera, Italy
*
Author to whom correspondence should be addressed.
Int. J. Mol. Sci. 2019, 20(11), 2671; https://doi.org/10.3390/ijms20112671
Submission received: 20 April 2019
/
Revised: 28 May 2019
/
Accepted: 28 May 2019
/
Published: 30 May 2019
(This article belongs to the Special Issue Novel Aspects of Toxicity Mechanisms of Dioxins and Related Compounds)
Abstract
:Dioxins and related compounds are environmental xenobiotics that are dangerous to human life, due to the accumulation and persistence in the environment and in the food chain. Cancer, reproductive and developmental issues, and damage to the immune system and endocrine system are only a few examples of the impact of such substances in everyday life. For these reasons, it is fundamental to detect and monitor these molecules in biological samples. The consolidated technique for analytical evaluation is gas chromatography combined with high-resolution mass spectrometry. Nowadays, the development of mid-infrared optical components like broadband laser sources, optical frequency combs, high performance Fourier-transform infrared spectroscopy, and plasmonic sensors open the way to new techniques for detection and real time monitoring of these organic pollutants in gaseous or liquid phase, with sufficient sensitivity and selectivity, and in short time periods. In this review, we report the latest techniques for the detection of dioxins, furans and related compounds based on optical and spectroscopic methods, looking at future perspectives.
1. Introduction
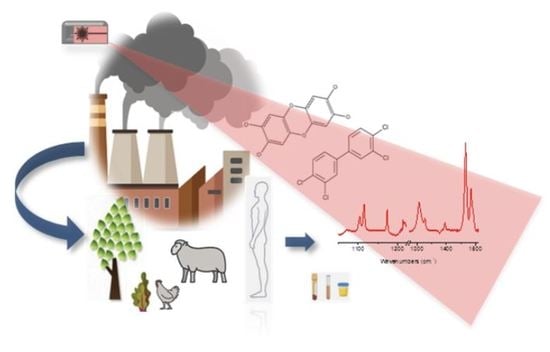
Dioxins are among the most toxic and persistent organic pollutants (POPs). They are principally released into the atmosphere as undesired products of various combustion and industrial processes [1] such as incineration of municipal and medical solid waste, backyard waste burning, paper and wood pulp chlorine bleaching, coal fired power plants, and also from natural processes like forest fires. Furthermore, these pollutants also occur as contaminants in several pesticides, herbicides, and fungicides [2].
When accidently released in the various environmental matrices, like soil and water, dioxins accumulate in plants and animal tissues, until they reach human tissues where accumulate at higher and higher concentrations, mainly in the fatty tissues, through food chain biomagnifications processes.
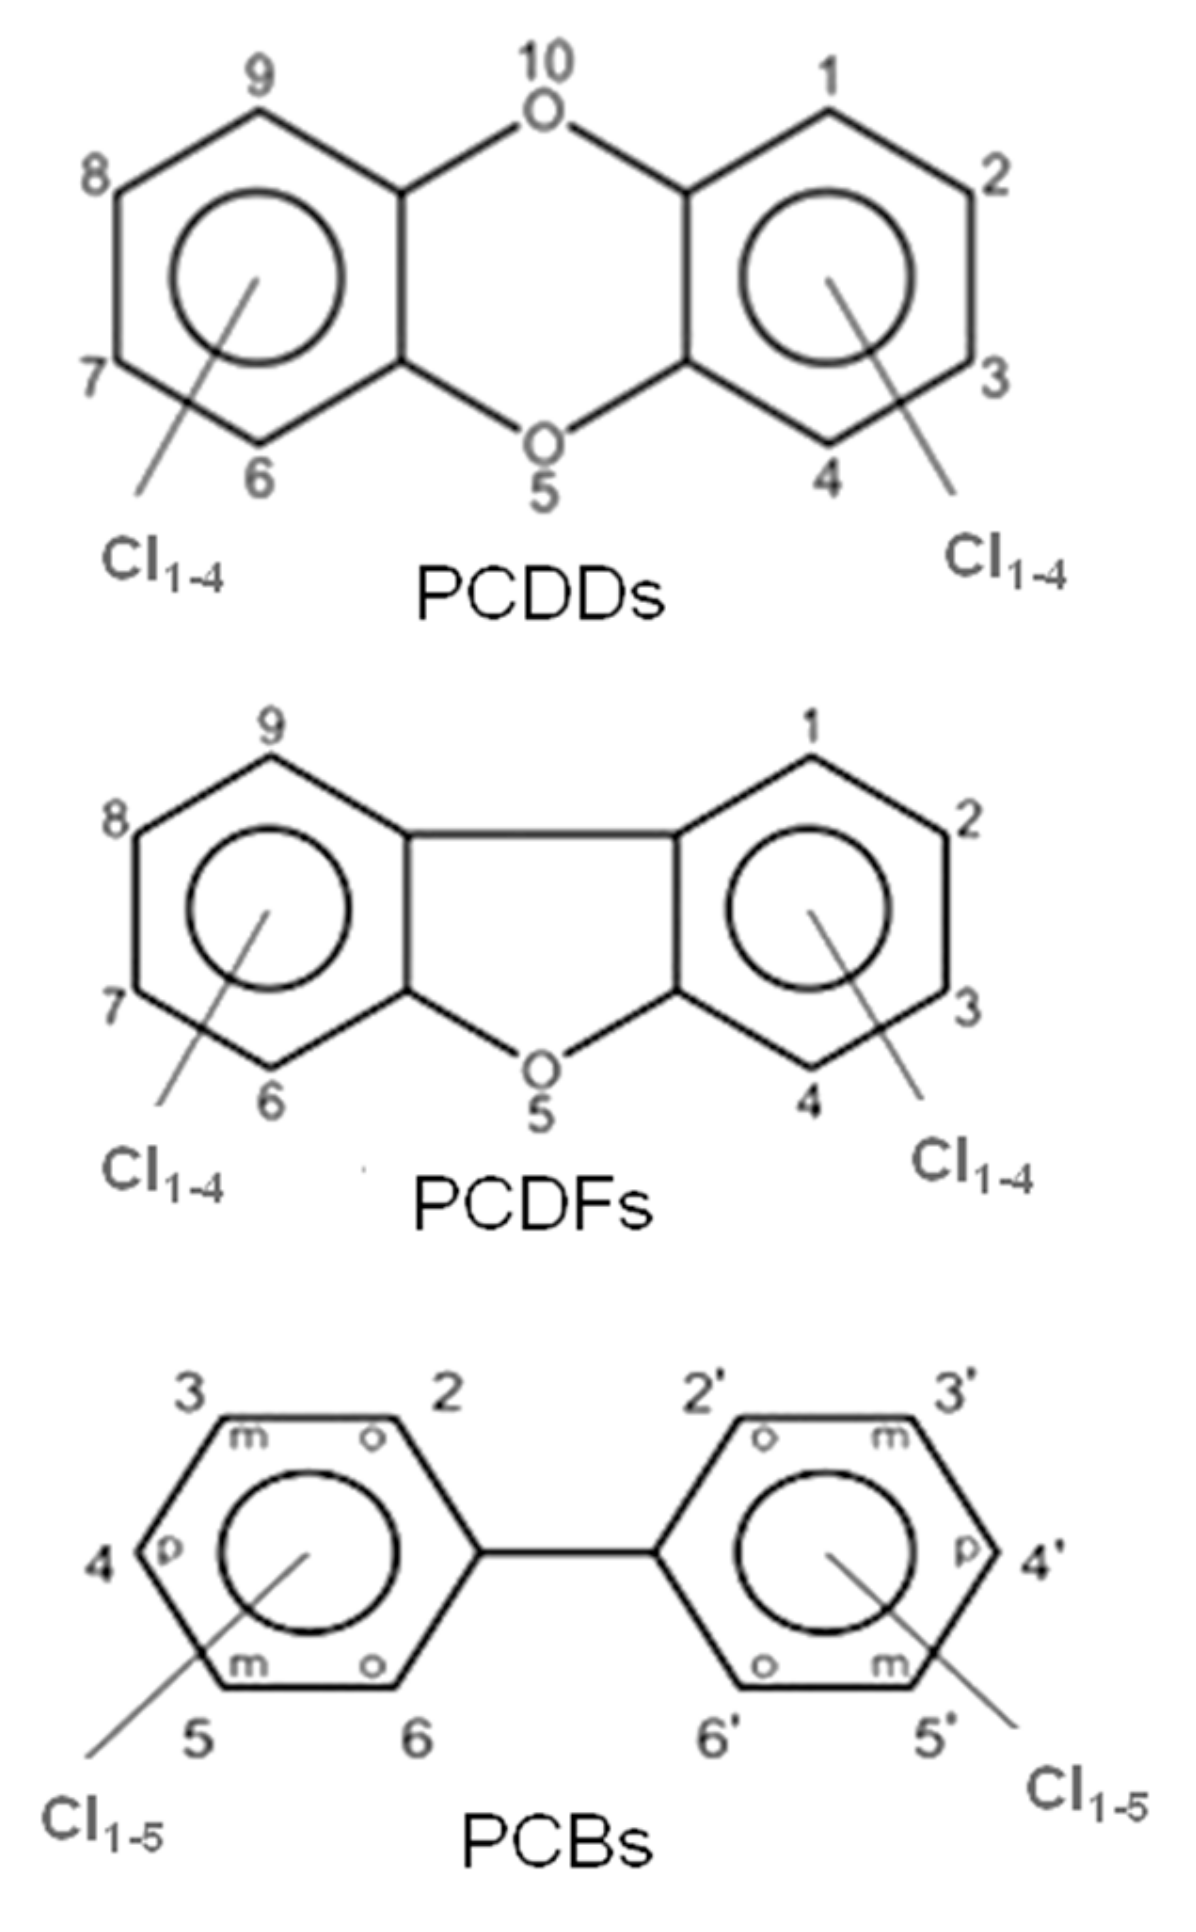
These halogenated organic POPs mainly belong to three families of molecules, i.e., polychlorinated dibenzo-p-dioxins (PCDDs), polychlorinated dibenzofurans (PCDFs) and polychlorinated biphenyls (PCBs); their molecular structures are presented in Figure 1.
All these compounds together with Polychlorinated Diphenyl Ethers (PCDEs) belong to the main family of Polyhalogenated Aromatic Compounds (PHAs). PCBs and PCDEs are industrial compounds or by-products, mainly present as impurities in chlorophenol preparations. These two classes of POPs have been detected in the environment and especially in chemical-waste dumpsites. PCBs, in particular, are synthetic PHAs used as industrial reagents in the past. Because they persist for long times in both the environmental matrices and in tissues of living organisms, their production and utilization were discontinued.
PCDDs and PCDFs have two benzene rings connected by one (furans) or two (dioxins) oxygen atoms. The two benzene rings can bind from one to eight chlorine atoms, generating a wide family of congeners (75 PCDD congeners and 135 PCDF congeners) whose molecular reactivity toward cellular targets can change dramatically, determining different levels of toxicity. Within these 210 congeners, the 2,3,7,8-tetrachlorinated dibenzo dioxins (TCDD) species have been classified as the most toxic. Toxicity drastically decreases when non-lateral chlorines are present or when lateral chlorines are removed from the two aromatic rings [3]. Laterally chlorinated dioxins and especially TCDD show the highest affinity toward the AhR (Aryl hydrocarbon Receptor) receptor, a signal transducer protein which is responsible of the biological effects cascade following the xenobiotic–receptor interaction [4,5,6]. There are seven laterally chlorinated PCDDs and ten laterally chlorinated PCDFs. The toxicity equivalent factor (TEF) [7] expresses the toxicity of dioxins, furans and PCBs in terms of the most toxic congeners, i.e., the 2,3,7,8-TCDD and 1,2,3,7,8-pentachlorodibenzo-p-dioxin, whose TEF value has been set to 1. It must be taken into account that dioxins are extremely toxic molecules; indeed, they can cause cancer, reproductive and developmental aberrations, immune system damages, and can deeply interfere with the endocrine system [8,9,10,11].
In this regard, it is important to emphasize that the half-life of TCDD in humans is very long; it has been estimated to be in the range between 7.1 [12] and 11.3 years [13].
Similar to dioxins and furans, the number of chlorine atoms (from 1 to 10) and their positions in PCBs give rise to 209 congeners (see Figure 1).
In particular, ortho-PCBs are characterized by two chlorine atoms in ortho positions, while mono-ortho-PCBs (i.e., PCBs 105, 114, 118, 123, 156, 157, 167, and 189) are characterized by one chlorine atom in ortho position. On the other hand, in non-ortho-PCBs (i.e., PCBs 77, 81, 126, and 169) non-ortho positions are occupied by chlorine atoms. Both non-ortho and mono-ortho PCBs have coplanar structures that make them more toxic since they bind with higher affinity the AhR receptor. For this reason non-ortho and mono-ortho PCBs have been classified with different values of TEF [14], likewise dioxins and furans.
In particular, PCB 77 (3,3′4,4′ tetrachlorobiphenyl) is able, like TCDD, to bind strongly to the AhR receptor leading to the activation of the expression of genes involved in polycyclic aromatic hydrocarbon metabolism and detoxification [6,15]. Prolonged exposure to PCBs leads to immune system suppression increasing the risk of diseases developing. Both non-ortho and mono-ortho PCBs congeners are cancer promoters and enhance the effects of other carcinogens. PCBs are endocrine disruptors, altering thyroid and reproductive function in males and females. These endocrine alterations increase the risk of developing of other cardiovascular diseases and diabetes [16].
Due to their high toxicity and environmental persistence, many efforts for real-time monitoring of these organic pollutants from the principal emission sources have been recently realized [17,18,19,20,21]. Unfortunately, the objective of constant monitoring of the potential sources of emission and the possibility of recognizing each single congener in a complex mixture have not yet been fulfilled.
Moreover, it is also very important to detect dioxins and related compounds in environmental matrices such as soil, water, air and so on. PHAs are ubiquitous in the environment, they have been found in aqueous (mainly surface water, plant oils and petroleum products), air and solid samples such as sediments, soils and wastewater sludge. In this regard, very often it is of fundamental importance to isolate PHAs not only from environmental matrices, but also from biological tissues and fluids, by extraction and clean-up procedures. The clean-up step allows eliminating the matrix effects and pre-concentrates the analytes for instrumental quantitative detection. In the last years several techniques were developed and implemented for environmental samples clean-up, employing different kind of adsorbents materials such as silica gel and alumina, mesoporous organic silica, mesoporous silica nanoparticles, different nanoparticles and nanotubes functionalized at their surface, and molecularly imprinted polymers for more efficient adsorption capacity [22,23].
Then, the analytes must be extracted by using a suitable solvent, in order to proceed with the appropriate instrumental detection.
In the last years, several instrumental automated extraction techniques for rapid sample processing have been developed. Some of these techniques are supercritical fluid extraction (SFE), microwave-assisted extraction (MAE), pressurized liquid extraction [24], and solid-phase extraction (SPE) [25,26,27].
Due to their high resolution, high sensitivity and selectivity liquid and gas chromatographies (LC and GC) are the most commonly employed analytical methods for the qualitative and quantitative determination of POPs in environmental and biological samples. In particular, High Performance Liquid Chromatography (HPLC) coupled with UV/fluorescence detection, and Gas Chromatography coupled to Mass Spectrometry (GC/MS) has shown to be the best technique amongst others. GC/MS is a reference analytical method because provides the advantages of congener identification using both retention time and mass spectrum [28,29,30]. Furthermore, GC/MS provides the required high sensitivity for quantification in the Selected Ion Monitoring (SIM) mode.
Even thought Liquid Chromatography coupled to Mass Spectrometry (LC/MS) offers similar advantages, it does not supply a specific interface appropriate for the separation of all the PHAs at the same time [28,31].
The possibility to use new generation materials for the separation and clean-up and to automate instrumental extraction of pollutants from environmental and biologic samples will allow new optical detection methods to become more selective and sensitive and to achieve real time and fast monitoring of chlorinated organic compounds.
2. Optical Monitoring of Dioxins and Related Compounds, a Screening of Old and New Mid-IR Light Sources and Techniques
Optical monitoring offers many advantages with respect to the cited techniques like chromatography or high-resolution mass spectrometry in terms of costs, destructive sampling and fast detection. Optical techniques can be divided into two main classes: (1) those which employ wide wavelength range sources and (2) those which use narrow wavelength range sources. Let us discuss them separately.
2.1. Wide Wavelength Range Sources
The use of Mid-IR radiation to detect PCDD/Fs and related compounds allows discriminating between congeners, since their own fingerprints in this spectral region characterize these molecules.
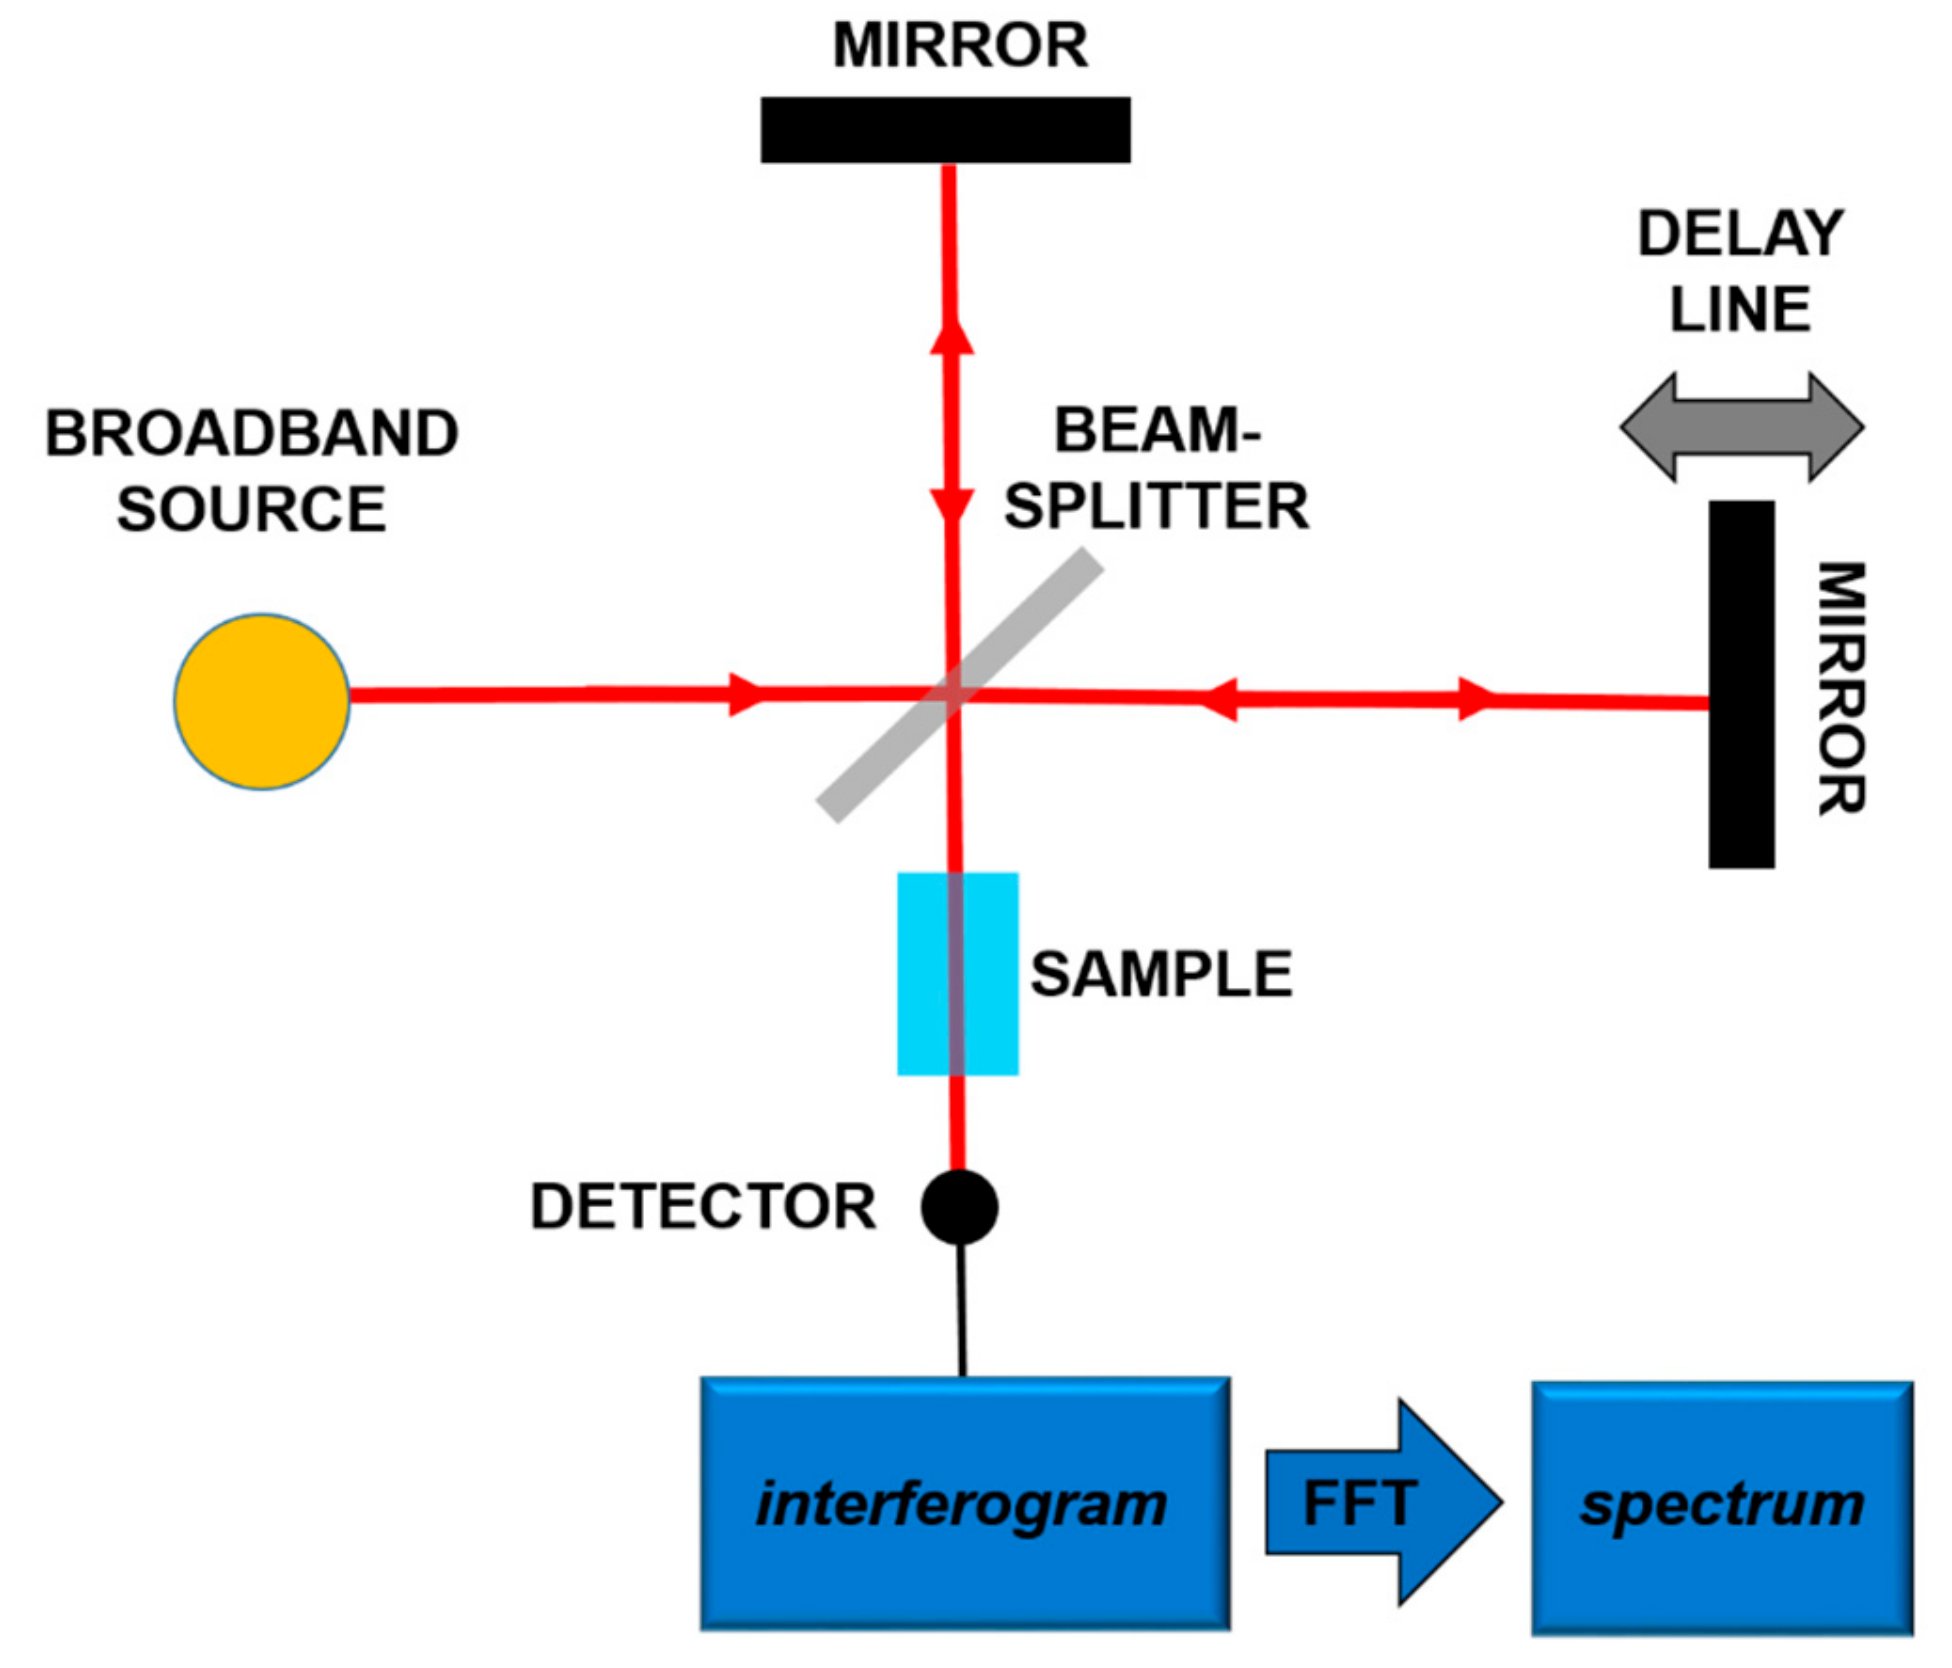
The most frequent use of the absorption spectroscopy in Mid-IR lies in the identification of substances through their characteristic molecular vibrations. Furans and dioxins, and in general, molecules with a similar structure, are not in gaseous phase at room temperature, and high temperatures (more than 550 °C) are needed to perform gaseous spectroscopy. However, in order to work at room temperature, it is possible to carry out spectroscopy in liquid phase, dissolving the target molecules in a Mid-IR transparent solution [18,19]. In both gaseous and liquid spectroscopy, the detected absorption peaks are tens of cm−1 wide. In order to detect these bands, techniques and components spanning a wide frequency range are needed. In this framework, a consolidated technique is Fourier-Transform Infrared Spectroscopy (FT-IR) [32]. In this scheme, sketched in Figure 2, using a broadband source, typically a lamp, an interferometric pattern is recorded from the light interacting with the sample. By using the Fourier Transform approach, it is possible to reconstruct the absorption spectrum of the substance under analysis.
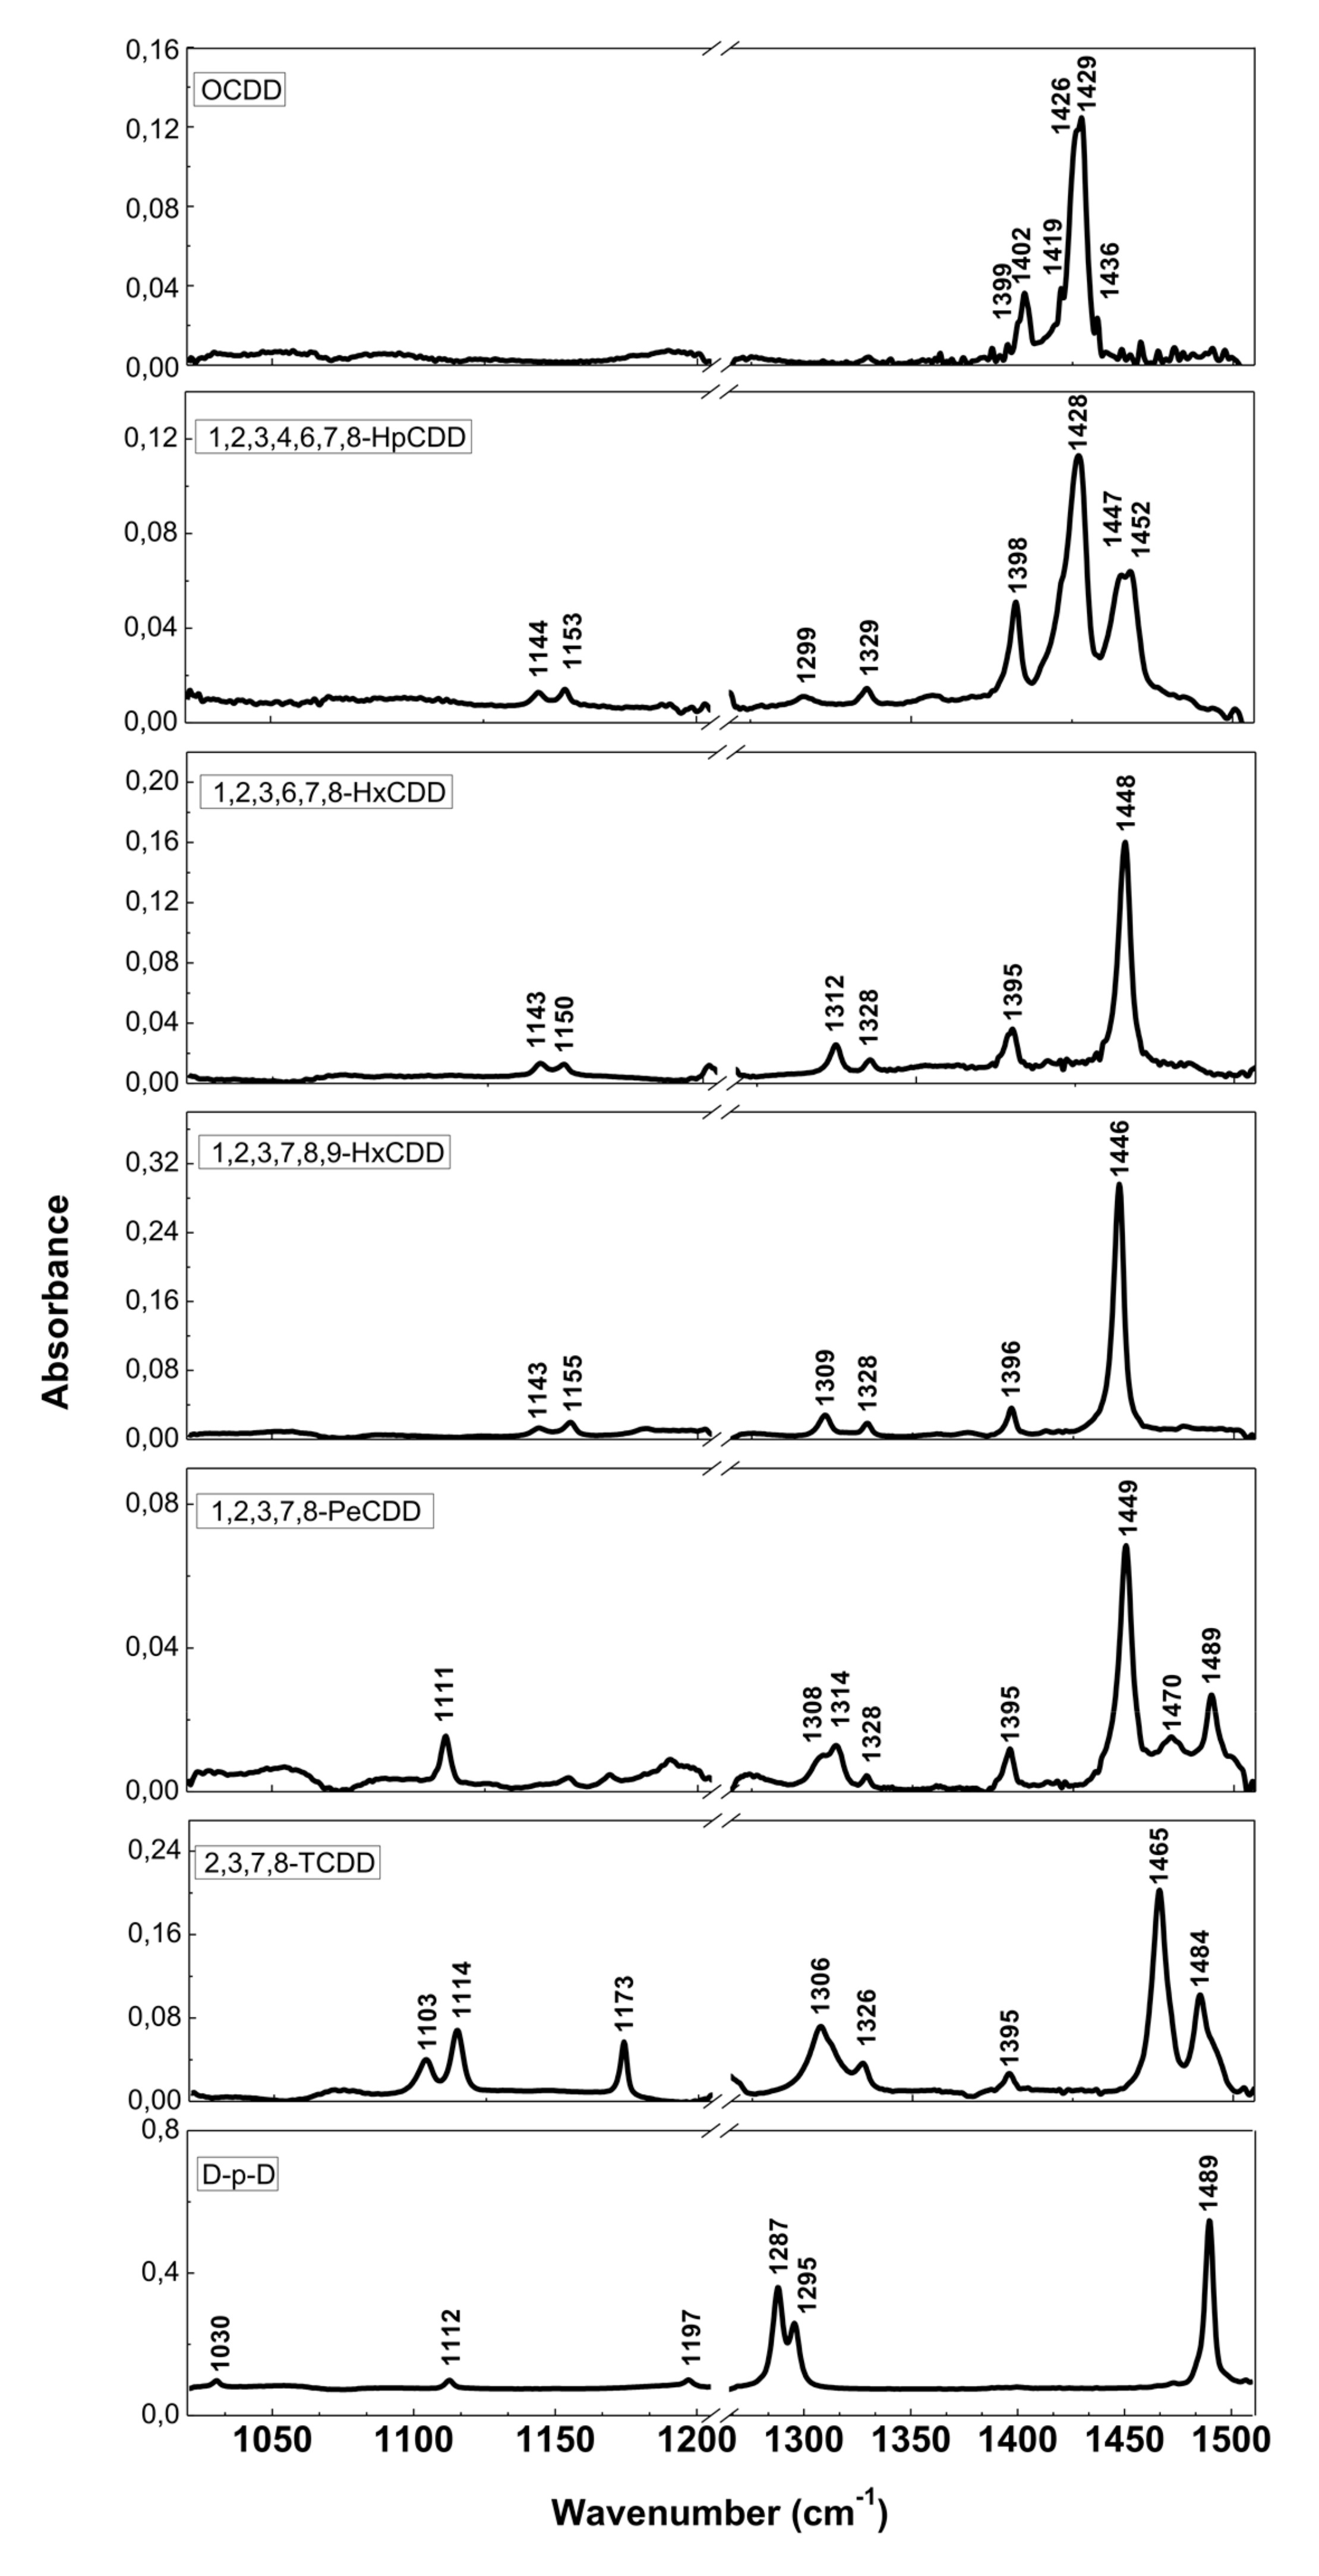
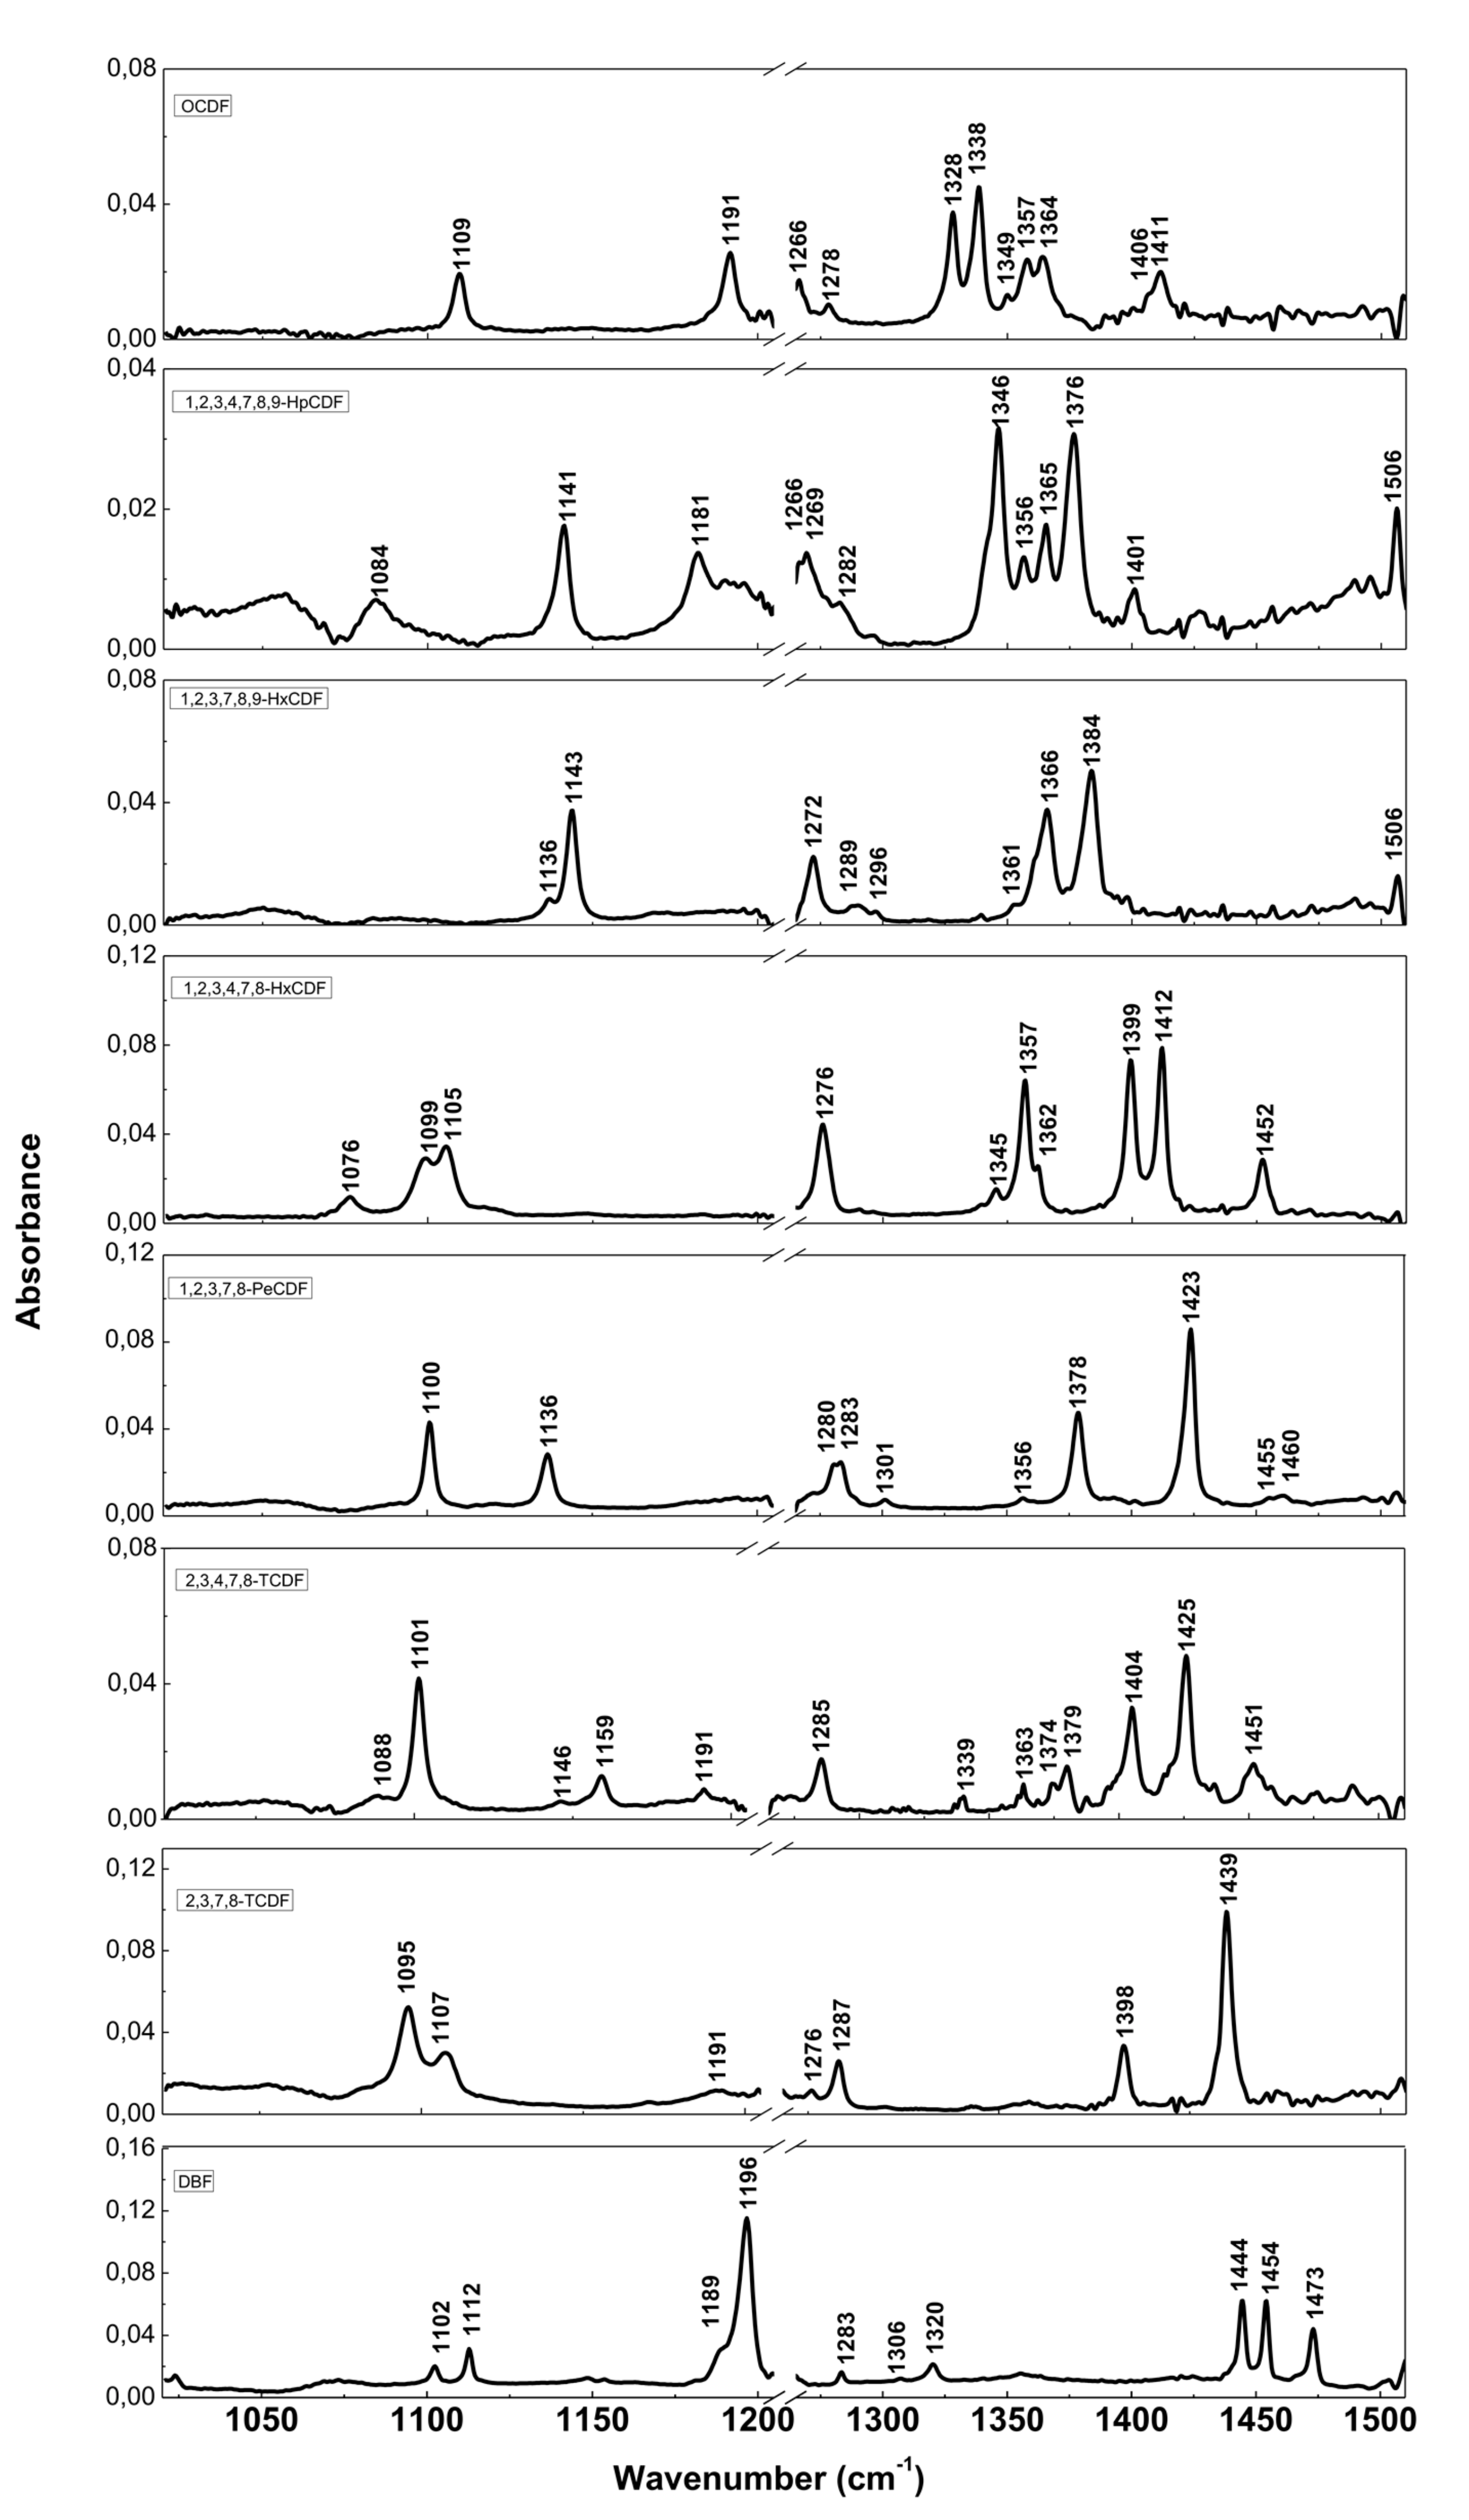
The resolution of commercial instruments is better than 1 cm−1. This technique has been used for measuring dioxins, furans and related chlorinated organic molecules. In Figure 3 and Figure 4, we report the infrared spectra of 13 of the 17 most toxic congeners of dioxins dissolved in carbon tetrachloride (CCl4) [19]. In Table 1 and Table 2, the characteristic vibrational frequencies of PCDDs and PCDFs, obtained by FT-IR in condensed phase [19] and other techniques, i.e., the GC/MI/FT-IR [33] and Vapor-Phase FT-IR [34], are presented and compared. In Table 1 and Table 2, each frequency range is characterized by different IR active modes that represent the fingerprints of each single PCDD/Fs congener.
These vibrational frequencies are influenced by chlorine substitution patterns and thus allow us to discriminate between different molecules and congeners, and also to analyze mixtures of these compounds [19].
Although this method is robust and consolidated, FT-IR performance is limited by the brilliance of the light source used.
In the last decades the development of powerful infrared sources like Interband Cascade Lasers (ICL), Quantum Cascade Laser (QCL), QCL combs, optical frequency combs, Non-Linear sources [35,36,37,38,39,40,41] paved the way for the improvement of the performances of classical techniques, or innovative detection scheme. In particular, these new sources could be very suitable for detecting complex organic molecules (as dioxins, furans, hydrocarbons, proteins) which present absorption spectra in the mid-infrared with absorption profiles width of ten or more wavenumbers. For simplicity, in the following, we refer to molecules with these characteristics as “complex molecules” [42].
Typically, narrow laser sources are used for spectroscopy of simple molecules in gas phase, like CO2, H2S, CO, HF with a large variety of experimental setups [43,44,45,46,47,48,49].
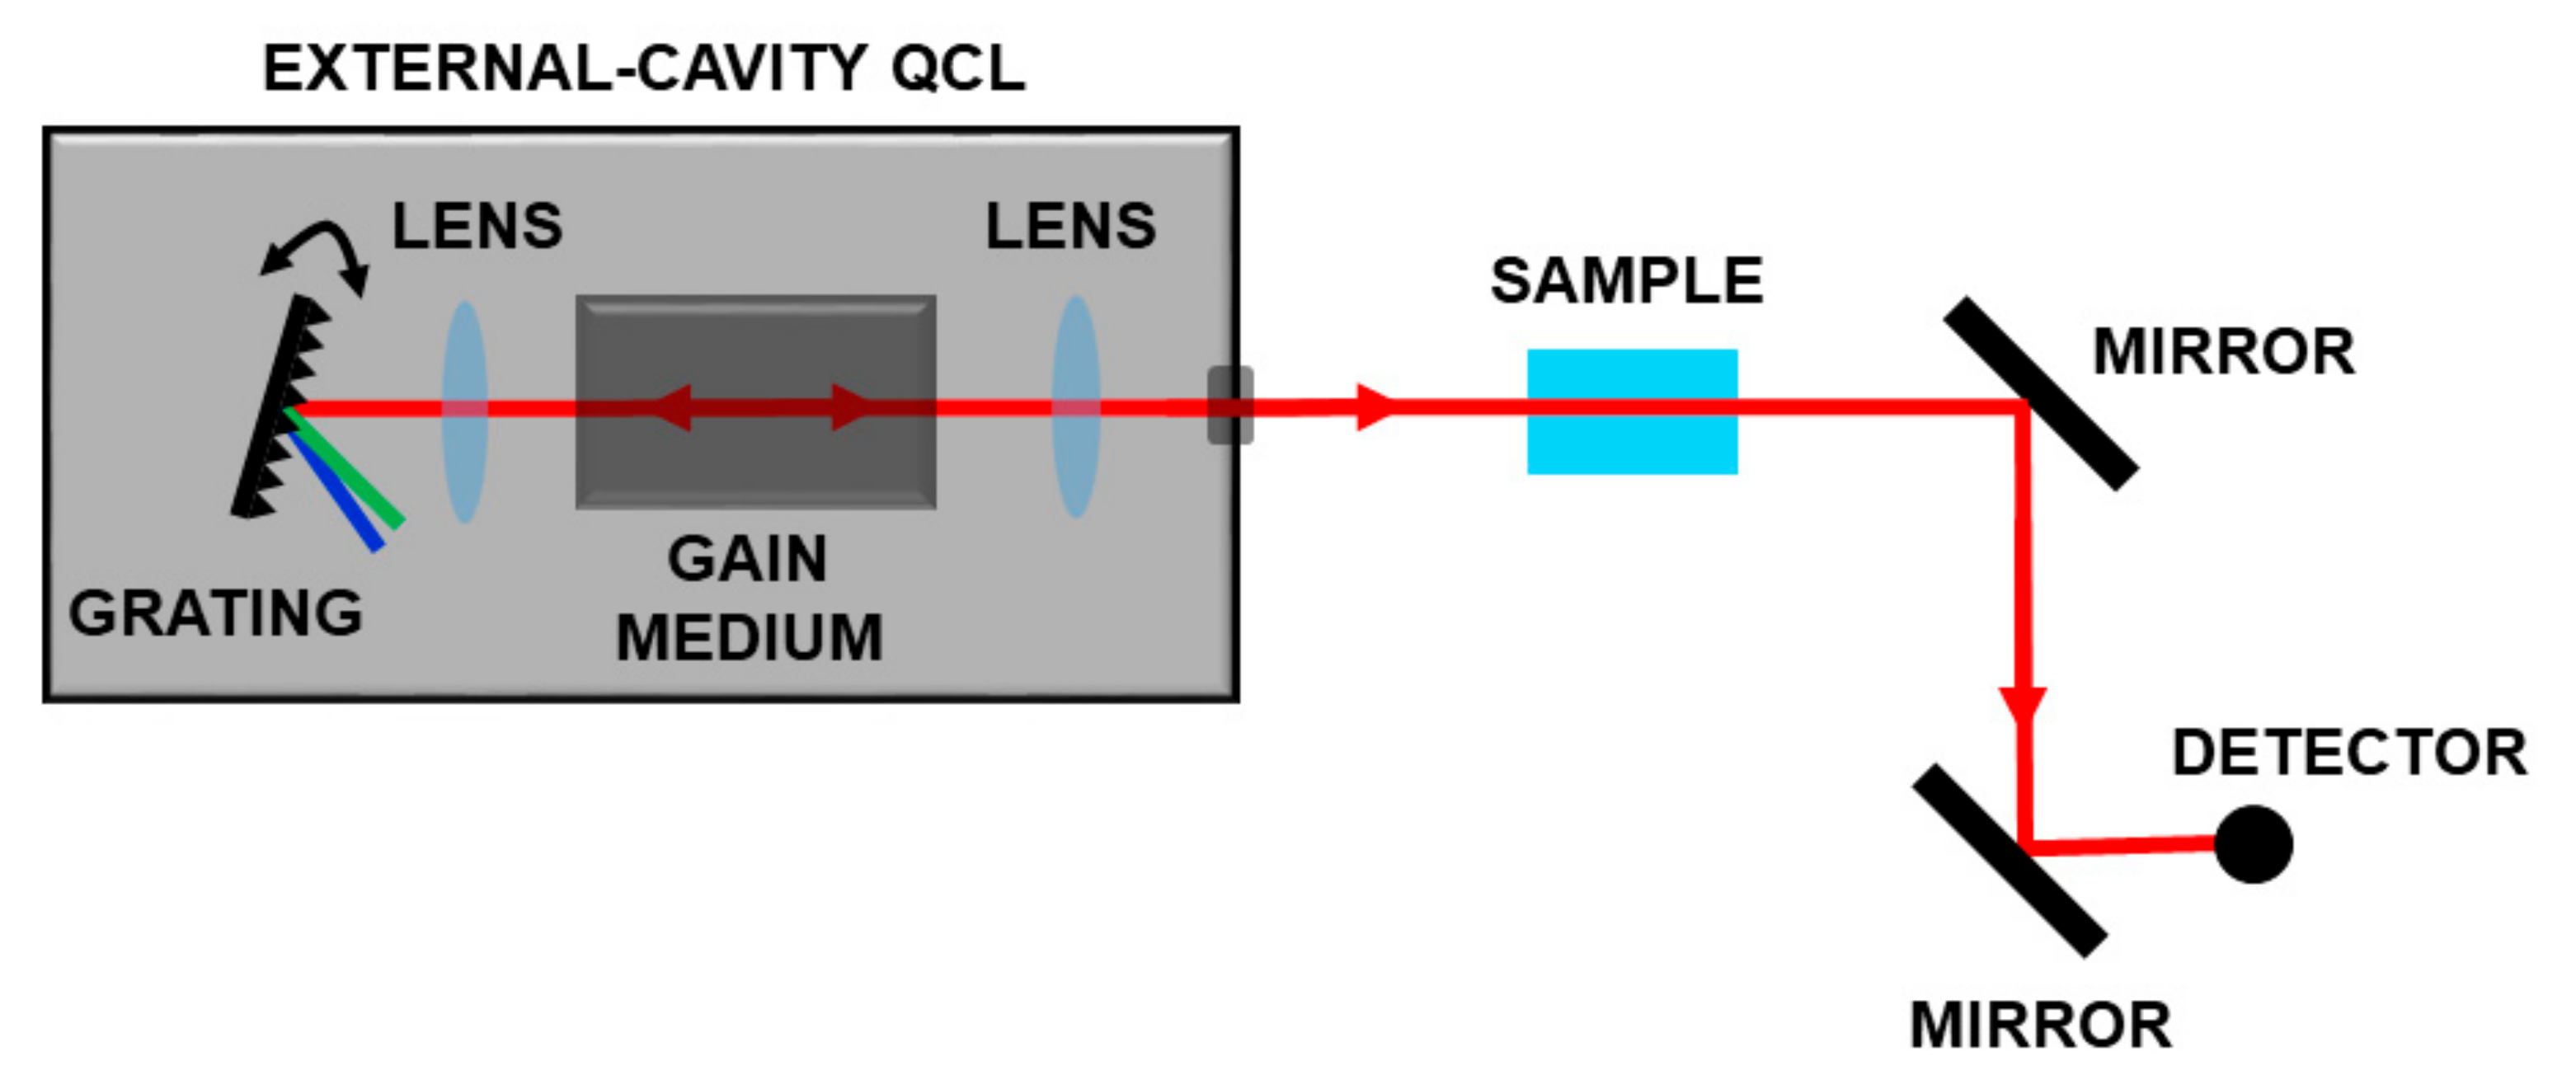
In the last ten years, the availability of broadband tunable QCLs in the range 4–12 µm enabled the development of optical schemes for measuring complex molecules. These sources, based on a moving external grating, which closes the laser cavity, allow wavelength selection and high gain for the active media on a very large frequency range as sketched in Figure 5.
The application of such schemes spans from health to security, from imaging to environmental monitoring [50,51,52,53,54,55].
Using a couple of broadly tunable external cavity QCLs (EC-QCLs), the detection of furans and dioxins dissolved in CCl4 was demonstrated [18] in the range 1205–1310 cm−1 and 1335–1590 cm−1. The measurement time spanned from few minutes to 15 minutes. Nowadays, the technological development of this kind of source allows the same measurement using only one laser frame equipped with 3 or 4 active media [56] with tuning performances up to 1000 cm−1, reaching speeds up to thousands cm−1/s in particular cases. This enables very fast measurements on very large frequency ranges, with frequency resolution strongly dependent on the acquisition system. Generally, a fast scan corresponds to low frequency resolution. When using such systems for liquid spectroscopy, the accuracy of measurements depends on many parameters, and above all on the sample itself. For example in the biomedical field, Lendl and co-workers successfully used EC-QCLs for detection of glucose and lactate in aqueous phase, showing the usability of such laser sources for in-vivo and in-vitro bio fluid solutions [51,57,58].
EC-QCLs have already been extensively used in biological and fundamental chemistry studies involving peptide, breath test, kinetics reactions and DNA research [59,60,61].
In addiction such lasers, due to their high optical power, could be used for infrared imaging with tens of different approaches: Chemical Imaging, Photo-thermal imaging, holography, microscopy, etc. [62,63,64,65,66].
However, EC-QCLs cannot be used when it is necessary to observe and resolve fine absorption structures, narrower than the laser line (which is typically at least tens of MHz), or when the scan rate is still too slow compared to the experimental time scale.
A different approach in broadband spectroscopy is provided by Optical Frequency Combs (OFCs) laser systems. Two main features of such lasers are the characteristic equally spaced comb spectrum and the very narrow linewidth. Indeed they are largely used for measuring absorptions of simple molecules in the visible and near infrared using different schemes: Comb assisted Spectroscopy, Direct Comb Spectroscopy, Dual Comb Spectroscopy [35,67,68,69,70,71].
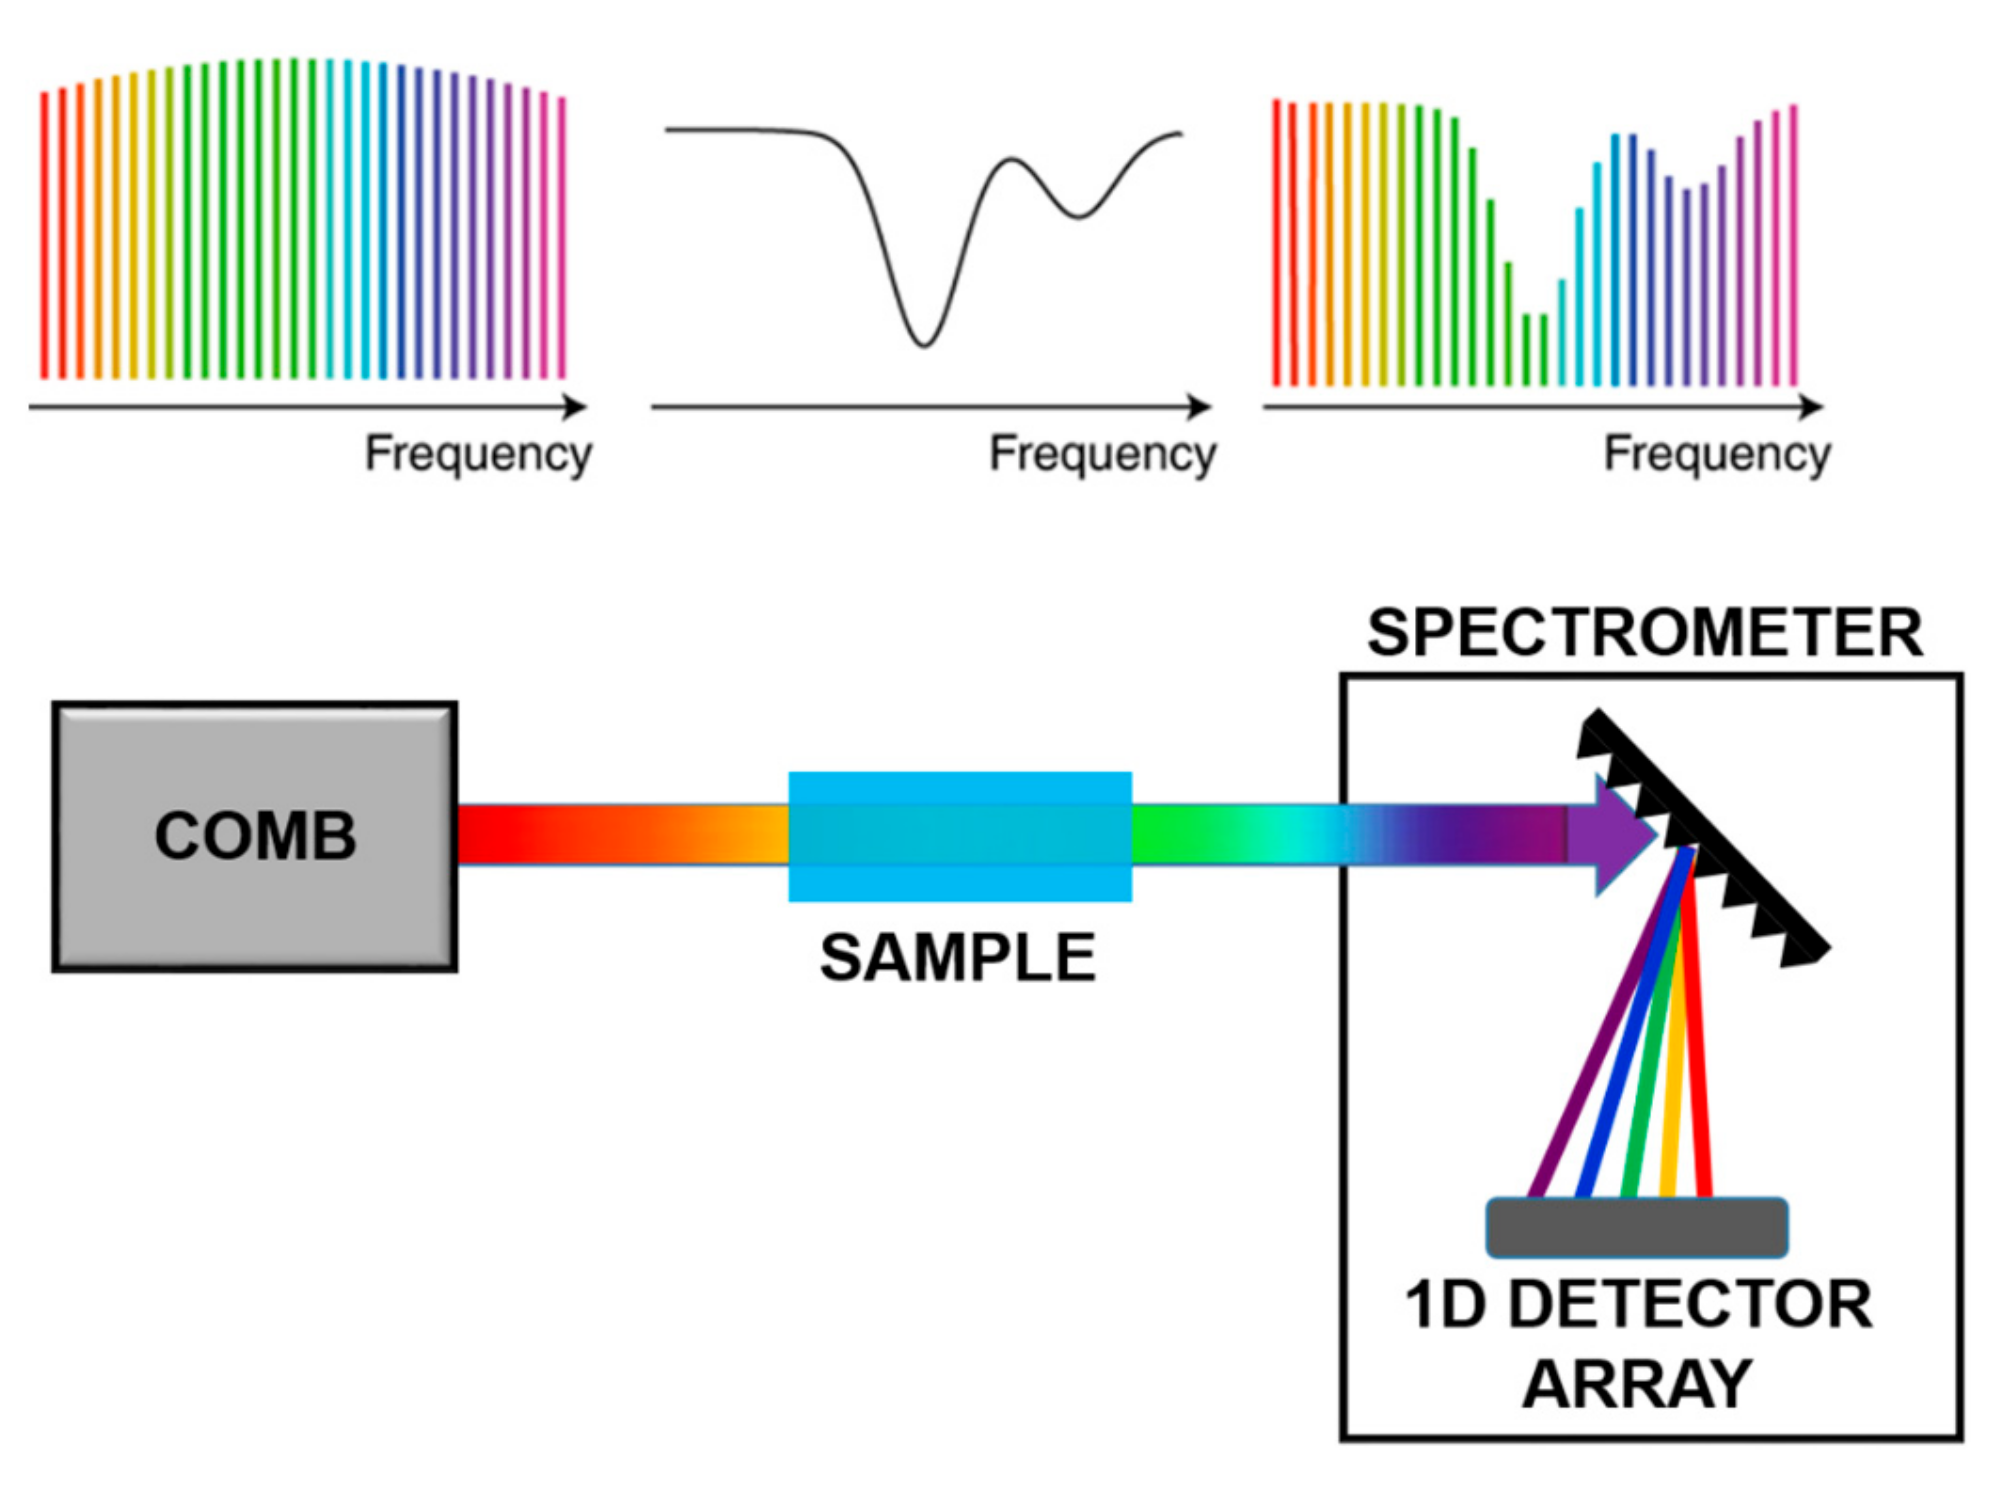
In direct comb spectroscopy, as shown in Figure 6, each tooth interacts with the sample and the absorption is measured tooth by tooth, using a dispersive system on a single detector or a 1-D or 2-D detector arrays. This technique enables the reconstruction of fine structure absorption profiles with large accuracy. However, to apply this approach to organic molecules, the comb spectrum has to be translated in the Mid-IR via Non-linear processes.
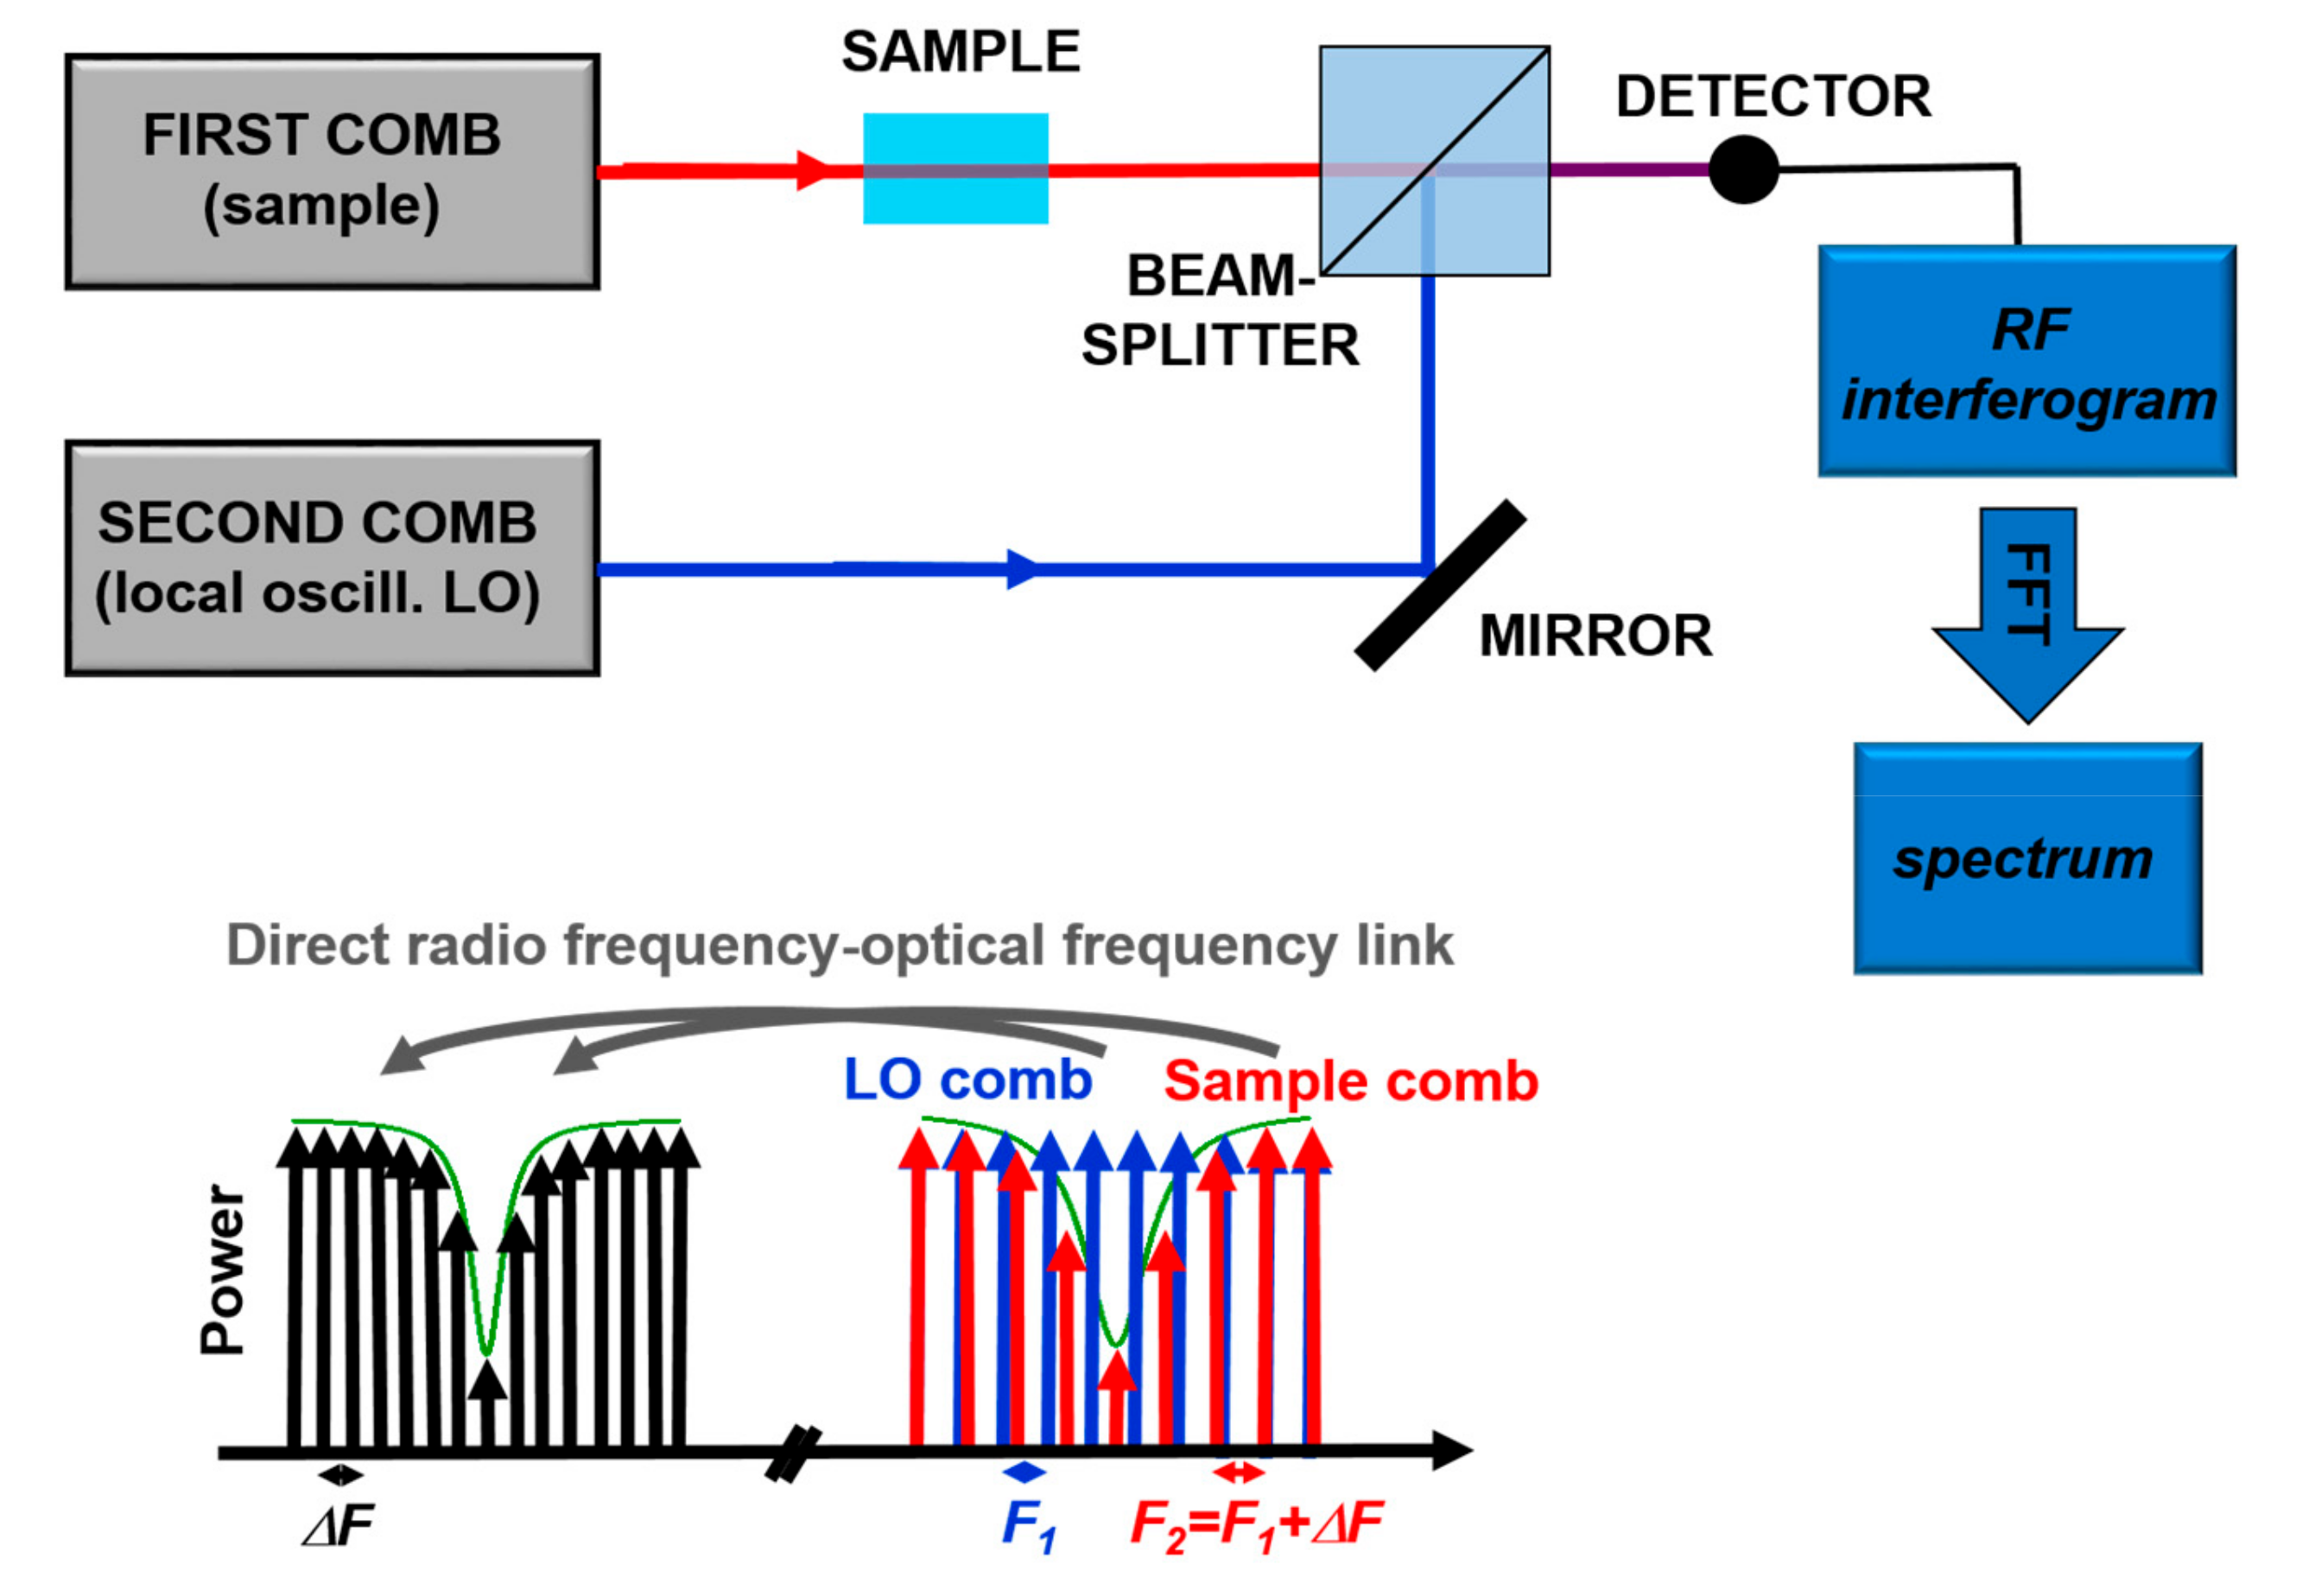
Recently, Dual Comb Spectroscopy is proving to be a very powerful technique. It is based, as sketched in Figure 7, on the detection of the interference between two combs with slightly different tooth spacing in the frequency-domain. The detected heterodyne beat signal consists of a comb in the Radio-Frequency (RF) domain, so that the absorption signal is translated from the optical frequencies to the “more easy to measure” RF spectrum. From the Fourier transform of the acquired signal it is possible to reconstruct entire absorption bands, like in FT spectroscopy but without moving components, with the frequency resolution and accuracy of OFCs. Until recently, this type of technique was limited to the spectral range covered by OFCs, typically in the Near IR. However, the invention of QCL-combs pushed the development of such technique also in the mid-IR with some commercial instrument available on the market. The strong point of Dual Comb Spectroscopy is the combination of accuracy, very fast measurement time, and high brilliance of the source [70]. This technique was successfully demonstrated in a protein reaction study in the region around 8 µm [72], thus paving the way for the non-invasive analysis in biological context.
In Table 3, we report a summary of the described optical detection techniques in the 1000–1500 cm−1 region. The first two techniques have already been used to analyze PCDD/Fs [18], while the last two techniques have the potentiality to be used for detecting dioxins and furans, but they have not yet been applied for this purpose. Their potentiality is demonstrated by the fact that these techniques were used to measure organic molecules [56,72] with similar absorption characteristics. The most performing technique is the dual comb spectroscopy based on QCL combs. In this case, the price to pay is a limited spectral coverage and a very high cost. The cheapest instrument is the consolidated FT-IR spectrometer, but the low optical power represents a limit for analysis in thick samples or cells (hundreds microns). The EC-QCLs, due to their high power, are suitable for imaging, spectroscopy in longer measurement cells (few millimeters in liquid phase), and for slow measurements.
2.2. Narrow Wavelength Range Sources
Mid-IR Laser technology is nowadays gaining interest due to new device development. However, sometimes chemical analysis and biological assays need a fast response, not necessarily quantitative but at least indicative of the presence of a toxic molecule. Therefore, a class of sensors characterized by cost-effectiveness, ready for real-time and on-site analysis is highly desirable. In many cases, sensors might be used for the determination of dioxins and dioxin like-PCBs throughout the environment and the food chain, involving various types of specimens such as water, air, soil, food, animal tissues and so on. So far, we compared different techniques based on wide spectrum sources. However, there are other classes of optical sensors based on lasers with limited tunability (a few nm at most) and possibly cheaper. One of them takes advantage of plasmonic resonances, and is able to detect complex organic molecules [73,74,75,76,77,78]. These sensors would deserve a broader discussion, so we refer also to other review articles and books present in the literature [73,79].
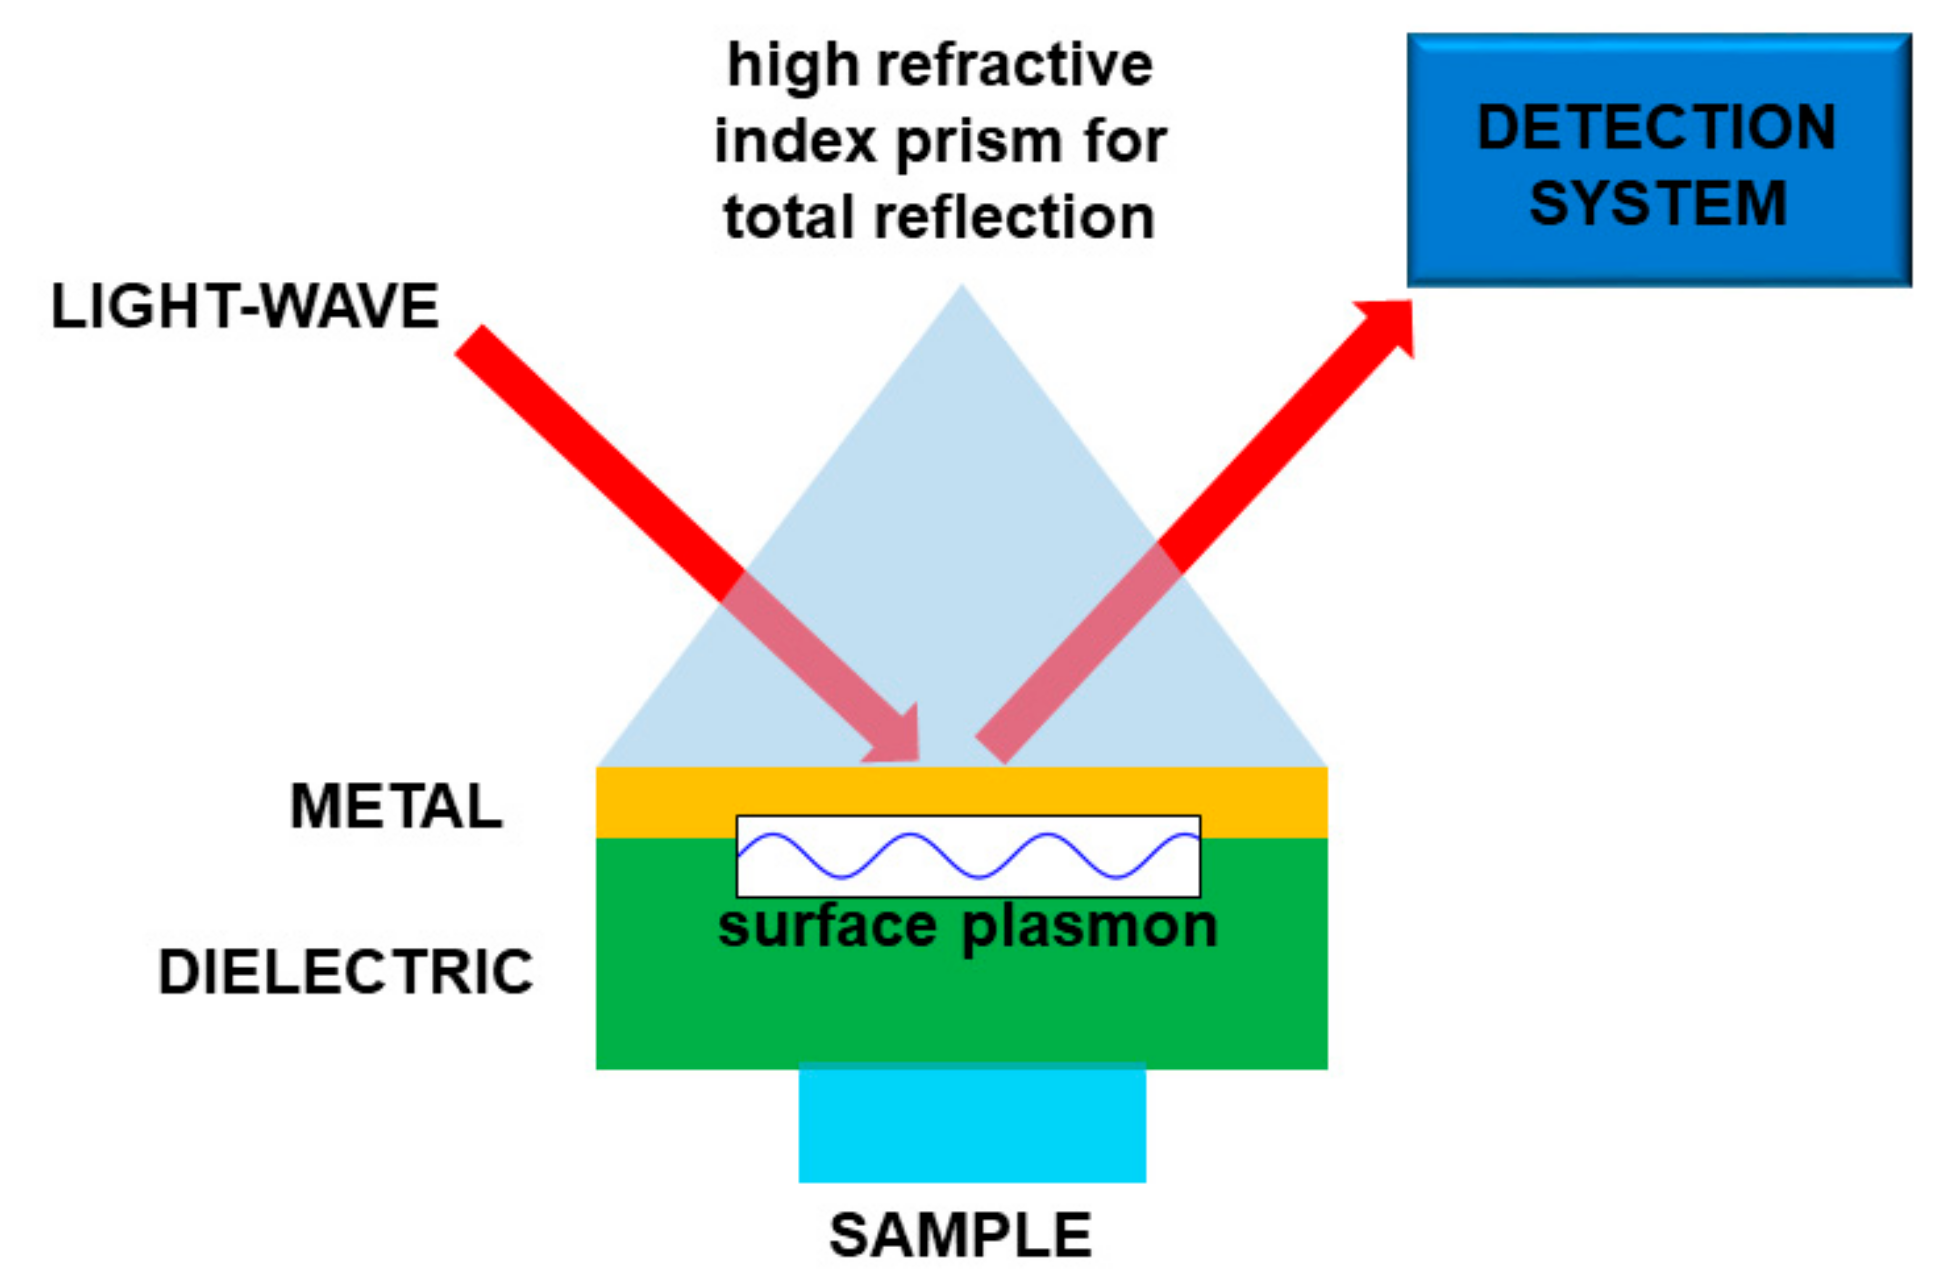
Basically, the interaction between the target molecule and the structure (nanoparticles, nanomaterial, fiber sensors), provided with plasmonic resonances, produces a relevant effect in absorption, fluorescence enhancement, or frequency shifting of a laser beam. In the latter case, when the molecule is on the plasmonic structure, the change of physical conditions at the interface produces some changes in the plasmon coupling, namely, an easily detectable resonance shift. In this way it is possible to obtain a very sensitive sensor, tailored onto a specific target molecule or molecular class. In most cases, the plasmonic sensor needs to be functionalized to enable the sticking of the molecule to the structure, so making the detection possible. A scheme of a kind of plasmonic sensor is reported in Figure 8.
In the literature there are some examples of plasmonic sensors for measuring dioxins, dioxin precursors, polychlorinated biphenyls and atrazine [80,81]. The strong point of these sensors is the very high selectivity and sensitivity [81], down to concentrations of the order of ng/mL. In some cases, single molecule detection could be achieved. It is fundamental specifying that this kind of plasmonic sensor detects the molecule sticking on the surface, so the chemical selectivity is due essentially to the selectivity of the functionalized material. For example, if this material is able to capture all the molecules of dioxin and furan families, the sensor could detect also a single molecule but it would not discriminate between the most toxic 2,3,7,8 TCDD and the non-toxic DBF. For evident reasons, plasmonic sensors could suffer polluting phenomena, so they may have to be cleaned or replaced. This could not be a real problem, as using some classes of plasmonic structure or functionalizing materials, plasmonic sensors could be very cheap.
Similar mechanisms of operation are common to other kind of sensors based on Surface-Enhanced Raman Scattering (SERS), [82,83,84,85,86,87], fluorescence quenching and enhancement [88] and surface photo voltage [89]. Raman spectroscopy is a well-established technique, based on the inelastic scattering of light. Starting from a single-frequency laser excitation it is possible to get from the target molecule one or more emissions at lower (Stokes) or higher (anti-Stokes) frequencies. The frequency differences, with respect to the pumping laser, are typical of each target, so allowing selectivity. Usually the Raman signal deriving from a single layer of molecules is very low. When plasmon resonance is involved, the effect rises by a factor up to 108, and this allows single molecule detection. For many years, the poor reproducibility of the metal coatings needed for SERS limited the applications of this technique. Nevertheless, since a couple of decades ago, this technological issue has been overcome and applications became possible. In the literature, it is possible to find examples of detection of dioxins [82] and of other molecules, like pesticides [90].
SERS is one of the most employed spectroscopic techniques for ultrasensitive detection in chemistry and biology. One of the most important requirements in this field is the design of advanced materials capable of generating high-quality SERS signals. Zhu et al. [85] used Ag nanoplate-assembled films as SERS substrates for the rapid detection of PCB-77. The authors obtained a detection limit of about 10−7 M (mol/L) and found a linear dependence between the logarithmic concentrations of PCB-77 and the fingerprint peaks intensities. The authors used the same Ag nanoplate-assembled also to distinguish the characteristic peaks of different PCBs congeners in mixed solutions. Abalde-Cela and co-workers [82] obtained the SERS spectrum of 2-benzoyldibenzo-p-dioxin at a concentration lower than 10−8 M (mol/L), a detection level that matches current immunological methods. They used a SERS substrate based on thin films made by exponential layer-by-layer, infiltrated with silver nanoparticles. The authors found a characteristic vibrational pattern characterized by bands at 1392 (ring stretching) and 930 cm−1 (ring breathing), and smaller intensity bands at 1641 (CO stretching), 1605 and 1445 (ring stretching), 1296 (CO stretching), 852 (CH wagging), and 791 (ring deformation) cm−1.
These sensors represent a rapid, direct, and ultrasensitive detection method for environmental pollutants from different matrices.
Wang and co-workers [88] reported on the use of a sensitive and selective fluorescent membrane for rapid detection of trace 2,2′,4,5,5′-pentachlorinated biphenyl (PCB101). The fluorophore phenyl isothiocyanate (PICT) was immobilized onto porous anodic aluminium oxide membrane. The fluorescence of this membrane is enhanced after adding the analyte PCB101 into the membrane, due to the interaction between the fluorophore PITC and the analyte PCB101. The fluorescence intensity increased with the PCB101 concentration in the low range below 1 ppm, and the membrane showed good selectivity.
3. Conclusions and Future Perspectives
Following these premises, optical monitoring of these organic molecules in liquid phase with high time resolution, in vitro (with minimal sample consumption) or even in vivo, is not so far from being achieved.
Nowadays, the development of photonics has already provided us with some tools, i.e., laser sources such as OFC, ICL, QCL, ICL- and QCL-comb, non-linear sources. Furthermore, other new mid-IR components such as waveguides, micro fluidic/waveguides, detectors [91,92] are under development and implementation, thus paving the way toward compact instruments for in vivo measurements of dioxins and related toxic compounds.
On the other hand, plasmonic sensors represent a compact alternative to Mid-IR sensors for non-invasive analysis or in-vivo measures, although their selectivity is strictly dependent on the material used to selectively capture the molecule of interest, and they could suffer surface pollution with a consequent performance reduction.
Author Contributions
B.P., M.S.d.C., S.V. and F.D. shared the tasks of conceptualization, investigation, formal analysis, writing (both original draft, and review and editing), and visualization, according to their specific skills.
Funding
This research received funding from Regione Toscana, in the frame of “POR CREO FESR 2007-2013”, Project SIMPAS (Innovative Measurement Systems for the Protection of Environment and Health) grant number 51018.
Conflicts of Interest
The authors declare no conflict of interest.
References
- Breivik, K.; Alcock, R.; Li, Y.-F.; Bailey, R.E.; Fiedler, H.; Pacyna, J.M. Primary sources of selected POPs: Regional and global scale emission inventories. Environ. Pollut. 2004, 128, 3–16. [Google Scholar] [CrossRef] [PubMed]
- Holt, E.; Weber, R.; Stevenson, G.; Gaus, C. Polychlorinated Dibenzo-p-Dioxins and Dibenzofurans (PCDD/Fs) Impurities in Pesticides: A Neglected Source of Contemporary Relevance. Environ. Sci. Technol. 2010, 44, 5409–5415. [Google Scholar] [CrossRef] [PubMed]
- Zhao, Y.-Y.; Tao, F.-M.; Zeng, E.Y. Theoretical study of the quantitative structure–activity relationships for the toxicity of dibenzo-p-dioxins. Chemosphere 2008, 73, 86–91. [Google Scholar] [CrossRef]
- Hirokawa, S.; Imasaka, T.; Imasaka, T. Chlorine Substitution Pattern, Molecular Electronic Properties, and the Nature of the Ligand−Receptor Interaction: Quantitative Property−Activity Relationships of Polychlorinated Dibenzofurans. Chem. Res. Toxicol. 2005, 18, 232–238. [Google Scholar] [CrossRef] [PubMed]
- Larsson, M.; van den Berg, M.; Brenerová, P.; van Duursen, M.B.M.; van Ede, K.I.; Lohr, C.; Luecke-Johansson, S.; Machala, M.; Neser, S.; Pěnčíková, K.; et al. Consensus Toxicity Factors for Polychlorinated Dibenzo-p-dioxins, Dibenzofurans, and Biphenyls Combining in Silico Models and Extensive in Vitro Screening of AhR-Mediated Effects in Human and Rodent Cells. Chem. Res. Toxicol. 2015, 28, 641–650. [Google Scholar] [CrossRef] [PubMed]
- Mimura, J.; Fujii-Kuriyama, Y. Functional role of AhR in the expression of toxic effects by TCDD. Biochim. Biophys. Acta Gen. Subj. 2003, 1619, 263–268. [Google Scholar] [CrossRef]
- Van den Berg, M.; Birnbaum, L.S.; Denison, M.; de Vito, M.; Farland, W.; Feeley, M.; Fiedler, H.; Hakansson, H.; Hanberg, A.; Haws, L.; et al. The 2005 World Health Organization Re-evaluation of Human and Mammalian Toxic Equivalency Factors for Dioxins and Dioxin-like Compounds. Toxicol. Sci. 2006, 93, 223–241. [Google Scholar] [CrossRef]
- Schug, T.T.; Johnson, A.F.; Birnbaum, L.S.; Colborn, T.; Guillette, J.L.J.; Crews, D.P.; Collins, T.; Soto, A.M.; vom Saal, F.S.; McLachlan, J.A.; et al. Minireview: Endocrine Disruptors: Past Lessons and Future Directions. Mol. Endocrinol. 2016, 30, 833–847. [Google Scholar] [CrossRef] [Green Version]
- Mrema, E.J.; Rubino, F.M.; Brambilla, G.; Moretto, A.; Tsatsakis, A.M.; Colosio, C. Persistent organochlorinated pesticides and mechanisms of their toxicity. Toxicology 2013, 307, 74–88. [Google Scholar] [CrossRef] [PubMed]
- Patrizi, B.; Siciliani de Cumis, M. TCDD Toxicity Mediated by Epigenetic Mechanisms. Int. J. Mol. Sci. 2018, 19, 4101. [Google Scholar] [CrossRef] [PubMed]
- Esser, C.; Rannug, A. The Aryl Hydrocarbon Receptor in Barrier Organ Physiology, Immunology, and Toxicology. Pharmacol. Rev. 2015, 67, 259. [Google Scholar] [CrossRef] [PubMed]
- Pirkle, J.L.; Wolfe, W.H.; Patterson, D.G.; Needham, L.L.; Michalek, J.E.; Miner, J.C.; Peterson, M.R.; Phillips, D.L. Estimates of the half-life of 2,3,7,8-tetrachlorodibenzo-p-dioxin in Vietnam veterans of operation ranch hand. J. Toxicol. Environ. Health 1989, 27, 165–171. [Google Scholar] [CrossRef] [PubMed]
- Wolfe, W.H.; Michalek, J.E.; Miner, J.C.; Pirkle, J.L.; Caudill, S.P.; Patterson, D.G.; Needham, L.L. Determinants of TCDD half-life in veterans of operation ranch hand. J. Toxicol. Environ. Health 1994, 41, 481–488. [Google Scholar] [CrossRef]
- Safe, S. Polychlorinated Biphenyls (PCBs), Dibenzo-p-Dioxins (PCDDs), Dibenzofurans (PCDFs), and Related Compounds: Environmental and Mechanistic Considerations Which Support the Development of Toxic Equivalency Factors (TEFs). Crit. Rev. Toxicol. 1990, 21, 51–88. [Google Scholar] [CrossRef] [PubMed]
- Hennig, B.; Meerarani, P.; Slim, R.; Toborek, M.; Daugherty, A.; Silverstone, A.E.; Robertson, L.W. Proinflammatory Properties of Coplanar PCBs: In Vitro and in Vivo Evidence. Toxicol. Appl. Pharmacol. 2002, 181, 174–183. [Google Scholar] [CrossRef] [PubMed]
- Carpenter, D.O. Polychlorinated biphenyls (PCBs): Routes of exposure and effects on human health. Rev. Environ. Health 2006, 21, 1–23. [Google Scholar] [CrossRef] [PubMed]
- Gullett, B.K.; Oudejans, L.; Tabor, D.; Touati, A.; Ryan, S. Near-Real-Time Combustion Monitoring for PCDD/PCDF Indicators by GC-REMPI-TOFMS. Environ. Sci. Technol. 2012, 46, 923–928. [Google Scholar] [CrossRef]
- De Cumis, M.S.; D’Amato, F.; Viciani, S.; Patrizi, B.; Foggi, P.; Galea, C.L. First quantitative measurements by IR spectroscopy of dioxins and furans by means of broadly tunable quantum cascade lasers. Laser Phys. 2013, 23, 025603. [Google Scholar] [CrossRef]
- Patrizi, B.; de Cumis, M.S.; Viciani, S.; D’Amato, F.; Foggi, P. Characteristic vibrational frequencies of toxic polychlorinated dibenzo-dioxins and -furans. J. Hazard. Mater. 2014, 274, 98–105. [Google Scholar] [CrossRef]
- Deguchi, Y.; Dobashi, S.; Fukuda, N.; Shinoda, K.; Morita, M. Real-Time PCB Monitoring Using Time-of-Flight Mass Spectrometry with Picosecond Laser Ionization. Environ. Sci. Technol. 2003, 37, 4737–4742. [Google Scholar] [CrossRef]
- Wang, Z.Z.; Deguchi, Y.; Yan, J.J.; Liu, J.P. Breakdown Pattern of Hydrocarbons by Laser Breakdown Time-of-flight Mass Spectrometry. Spectrosc. Lett. 2015, 48, 669–676. [Google Scholar] [CrossRef]
- Ncube, S.; Madikizela, L.; Cukrowska, E.; Chimuka, L. Recent advances in the adsorbents for isolation of polycyclic aromatic hydrocarbons (PAHs) from environmental sample solutions. TrAC Trends Anal. Chem. 2018, 99, 101–116. [Google Scholar] [CrossRef]
- Patil, S.S.; Shedbalkar, U.U.; Truskewycz, A.; Chopade, B.A.; Ball, A.S. Nanoparticles for environmental clean-up: A review of potential risks and emerging solutions. Environ. Technol. Innov. 2016, 5, 10–21. [Google Scholar] [CrossRef]
- Carabias-Martínez, R.; Rodríguez-Gonzalo, E.; Revilla-Ruiz, P.; Hernández-Méndez, I. Pressurized liquid extraction in the analysis of food and biological samples. J. Chroma A 2005, 1089, 1–17. [Google Scholar] [CrossRef]
- Focant, J.-F.; Pirard, C.; de Pauw, E. Automated sample preparation-fractionation for the measurement of dioxins and related compounds in biological matrices: A review. Talanta 2004, 63, 1101–1113. [Google Scholar] [CrossRef] [PubMed]
- Dimpe, K.M.; Nomngongo, P.N. Current sample preparation methodologies for analysis of emerging pollutants in different environmental matrices. TrAC. Trends Anal. Chem. 2016, 82, 199–207. [Google Scholar] [CrossRef]
- Hoff, R.B.; Pizzolato, T.M. Combining extraction and purification steps in sample preparation for environmental matrices: A review of matrix solid phase dispersion (MSPD) and pressurized liquid extraction (PLE) applications. TrAC Trends Anal. Chem. 2018, 109, 83–96. [Google Scholar] [CrossRef]
- Zheng, Y.; Cai, D.; Huang, B.; Han, J.; Chen, Q.; Zhang, J.; Zhang, J.; Wang, X.; Shen, H. Simultaneous detection of multiple hydroxylated polychlorinated biphenyls from biological samples using ultra-high-performance liquid chromatography with isotope dilution tandem mass spectrometry. J. Sep. Sci. 2019, 42, 760–768. [Google Scholar] [CrossRef] [PubMed]
- Petrovic, M.; Eljarrat, E.; de Alda, M.J.L.; Barceló, D. Recent advances in the mass spectrometric analysis related to endocrine disrupting compounds in aquatic environmental samples. J. Chromatogr. A 2002, 974, 23–51. [Google Scholar] [CrossRef]
- Lorenzo, M.; Pico, Y. Gas Chromatography and Mass Spectroscopy Techniques for the Detection of Chemical Contaminants and Residues in Foods. In Chemical Contaminants and Residues in Food, 2nd ed.; Schrenk, D., Cartus, A., Eds.; Woodhead Publishing: Sawston, UK, 2017; pp. 15–50. [Google Scholar]
- Pizzini, S.; Piazza, R.; Cozzi, G.; Barbante, C. Simultaneous determination of halogenated contaminants and polycyclic aromatic hydrocarbons: A multi-analyte method applied to filter-feeding edible organisms. Anal. Bioanal. Chem. 2016, 408, 7991–7999. [Google Scholar] [CrossRef]
- Smith, B. Fundamentals of Fourier Transform Infrared Spectroscopy, 2nd ed.; CRC Press: Boca Raton, FL, USA, 2011. [Google Scholar] [CrossRef]
- Wurrey, C.J.; Fairless, B.J.; Kimball, H.E. Gas Chromatographic/Matrix Isolation/Fourier Transform Infrared Spectra of the Laterally Chlorinated Dibenzo-p-Dioxins and Dibenzofurans. Appl. Spectrosc. 1989, 43, 1317–1324. [Google Scholar] [CrossRef]
- Grainger, J.; Gelbaum, L.T. Tetrachlorodibenzo-p-Dioxin Isomer Differentiation by Capillary Gas Chromatography Fourier Transform-Infrared Spectroscopy. Appl. Spectrosc. 1987, 41, 809–820. [Google Scholar] [CrossRef]
- Coddington, I.; Newbury, N.; Swann, W. Dual-comb spectroscopy. Optica 2016, 3, 414–426. [Google Scholar] [CrossRef] [Green Version]
- Hugi, A.; Villares, G.; Blaser, S.; Liu, H.C.; Faist, J. Mid-infrared frequency comb based on a quantum cascade laser. Nature 2012, 492, 229–233. [Google Scholar] [CrossRef]
- Reichert, J.; Holzwarth, R.; Udem, T.; Hänsch, T.W. Measuring the frequency of light with mode-locked lasers. Opt. Commun. 1999, 172, 59–68. [Google Scholar] [CrossRef]
- Giordmaine, J.A.; Miller, R.C. Tunable Coherent Parametric Oscillation in LiNbO3 at Optical Frequencies. Phys. Rev. Lett. 1965, 14, 973–976. [Google Scholar] [CrossRef]
- Faist, J.; Capasso, F.; Sivco, D.L.; Sirtori, C.; Hutchinson, A.L.; Cho, A.Y. Quantum Cascade Laser. Science 1994, 264, 553–556. [Google Scholar] [CrossRef] [PubMed]
- Vurgaftman, I.; Weih, R.; Kamp, M.; Meyer, J.R.; Canedy, C.L.; Kim, C.S.; Kim, M.; Bewley, W.W.; Merritt, C.D.; Abell, J.; et al. Interband cascade lasers. J. Phys. D Appl. Phys. 2015, 48, 123001. [Google Scholar] [CrossRef]
- Vasilyev, S.; Moskalev, I.S.; Smolski, V.O.; Peppers, J.M.; Mirov, M.; Muraviev, A.V.; Zawilski, K.; Schunemann, P.G.; Mirov, S.B.; Vodopyanov, K.L.; et al. Super-octave longwave mid-infrared coherent transients produced by optical rectification of few-cycle 2.5-μm pulses. Optica 2019, 6, 111–114. [Google Scholar] [CrossRef]
- Young, C.; Kim, S.S.; Luzinova, Y.; Weida, M.; Arnone, D.; Takeuchi, E.; Day, T.; Mizaikoff, B. External cavity widely tunable quantum cascade laser based hollow waveguide gas sensors for multianalyte detection. Sens. Actuators B Chem. 2009, 140, 24–28. [Google Scholar] [CrossRef]
- Hodgkinson, J.; Tatam, R.P. Optical gas sensing: A review. Meas. Sci. Technol. 2012, 24, 012004. [Google Scholar] [CrossRef]
- Kosterev, A.; Wysocki, G.; Bakhirkin, Y.; So, S.; Lewicki, R.; Fraser, M.; Tittel, F.; Curl, R.F. Application of quantum cascade lasers to trace gas analysis. Appl. Phys. B 2008, 90, 165–176. [Google Scholar] [CrossRef]
- De Cumis, M.S.; Viciani, S.; Galli, I.; Mazzotti, D.; Sorci, F.; Severi, M.; D’Amato, F. Note: An analyzer for field detection of H2S by using cavity ring-down at 1.57 μm. Rev. Sci. Instrum. 2015, 86, 056108. [Google Scholar] [CrossRef]
- Chiarugi, A.; Viciani, S.; D’Amato, F.; Burton, M. Diode laser-based gas analyser for the simultaneous measurement of CO2 and HF in volcanic plumes. Atmos. Meas. Tech. 2018, 11, 329–339. [Google Scholar] [CrossRef]
- Viciani, S.; Montori, A.; Chiarugi, A.; D’Amato, F. A Portable Quantum Cascade Laser Spectrometer for Atmospheric Measurements of Carbon Monoxide. Sensors 2018, 18, 2380. [Google Scholar] [CrossRef] [PubMed]
- Patrizi, B.; Lapini, A.; di Donato, M.; Marcelli, A.; Lima, M.; Righini, R.; Foggi, P.; Baiocco, P.; Bonamore, A.; Boffi, A. Role of Local Structure and Dynamics of Small Ligand Migration in Proteins: A Study of a Mutated Truncated Hemoprotein from Thermobifida fusca by Time Resolved MIR Spectroscopy. J. Phys. Chem. B 2014, 118, 9209–9217. [Google Scholar] [CrossRef]
- Lapini, A.; di Donato, M.; Patrizi, B.; Marcelli, A.; Lima, M.; Righini, R.; Foggi, P.; Sciamanna, N.; Boffi, A. Carbon Monoxide Recombination Dynamics in Truncated Hemoglobins Studied with Visible-Pump MidIR-Probe Spectroscopy. J. Phys. Chem. B 2012, 116, 8753–8761. [Google Scholar] [CrossRef] [PubMed]
- Hugi, A.; Terazzi, R.; Bonetti, Y.; Wittmann, A.; Fischer, M.; Beck, M.; Faist, J.; Gini, E. External cavity quantum cascade laser tunable from 7.6 to 11.4 μm. Appl. Phys. Lett. 2009, 95, 061103. [Google Scholar] [CrossRef]
- Brandstetter, M.; Lendl, B. Tunable mid-infrared lasers in physical chemosensors towards the detection of physiologically relevant parameters in biofluids. Sens. Actuators B Chem. 2012, 170, 189–195. [Google Scholar] [CrossRef]
- Da Silveira Petruci, J.F.; Fortes, P.R.; Kokoric, V.; Wilk, A.; Raimundo, I.M.; Cardoso, A.A.; Mizaikoff, B. Real-time monitoring of ozone in air using substrate-integrated hollow waveguide mid-infrared sensors. Sci. Rep. 2013, 3, 3174. [Google Scholar] [CrossRef]
- Jouy, P.; Bonetti, Y.; Hans, K.; Gianella, M.; Sigrist, M.; Mangold, M.; Tuzson, B.; Emmenegger, L.; Wägli, P.; Homsy, A.; et al. Multi-Wavelength QCL Based MIR Spectroscopy for Fluids and Gases, CLEO: 2013, San Jose, California, 2013/06/09; Optical Society of America: San Jose, CA, USA, 2013; JM4K.1. [Google Scholar] [CrossRef]
- Lyakh, A.; Barron-Jimenez, R.; Dunayevskiy, I.; Go, R.; Tsvid, E.; Patel, K.C. Progress in Rapidly-Tunable External Cavity Quantum Cascade Lasers with a Frequency-Shifted Feedback. Photonics 2016, 3, 19. [Google Scholar] [CrossRef]
- Maulini, R.; Beck, M.; Faist, J.; Gini, E. Broadband tuning of external cavity bound-to-continuum quantum-cascade lasers. Appl. Phys. Lett. 2004, 84, 1659–1661. [Google Scholar] [CrossRef]
- Strand, C.L.; Ding, Y.; Johnson, S.E.; Hanson, R.K. Measurement of the mid-infrared absorption spectra of ethylene (C2H4) and other molecules at high temperatures and pressures. J. Quant. Spectrosc. Radiat. Transfer 2019, 222, 122–129. [Google Scholar] [CrossRef]
- Brandstetter, M.; Genner, A.; Anic, K.; Lendl, B. Tunable external cavity quantum cascade laser for the simultaneous determination of glucose and lactate in aqueous phase. Analyst 2010, 135, 3260–3265. [Google Scholar] [CrossRef]
- Alcaráz, M.R.; Schwaighofer, A.; Kristament, C.; Ramer, G.; Brandstetter, M.; Goicoechea, H.; Lendl, B. External-Cavity Quantum Cascade Laser Spectroscopy for Mid-IR Transmission Measurements of Proteins in Aqueous Solution. Anal. Chem. 2015, 87, 6980–6987. [Google Scholar] [CrossRef] [PubMed]
- Montalvo, G.; Waegele, M.M.; Shandler, S.; Gai, F.; DeGrado, W.F. Infrared Signature and Folding Dynamics of a Helical β-Peptide. J. Am. Chem. Soc. 2010, 132, 5616–5618. [Google Scholar] [CrossRef] [PubMed]
- Wörle, K.; Seichter, F.; Wilk, A.; Armacost, C.; Day, T.; Godejohann, M.; Wachter, U.; Vogt, J.; Radermacher, P.; Mizaikoff, B. Breath Analysis with Broadly Tunable Quantum Cascade Lasers. Anal. Chem. 2013, 85, 2697–2702. [Google Scholar] [CrossRef]
- Waegele, M.M.; Gai, F. Infrared Study of the Folding Mechanism of a Helical Hairpin: Porcine PYY. Biochemistry 2010, 49, 7659–7664. [Google Scholar] [CrossRef] [Green Version]
- Furstenberg, R.; Kendziora, C.A.; Papantonakis, M.R.; Nguyen, V.; McGill, R.A. Chemical imaging using infrared photothermal microspectroscopy. SPIE 2012, 8374, 837411-1. [Google Scholar] [CrossRef]
- Ravaro, M.; Locatelli, M.; Pugliese, E.; di Leo, I.; de Cumis, M.S.; D’Amato, F.; Poggi, P.; Consolino, L.; Meucci, R.; Ferraro, P.; et al. Mid-infrared digital holography and holographic interferometry with a tunable quantum cascade laser. Opt. Lett. 2014, 39, 4843–4846. [Google Scholar] [CrossRef]
- Pleitez, M.A.; Lieblein, T.; Bauer, A.; Hertzberg, O.; von Lilienfeld-Toal, H.; Mäntele, W. In Vivo Noninvasive Monitoring of Glucose Concentration in Human Epidermis by Mid-Infrared Pulsed Photoacoustic Spectroscopy. Anal. Chem. 2013, 85, 1013–1020. [Google Scholar] [CrossRef]
- Pilling, M.J.; Henderson, A.; Gardner, P. Quantum Cascade Laser Spectral Histopathology: Breast Cancer Diagnostics Using High Throughput Chemical Imaging. Anal. Chem. 2017, 89, 7348–7355. [Google Scholar] [CrossRef] [PubMed] [Green Version]
- Yeh, K.; Schulmerich, M.; Bhargava, R. Mid-infrared microspectroscopic imaging with a quantum cascade laser. SPIE 2013, 8726. [Google Scholar] [CrossRef]
- Adler, F.; Thorpe, M.J.; Cossel, K.C.; Ye, J. Cavity-Enhanced Direct Frequency Comb Spectroscopy: Technology and Applications. Annu. Rev. Anal. Chem. 2010, 3, 175–205. [Google Scholar] [CrossRef] [Green Version]
- Picqué, N.; Hänsch, T.W. Frequency comb spectroscopy. Nat. Photonics 2019, 13, 146–157. [Google Scholar] [CrossRef]
- De Cumis, M.S.; Eramo, R.; Coluccelli, N.; Galzerano, G.; Laporta, P.; Pastor, P.C. Multiplexed direct-frequency-comb Vernier spectroscopy of carbon dioxide 2ν1 + ν3 ro-vibrational combination band. J. Chem. Phys. 2018, 148, 114303. [Google Scholar] [CrossRef] [PubMed]
- Villares, G.; Hugi, A.; Blaser, S.; Faist, J. Dual-comb spectroscopy based on quantum-cascade-laser frequency combs. Nat. Commun. 2014, 5, 5192. [Google Scholar] [CrossRef] [PubMed]
- Bagheri, M.; Frez, C.; Sterczewski, L.A.; Gruidin, I.; Fradet, M.; Vurgaftman, I.; Canedy, C.L.; Bewley, W.W.; Merritt, C.D.; Kim, C.S.; et al. Passively mode-locked interband cascade optical frequency combs. Sci. Rep. 2018, 8, 3322. [Google Scholar] [CrossRef]
- Klocke, J.L.; Mangold, M.; Allmendinger, P.; Hugi, A.; Geiser, M.; Jouy, P.; Faist, J.; Kottke, T. Single-Shot Sub-microsecond Mid-infrared Spectroscopy on Protein Reactions with Quantum Cascade Laser Frequency Combs. Anal. Chem. 2018, 90, 10494–10500. [Google Scholar] [CrossRef] [Green Version]
- Taylor, A.B.; Zijlstra, P. Single-Molecule Plasmon Sensing: Current Status and Future Prospects. ACS Sens. 2017, 2, 1103–1122. [Google Scholar] [CrossRef] [Green Version]
- Giorgini, A.; Avino, S.; Malara, P.; Zullo, R.; De Natale, P.; Mrkvová, K.; Homola, J.; Gagliardi, G. Surface-plasmon optical-heterodyne clock biosensor. Sens. Actuators B Chem. 2018, 273, 336–341. [Google Scholar] [CrossRef]
- Greive, S.J.; Weitzel, S.E.; Goodarzi, J.P.; Main, L.J.; Pasman, Z.; von Hippel, P.H. Monitoring RNA transcription in real time by using surface plasmon resonance. Proc. Natl. Acad. Sci. USA 2008, 105, 3315–3320. [Google Scholar] [CrossRef] [Green Version]
- Bocková, M.; Chadtová Song, X.; Gedeonová, E.; Levová, K.; Kalousová, M.; Zima, T.; Homola, J. Surface plasmon resonance biosensor for detection of pregnancy associated plasma protein A2 in clinical samples. Anal. Bioanal. Chem. 2016, 408, 7265–7269. [Google Scholar] [CrossRef] [PubMed]
- Kabashin, A.V.; Patskovsky, S.; Grigorenko, A.N. Phase and amplitude sensitivities in surface plasmon resonance bio and chemical sensing. Opt. Express 2009, 17, 21191–21204. [Google Scholar] [CrossRef] [PubMed]
- Gangopadhyay, T.K.; Giorgini, A.; Halder, A.; Pal, M.; Paul, M.C.; Avino, S.; Gagliardi, G. Detection of chemicals using a novel fiber-optic sensor element built in fiber loop ring-resonators. Sens. Actuators B Chem. 2015, 206, 327–335. [Google Scholar] [CrossRef]
- Gagliardi, G. Cavity-Enhanced Spectroscopy and Sensing; Springer: Berlin, Germany, 2014. [Google Scholar] [CrossRef]
- Soh, N.; Tokuda, T.; Watanabe, T.; Mishima, K.; Imato, T.; Masadome, T.; Asano, Y.; Okutani, S.; Niwa, O.; Brown, S. A surface plasmon resonance immunosensor for detecting a dioxin precursor using a gold binding polypeptide. Talanta 2003, 60, 733–745. [Google Scholar] [CrossRef]
- Shimomura, M.; Nomura, Y.; Zhang, W.; Sakino, M.; Lee, K.-H.; Ikebukuro, K.; Karube, I. Simple and rapid detection method using surface plasmon resonance for dioxins, polychlorinated biphenylx and atrazine. Anal. Chim. Acta 2001, 434, 223–230. [Google Scholar] [CrossRef]
- Abalde-Cela, S.; Ho, S.; Rodríguez-González, B.; Correa-Duarte, M.A.; Álvarez-Puebla, R.A.; Liz-Marzán, L.M.; Kotov, N.A. Loading of Exponentially Grown LBL Films with Silver Nanoparticles and Their Application to Generalized SERS Detection. Angew. Chem. Int. Ed. 2009, 48, 5326–5329. [Google Scholar] [CrossRef] [Green Version]
- Yang, Y.; Meng, G. Ag dendritic nanostructures for rapid detection of polychlorinated biphenyls based on surface-enhanced Raman scattering effect. J. Appl. Phys. 2010, 107, 044315. [Google Scholar] [CrossRef]
- Bantz, K.C.; Haynes, C.L. Surface-enhanced Raman scattering detection and discrimination of polychlorinated biphenyls. Vib. Spectrosc. 2009, 50, 29–35. [Google Scholar] [CrossRef]
- Zhu, C.; Meng, G.; Huang, Q.; Huang, Z. Vertically aligned Ag nanoplate-assembled film as a sensitive and reproducible SERS substrate for the detection of PCB-77. J. Hazard. Mater. 2012, 211–212, 389–395. [Google Scholar] [CrossRef]
- Fleischmann, M.; Hendra, P.J.; McQuillan, A.J. Raman spectra of pyridine adsorbed at a silver electrode. Chem. Phys. Lett. 1974, 26, 163–166. [Google Scholar] [CrossRef]
- Stiles, P.L.; Dieringer, J.A.; Shah, N.C.; van Duyne, R.P. Surface-Enhanced Raman Spectroscopy. Annu. Rev. Anal. Chem. 2008, 1, 601–626. [Google Scholar] [CrossRef] [Green Version]
- Wang, M.; Meng, G.; Huang, Q.; Li, M.; Li, Z.; Tang, C. Fluorescence detection of trace PCB101 based on PITC immobilized on porous AAO membrane. Analyst 2011, 136, 278–281. [Google Scholar] [CrossRef]
- Li, M.; Meng, G.; Huang, Q.; Yin, Z.; Wu, M.; Zhang, Z.; Kong, M. Prototype of a Porous ZnO SPV-Based Sensor for PCB Detection at Room Temperature under Visible Light Illumination. Langmuir 2010, 26, 13703–13706. [Google Scholar] [CrossRef]
- Tang, J.; Chen, W.; Ju, H. Rapid detection of pesticide residues using a silver nanoparticles coated glass bead as nonplanar substrate for SERS sensing. Sens. Actuators B Chem. 2019, 287, 576–583. [Google Scholar] [CrossRef]
- Schädle, T.; Mizaikoff, B. Mid-Infrared Waveguides: A Perspective. Appl. Spectros. 2016, 70, 1625–1638. [Google Scholar] [CrossRef] [Green Version]
- Chen, Y.; Lin, H.; Hu, J.; Li, M. Heterogeneously Integrated Silicon Photonics for the Mid-Infrared and Spectroscopic Sensing. ACS Nano 2014, 8, 6955–6961. [Google Scholar] [CrossRef] [PubMed] [Green Version]
Figure 1.
General molecular structures of chlorinated dioxins (PCDDs), furans (PCDFs) and biphenyls (PCBs).
Figure 1.
General molecular structures of chlorinated dioxins (PCDDs), furans (PCDFs) and biphenyls (PCBs).

Figure 2.
Principles of the Fourier-Transform Infrared Spectroscopy (FT-IR).

Figure 3.
FT-IR spectra of PCDDs and dibenzo-p-dioxin (D-p-D). Reprinted with permission from [19], copyright 2014.
Figure 3.
FT-IR spectra of PCDDs and dibenzo-p-dioxin (D-p-D). Reprinted with permission from [19], copyright 2014.

Figure 4.
FT-IR spectra of PCDFs and dibenzofuran (DBF). Reprinted with permission from [19], copyright 2014.
Figure 4.
FT-IR spectra of PCDFs and dibenzofuran (DBF). Reprinted with permission from [19], copyright 2014.

Figure 5.
Spectroscopic set-up based on a broadband tunable QCL. By moving a grating, it is possible to select the operation wavelength on a very large frequency range.
Figure 5.
Spectroscopic set-up based on a broadband tunable QCL. By moving a grating, it is possible to select the operation wavelength on a very large frequency range.

Figure 6.
Scheme of Direct Comb Spectroscopy. Adapted with permission from [68], copyright 2019.
Figure 6.
Scheme of Direct Comb Spectroscopy. Adapted with permission from [68], copyright 2019.

Figure 7.
Principles of Dual-Comb Spectroscopy. Adapted with permission from [70], copyright 2014.
Figure 7.
Principles of Dual-Comb Spectroscopy. Adapted with permission from [70], copyright 2014.

Figure 8.
Sketch of a plasmonic sensor. In this particular case the light is used to “read” the sensor. Molecule “detection” is performed by means of the interaction between the sample and a material supporting the surface plasmons.
Figure 8.
Sketch of a plasmonic sensor. In this particular case the light is used to “read” the sensor. Molecule “detection” is performed by means of the interaction between the sample and a material supporting the surface plasmons.


Table 1.
Principal FT-IR bands of PCDDs. Reprinted with permission from [19], copyright 2014.
Table 1.
Principal FT-IR bands of PCDDs. Reprinted with permission from [19], copyright 2014.
| PCDD Congener | Mode | Frequency Range (1020–1205 and 1265–1510 cm−1) GC/MI/FT-IR [33] | Frequency Range (1020–1205 and 1265–1510 cm−1) Vapor-Phase FT-IR [34] | Frequency Range (1020–1205 and 1265–1510 cm−1) Condensed-Phase FT-IR [19] |
|---|---|---|---|---|
| dibenzo-p-dioxin | C=C aromatic ring skeletal vibrations | 1489 | 1489 | |
| 1390 | ||||
| C-O-C asymmetric stretch | 1295 | |||
| 1290 | 1287 | |||
| C-C-C tri-ring bending | 1197 | |||
| 1117 | ||||
| Ring breathing | 1026 | 1112 | ||
| 1030 | ||||
| 2,3,7,8-TCDD | C=C aromatic ring skeletal vibrations | 1495 | ||
| 1488 | 1489 | 1484 | ||
| 1470 | 1465 | 1465 | ||
| 1391 | 1395 | |||
| C-O-C asymmetric stretch | 1330 | 1321 | 1326 | |
| 1313 | ||||
| 1306 | 1306 | 1306 | ||
| C-C-C tri-ring bending | 1176 | 1173 | 1173 | |
| Ring breathing | 1117 | 1114 | 1114 | |
| 1106 | 1103 | 1103 | ||
| 1,2,3,7,8-PeCDD | C=C aromatic ring skeletal vibrations | 1493 | 1489 | |
| 1475 | 1471 | 1470 | ||
| 1465 | 1447 | 1449 | ||
| 1399 | 1394 | 1395 | ||
| C-O-C asymmetric stretch | 1319 | 1328 | ||
| 1313 | 1311 | 1314 | ||
| 1308 | ||||
| Ring breathing | 1113 | 1108 | 1111 | |
| 1,2,3,7,8,9-HxCDD | C=C aromatic ring skeletal vibrations | 1480 | ||
| 1452 | 1445 | 1446 | ||
| 1400 | 1391 | 1396 | ||
| C-O-C asymmetric stretch | 1333 | 1328 | ||
| 1314 | 1312 | 1309 | ||
| 1308 | ||||
| 1304 | ||||
| C-C-C tri-ring bending | 1155 | |||
| 1147 | 1143 | |||
| 1,2,3,6,7,8-HxCDD | C=C aromatic ring skeletal vibrations | 1481 | ||
| 1455 | 1445 | 1448 | ||
| 1400 | 1392 | 1395 | ||
| C-O-C asymmetric stretch | 1333 | 1328 | ||
| 1318 | 1310 | 1312 | ||
| C-C-C tri-ring bending | 1150 | |||
| 1147 | 1143 | |||
| 1,2,3,4,6,7,8-HpCDD | C=C aromatic ring skeletal vibrations | 1480 | ||
| 1457 | 1451 | 1452 | ||
| 1447 | ||||
| 1434 | 1422 | 1428 | ||
| 1403 | 1392 | 1398 | ||
| C-O-C asymmetric stretch | 1334 | 1329 | ||
| 1297 | 1299 | |||
| C-C-C tri-ring bending | 1148 | 1153 | ||
| 1144 | ||||
| OCDD | C=C aromatic ring skeletal vibrations | 1436 | ||
| 1424 | 1429 | |||
| 1419 | ||||
| 1402 | ||||
| 1399 |
Table 2.
Principal FT-IR bands of PCDFs. Reprinted with permission from [19], copyright 2014.
Table 2.
Principal FT-IR bands of PCDFs. Reprinted with permission from [19], copyright 2014.
| PCDF Congener | Mode | Frequency Range (1020–1205 and 1265–1510 cm−1) GC/MI/FT-IR [33] | Frequency Range (1020–1205 and 1265–1510 cm−1) Condensed-Phase FT-IR [19] |
|---|---|---|---|
| dibenzofuran | C=C aromatic ring skeletal vibrations | 1473 1465 1454 1444 | |
| C-O-C asymmetric stretch | 1320 1283 | ||
| C-C-C tri-ring bending | 1189 | ||
| 1196 | |||
| Ring breathing | 1112 | ||
| 1102 | |||
| 2,3,7,8-TCDF | C=C aromatic ring skeletal vibrations | 1443 1402 | 1439 1398 |
| C-O-C asymmetric stretch | 1289 | 1287 | |
| C-H in plane deformations | 1276 | ||
| C-C-C tri-ring bending | 1191 | ||
| Ring breathing | 1109 | 1107 | |
| 1099 | 1095 | ||
| 1,2,3,7,8-PeCDF | C=C aromatic ring skeletal vibrations | 1460 1455 1423 | |
| 1427 | 1423 | ||
| C-O-C asymmetric stretch | 1382 1284 | 1356 1301 1283 1280 | |
| C-C-C tri-ring bending | 1138 | 1136 | |
| Ring breathing | 1103 | 1100 | |
| 2,3,4,7,8-PeCDF | C=C aromatic ring skeletal vibrations | 1455 1429 1408 | 1451 1425 1404 |
| C-O-C asymmetric stretch | 1384 1381 1287 | 1379 1374 1363 1285 | |
| 1162 | 1191 1159 | ||
| 1146 | |||
| Ring breathing | 1104 | 1101 | |
| 1088 | |||
| 1,2,3,4,7,8-HxCDF | C=C aromatic ring skeletal vibrations | 1415 | 1452 1412 |
| 1403 | 1399 | ||
| C-O-C asymmetric stretch | 1361 | 1362 1357 1345 | |
| C-H in plane deformations | 1277 | 1276 | |
| Ring breathing | 1108 | 1105 | |
| 1101 | 1099 | ||
| 1076 | |||
| C=C aromatic ring skeletal vibrations | 1506 | ||
| 1,2,3,7,8,9-HxCDF | C-O-C asymmetric stretch | 1387 1369 1361 | 1384 1366 1361 |
| 1294 | 1296 | ||
| 1289 | |||
| C-H in plane deformations | 1273 | 1272 | |
| C-C-C tri-ring bending | 1146 1138 | 1143 1136 | |
| 1,2,3,4,7,8,9-HpCDF | C=C aromatic ring skeletal vibrations | 1405 | 1506 1401 |
| C-O-C asymmetric stretch | 1381 1371 1352 1347 | 1376 1365 1356 1346 1282 | |
| C-H in plane deformations | 1269 | 1269 1266 | |
| C-C-C tri-ring bending | 1182 1142 | 1181 1141 | |
| Ring breathing | 1084 | ||
| OCDF | C=C aromatic ring skeletal vibrations | 1411 1406 | |
| C-O-C asymmetric stretch | 1364 1357 1349 1338 1328 1278 | ||
| C-H in plane | 1266 | ||
| deformations | |||
| C-C-C tri-ring bending | 1191 | ||
| Ring breathing | 1109 |
Table 3.
Summary of the different optical techniques described in Section 2.1.
Table 3.
Summary of the different optical techniques described in Section 2.1.
| Technique | Spectral Range cm−1 | Molecule | Measurement Time | Frequency Accuracy (cm−1) | Optical Power/Wavelength | Cost | Refs |
|---|---|---|---|---|---|---|---|
| FT-IR | 1020–1510 | dioxins and furans | <60 s | 0.9 | <1 µW | Low | [19] |
| ECDL-QCL | 1205–1310 And 1335–1590 | dioxins and furans | 4 min (first range); 14 min (second range) | 0.1 | Tens/hundreds of mW | Medium | [18] |
| Rapid scan QCL | 860–1100 | ethylene, propene, 1-butene, 2-butene, 1,3-butadiene, methanol | down to 3 ms | 0.35 | ≤1 W | High | [56] |
| Dual Comb based IR spectrometer | 1180–1250 | Protein in Halobacterium salinarum | 1 µs | 0.3 * | Typically between 1 µW and 1 mW | High | [72] |
* The target of this paper was fast reaction, so for different experiments the accuracy could reach the order of 3 × 10⁻⁴ cm−1 (10 MHz).
© 2019 by the authors. Licensee MDPI, Basel, Switzerland. This article is an open access article distributed under the terms and conditions of the Creative Commons Attribution (CC BY) license (http://creativecommons.org/licenses/by/4.0/).
Share and Cite
MDPI and ACS Style
Patrizi, B.; Siciliani de Cumis, M.; Viciani, S.; D’Amato, F. Dioxin and Related Compound Detection: Perspectives for Optical Monitoring. Int. J. Mol. Sci. 2019, 20, 2671. https://doi.org/10.3390/ijms20112671
AMA Style
Patrizi B, Siciliani de Cumis M, Viciani S, D’Amato F. Dioxin and Related Compound Detection: Perspectives for Optical Monitoring. International Journal of Molecular Sciences. 2019; 20(11):2671. https://doi.org/10.3390/ijms20112671
Chicago/Turabian StylePatrizi, Barbara, Mario Siciliani de Cumis, Silvia Viciani, and Francesco D’Amato. 2019. "Dioxin and Related Compound Detection: Perspectives for Optical Monitoring" International Journal of Molecular Sciences 20, no. 11: 2671. https://doi.org/10.3390/ijms20112671
Note that from the first issue of 2016, this journal uses article numbers instead of page numbers. See further details here.