1. Introduction
Chagas’ disease, which is a neglected tropical disease (as defined by the World Health Organization, WHO) caused by the protozoan
Trypanosoma cruzi, is the leading cause of heart failure in Latin America, where it is endemic [
1]. According to the WHO, the disease affects 8 million people worldwide and causes 10,000 deaths every year. Moreover, more than 25 million people live in vulnerable areas under the risk of infection [
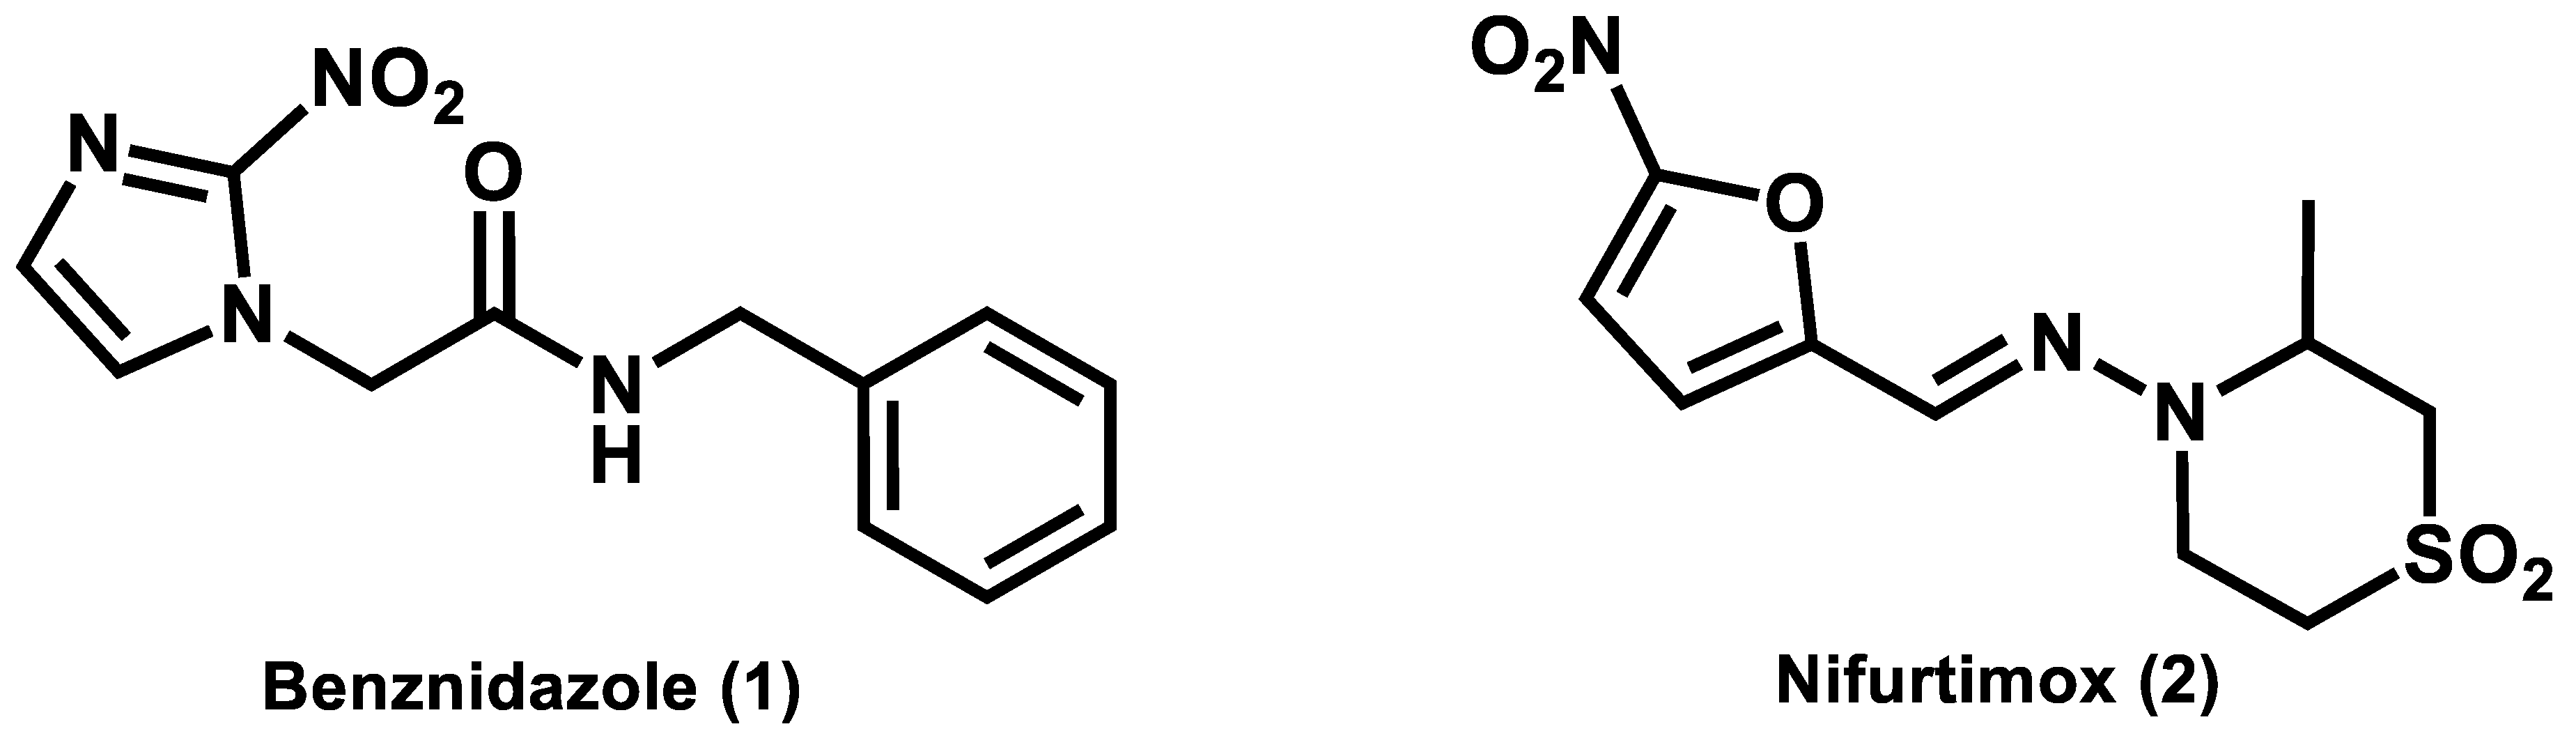
2]. Current chemotherapy for Chagas’ disease is limited to nifurtimox and benznidazole, which are two obsolete drugs identified in 1965 and 1971, respectively (
Figure 1). These nitroheterocyclic compounds cause several adverse effects, such as weight loss, neurological damage, anorexia, dermatitis, depression, nausea, and gastrointestinal problems [
3,
4]. Furthermore, they lack effectiveness in the chronic phase of the disease. Given these drawbacks, novel, effective, and safe drugs for Chagas’ disease are urgently needed [
5].
T. cruzi parasites interconvert into different morphological phases during their life cycle as they circulate between the insect host (the Triatomine bugs
Triatoma infestans,
Rhodnius prolixus, and
Triatoma dimidiata) and the human host. Replicative epimastigotes and infective metacyclic trypomastigotes develop in Triatomine bugs, whereas replicative intracellular amastigotes and non-replicative bloodstream trypomastigotes develop in humans [
6]. Intracellular amastigotes, which are found in tissues such as cardiac muscles and the digestive system, are the clinically relevant form of the parasite, and thus are the targets of antichagasic agents [
6,
7]. Occasionally, compounds that are active against isolated macromolecular targets lose their activity when tested in whole-cell phenotypic assays [
8,
9,
10,
11]. This activity loss can stem from inappropriate physicochemical properties, which play a key role in the ability of compounds to permeate biological membranes and reach their molecular targets [
12,
13]. In this context, drug discovery players have unprecedentedly relied on chemoinformatics to better understand the relationships between structure, physicochemical properties, and biological activity [
14,
15,
16]. Quantitative structure-activity relationships (QSAR) have played a major role in this field [
17,
18,
19]. In this study, we developed artificial neural networks (ANNs) and kernel-based partial least squares models (KPLS) aimed at investigating the molecular events underlying the activity of structurally diverse trypanocidal agents [
20,
21]. The outcome of these models was used to generate a focused fragment collection and physicochemical heat maps, which provide insights into privileged chemotypes and optimum physicochemical property spaces associated with enhanced trypanocidal activity.
ANNs are aimed to mimic biological neural networks and their processing units, the neurons, are composed of dendrites, a cell body, and axons. All input values (the dendrites) are summed and then are assigned to a learning function (the cell body). The input values are the independent variables and the output values are the dependent variables. The signal (axon) can be propagated or inhibited if the value returned by the activation function is above or below a predetermined threshold, respectively [
22]. The multi-layer back-propagation algorithm was used in the ANN models. In particular, the back-propagation method uses the forward and backward steps [
23]. First, weights are determined, and the biological activity value is predicted for a compound. The error between experimental and predicted values provides support for adjusting the input weight in the first intermediate layer. The main limitation of the algorithm is the convergence of the network due to low and high values in the learning rate. To reduce this limitation, the term momentum ensures that the learning rate is stabilized.
The fingerprint descriptors in the KPLS models are calculated from the smiles representation of each structure in the dataset [
24]. These descriptors can be classified as linear, dendritic, radial, and molprint2D [
25]. These four descriptors allow the visualization of atomic contribution maps, which depict the contribution of each atom to the dependent variable. The linear fingerprint descriptor uses the information from the linear fragments and ring closure to convert the structures into binary sequences. The dendritic fingerprint includes branched parts of the molecule during the generation of the binary sequence. Also referred to as extended connectivity fingerprints, the radial fingerprint identifies all heavy atoms and encodes the compounds by assigning fragments that emerge radially from each atom. Finally, molprint2D is similar to the radial fingerprint and encodes the heavy atom environments by identifying the atom types positioned at different topological distances.
3. Physicochemical Profile of Favorable Fragments
Twenty-nine active compounds with pIC
50 > 6 (see
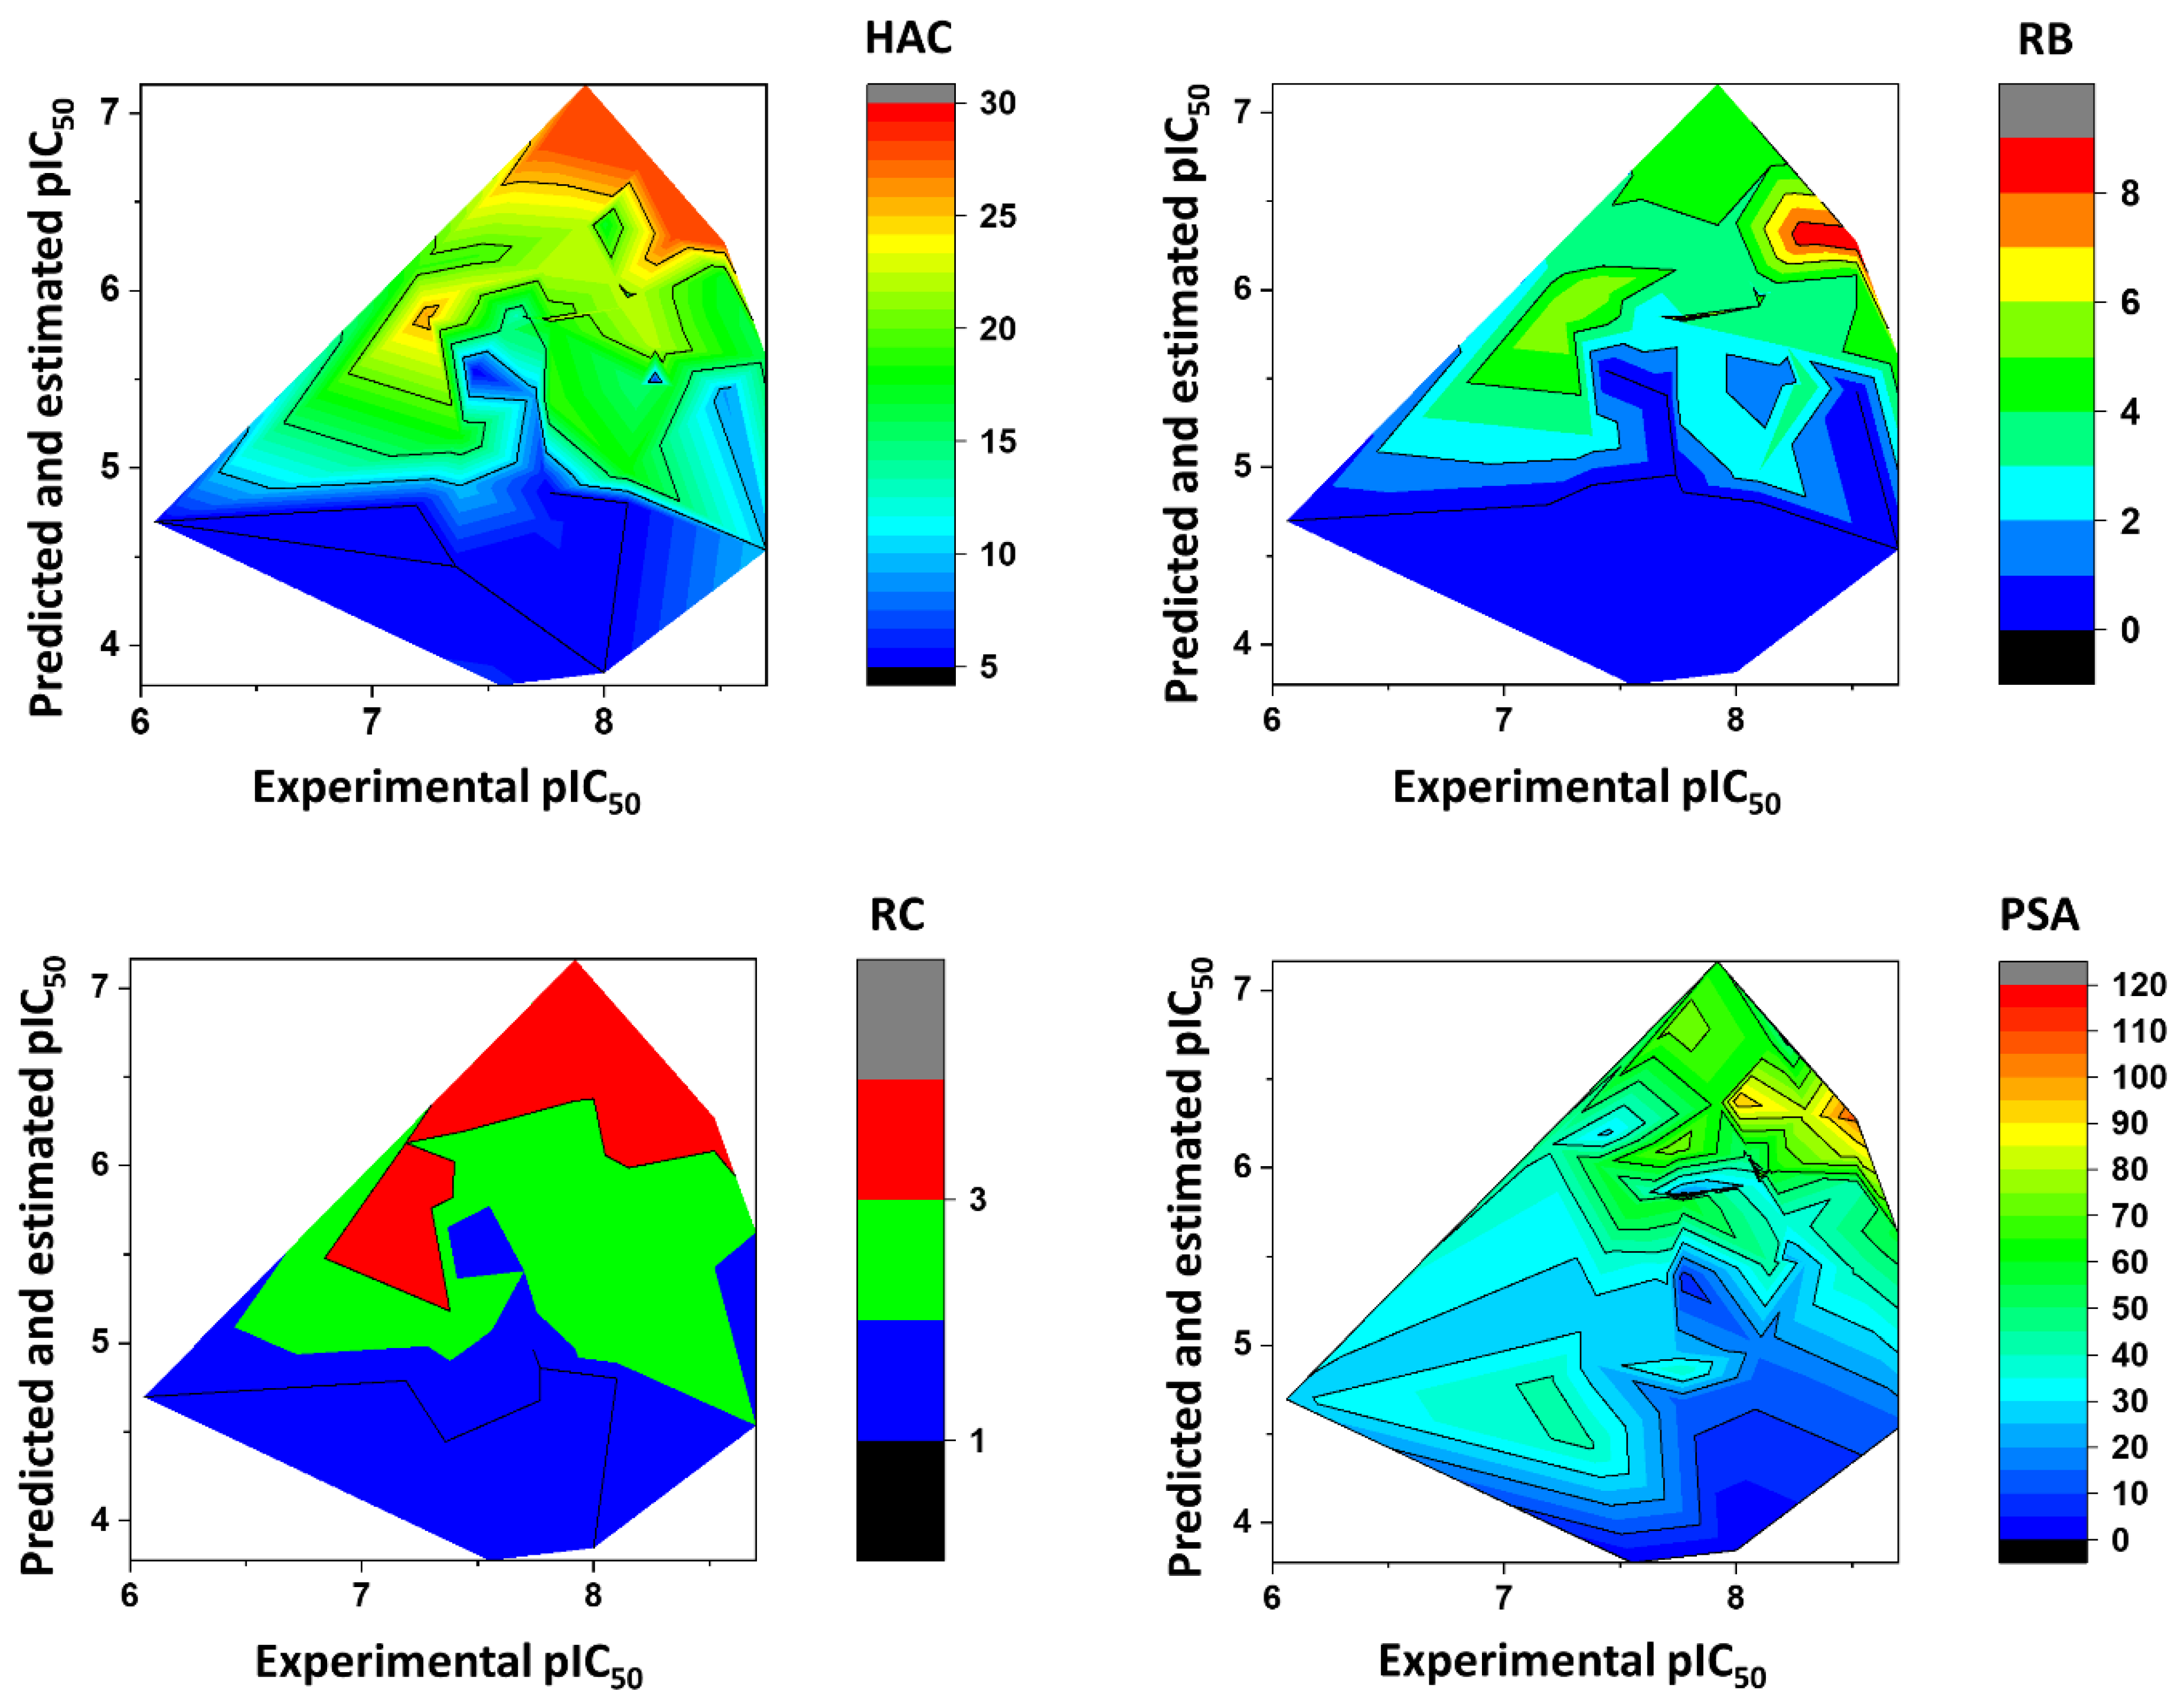
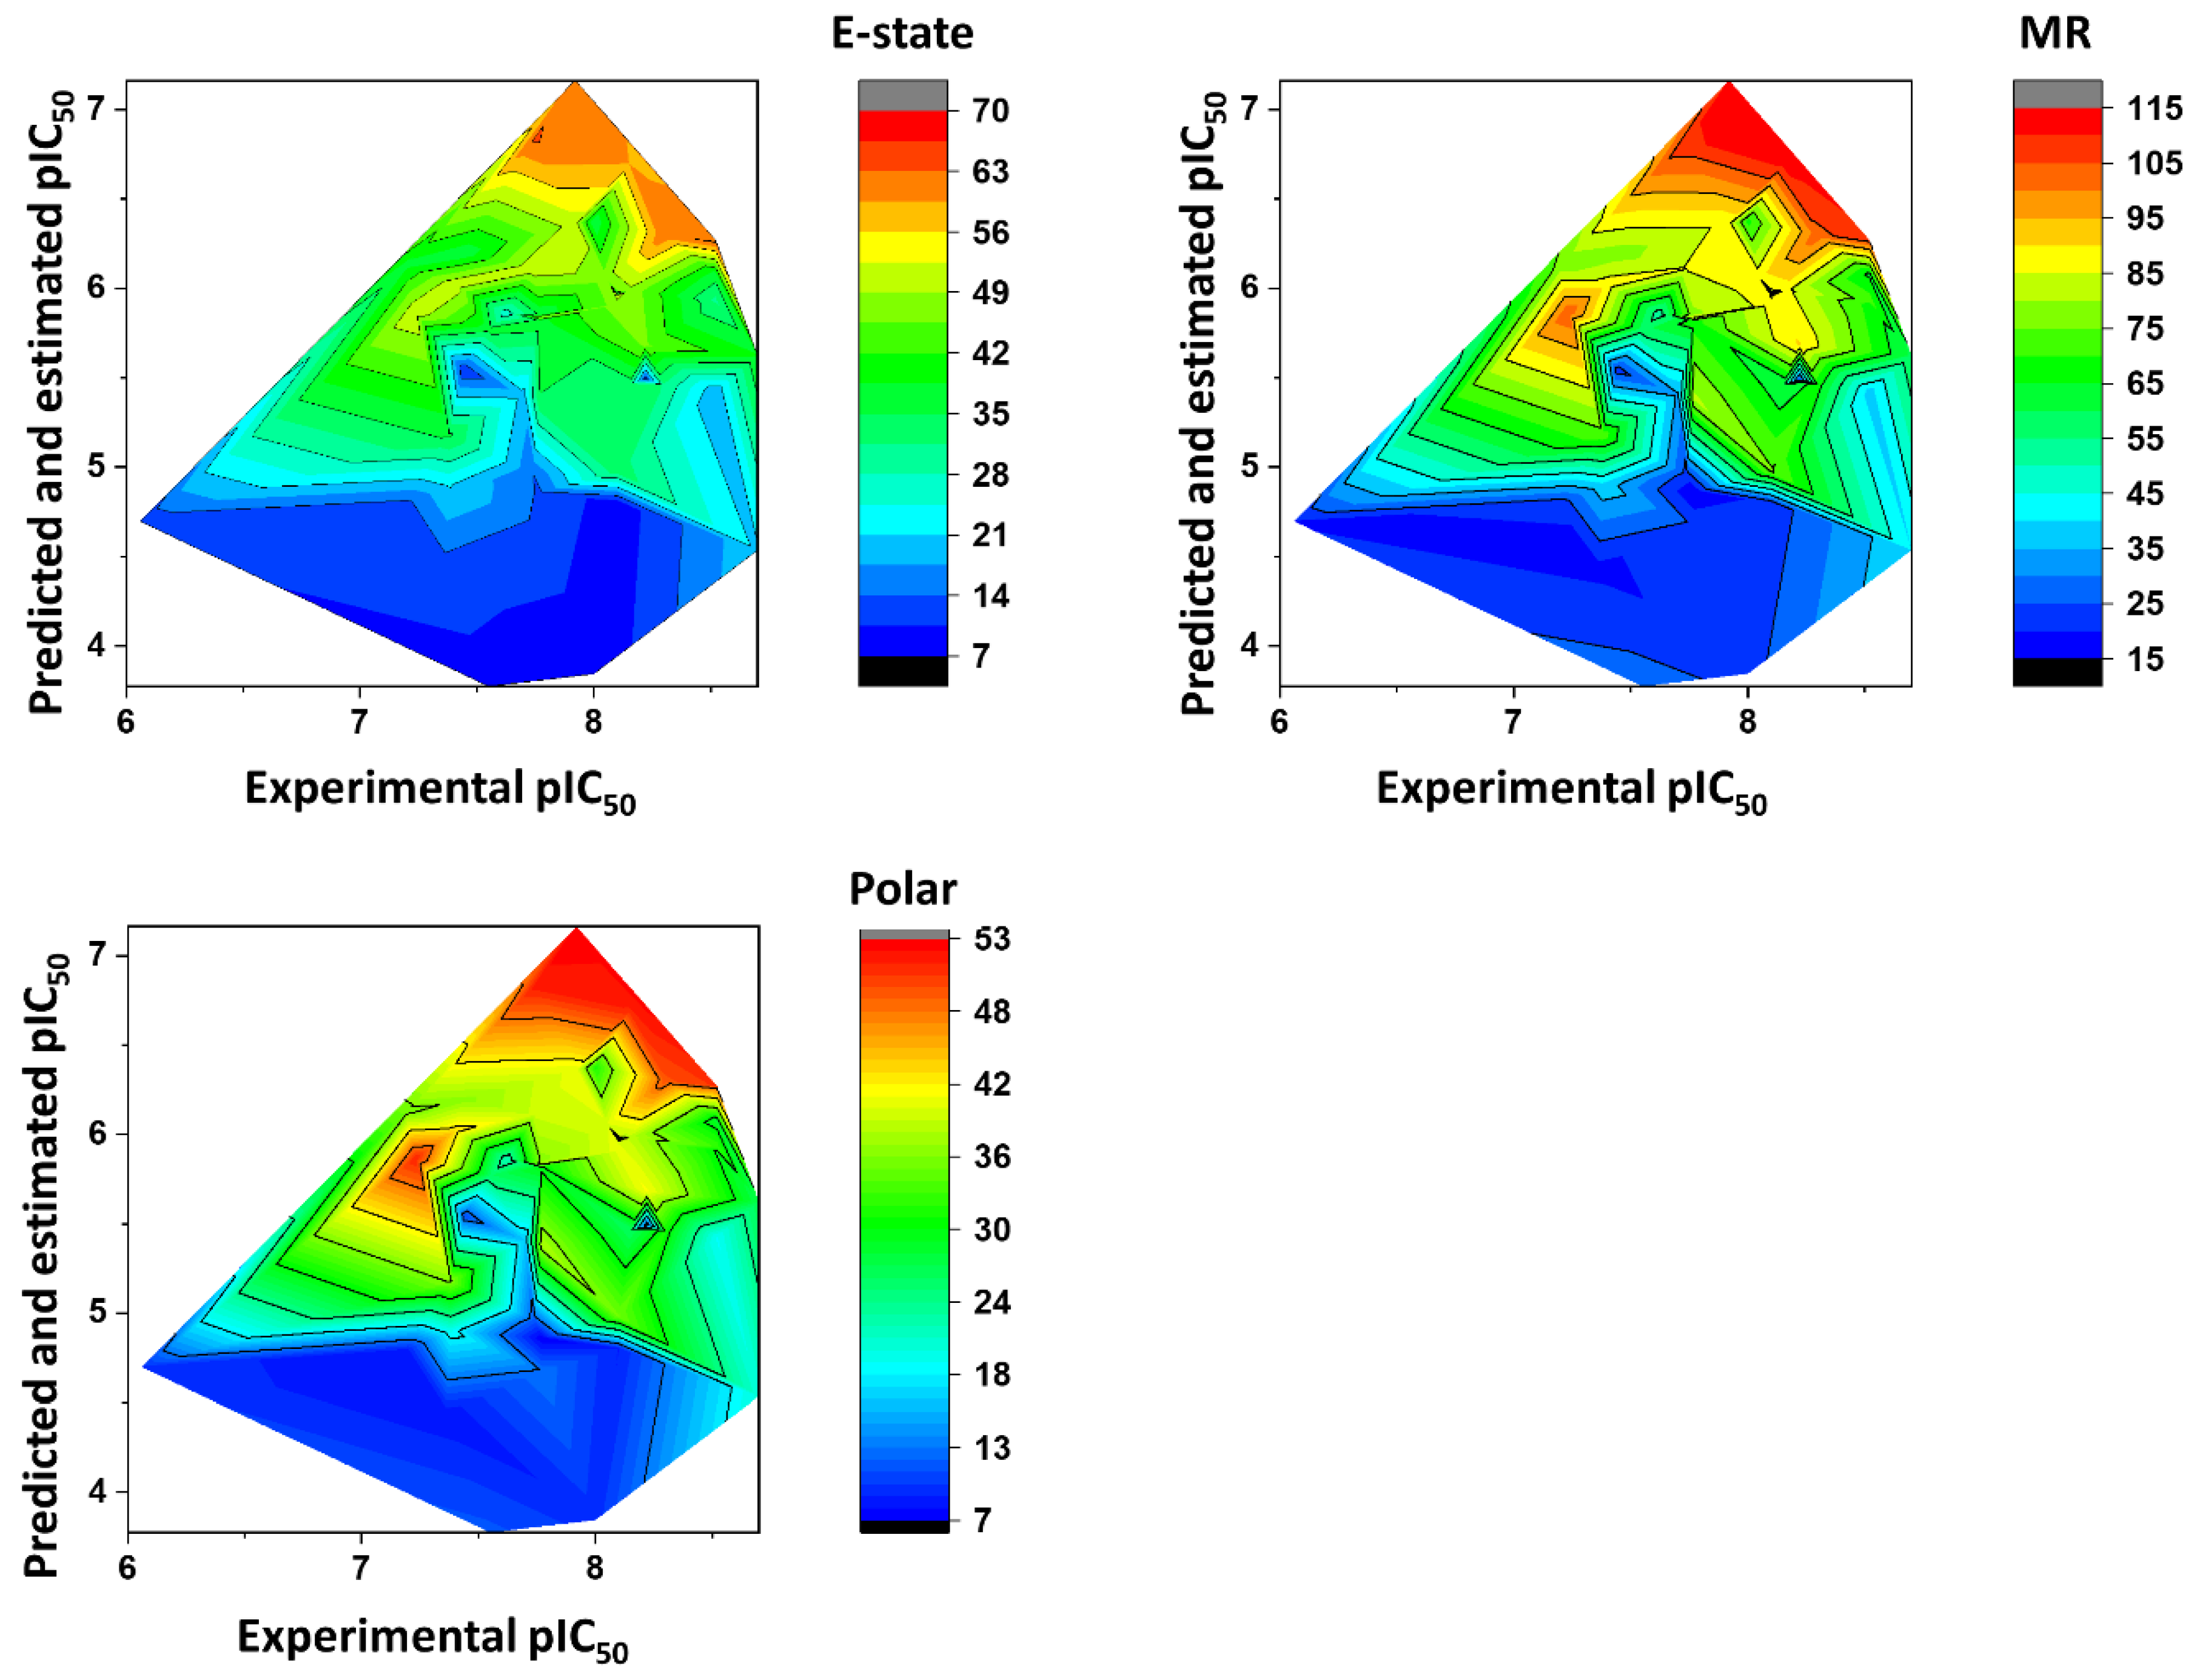
Table S1 for the structures) were selected to construct a collection of 50 fragments. Only molecular fragments that were predicted to enhance the trypanocidal activity (red areas of the contribution maps) were considered in this analysis. Next, physicochemical descriptors were calculated for these fragments and used as an input for the best ANN with the view of predicting their biological activity. Finally, the predicted activity values were correlated with each physicochemical property of the fragment collection. The outcome of this analysis is illustrated as heat maps (
Figure 8,
Figure 9 and
Figure 10), which allowed us to identify a specific physicochemical space that favors trypanocidal activity. The heat maps also correlate the activity of the compounds from which the fragments were extracted and their physicochemical profile.
Figure 8 shows the heat maps for MW,
aLogP, HBD, and HBA. Fragments with MW greater than 260 Da were predicted to be the most active (pIC
50 > 6). For
aLogP, the most active fragments had values predominantly between 2 and 3. Fragments with 0–1 HBD and 1–6 HBAs were predicted to have the highest pIC
50 values.
Figure 9 illustrates the heat maps for HAC, RB, RC, and PSA. As shown in the figure, fragments with HAC values greater than 20 had the highest pIC
50 values. For RB, fragments with two to eight rotatable bonds were the most active. According to the heat maps, fragments with RC values from 2 to 3 were predicted to have the best anti-
T. cruzi profile. Finally, fragments with polar surface area (PSA) predominantly between 50 and 80 Å
2 had the highest pIC
50 values.
Figure 10 shows the heat maps for E-state, MR, and Polar. The ANN predicted the fragments with E-state values between 35 and 63 as being the most active. Fragments with MR ranging from 65 to 115 were predicted to have the highest pIC
50 values. Finally, the Polar descriptor was demonstrated to have optimal values ranging from 30 to 53.
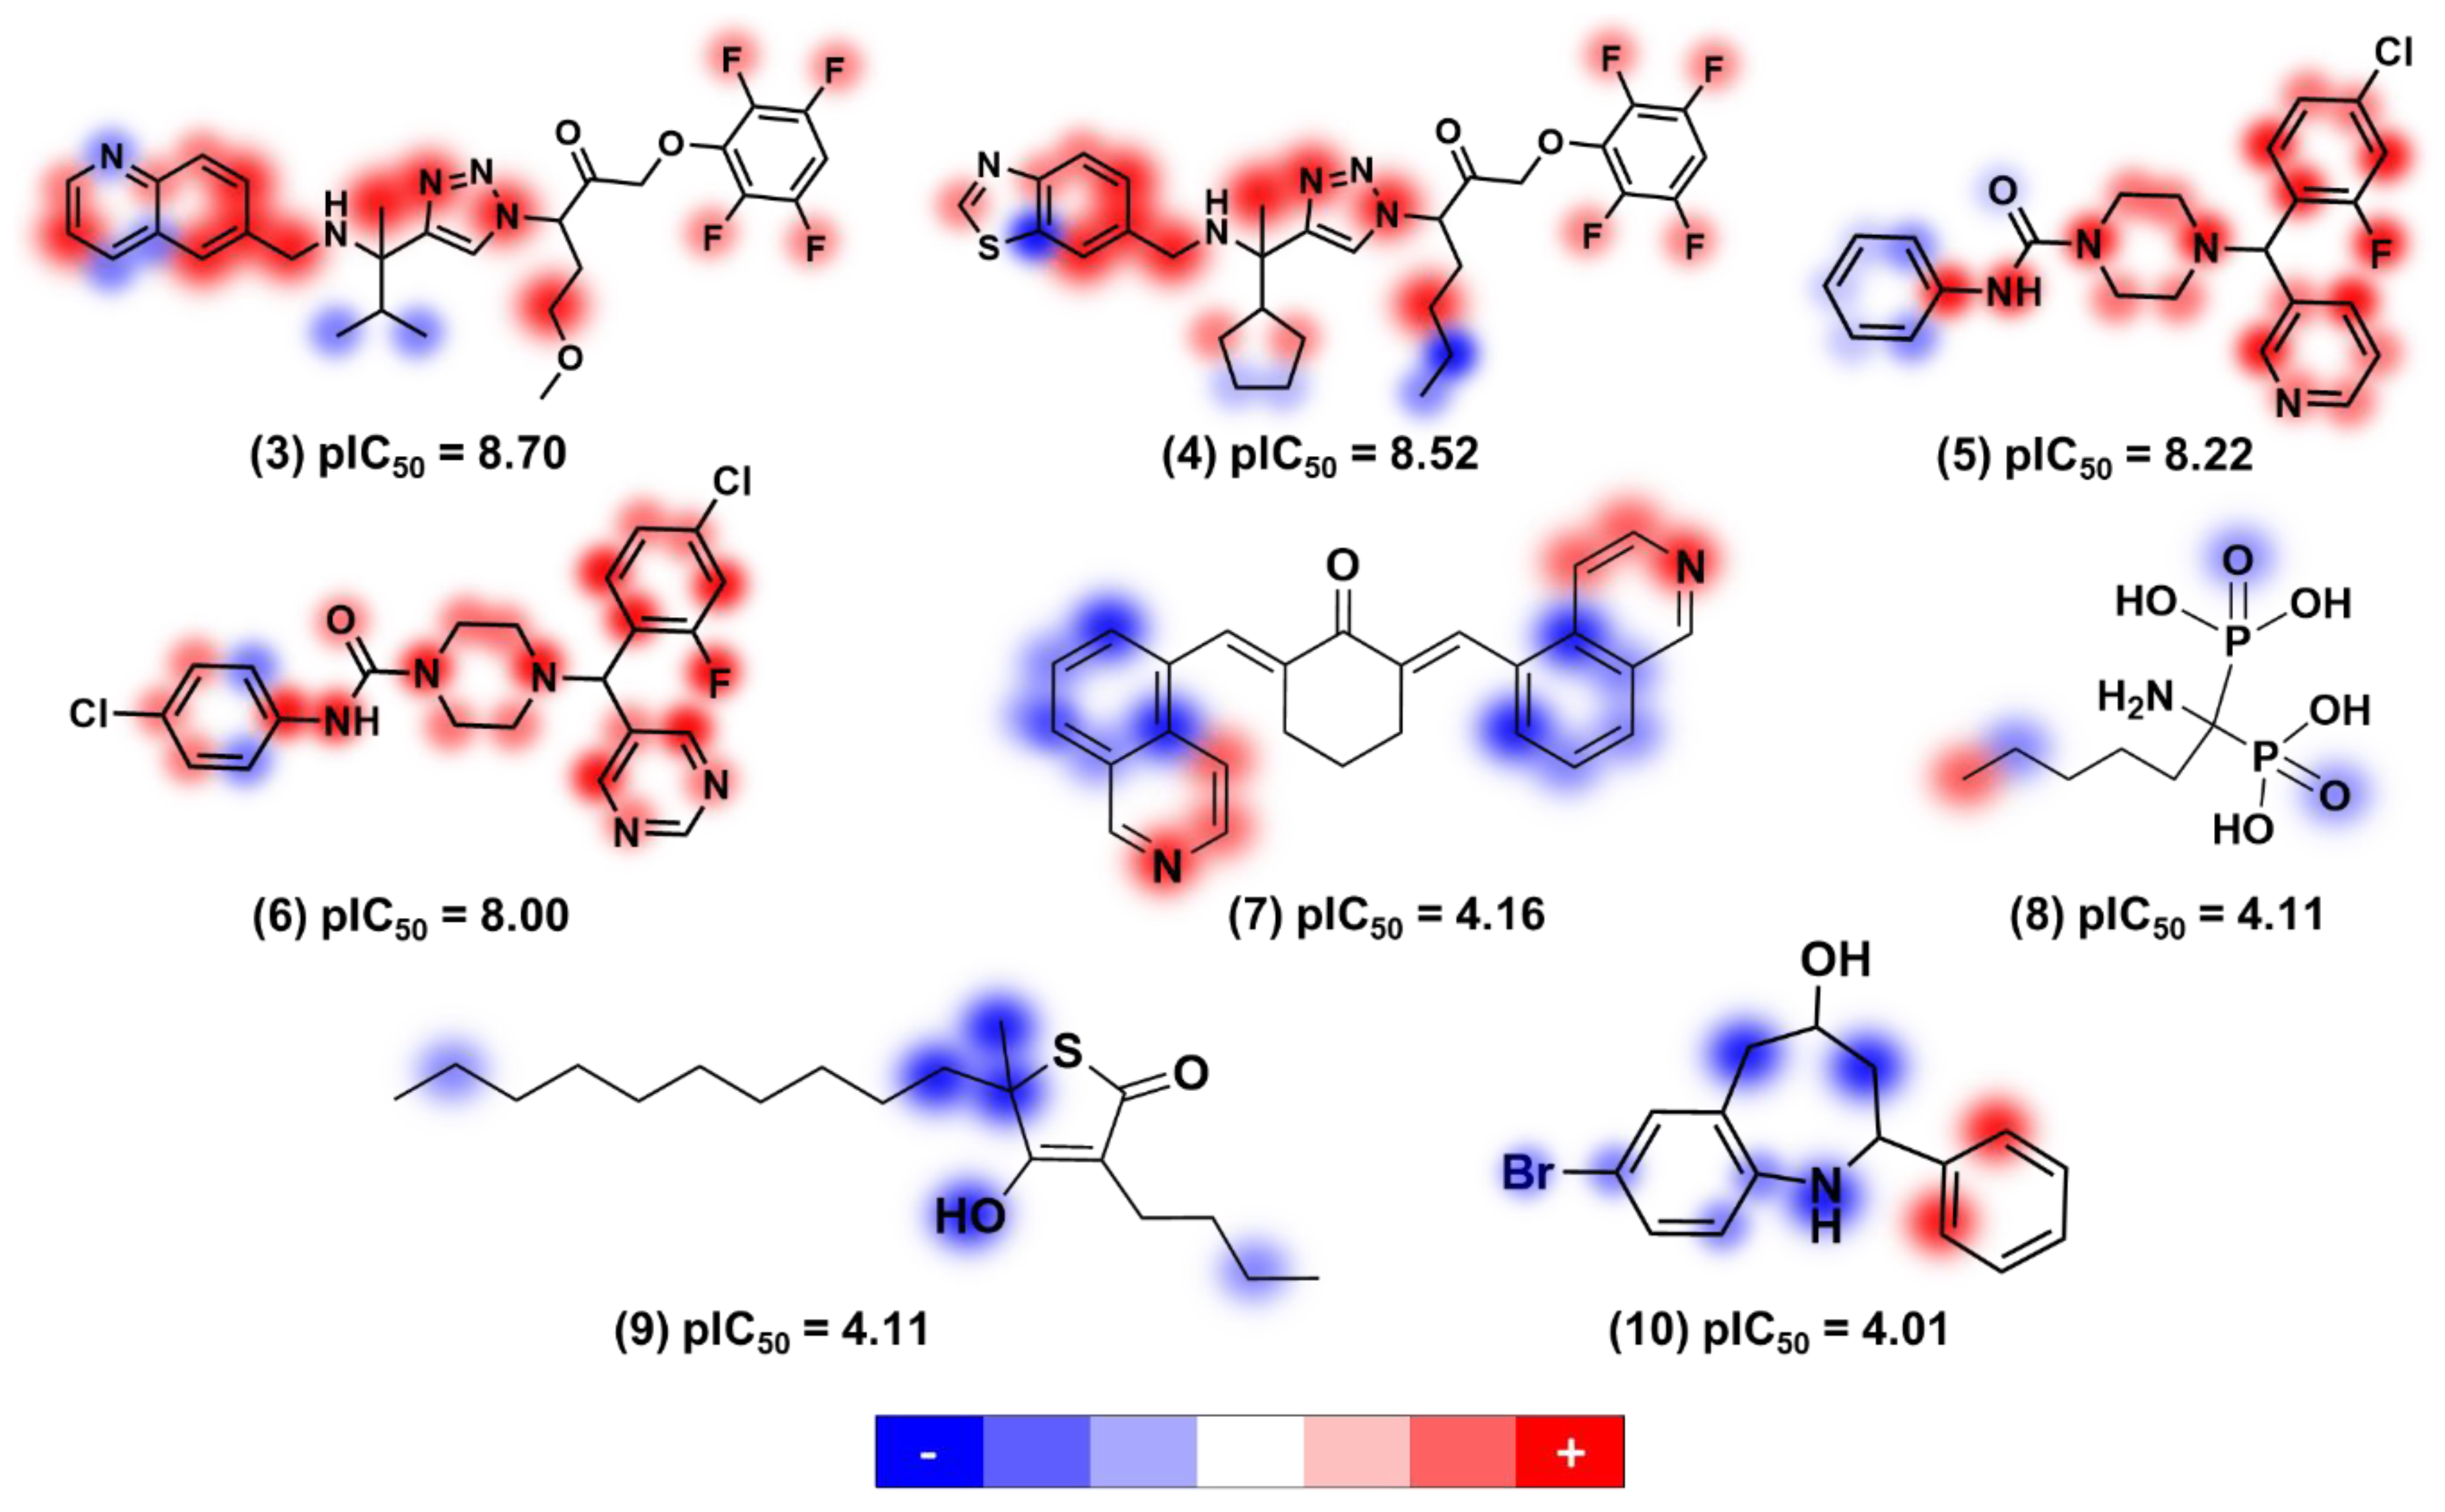
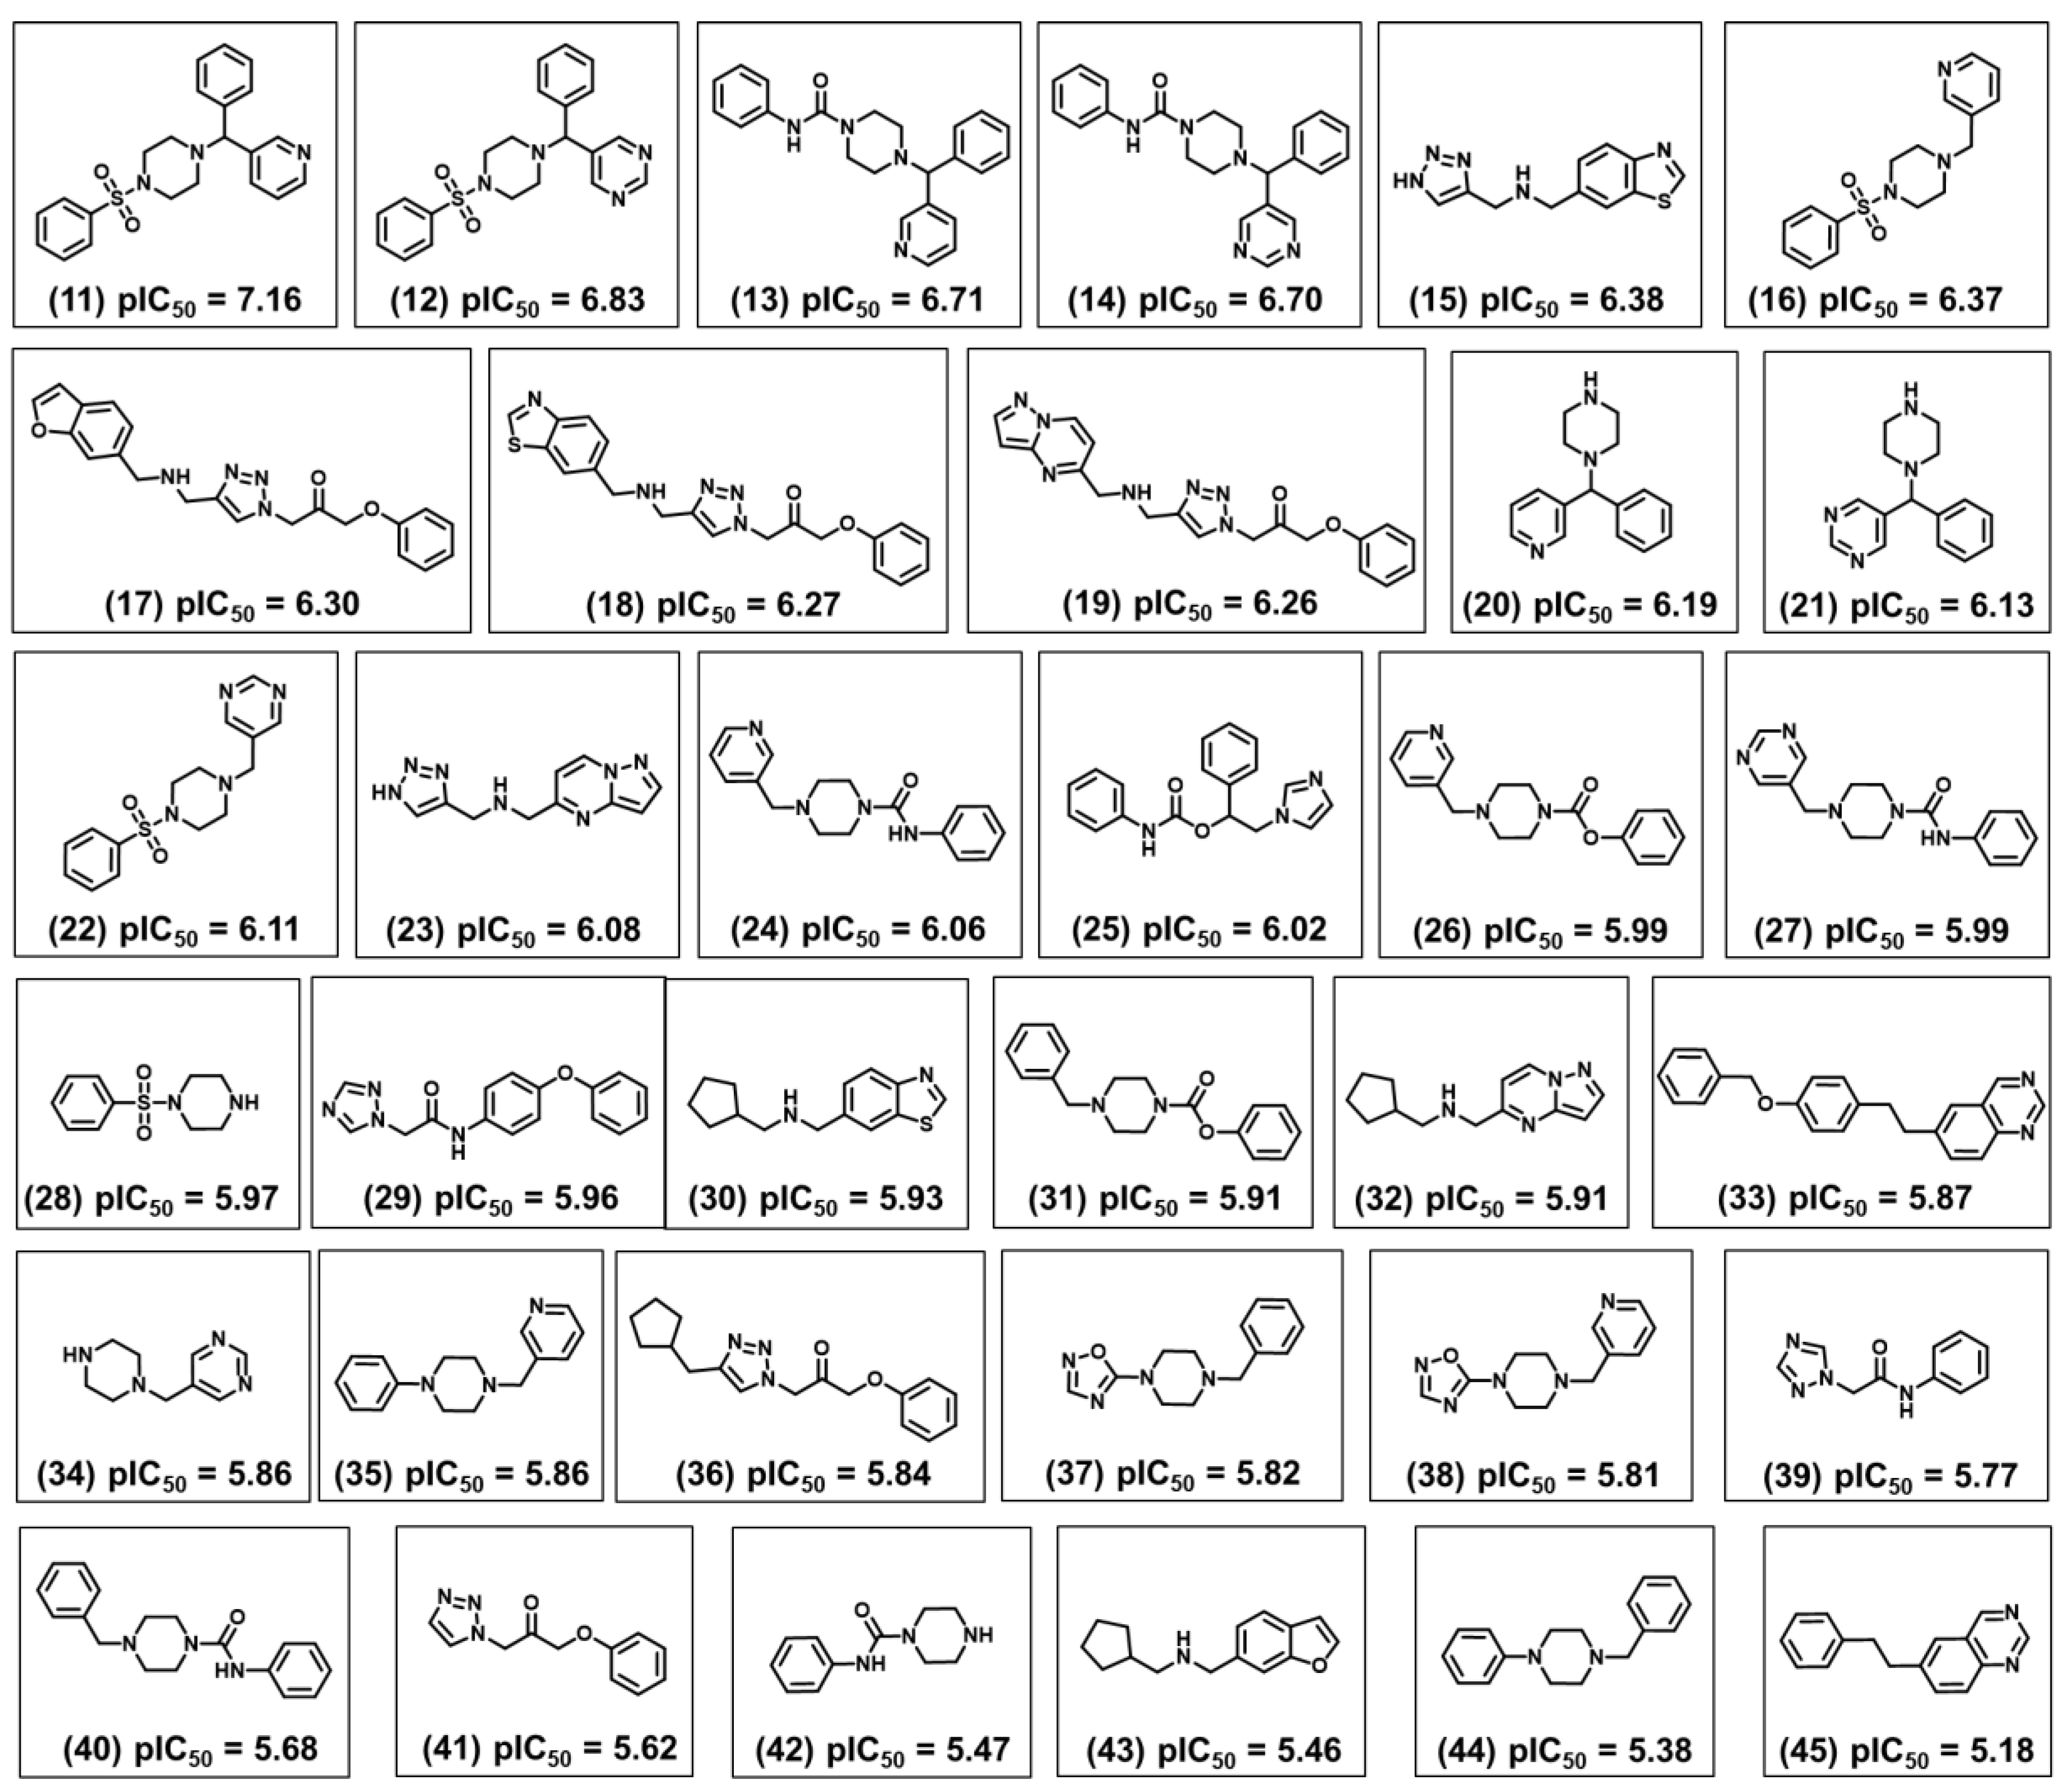
Figure 11 shows the structure and biological activity of 35 fragments that were predicted to be the most promising according to their trypanocidal profile. This group is characterized by a diversity of chemical motifs having two to four rings with the predominant groups being pyridine, pyrimidine, benzene, piperazine, triazole, benzothiazole, benzofuran, oxadiazole, and pyrazolopyrimidine. The four most active fragments from this collection have a phenylsulfonyl-piperazine (fragments 11 and 12) or a phenylpiperazine-carboxamide moiety (fragments 13 and 14) linked to two aromatic rings that are either pyridine, pyrimidine, or benzene. Replacing one of these aromatic rings with a hydrogen, such as in 16 and 22, led to a reduction of the biological activity. The same effect was observed for 24 and 27, in which one aromatic ring was kept and the benzene was replaced with a hydrogen. The replacement of the pyridine in compound 20 with a pyrimidine in compound 21 led to a subtle lowering of the pIC
50 value. Another substitution that affected the biological activity was the exchange between the benzofuran, benzothiazole, and pyrazolopyrimidine in fragments 17, 18, and 19. Among these three compounds, the benzofuran derivative was the most potent. Furthermore, replacing the pyrazolopyrimidine in compound 23 with a benzothiazole in compound 15 increased the trypanocidal activity.
After analyzing the other molecular scaffolds, it is worth mentioning that for fragments 37 and 38, it was not possible to establish a direct relationship between the presence of the oxadiazole group and trypanocidal activity. Replacing the oxadiazole in compound 37 with a phenyl in 44 decreased the pIC
50 value; however, the same modification involving fragments 35 and 38 produced the opposite effect. Among cyclopentane derivatives 30, 32, and 43, replacing the benzothiazole in fragment 30 with pyrazolopyrimidine and benzofuran in 32 and 43, respectively, decreased the biological activity; the most significant effect occurred for the benzothiazole-benzofuran exchange, which resulted in a decrease of 0.47 in the pIC
50 value. Finally, the insertion of a methyl cyclopentane moiety at the triazole ring of 41 resulted in fragment 36 and increased the trypanocidal activity.
Figure 12 shows the overall scheme for the design of novel trypanocidal compounds based on the workflow proposed in this work.
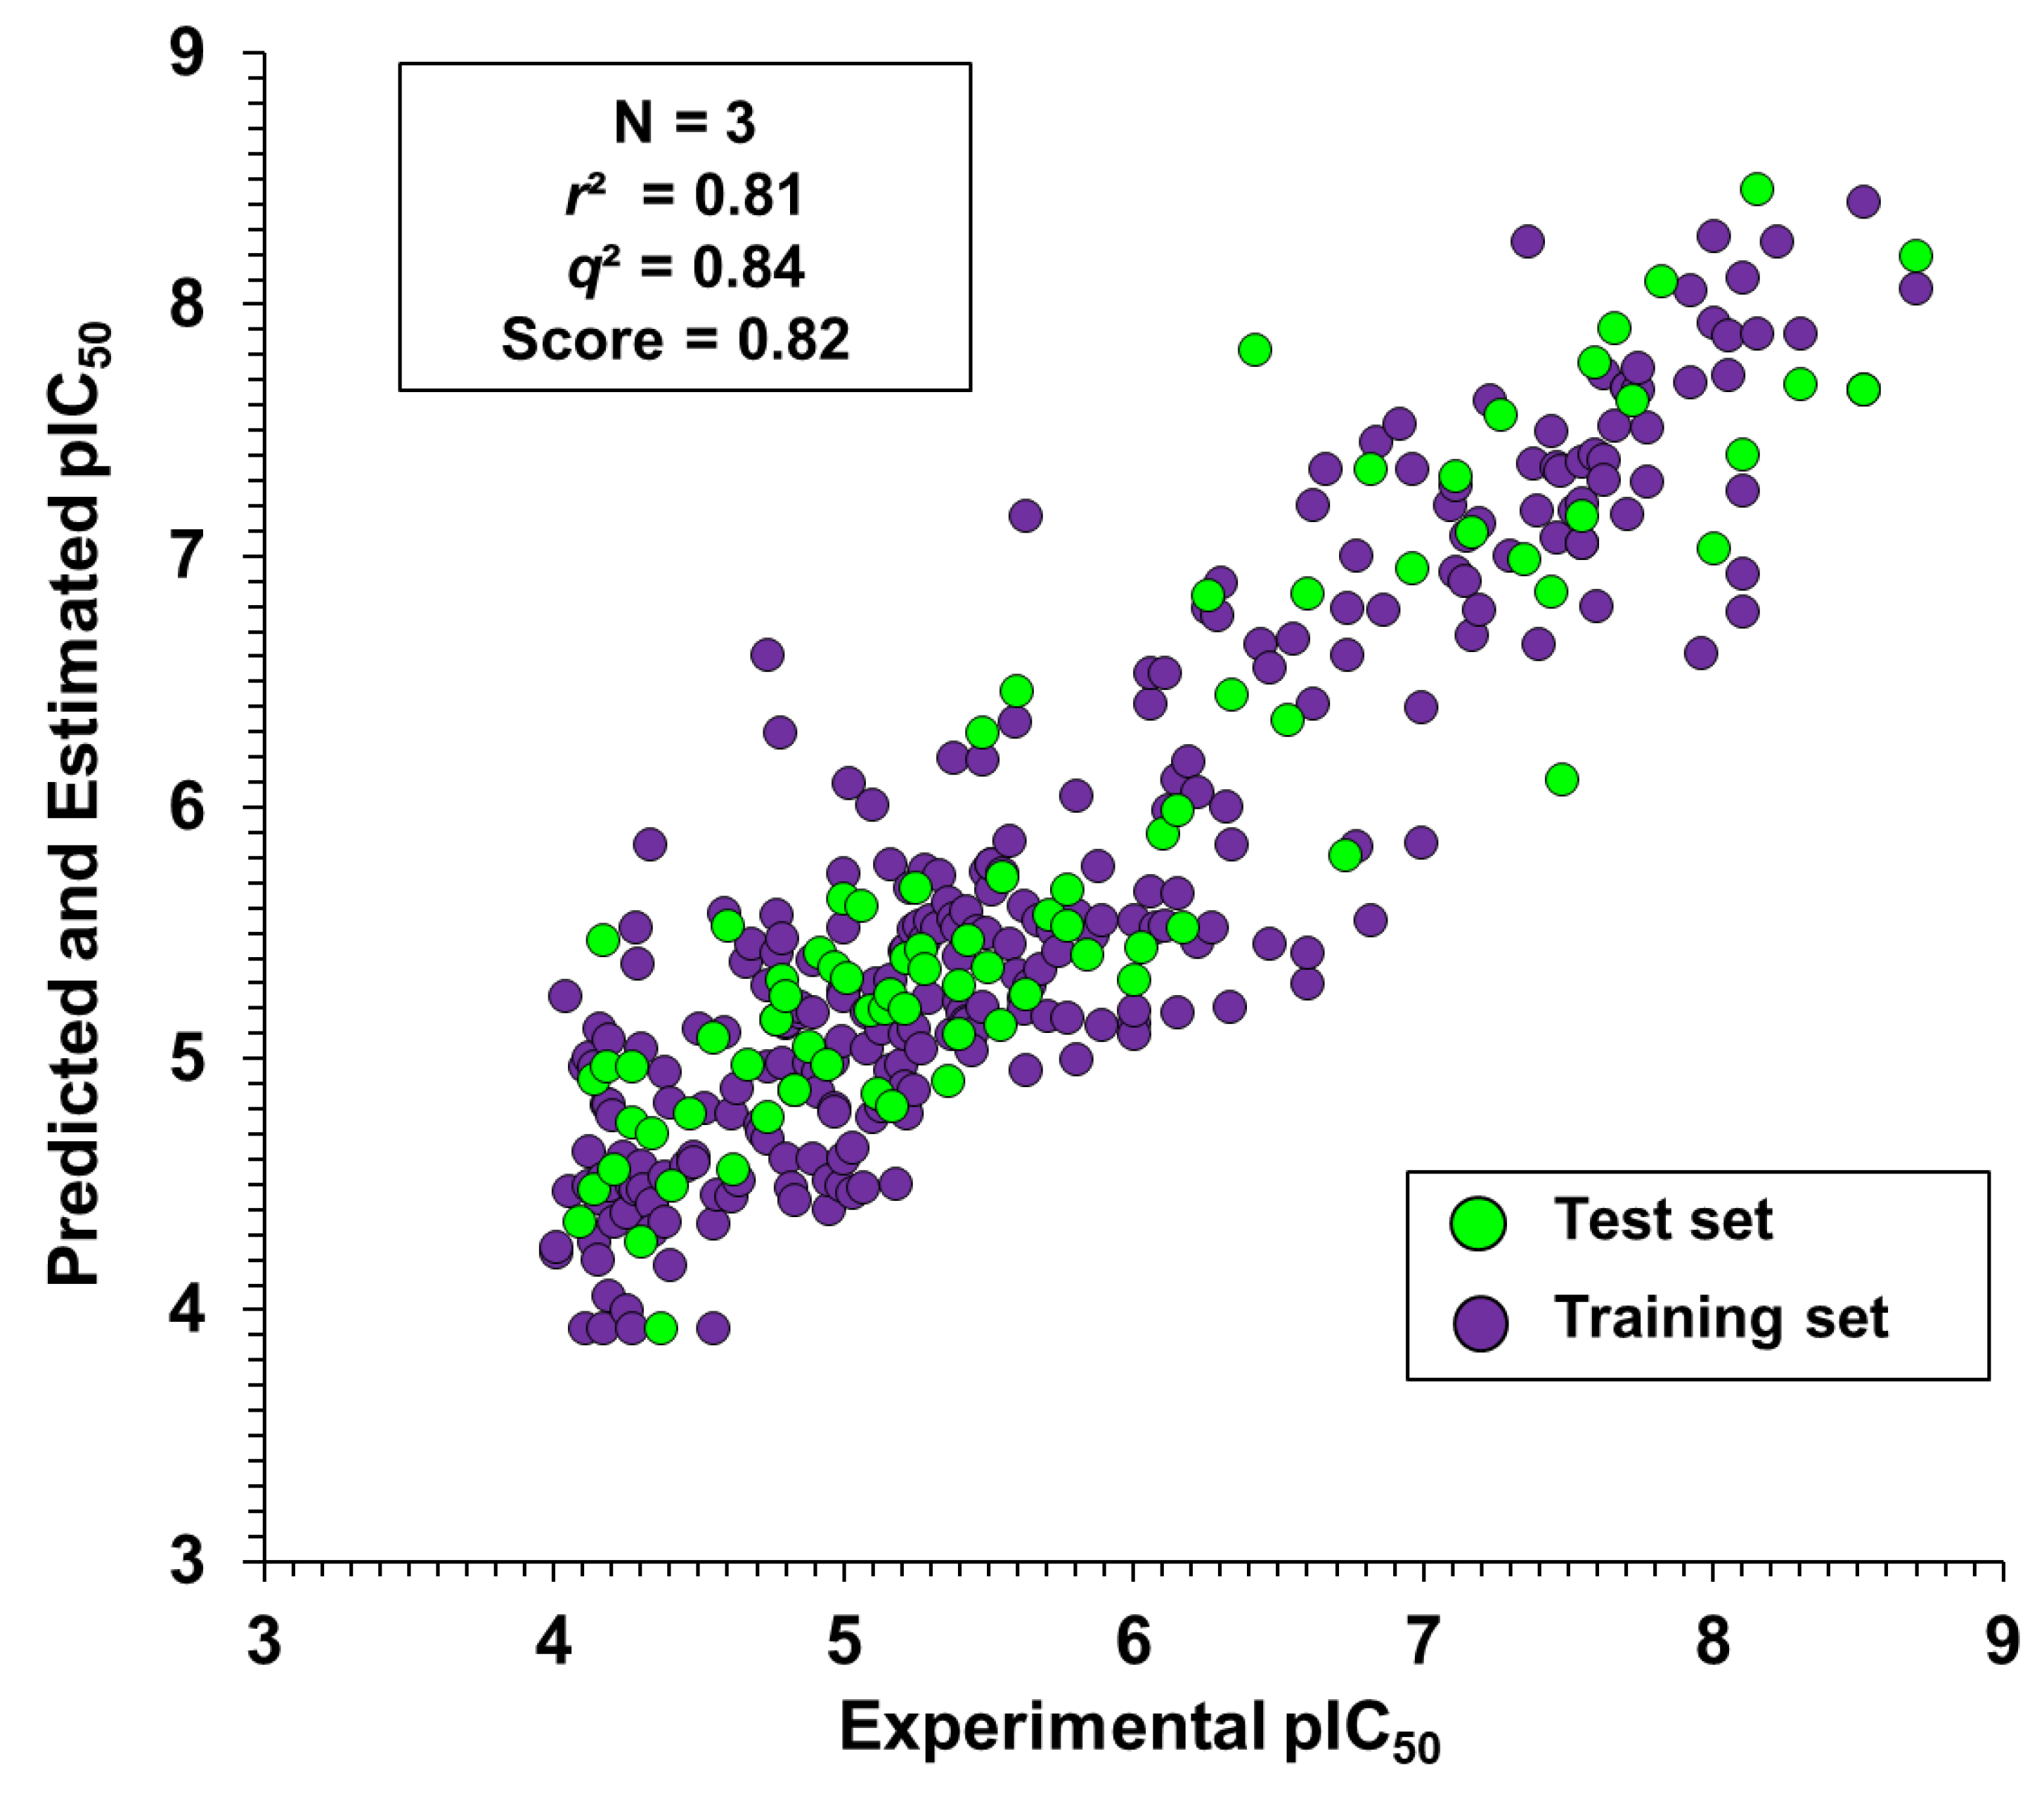
4. Discussion
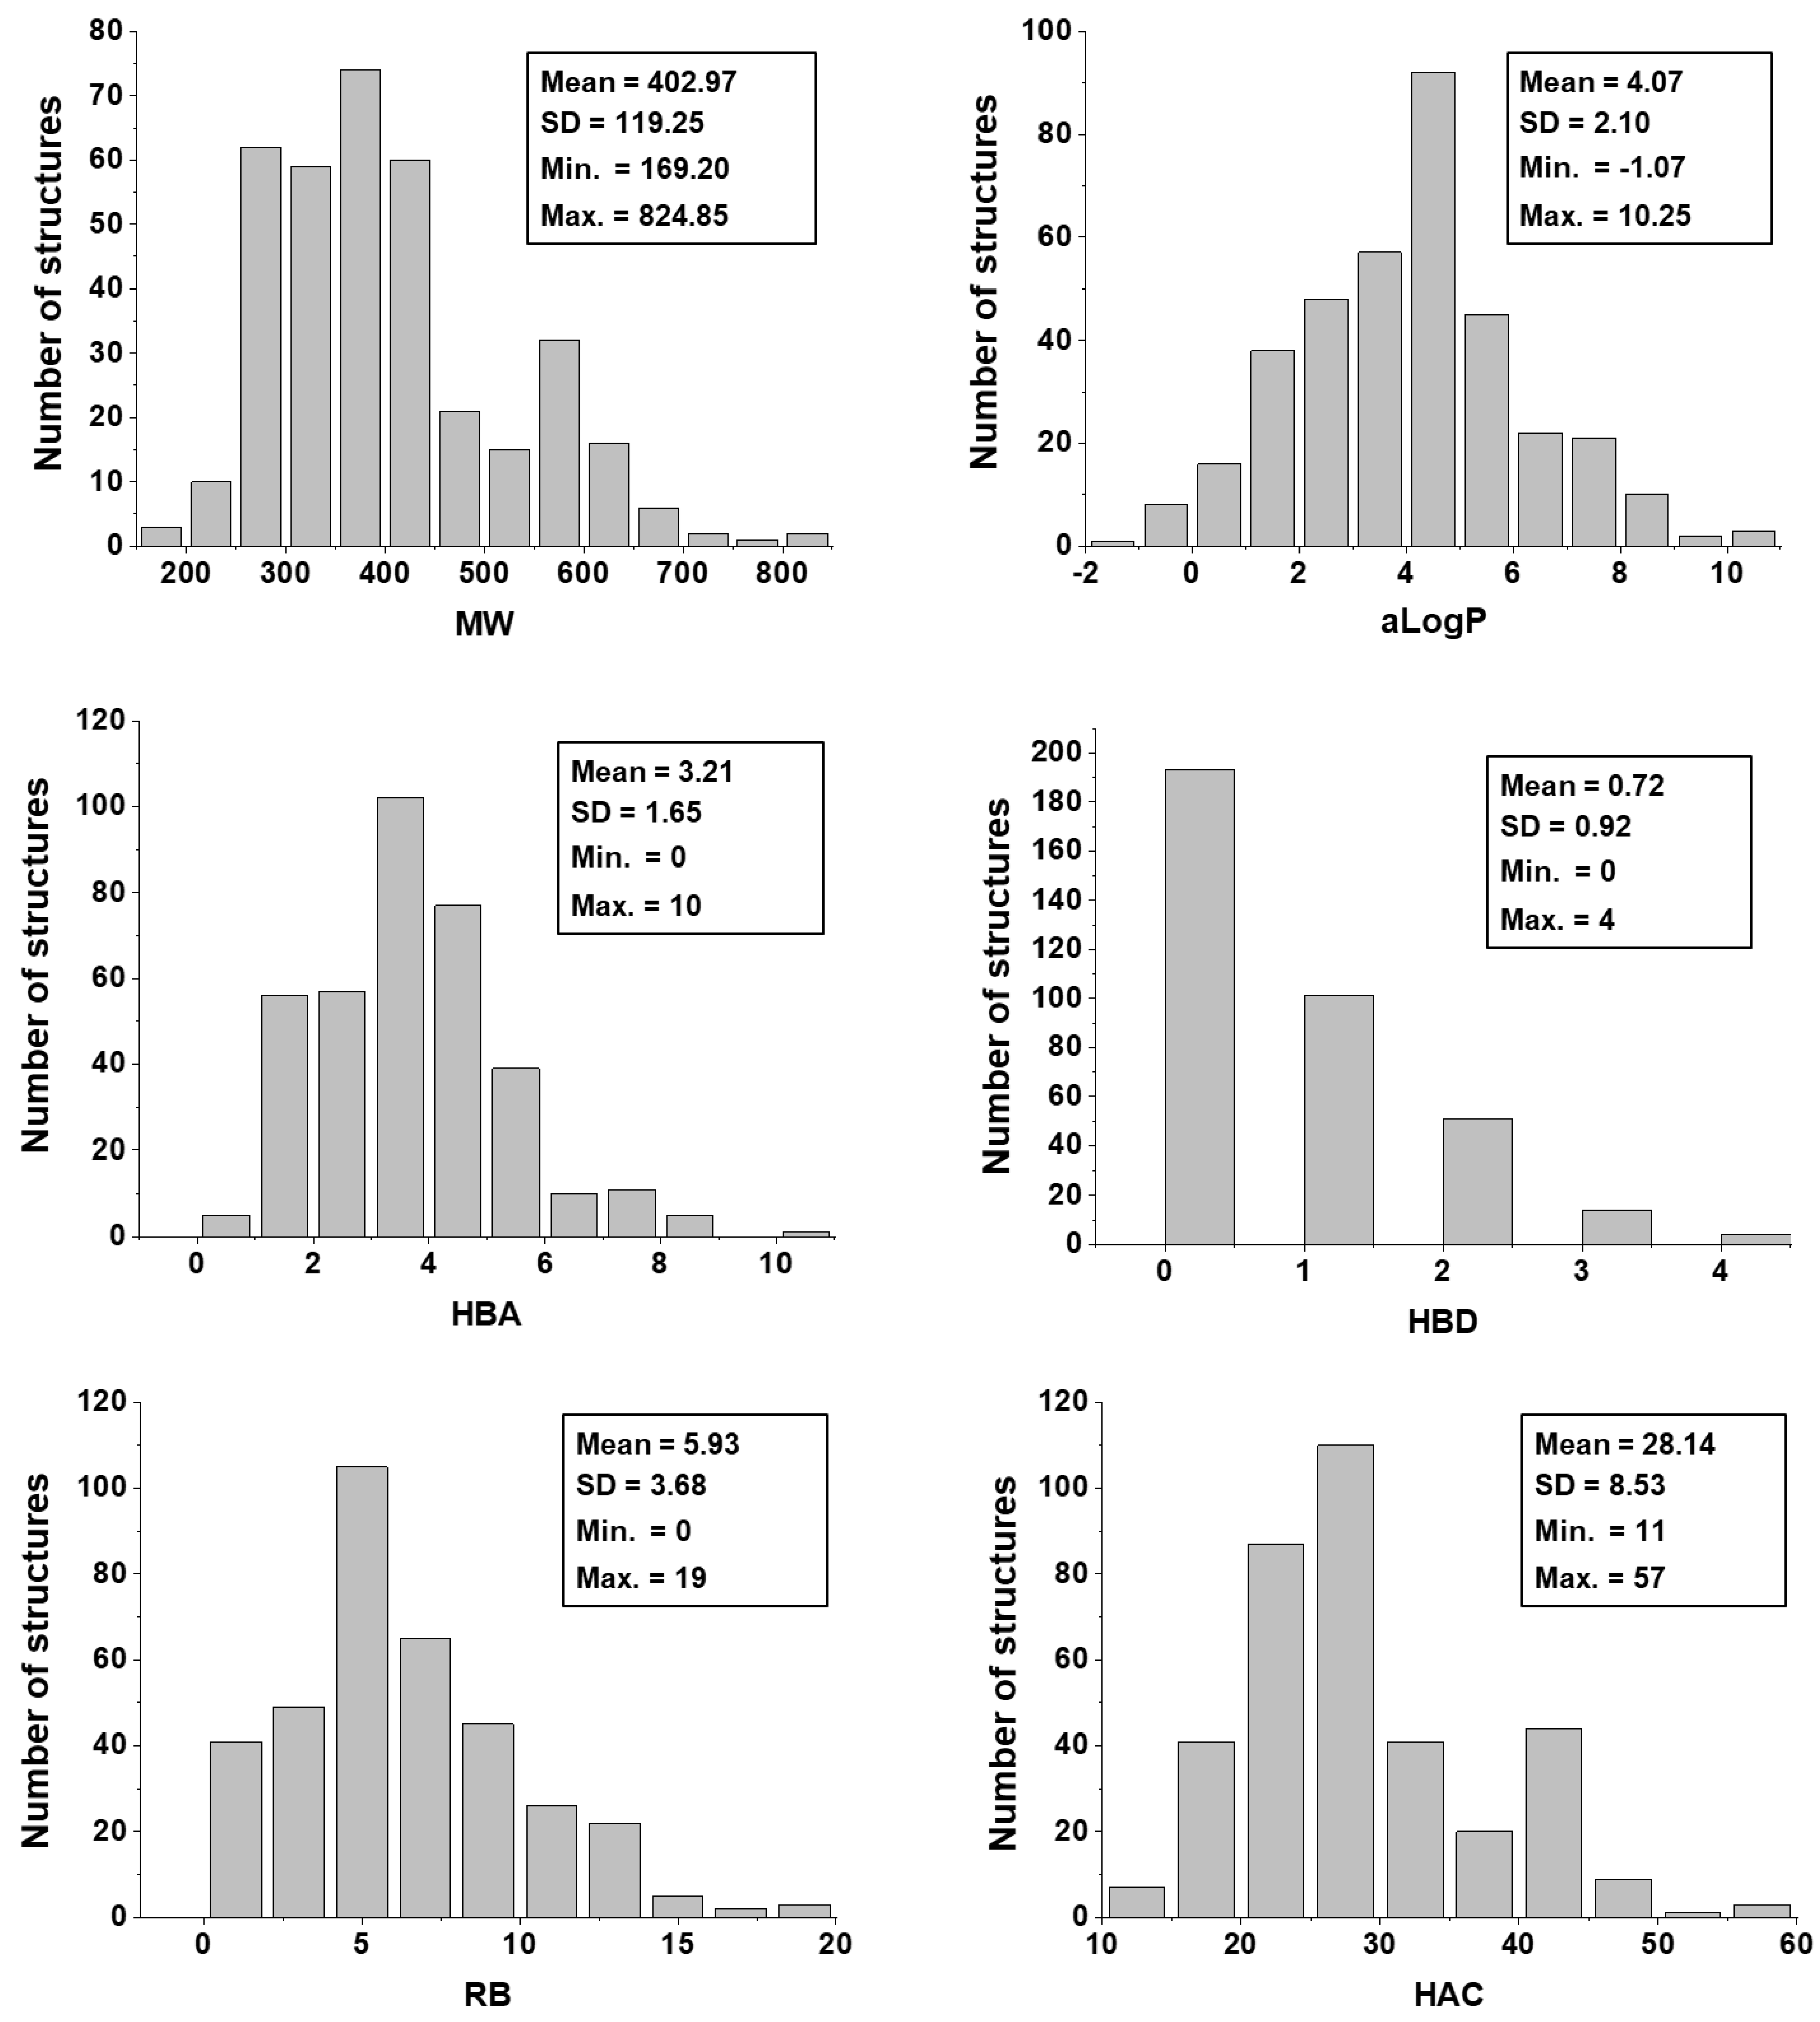
The physicochemical characterization of the dataset revealed that most compounds follow the Lipinski’s Rule of Five, as illustrated in
Figure 3 [
65]. The determinant role played by these properties was shown by the analysis of the weights that were attributed to each physicochemical descriptor at the hidden-layer neurons of the best ANN (
Table 4). MW,
aLogP, HBA, and HBD exhibited the greatest difference between the number of positively and negatively modulated neurons. MW positively weighted six (85.7%) out of the seven hidden-layer neurons, and
aLogP, HBA, and HBD positively weighted five (71.4%) neurons. These four descriptors are closely related to bioavailability and the ability to permeate cell membranes, and therefore, the capacity of a compound to reach its molecular target. The number of rotatable bonds, which had a mean value of 5.93 for the whole dataset, also modulated most neurons in the same way—71.4% of the hidden-layer neurons were negatively weighted by this property. HAC and RC positively weighted four out of seven hidden-layer neurons. The predominantly positive weighting profile of HAC and RC can be associated with that of MW and
aLogP; an increase in the first two properties generally leads to an increase in the latter two. Another finding worth mentioning is that the KPLS models led to the identification of a set of fragments that are strongly associated with enhanced trypanocidal activity. Most of these fragments contain between two and three rings, which follows the physicochemical profile identified by the ANN and shown in the heat maps for these chemotypes (
Figure 9). Aromatic nitrogen-containing rings and fused rings are the most common structural features identified within this collection. Cyclopentane and piperazine are the only representants of aliphatic rings. Functionalized short linkers (from one to four atoms) containing amine, amide, sulfone, or ester groups are found between the cyclic groups. Nonfunctionalized linkers are almost exclusively restricted to methylene groups. Another aspect disclosed in this study was that the heat maps for the favorable fragments showed a more restricted physicochemical space compared to the results for the full molecules. For example, the following physicochemical ranges were predicted to be the most adequate for the fragment collection: MW > 260 Da;
aLogP: 2–3; PSA: 50–80 Å
2; E-state: 35–63; MR: 65–115; and Polar: 30–53. These findings can be useful guidelines for monitoring the physicochemical profile in Chagas’ disease drug design efforts using fragment-like compounds as starting points.

 and
and 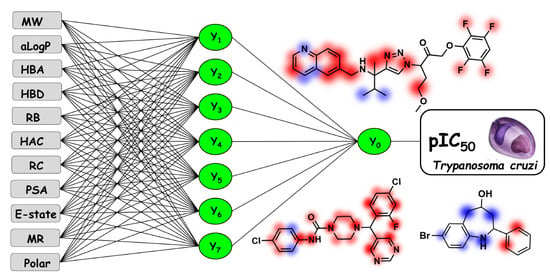


