Abstract
Although the regulatory function of miRNAs and their targets have been characterized in model plants, a possible underlying role in the cotton response to herbivore infestation has not been determined. To investigate this, we performed small RNA and degradome sequencing between resistant and susceptible cotton cultivar following infestation with the generalist herbivore whitefly. In total, the 260 miRNA families and 241 targets were identified. Quantitative-PCR analysis revealed that several miRNAs and their corresponding targets exhibited dynamic spatio-temporal expression patterns. Moreover, 17 miRNA precursors were generated from 29 long intergenic non-coding RNA (lincRNA) transcripts. The genome-wide analysis also led to the identification of 85 phased small interfering RNA (phasiRNA) loci. Among these, nine PHAS genes were triggered by miR167, miR390, miR482a, and two novel miRNAs, including those encoding a leucine-rich repeat (LRR) disease resistance protein, an auxin response factor (ARF) and MYB transcription factors. Through combined modeling and experimental data, we explored and expanded the miR390-tasiARF cascade during the cotton response to whitefly. Virus-induced gene silencing (VIGS) of ARF8 from miR390 target in whitefly-resistant cotton plants increased auxin and jasmonic acid (JA) accumulation, resulting in increased tolerance to whitefly infestation. These results highlight the provides a useful transcriptomic resource for plant-herbivore interaction.
1. Introduction
Cotton (Gossypium spp.) is a widely cultivated economic crop utilized for its fiber and oil-yielding capabilities that are negatively impacted by both abiotic and biotic stresses. G. hirsutum is an allotetraploid species (AtAtDtDt, 2n = 4× = 52, (AD)1 genome) comprising At- and Dt-subgenome that originated from the two diploid cotton species G. raimondii (D5) and G. arboreum (A2) [1]. Although transgenic cotton expressing Bacillus thuringiensis (Bt) cry toxins have been used successfully to control lepidopteran pests, including Helicoverpa armigera and Pectinophora gossypiella, similar technology has yet to be fully developed for activity against phloem-feeding pests, such as whitefly, aphid, and leafhopper [2,3,4]. Whitefly (Bemisia tabaci) is a destructive pest of many agronomically important crops, such as tobacco, tomato, lettuce and cotton, and causes extensive crop damage by directly sucking phloem sap and vectoring diverse viruses [5]. Recently, Shukla et al. (2016) identified a candidate protein from edible fern (T. macrodonta) that was toxic to whitefly [6]. Zhu et al. previously assessed the susceptibility of 400 elite cotton lines to whitefly infestation and identified 42 lines between resistance and the susceptibility spectrum [7].
A major portion of the eukaryote genome consists of non-coding sequences that were previously regarded as junk DNA. Non-coding RNAs (ncRNAs) are a group of regulatory molecules that fall into the following two major classes, long ncRNAs (lncRNAs), which are > 200 bp, and small ncRNAs (18–26 nt in length), which can be further divided into microRNAs (miRNA) and short interfering RNAs (siRNA). Primary miRNA transcripts are formed as miRNA precursors (pre-miRNA) from lncRNAs possessing a stem-loop structure. The DICER-LIKE 1 (DCL1) enzyme processes the pre-miRNAs to form miRNA/miRNA*duplexes that are then assembled into the RNA-induced silencing complex (RISC) [8,9]. The mature miRNAs (20–24 nt) subsequently promote the cleavage of target mRNA sequences through base pairing. To date, intensive studies have been performed to examine miRNA targeting of protein-coding genes, though research on endogenous target mimics (eTM) is less common. Consequently, it is becoming increasing clear that small RNAs play important roles in suppressing, the expression of diverse target genes, both transcriptionally and post-transcriptionally, including those involved in the development, abiotic stress responses, and plant disease resistance [10,11,12].
miRNAs trigger the formation of a specialized class of phasiRNAs called trans-acting siRNA (tasiRNA) from non-coding TAS genes [13]. Double-strand RNAs (dsRNAs) generate tasiRNAs from miR173-, miR390-, and miR828-cleaved target transcripts from TAS1/2, TAS3 and TAS4 [14,15]. The generation of these miRNA-mediated tasiRNAs requires the involvement of RNA-dependent RNA polymerase 6 (RDR6), which produces dsRNAs and 21nt secondary siRNAs that are subsequently cleaved by DICER-LIKE 4 (DCL4). To date, approximately 3300 PHAS loci have been identified in 23 plant species, with most exhibiting distinct expression profiles that are associated with particular cellular conditions such as developmental stage, biotic stress (e.g., viral infection), and abiotic stress [16]. In addition to non-coding PHAS loci, some PHAS loci have also been identified in the protein coding regions of nucleotide-binding (NB), leucine-rich repeat (LRR), and pentatricopeptide repeat (PPR) proteins as well as the MYB transcription factor, all of which are encoded by disease resistance-related genes [17].
Plant-insect/pathogen interaction has forced plants to evolve elaborate defense systems, including non-host resistance via physical barriers, pathogen-associated molecular pattern (PAMP)-triggered immunity (PTI), and effector-triggered immunity (ETI) [18]. Plant responses to herbivore infestation are regulated by the interaction of diverse phytohormones such as jasmonic acid (JA), salicylic acid (SA), ethylene (ET), auxin and abscisic acid (ABA) [19]. JA can induce plant defenses through activation of lipoxygenase (LOX), 12-oxo-phytodienoic acid (OPDA) and cytochrome P450 expression during the susceptible plant-herbivory interaction [20]. The only known NB-LRR disease resistance genes (R genes) recognize pathogen/microbial effectors and play important roles in defense or symbiotic plant-pathogen/herbivore interactions [21,22].
Small RNAs (sRNAs) play critical roles in plant herbivore stress response by regulating the expression of diverse downstream genes. Among plant-herbivore interactions, a previous study reported on the expression profile of miRNAs and phasiRNAs in tobacco plants (Nicotiana attenuata) following infestation with tobacco hornworm (Manduca sexta). That study revealed that miRNAs were involved in both JA-dependent and JA-independent plant defense response signaling pathways [23]. Silencing of RNA-DIRECTED RNA POLYMERASE1 (RDR1) in Nicotiana attenuata induced target gene expression and reduced JA levels, which enhanced ethylene biosynthesis and increased plant susceptibility to chewing herbivores [24]. Among plant and phloem-sucking insect interactions, aphid-induced miRNA expression profiles differed between Vat+ (R gene for virus aphid transmission) and Vat- melons, suggesting that miRNAs mediate the auxin insensitivity phenotype in susceptible plants [25].
Here, we expand on our transcriptome assemblies to investigate the potential functions of non-coding RNAs, a whitefly-resistant cultivar (HR) and a susceptible cotton cultivar (ZS) response to whitefly infestation [26]. We, therefore, aimed to determine whether miRNA-mediated gene silencing plays a role in the cotton response to whitefly infestation. Degradome sequencing was used to identify miRNA targets and PHAS loci. We used gene enrichment analysis to examine the role of cotton miRNAs in modulating phytohormone signaling and focused on the miR390-targeted ARF8 using VIGS. The current report illustrates the miRNA’s intricate transcriptional network in cotton plants in response to herbivore infestation.
2. Results
2.1. Classification and Annotation of sRNAs in Resistant (HR) and Susceptible (ZS) Cotton Cultivar in Response to Whitefly Infestation
The HR and ZS cultivars exhibited highly difference resistance after one month in response to whitefly infestation (Figure S1). To explore the relationship between miRNA and siRNA abundance and the different cotton cultivars’ responses to whitefly infestation, we constructed sRNA libraries with three biological replicates per sample type from the HR and ZS plants infested with adult whiteflies for 24 h and mock infested plants (Table 1). In total, 201,876,882 raw reads and 20,239,660 unique reads were generated from the twelve libraries. After discarding the adapter sequences, low quality reads, and short reads, the unique sRNAs were annotated using the Rfam database to exclude snoRNA, snRNA, and rRNA sequences (Table 1).

Table 1.
sRNA-Seq classification of twelve libraries.
Analysis of the remaining data showed that approximately 80% of the siRNAs and miRNAs aligned the G. hirsutum acc TM-1 reference genome, with most reads ranging from 18 to 26nt in length (Figure S2), though the majority (> 70%) of the unique reads were between 21 and 24nt (Figure 1A). To provide an overview of the sRNA landscape, the common sRNAs were estimated from the 12 libraries. Principal component analysis (PCA) was performed using the common sRNA read per million (RPM) values (Figure 1B). Replicates in HR0 and ZS0 were cohesively clustered on the first two components, and the treatment and mock groups have distinct clusters. Additionally, the RPM values for the common unique reads from the two biological replicates were calculated by Pearson’s correlation coefficient (PCC), which showed a high correlation (PCC = 0.99) in all the biological replicate groups (Figure S2). Based on these analyses, the different replication groups have higher correlations, and the mock/treatment of HR/ZS samples was well separated, suggesting that our experiments were reproducible, and that the data obtained were reliable.
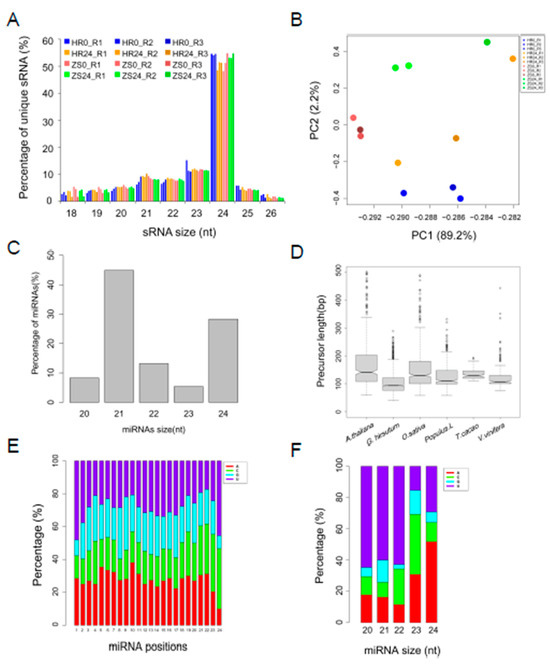
Figure 1.
Identification and characterization of cotton miRNAs after whitefly infestation. (A) Distribution of unique sRNA length present in the three biological replicates. (B) Principle component analysis (PCA) of common sRNAs RPM from the twelve libraries. (C) Distribution of miRNA length. (D) Distribution of miRNA precursor length in cotton compared to four representative plant species. (E) Nucleotide preference at each position of the predicted miRNA. (F) Analysis of first nucleotide bias in the different miRNAs.
In total, 475 miRNA precursors were identified, including 260 unique miRNA sequences consisting of 110 conserved and 150 novel miRNAs from the twelve sRNA libraries (Table S2). The length of the miRNAs ranged from 20 to 24nt, with 21nt miRNAs predominating (Figure 1C). Comparing the miRNA precursor gene length identified in this report with those from four other representative plant species, it was found that cotton miRNA precursors were shorter, with a median size < 100nt (Figure 1D). The nucleotide bias at each position was also analyzed to better understand the miRNA cleavage sites [27]. In general, motifs that could be defined as miRNA cleavage sites lacked the nucleotide uracil (U) at the 4th position, whereas the 10th position tended to be adenine (A) (Figure 1E). We also found that the first position in the 21nt miRNAs was predominantly U but was A in the 24nt miRNAs (Figure 1F). A portion (110 of 260) of the unique miRNA sequences identified corresponded to the 46 miRNA families that currently comprise the miRBase21 database, those sequences were therefore defined as “conserved miRNAs”.
The identification of miRNAs involved in the HR and ZS dataset was assessed and visualized using a Venn diagram (Figure 2A). We also systematically studied the distribution of the 475 identified pre-miRNAs, the pre-miRNA gene loci in the At- and Dt-subgenomes were analysed using BLASTN (Figure 2B). Multiple precursor gene loci (ranging from 1 to 33) were identified for miR156/7, miR160, miR166/7, miR169, miR171/2, and miR396/miR399 in both the At- and Dt-subgenomes (Figure 2B). More copies of the miR7484 and miR8672 precursors were found in the At-subgenome than in the Dt-subgenome (5 vs.2 and 7 vs.1, respectively). This distribution was flipped for the miR3476 and miR396 precursors, with more copies in the Dt-subgenome (1 vs.4 and 3 vs.5). All of the miRNA expression level correlations from the HR and ZS datasets (Figure 2C), which represent two biological replicates, were calculated by PCC (PCC = 0.9). We found that 83 miRNAs (31.9%) were abundantly expressed with reads count > 200. For example, the miR156/7, miR160, miR166, miR390, miR396, miR398, and miR482 families were highly expressed in both HR and ZS plants infested with whiteflies for 24 h (Table S3). Only eight miRNAs were significantly differentially expressed between the HR and ZS cultivars, including P107:miR319b, P191:miR319b, P74, P169, and P182 in HR and P33:gra-miR8672, P27, and P242 in ZS (Figure 2D and Table S3). Based on the DESeq analysis, the expression levels of 23.1% of the miRNAs (60 of 260) were up-regulated in response to whitefly infestation in HR plants at 24 h, but though most of these miRNAs were down-regulated in ZS (Figure 2E,F).
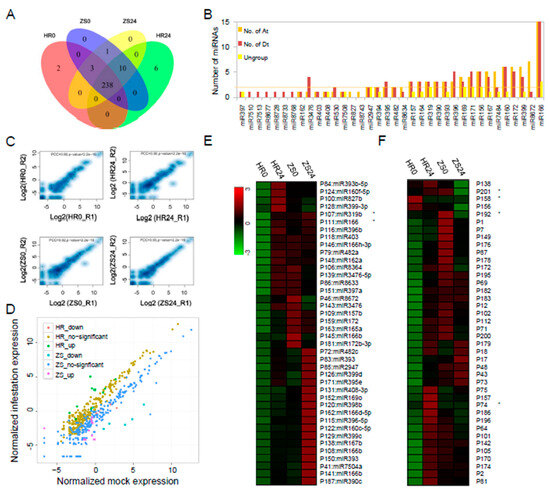
Figure 2.
Comparative analysis of miRNAs and their expression profiles between whitefly-resistant (HR) and whitefly-susceptible (ZS) cotton plants during whitefly infestation. (A) The number of miRNAs following whitefly infestation in the HR and ZS cultivars. (B) The number of conserved pre-miRNAs in the At-, Dt-subgenomes and ungroup (scaffold). (C) Expression level (RPM) correlation of allthe miRNAs calculated by PCC in two biological replicates. (D) Scatter-plot graph representing differential expression profile of miRNAs between the HR and ZS plants following whitefly infestation. (E,F) Heatmap based on the abundance expression profiles of conserved and novel miRNAs from each cotton type during mock and whitefly infestation (* indicates p < 0.05 and log2|(infestation/control) | > 1).
2.2. Abundant lincRNA Act as miRNA Precursor
LincRNAs are endogenous ncRNAs that are transcribed from genome intergenic regions and may play critical roles in regulating gene expression through multiple RNA-mediated gene regulation mechanisms [28]. To study further the function of the lincRNA-miRNA-mRNA cascade in the cotton response to whitefly infestation, we used our previously generated RNA-Seq dataset to identify potentially important polyA-containing lincRNAs. A comprehensive bioinformatics pipeline, developed to facilitate the identification of lincRNAs based on RNA-Seq datasets, is showed in Figure S3 (also see Materials and Methods). In total, 2365 strand-specific lincRNA genes were identified and corresponded to 6651 lincRNA transcripts for further analysis (Tables S4 and S5). We aslo found that the genomic loci of 2365 lincRNAs overlapped with 475 predicted pre-miRNAs and that seven conserved miRNA precursors and 10 novel miRNA precursors were generated from 29 lincRNA transcripts (Table 2).
Table 2.
The pre-miRNAs generated from lincRNAs in HR and ZS plants following whitefly infestation.
The secondary structure of seven conserved miRNAs and their corresponding lincRNAs are shown in Figure S4. These results indicated the lincRNAs can serve as miRNA precursors that regulate downstream target genes.
2.3. Analysis of the miRNA Target Genes Based on Degradome Sequencing
To provide further insights into the putative miRNA targets, a mixed degradome library was constructed from the HR0, HR24, ZS0 and ZS24 mRNAs. Approximately 14 million high quality reads were mapped to the G. hirsutum transcriptome after removing the adaptors and poor sequences (Table S6). Using degradome sequencing, 241 mRNAs and 13 lincRNAs were identified as targets for 81 miRNAs (Table S7). These lincRNAs were cleaved by the following three conserved miRNAs: (1) miR167, (2) miR396, and (3) miR399 (Figure S5). As expected, 41 conserved miRNAs had multiple targets that included transcription factors (TFs) and R genes. Among the most conserved miRNAs and targets were miR156-SPL, miR160-ARF, miR164-NAC, and miR828-MYB. More importantly, several novel miRNAs and targets were also detected, such as miR482a-AP2/B3 TFs and miR482c-receptor like kinase (RLK) (Figure S6).
To better understand the regulatory roles of miRNAs in the transcriptional response of cotton to whitefly infestation, we also analyzed 241 targets for GO enrichment annotations. GO enrichment analysis revealed that ‘hormonal response genes’, ‘metabolic processes’, and ‘ROS metabolism-related genes’ were among the significantly enriched processes (p < 0.01) (Figure 3A). Constructing the cotton miRNA:mRNA interactome provided a visual platform to evaluate the induced/suppressed miRNA target gene networks in cotton in response to whitefly infestation (Figure 3B). Among the networks, 24 conserved miRNA target families were identified that were involved in phytohormone signal transduction, secondary metabolism, plant-pathogen interactions, plant growth development and RNA biosynthesis (Figure 3B). Based on the assignment of the functional category annotations, various relationships between miRNAs and their target genes were observed. (I) Five miRNAs, including miR156/7 with SPL, miR160/167 with ARF, and miR393 with the auxin signaling receptor F-box2 protein (TIR), are involved in regulating auxin signaling as well as auxin perception. miR390 is also involved in auxin signaling through the production of a tasiRNA that targeted ARFs [29]. Four miRNAs, including miR319 with TCP family transcription factor, miR169 with jasmonate-zim-domain protein (JAZ), miR396 with growth-regulating factor (GRF) and miR172 with AP2 TFs, are associated with JA and ET signaling pathways. miR164 is associated with NAC100 and involved in the ABA signaling pathway. (II) miR397 is associated with a laccase (LAC) involved in lignin metabolism. miR398 with superoxide dismutase (SOD) and associated oxidative stress. miR394 with galactose and involved in primary metabolic, and miR530 with the zinc knuckle (CCHC-type) family protein and involved in secondary metabolism. (III) miR482 is associated with NB-LRR and miR7484 with a receptor-like protein kinase (RLK), both of which have roles in plant-pathogen interactions. (IV) miR166 is associated with a homeobox-leucine zipper protein and miR394 with a WD40, which are associated with plant growth and development. (V) miR162 is associated with DCL1 and involved in RNA biological processes (Figure 3B).
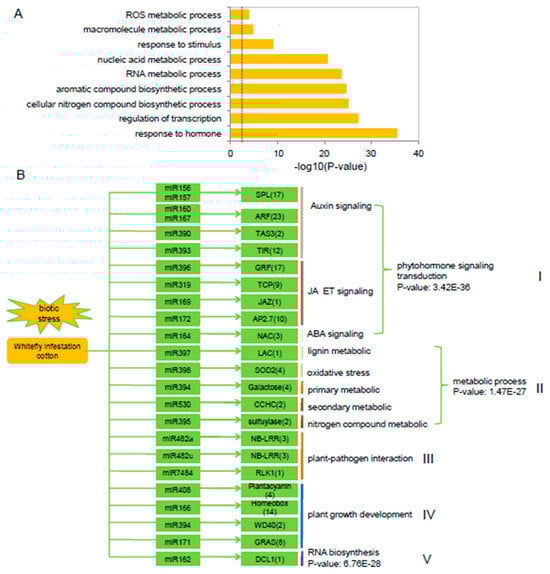
Figure 3.
Validation of miRNA target genes based on degradome sequencing. (A) Gene ontology (GO) enrichment analysis of miRNA targets in cotton plants following whitefly infestation. The dashed line represents p < 0.01. (B) Overview of 24 conserved miRNA families, their corresponding targets and potentially associated pathways in cotton plants in response to whitefly infestation. p-values indicate the GO enrichment significant differences.
2.4. Tight Linkage Between miRNAs and Their Targets in Cotton in Response to Whitefly Infestation
To validate the miRNA expression patterns and their corresponding targets, six conserved miRNAs/targets were analyzed by stem-loop qRT-PCR in the HR and ZS plants (Figure 4). miR157 exhibited dynamic expression with abundance peaks at 4 and 24 h, whereas the expression profile of its corresponding target squamosa promoter binding protein-like 2 (SPL2) displayed the opposite, with decreased at those same time points (Figure 4A). Whitefly infestation promoted the up regulation of miR164 in HR plants, with a slight reduction in expression at 12 and 24 h. This contrasted with the miR164 expression profile in ZS plants, which was barely detectable until 48 h. The miR164 corresponding target NAC100 was rapidly downregulated in the HR plants in accordance with increased miR164 expression and remained repressed throughout whitefly infestation (Figure 4B). However, in ZS plants, it peaked at 24 h when miR164 expression was non-detectable and was then drastically downregulated at 48 h as miR164 levels rose. miR167 and its target ARF8 exhibited reciprocal expression profiles in HR and ZS plants with elevated miR167 levels during the initial stage and repressed levels during the later stages in HR plants, whereas expression was lowest at the early stages and highest (ca. 50-fold) at 48 h in ZS plants (Figure 4C). Similarly, the expression of miR393 in HR plants was lowest at 4 h of whitefly infestation but highest in ZS plants (Figure 4D). miR390/TAS3 had a similar expression profile as miR157/SPL2, with expression in HR plants at all time points (Figure 4E). However, it showed down-regulation at the 4 and 24 h time points in the ZS plants. miR397 also exhibited reciprocal expression with periods of low expression in HR plants that corresponded to elevated expression in ZS plants (Figure 4F). Most importantly, target gene expression was negatively correlated with miRNA expression, suggesting that the miRNAs repress the expression of their target genes in response to whitefly infestation (Pearson’s correlation coefficient, R2 = −0.323, p = 0.00554, Figure S7).
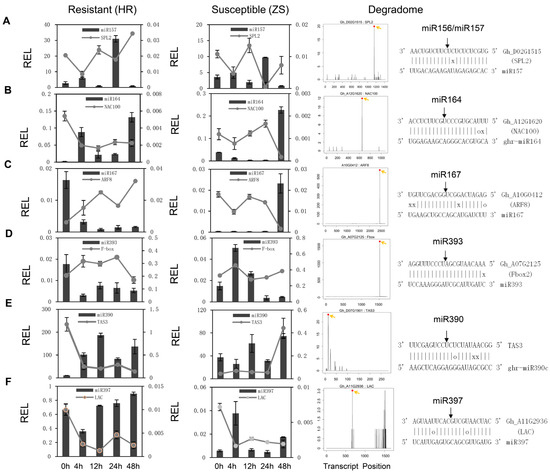
Figure 4.
Expression profile of select miRNAs and their corresponding target genes in HR and ZS cotton plants following whitefly infestation. (A–F) The histograms and associated lines indicate the relative abundance of the individual miRNAs and their corresponding targets, respectively. The left and middle panels correspond to the expression profiles of the indicated transcripts in HR and ZS plants infested with whiteflies at different time points, respectively. The T-plots in the right panel show the relative abundance of the degradation signal mediated by the miRNAs. The associated miRNA:mRNA duplex alignment is shown above each panel. The G-U pairs are indicated with an ‘o’ and mismatch base pairs are indicated with an ‘x’.
2.5. Identification of miRNA-mediated phasiRNAs during the Whitefly Infestation Cotton Plants
We identified 402 PHAS loci with 33 loci located in mRNAs (Table S8). In total, 85 siRNAs were generated from nine PHAS genes through six miRNA-mediated processes (Table S9). Several of the most conserved PHAS loci identified included those encoding two TAS3, two ARF8, four NB-LRR, and one AP2/B3, proteins (Figure S8). We found that two miR482 members and two novel miRNAs were 22nt in length. Interestingly, the two novel miRNAs (P73, and P81) triggered phasiRNAs from the NB-LRR gene sequence. The PHAS loci are located in diverse regions of the cotton genome including in exon, exon-intron, exon-intergenic and untranslated regions (Figure 5A and Figure S9). For example, the PHAS5 and PHAS8 loci are located in exonic regions of NB-LRR. However, there was no significant difference in the number of phasiRNAs generated from the PHAS3 and PHAS4 loci between the HR and ZS plants, and most siRNA expression levels were up-regulated in HR plants and down-regulated in ZS at 24 h (Figure 5B). Although the expression of PHAS5 and PHAS8 were up-regulated in whitefly-infested ZS plants, these loci generated more than twice the number of siRNAs in infested HR plants (18 in HR vs. 8 in ZS, Figure 5C).
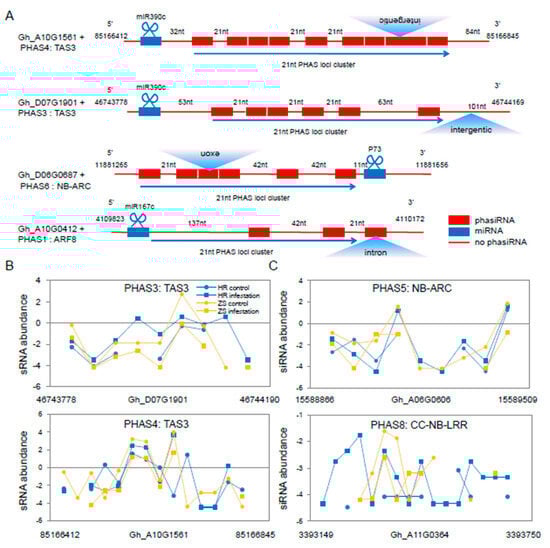
Figure 5.
Characteristics of select siRNAs and various PHAS loci in cotton following whitefly infestation. (A) Schematic diagram of the 21-nt siRNAs generated from the PHAS loci in cotton following whitefly infestation. The structures of three typical PHAS genes are showed with phasiRNAs denoted by red boxes (indicating different siRNA sequences). Blue boxes represent the miRNA cleavage sites and red lines indicate non-PHAS loci. Blue triangles represent gene locations. (B) The expression profile of siRNAs in TAS3. (C) The PHAS siRNA derived from the NB-LRR disease-resistant protein sequence.
2.6. mi482a-Triggered phasiRNAs Regulate the Transcriptional in Cotton Response to Whitefly Infestation
We also found that miR482a targeted AP2/B3 and generated eight phasiRNAs. However, both RNA-Seq and sRNA-Seq data indicated that these phasiRNAs were not differentially expressed in HR plants in response to whitefly infestation at 24 h (Figure 6A). The AP2/B3 cleavage site that generated the highest abundance of phasiRNAs was confirmed by the degradome data (Figure 6B). The qRT-PCR analysis revealed a significant negative correlation between miR482a and AP2/B3 expression in both HR and ZS plants after whitefly infestation (Figure 6C). Furthermore, the abundance of phasiRNAs decreased in ZS plants after whitefly infestation (Figure 6D). To better understand the relationship between the nine PHAS genes and the 85 derived phasiRNA targets, twenty-eight mRNAs were identified as phasiRNA targets (Table S10). In addition to the well-known ARF family that is targeted by TAS3 phasiRNAs, several phasiRNAs target genes related to biotic stress resistance were also identified including TFs (AP2/B3 and bHLH), an NB-LRR, a PPR protein, and an auxin-response factor. Overall, the expression of some of the target genes was up-regulated in HR plants but down-regulated in ZS plants within 24 h of whitefly infestation (Figure 6E). GO enrichment analysis also suggested that the most abundant phasiRNA targets function in plant responses to a hormone/stimulus and metabolic processes (Figure 6F).
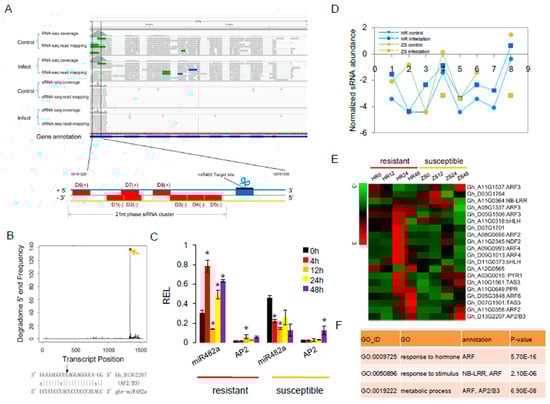
Figure 6.
The miRNA-mediated phasiRNA pathway involved in the cotton response to whitefly infestation. (A) Integrative Genomics Viewer (IGV) depiction of miR482a-mediated cleavage of the AP2/B3 transcription factors and the resulting 21-nt phasiRNAs. The schematic diagram depicts the secondary siRNA biogenesis that is initiated at the 5′-target site. (B) Degradome data showing miRNA-guided target cleavage sites. (C) Expression profile of miR482a in HR and ZS plants following whitefly infestation. Three biological replicates were assayed for each control and the whitefly-infested samples (Student’s t-test *p < 0.05). (D) siRNA abundance profile from the phased region. (E) Expression profile of phasiRNA targets in HR and ZS plants following whitefly infestation. (F) GO enrichment analysis of phasiRNA target genes (p < 0.01).
2.7. Characterization of the linc1-miR390-tasiARFs Cascade Involved in Cotton Response to Whitefly Infestation
TAS3 tasiRNA biogenesis is triggered by miR390-directed cleavage of the TAS3 transcript and has been reported previously [13,30,31]. Based on the bioinformatics and expression analyses, miR390 produced from precursor linc1 (Figure 7A). We have proposed a model for miRNA-mediated plant development and host response to herbivore infestation (Figure 7B). TAS3 and ARF8 expression in HR and ZS plants exhibited contrasting patterns during whitefly infestation, which was mediated by miR390. These phasiRNAs regulate AFR8 expression, which in turn influences the auxin signaling pathway affecting both plant development and host resistance. In addition to miR390, miR160 and miR167 also have moderate effects on ARF8 expression suggesting that miRNAs have multiple target genes and exhibit diverse functions in host plant defense systems.
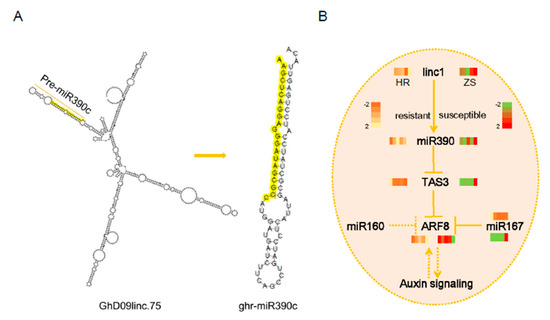
Figure 7.
Proposed model of miR390-mediated tasiARFs. (A) The biogenesis of miR390 from linc1. (B) The expression patterns of gene involving in miR390-tasiARFs in cotton response to whitefly infestation.
To further evaluate the functional characterization of this cascade, we investigated the functions of linc1, TAS3, and ARF8 in plant growth and host resistance to whitefly infestation using VIGS (Figure S10). In this experiment, the albino phenotype of TRV:GbCLA1 plants manifested ten days post-agroinfiltration was maintained for more than one month, suggesting that the VIGS system was efficient and durable. At three weeks post-agroinfiltration, plants with silenced target genes exhibited clear phenotypes. RT-PCR analysis confirmed that linc1 expression levels were significantly reduced in the TRV:linc1 plants compared to the TRV:00 plants and that TAS3 and ARF8 expression levels were likewise dramatically decreased in the TRV:TAS3 and TRV:ARF8 plants (Figure 8A). The TRV:ARF8 plants were significantly smaller (reduced height and fresh weight) than the control TRV:00 (empty vector) plants (Figure 8B,C). qRT-PCR further confirmed that linc1, TAS3, and ARF8 expression levels were significantly down-regulated (10–54 fold lower than the control) in most VIGS plants (Figure 8D). Silencing of linc1 in the TRV:linc1 plants resulted in the down-regulation of miR390 expression and up-regulation of TAS3 (Figure 8E). We next analysed the expression of the following three major receptor proteins involved in auxin signaling in the TRV:TAS3 and TRV:ARF8 plants: (1) the auxin-responsive GH3 family protein GH3.1 (Gh_D02G2045), (2) the SAUR auxin-responsive protein SAUR (Gh_A13G1024), and (3) the auxin F-box protein (Gh_D05G2130). However, there were no obvious changes in the expression of SAUR- and Fbox-encoding genes in the TRV:TAS3 plants, while GH3.1 was substantially down-regulated (Figure 8F).
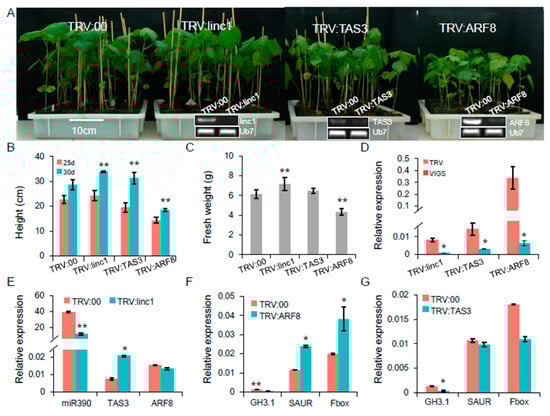
Figure 8.
Functional of the miR390-mediated pathway using the virus-induced gene silencing (VIGS) technology. (A) Phenotype for TRV:linc1, TRV:TAS3 and TRV:ARF8 plants. At the bottom of the electrophoresis figure confirmed down-regulation of VIGS target genes in TRV:linc1, TRV:TAS3 and TRV:ARF8 plants compared with TRV:00. (B,C) Plant height and fresh weight on VIGS plants. (D) qRT-PCR analysis of linc1, TAS3 and ARF8 expression in different VIGS plants. (E) Silencing linc1 leads to down-regulation of miR390 in TRV:linc1 plants. (F,G) qRT-PCR analysis of auxin-related genes in TRV:ARF8 and TRV:TAS3 plants.
The TRV:TAS3 and TRV:ARF8 plants were selected for further study on the basis of higher insect resistance. Whitefly colonization of TRV:ARF8 plants was moderately reduced at two weeks post-infestation, whereas there was no significant difference in whitefly densities on the TRV:linc1 and TRV:TAS3 plants (Figure 9A). Whitefly feeding on the TRV:TAS3 and TRV:00 plants caused chlorosis and drooping of the leaves in the greenhouse, whereas the TRV:ARF8 plant showed normal growth apart from plant height (Figure 9B). Analysis of the signaling hormones revealed that auxin levels were reduced in the TRV:ARF8 plants following whitefly infestation (Figure 9C). JA plays a role in plant-herbivore interactions [20]. These results indicate that the enhanced resistance to whiteflies observed in the TRV:ARF8 plants is likely due to combinatorial effects that arise from the suppression of auxin signaling pathway and induction of JA signaling (Figure 9D). Jasmonoyl-l-isoleucine (JA-Ile) levels, which are catalyzed by JAR enzymes from JA, were examined. The TRV:ARF8 plants accumulated higher JA-Ile levels compared with TRV:00 plants after whitefly infestation (Figure 9E). The expression profiles for genes involved in the JA signaling pathway were measured in cotton plants infested by whitefly. qRT-PCR showed that acyl-CoA oxidase 1 (ACX1), allene oxide cyclase (AOC), LOX2, oxophytodienoate-reductase 3 (OPR3), JAR enzymes (JAR), and COI receptor (COI) expression levels were more rapidly induced in TRV:ARF8 than TRV:00 (Figure 9F). These data suggest that JA biosynthesis may be partially induced in TRV:ARF8 plants by whitefly infestation.
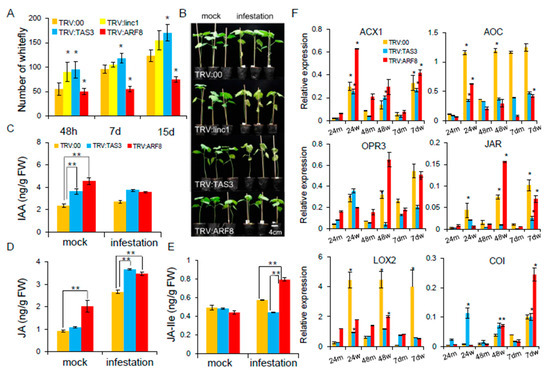
Figure 9.
The auxin and JA signaling crosstalk miR390-tasiARFs involved in the cotton following whitefly infestation. (A) The number of whiteflies on VIGS plants. (B) The phenotypes of TRV:00, TRV:TAS3, TRV:ARF8 after whitefly infestation cotton plants at two-weeks. (C–E) Jasmonic acid (JA) and indole-3-acetic acid (IAA) concentrations were measured by LC-MS in TRV:TAS3 and TRV:ARF8 plants. (F) qRT-PCR validation of JA biosynthesis related genes after whitefly infestation VIGS plants. Error bars indicate S.D from four biological replicates. The statistical test was performed for each mock and whitefly-infested sample in in TRV:00, TRV:TAS3 and TRV:ARF8 (Student’s t-test *p < 0.05). The 24m, 48m, 7dm, 24w, 48w, and 7dw represent mock and whitefly infestation cotton at 24 h, 48 h, 7 days, respectively.
3. Discussion
Non-coding RNAs play essential roles in plant development and stress signaling transduction pathways [10,12]. While the application of RNA-Seq methodologies to analyze the expression of ncRNA responses to biotic stresses in model plants is well-established, similar studies in cotton and reports linking changes in ncRNA abundance with plant-herbivore interactions are more limited [23,25,32,33,34]. Despite the widespread use of traditional chemical-based strategies for whitefly control in cotton, epidemics remain prevalent worldwide [35]. Consequently, elucidating the molecular mechanisms underlying cotton host resistance to whitefly infestation is highly desirable. RNA-Seq analysis has allowed us to characterize lincRNA dynamics during whitefly infestation in cotton, with more detail that in previous studies in G. barbadense [36]. lincRNAs act as competing for endogenous RNAs that bind to special miRNAs as target mimicsto protect target mRNAs from degradation in plants [37]. We predicted a similar mimetic relationship between lincRNAs and miRNAs with 13 cotton lincRNAs likely to act as decoys for miRNAs, such as miR160, miR167, miR399, the miR482 family, and six novel miRNAs.
In addition to their role as miRNA target mimics, abundant lincRNAs may be degraded into pre-miRNAs. Previous studies have evaluated the expression of different precursor genes for miR156/7, miR164, miR171/2 and miR396 in tomato fruit development and ripening [38]. However, the detailed functions of these miRNAs remain unknown and require further study through the overexpression of eTMs and miRNAs. The expression profile of lincRNAs, their corresponding miRNAs, and their downstream targets suggest that their functions are closely interrelated. Furthermore, miR156, miR390, and the miR482 family were found to negatively regulate SPL2, TAS3, and AP2/NB-LRR, respectively, consistent with previous reports on the transcriptional response of cotton to disease. However, contrasting miR482a expression profiles were observed in whitefly-infested resistant and susceptible plants, suggesting that it may function in both plant host resistance and herbivore infestation. As expected, trends observed in the expression of lincRNAs were consistent with their corresponding miRNAs, suggesting that lincRNA-miRNA cascades may play important roles in cotton in response to whitefly infestation.
Previous studies reported that miRNA-triggered phasiRNAs play a major role in plant-pathogen interactions [39]. To elucidate the potential function of phasiRNAs in plant-insect interactions, we evaluated phasiRNA targets and conclude that they may have plant hormone-related functions. Genomic structure analysis revealed that five 22nt miRNAs that target R genes contained multiple exons and various siRNA production loci (Figure 5A). More importantly, transcriptional profiling showed that these phasiRNAs are in low abundance, with fewer loci in the whitefly-susceptible ZS plants. Similar results were observed in the tomato transcriptional response to tobacco mosaic virus (TMV) infection [40]. We also identified a new miR482a-targeted gene, AP2/B3. The expression of AP2/B3 did not dramatically change, though the expression of the phasiRNAs were downregulated and the phasiRNAs were diminished after whitefly infestation. These results suggest that cascades of lincRNAs, miRNAs, PHAS and their targets are fundamental in plant pathways activated in response to herbivore infestation.
Diverse miRNA/siRNA-mediated R genes predicted to regulate phytohormone signaling were implicated in cotton in response to herbivory. This finding is not surprising, as miRNA targets associated with phytohormone signaling (e.g., JA, ET, and auxin) have been reported following herbivore infestation in Nicotiana attenuate and Cucumis melo [24,25]. Silencing the RDR1 gene in Nicotiana attenuata increased plant susceptibility to insect herbivory, suggesting that this defense system may be regulated by sRNAs [24]. Auxin has been recognized as a positive regulator of the plant defense system. It has also been shown to have roles in microbial-induced disease resistance [41]. As shown in Figure 3B, most miRNA target genes negatively regulated by miRNAs were associated with phytohormone signaling. Notably, both miR393 and miR167 negatively regulated ARF8 during whitefly infestation and then further affected the auxin signaling pathway involved in cotton plant development and insect resistance. A subset of these tasiRNAs plays important roles in auxin response through ARF repression and by regulating the expression of specific target genes [42]. Moreover, miR390-mediated TAS3 negatively regulated ARF8 expression at all time points and ARF8 expression showed opposite patterns in the resistant and susceptible plants during whitefly infestation. Previous miRNA profiling studies demonstrated that the activation of miR393 and miR167 resulted in auxin insensitivity during aphid infestation in resistant Cucumis melo [25]. The previous report the miR156/SPLs module function regulates developmental and resistance [43]. miR390, which is produced from a linc1 precursor, binds TAS3 to generate eight phasiRNAs that regulate ARF8 expression, which in turn influences the auxin signaling pathway by affecting both plant development and host resistance. In addition to miR390, miR160 and miR167 also have moderate effects on ARF8 expression, suggesting that miRNAs have multiple target genes and exhibit diverse functions in host plant defense systems.
4. Materials and Methods
4.1. Plant Materials, Whitefly Infestation, and RNA Isolation
G. hirsutum seeds from the whitefly-resistant cultivar (HR) and a susceptible cultivar (ZS) were germinated on 1/2 Murashige and Skoog (MS) medium [26]. After germination, the seeds were maintained in the dark for two days. Plantlets were then grown for five days at 28 ± 2 °C and a 16 h/8 h day light/dark cycle until they developed flat cotyledons. Whiteflies (Bemisia tabaci) were fed on potted cotton plants at 28 ± 2 °C and 70% relative humidity in the greenhouse. Adult whiteflies were collected from the greenhouse by aspiration into Falcon tubes, and fifty adults were transferred to cotton plantlets with two flat cotyledons. Adult whiteflies (50 whiteflies) were removed from the cotton plants 24 h after infestation. Mock plant cotyledons (24 h) were grown in boxes without whitefly infestation. Total RNA was isolated using a modified guanidine thiocyanate method [44].
4.2. Small RNA and Degradome Library Construction
The quality of total RNA was assessed using an Agilent 2100 Bioanalyzer (Agilent, CA, USA). A single TruSeq Small RNA Sample Prep workflow is summarized as follows. Briefly, 1 μg total RNA was ligated to 5′- and 3′-RNA adaptors and reverse transcribed into cDNA. After PCR amplification, libraries from separate samples were pooled for 15% polyacrylamide gel isolation. In total, twelve RNA libraries were constructed, consisting of three biological replicates corresponding to the HR and ZS plants infested with whiteflies for 0 h and 24 h. The cDNA pools were sequenced on an Illumina Genome Analyzer (San Diego, CA, USA) at the National Key Laboratory of Crop Genetic Improvement in Huazhong Agricultural University (Wuhan, China). Each treatment RNA samples (including two biological replicates) were pooled (20 μg) and one degradome library was constructed as previously described with minor modifications [45]. The ligation products were amplified and sequenced on an Illumina Genome Analyzer.
4.3. miRNA Prediction Pipeline
The raw reads were pre-processed with the NGSQC toolkit [46] to remove the low-quality reads (quality score, Q < 20, reads shorter than 18nt) and trim the adaptor sequences. Reads were mapped to the Rfam database to exclude snRNAs, snoRNAs, tRNAs, and rRNAs. The remaining sRNAs were subjected to miRNA identification. The final clean reads were mapped to the G. hirsutum genome [47] using bowtie (-v 0 -m 200). We used structure- and probability-based annotation to predict the miRNA loci as described previously [48]. For the structure-based annotation, sequences 150-bp upstream and downstream of the miRNA mapping sites were extracted and defined as “pre-miRNA putative sequences”. miRcheck was used to evaluate the RNA secondary structures, and hairpin-like structures were predicted using RNAfold [49]. For the probability-based annotation, the putative precursors from the structure-based annotation were filtered using miRDP [50]. The cutoff value of the largest miRNA family size was set at 50 because of the triple genome size of the tetraploid cotton compared to diploid cotton. All of the annotated mature miRNAs were searched against miRBase21 [51] and categorized into cotton conserved and novel miRNAs families using the BLASTN program.
4.4. Expression Profiles of miRNAs in the HR and ZS Plants during Whitefly Infestation
The expression levels of all the miRNAs and siRNAs were normalized into reads per million (RPM) [RPM = miRNA reads*106/ total reads]. DESeq was used to evaluate the miRNA differential expression analysis in the HR and ZS cultivars with the following criteria: (1) |log2(treatment/control) | > 1 and (2) an adjusted p-value < 0.05 [52].
4.5. Identification and Functional Annotation of the miRNA Target Genes
The CleaveLand pipeline (p < 0.05) was used to detect putative miRNA targets [53]. The miRNA targets were predicted by G. hirsutum transcriptome [47] and our identified lincRNA datasets. Candidate targets were then categorized (between 0 and 4) based on the relative abundance of the miRNA/siRNA-mediated cleavage site compared to the total number of tags. Gene ontology (GO) analysis was performed using the Blast2GO software with a false discovery rate (FDR) < 0.05 based on Fisher’s exact test.
4.6. Identification of lincRNAs from RNA-Seq Dataset
Our recent transcriptome data examining the response of cotton to whitefly infestation [26] were assembled using Cufflinks 2.0 according to the provided instructions [54]. Briefly, each RNA-Seq dataset was independently aligned to the G. hirsutum genome using TopHat 2.0 [55]. Then, all the transcriptome data were pooled and merged to generate a final transcriptome using Cuffmerge. After the final transcriptome was generated, Cuffdiff was used to estimate the abundance of the transcripts based on the final transcriptome, and a BAM file was generated from the TopHat alignment. Cuffcompare was used to annotate novel transcripts (class_code = “u”) against the known annotation. We discarded transcripts that overlapped either 500-bp upstream or downstream of mRNAs, that had FPKM value < 0.5 and were shorter than 200-bp. The novel transcripts were analyzed against the Pfam and Swiss-prot databases using BLASTX (e-value < 1e−3). The remaining transcripts were then subjected to coding-non-coding index (CNCI) analysis to exclude specific transcripts, and the remaining transcripts were reliably defined as expressed lincRNAs [56].
4.7. Stem-loop qRT-PCR Analysis of miRNAs
To quantify the identified miRNAs and mRNAs, stem-loop RT-PCR was performed using a protocol with minor modifications [57]. All the qRT-PCR templates were generated from 3 μg total RNA isolated from the HR and ZS plants at 0, 4, 12, 24, and 48 h after infestation. The stem-loop PCR system (20 µl mixture) consisted of 0.05 µM stem-loop primers, 2.5 µM oligo-dT primer, 0.4 mM dNTPs, 4 µL 5×First-strand buffer, 1 µL DTT (100 mM), 1 μL RNase inhibitor, and 1 µL reverse transcriptase (Invitrogen, Carlsbad, CA, USA). The reverse-transcription reaction was performed with the following conditions: (1) 16 °C for 30 min, (2) 60 cycles of 30 °C for 30 s, 42 °C for 30 s, and 50 °C for 1 s, and (3) 85 °C for 5 min. Quantitative RT-PCR was performed as previously described [26]. Relative quantification of miRNA gene expression was calculated using GhUBQ7 (GenBank accession number: DQ116441) as an internal standard. The comparative Ct method (2−ΔΔCt) was used to calculate transcript expression levels [58]. All the primers used in the qRT-PCR analyses are listed in Table S1.
4.8. Identification of PHAS Loci
Genome-wide identification of phasiRNA loci was performed as described using PhaseTank (max_hits 30, number 4) [59]. The algorithm for the introduction of relatively small RNA production (RSRP) was adopted to reduce false phasiRNA prediction. The Integrative Genomics Viewer (IGV) was used to evaluate both the PHAS loci and associated expression levels [60].
4.9. Validation of lincRNA Function and Corresponding Targets by VIGS
Virus-induced gene silencing (VIGS) was performed as described [26]. Sequences for linc1, TAS3, and ARF8 were amplified using primers listed in Table S1. The fragments were then cloned into tobacco rattle virus (TRV) vectors. The TRV:linc1, TRV:TAS3, TRV:ARF8, TRV:00 (empty vector) and TRV:CLA (chloroplasts alterados) vectors were transformed into Agrobacterium GV3101 by electroporation. Agro-infiltration was performed using a syringe on 10-day-old G. hirsutum cv. HR seedlings. After two weeks, the TRV:CLA plants with an albino phenotype and other plants were used for further analysis. The analysis of the whitefly populations in the tested cotton plants in each experiment was assessed at 48 h, 7 days, and 15 days post-agroinfiltration. Approximately 0.1 g leaf samples were homogenized in 1 mL of 80% methanol and shaken overnight at 4 °C. Shaken samples were centrifuged at 12,000 rpm for 10 min and transferred to a 2 mL tube. IAA and JA extraction, purification, and quantification were performed with five biological replicates according to a method described previously with slight modifications [61].
4.10. Data Availability
The RNA-Seq, sRNA-Seq and degradome data generated in this report have been submitted to NCBI as a sequence read archive (SRA project: PRJNA286935).
5. Conclusions
To facilitate a better understanding of the role of ncRNAs in cotton-herbivore interaction, we developed a comprehensive framework for the genome-wide identification of ncRNAs in resistant and susceptible cotton cultivars following whitefly infestation. The 2365 lincRNAs, 260 miRNAs, 85 phasiRNAs, 241 miRNA targets were identified and found that the ncRNAs exhibited complex connections during herbivore infestation. We also used bioinformatics analyses and VIGS method to provide new insights into the miR390-tasiARFs cascade and propose that miRNA-mediated phasiRNA is a mechanism for the continuous regulation of downstream targets during plant responses to insect attack. In the current report, VIGS of linc1, TAS3 and ARF8 suggests the following conclusions: (1) ARF8 might regulate gene expression in both the auxin and JA signaling, (2) down-regulating linc1 leads to the down-regulation of miR390, and (3) silencing ARF8 led to the accumulation of JA levels, through the induction of JA biosynthesis-related gene expression. ARF8 and its regulatory miRNAs play a balancing role in cotton growth development and resistance, but the mechanism of which is not clear. Further analyses into the mechanism underlying miR390 regulation will require CRISPR/Cas9-mediated mutations to linc1, TAS3 and/or ARF8. Only then will it be possible to demonstrate unequivocally the role of miRNAs in plant-insect interactions.
Supplementary Materials
The following are available online at https://www.mdpi.com/1422-0067/20/21/5357/s1, Figure S1: The phenotype during the whitefly infestation resistant and susceptible cotton cultivar. (A) The phenotype of HR and ZS cultivar after infestation 1 month. (B) The cotton plants infested by whitefly in a sealed chamber box; Figure S2: Distribution of sRNA reads in twelve libraries. (A) Distribution of total read lengths present in the three biological replicates. (B) AllsRNA (miRNAs+siRNAs) expression level correlations were calculated by PCC in the two biological replicates; Figure S3: Schematic diagram of the integrative pipeline used for systematic identification of lincRNAs; Figure S4: Conserved miRNA precursors generated by lincRNAs; Figure S5: T-plots of the cotton miRNA stargeted by lincRNAs. Figure S6: miR482 targets were confirmed by degradome sequencing; Figure S7: The expression of correlation between miRNA and their target gene; Figure S8: PHAS genes triggered by miRNAs identified in this report; Figure S9: PhasiRNAs generated from different cotton genome regions. ANB-LRR protein generated phasiRNA loci in two alternative exons by a novel P73 miRNA trigger. B Deg P protease-generated siRNAs from exon-intron-exon junctions. CNB-LRR protein generated siRNAs from a bona fide intron. D lincRNA-generated phasiRNAs; Figure S10: The VIGS vector construction; Table S1: Primers used in this study; Table S2: Expression level of all miRNAs in HR and ZS plants following whitefly infestation; Table S3: All of the pre-miRNA loci in the cotton genome; Table S4: All of the lincRNA loci in the cotton genome; Table S5: Expression profile of strand orientation lincRNAs; Table S6: Summary of degradome sequencing; Table S7: Validation of miRNA targets identified in degradome sequencing; Table S8: Identification of cotton PHAS loci in response to whitefly infestation; Table S9: miRNA-mediated phasiRNA expression. The blank region represents phasiRNAs that were lost; Table S10. Expression profile of phasiRNA targets in cotton following whitefly infestation.
Author Contributions
S.J. conceived and designed the research. J.L. performed the experiments and developed the computational pipelines for analyzing the dataset. S.L., Q.W., L.C. performed the PCR analysis. Q.Z. performed the sRNA library construction. J.L. wrote the manuscript, which was revised by S.J., J.J.H. performed English editing. X.Z., S.M. and M.W. contributed to the discussion. All authors reviewed the final manuscript.
Funding
This work was supported by grants from the National Key Research and Development Plan (2016YFD0100203-9).
Acknowledgments
We would like to thank Keith Lindsey of Durham University for the revising manuscript and his thoughtful comments.
Conflicts of Interest
The authors declare that they have no competing interests.
References
- Chen, Z.J.; Scheffler, B.E.; Dennis, E.; Triplett, B.A.; Zhang, T.; Guo, W.; Chen, X.; Stelly, D.M.; Rabinowicz, P.D.; Town, C.D.; et al. Toward Sequencing Cotton (Gossypium) Genomes. Plant Physiol. 2007, 145, 1303–1310. [Google Scholar] [CrossRef] [PubMed]
- Lu, Y.; Wu, K.; Jiang, Y.; Xia, B.; Li, P.; Feng, H.; Wyckhuys, K.A.G.; Guo, Y. Mirid Bug Outbreaks in Multiple Crops Correlated with Wide-Scale Adoption of Bt Cotton in China. Science 2010, 328, 1151–1154. [Google Scholar] [CrossRef] [PubMed]
- Jin, S.; Kanagaraj, A.; Verma, D.; Lange, T.; Daniell, H. Release of hormones from conjugates: Chloroplast expression of β-glucosidase results in elevated phytohormone levels associated with significant increase in biomass and protection from aphids or whiteflies conferred by sucrose esters. Plant Physiol. 2011, 155, 222–235. [Google Scholar] [CrossRef] [PubMed]
- Jin, S.; Zhang, X.; Daniell, H. Pinellia ternata agglutinin expression in chloroplasts confers broad spectrum resistance against aphid, whitefly, Lepidopteran insects, bacterial and viral pathogens. Plant Biotechnol. J. 2012, 10, 313–327. [Google Scholar] [CrossRef]
- Zarate, S.I.; Kempema, L.A.; Walling, L.L. Silverleaf whitefly induces salicylic acid defenses and suppresses effectual jasmonic acid defenses. Plant Physiol. 2007, 143, 866–875. [Google Scholar] [CrossRef]
- Shukla, A.K.; Upadhyay, S.K.; Mishra, M.; Saurabh, S.; Singh, R.; Singh, H.; Thakur, N.; Rai, P.; Pandey, P.; Hans, A.L.; et al. Expression of an insecticidal fern protein in cotton protects against whitefly. Nat. Biotechnol. 2016, 34, 1046–1051. [Google Scholar] [CrossRef]
- Zhu, L.; Li, J.; Xu, Z.; Manghwar, H.; Liang, S.; Li, S.; Alariqi, M.; Jin, S.; Zhang, X. Identification and selection of resistance to Bemisia tabaci among 550 cotton genotypes in the field and greenhouse experiments. Front. Agric. Sci. Eng. 2018, 5, 236–252. [Google Scholar] [CrossRef]
- Bartel, D.P. MicroRNAs: Genomics, biogenesis, mechanism, and function. Cell 2004, 116, 281–297. [Google Scholar] [CrossRef]
- Voinnet, O. Origin, Biogenesis, and Activity of Plant MicroRNAs. Cell 2009, 136, 669–687. [Google Scholar] [CrossRef]
- Chen, X. Small RNAs and their roles in plant development. Annu. Rev. Cell Dev. Boil. 2009, 25, 21–44. [Google Scholar] [CrossRef]
- Ruiz-Ferrer, V.; Voinnet, O. Roles of Plant Small RNAs in Biotic Stress Responses. Annu. Rev. Plant Boil. 2009, 60, 485–510. [Google Scholar] [CrossRef] [PubMed]
- Hackenberg, M.; Gustafson, P.; Langridge, P.; Shi, B.J. Differential expression of microRNAs and other small RNAs in barley between water and drought conditions. Plant Biotechnol. J. 2015, 13, 2–13. [Google Scholar] [CrossRef] [PubMed]
- Allen, E.; Xie, Z.; Gustafson, A.M.; Carrington, J.C. microRNA-Directed Phasing during Trans-Acting siRNA Biogenesis in Plants. Cell 2005, 121, 207–221. [Google Scholar] [CrossRef] [PubMed]
- Ronemus, M.; Vaughn, M.W.; Martienssen, R.A. MicroRNA-Targeted and Small Interfering RNA–Mediated mRNA Degradation Is Regulated by Argonaute, Dicer, and RNA-Dependent RNA Polymerase in Arabidopsis. Plant Cell 2006, 18, 1559–1574. [Google Scholar] [CrossRef]
- Felippes, F.F.; Weigel, D. Triggering the formation of tasiRNAs in Arabidopsis thaliana: The role of microRNA miR173. EMBO Rep. 2009, 10, 264–270. [Google Scholar] [CrossRef]
- Zheng, Y.; Wang, Y.; Wu, J.; Ding, B.; Fei, Z. A dynamic evolutionary and functional landscape of plant phased small interfering RNAs. BMC Boil. 2015, 13, 32. [Google Scholar] [CrossRef]
- Zhai, J.; Jeong, D.-H.; De Paoli, E.; Park, S.; Rosen, B.D.; Li, Y.; González, A.J.; Yan, Z.; Kitto, S.L.; Grusak, M.A.; et al. MicroRNAs as master regulators of the plant NB-LRR defense gene family via the production of phased, trans-acting siRNAs. Genes Dev. 2011, 25, 2540–2553. [Google Scholar] [CrossRef]
- Jones, J.D.; Dangl, J.L. The plant immune system. Nature 2006, 444, 323–329. [Google Scholar] [CrossRef]
- Wu, J.; Baldwin, I.T. New Insights into Plant Responses to the Attack from Insect Herbivores. Annu. Rev. Genet. 2010, 44, 1–24. [Google Scholar] [CrossRef]
- Wu, J.; Hettenhausen, C.; Meldau, S.; Baldwin, I.T. Herbivory Rapidly Activates MAPK Signaling in Attacked and Unattacked Leaf Regions but Not between Leaves of Nicotiana attenuata. Plant Cell 2007, 19, 1096–1122. [Google Scholar] [CrossRef]
- Ellis, J.; Dodds, P.; Pryor, T. Structure, function and evolution of plant disease resistance genes. Curr. Opin. Plant Boil. 2000, 3, 278–284. [Google Scholar] [CrossRef]
- McHale, L.; Tan, X.; Koehl, P.; Michelmore, R.W. Plant NBS-LRR proteins: Adaptable guards. Genome Boil. 2006, 7, 212. [Google Scholar] [CrossRef] [PubMed]
- Bozorov, T.A.; Baldwin, I.T.; Kim, S.-G. Identification and profiling of miRNAs during herbivory reveals jasmonate-dependent and -independent patterns of accumulation in Nicotiana attenuata. BMC Plant Boil. 2012, 12, 209. [Google Scholar] [CrossRef] [PubMed]
- Pandey, S.P.; Shahi, P.; Gase, K.; Baldwin, I.T. Herbivory-induced changes in the small-RNA transcriptome and phytohormone signaling in Nicotiana attenuata. Proc. Natl. Acad. Sci. USA 2008, 105, 4559–4564. [Google Scholar] [CrossRef]
- Sattar, S.; Addo-Quaye, C.; Thompson, G.A. miRNA-mediated auxin signalling repression during Vat-mediated aphid resistance in Cucumis melo. Plant Cell Environ. 2016, 39, 1216–1227. [Google Scholar] [CrossRef]
- Li, J.; Zhu, L.; Hull, J.J.; Liang, S.; Daniell, H.; Jin, S.; Zhang, X. Transcriptome analysis reveals a comprehensive insect resistance response mechanism in cotton to infestation by the phloem feeding insectBemisia tabaci(whitefly). Plant Biotechnol. J. 2016, 14, 1956–1975. [Google Scholar] [CrossRef]
- Mi, S.; Cai, T.; Hu, Y.; Chen, Y.; Hodges, E.; Ni, F.; Wu, L.; Li, S.; Zhou, H.; Long, C.; et al. Sorting of small RNAs into Arabidopsis argonaute complexes is directed by the 5’ terminal nucleotide. Cell 2008, 133, 116–127. [Google Scholar] [CrossRef]
- Fan, C.; Hao, Z.; Yan, J.; Li, G. Genome-wide identification and functional analysis of lincRNAs acting as miRNA targets or decoys in maize. BMC Genom. 2015, 16, 793. [Google Scholar] [CrossRef]
- Marin, E.; Jouannet, V.; Herz, A.; Lokerse, A.S.; Weijers, D.; Vaucheret, H.; Nussaume, L.; Crespi, M.D.; Maizel, A. miR390, Arabidopsis TAS3 tasiRNAs, and Their AUXIN RESPONSE FACTOR Targets Define an Autoregulatory Network Quantitatively Regulating Lateral Root Growth. Plant Cell 2010, 22, 1104–1117. [Google Scholar] [CrossRef]
- Montgomery, T.A.; Howell, M.D.; Cuperus, J.T.; Li, D.; Hansen, J.E.; Alexander, A.L.; Chapman, E.J.; Fahlgren, N.; Allen, E.; Carrington, J.C. Specificity of ARGONAUTE7-miR390 Interaction and Dual Functionality in TAS3 Trans-Acting siRNA Formation. Cell 2008, 133, 128–141. [Google Scholar] [CrossRef]
- Arikit, S.; Xia, R.; Kakrana, A.; Huang, K.; Zhai, J.; Yan, Z.; Valdés-López, O.; Prince, S.; Musket, T.A.; Nguyen, H.T.; et al. An Atlas of Soybean Small RNAs Identifies Phased siRNAs from Hundreds of Coding Genes. Plant Cell 2014, 26, 4584–4601. [Google Scholar] [CrossRef] [PubMed]
- Sattar, S.; Song, Y.; Anstead, J.A.; Sunkar, R.; Thompson, G.A. Cucumis meloMicroRNA Expression Profile During Aphid Herbivory in a Resistant and Susceptible Interaction. Mol. Plant-Microbe Interact. 2012, 25, 839–848. [Google Scholar] [CrossRef] [PubMed]
- Kettles, G.J.; Drurey, C.; Schoonbeek, H.-J.; Maule, A.J.; Hogenhout, S.A. Resistance of Arabidopsis thaliana to the green peach aphid, Myzus persicae, involves camalexin and is regulated by microRNAs. New Phytol. 2013, 198, 1178–1190. [Google Scholar] [CrossRef] [PubMed]
- Xia, X.; Shao, Y.; Jiang, J.; Du, X.; Sheng, L.; Chen, F.; Fang, W.; Guan, Z.; Chen, S. MicroRNA Expression Profile during Aphid Feeding in Chrysanthemum (Chrysanthemum morifolium). PLoS ONE 2015, 10, e0143720. [Google Scholar] [CrossRef] [PubMed]
- Horowitz, R.; Denholm, I.; Morin, S. Resistance to Insecticides in the TYLCV vector, Bemisia Tabaci. In Tomato Yellow Leaf Curl Virus Disease; Springer Science and Business Media LLC: Berlin, Germany, 2007; pp. 305–325. [Google Scholar]
- Wang, M.; Yuan, D.; Tu, L.; Gao, W.; He, Y.; Hu, H.; Wang, P.; Liu, N.; Lindsey, K.; Zhang, X. Long noncoding RNAs and their proposed functions in fibre development of cotton (Gossypium spp.). New Phytol. 2015, 207, 1181–1197. [Google Scholar] [CrossRef] [PubMed]
- Franco-Zorrilla, J.M.; Valli, A.; Todesco, M.; Mateos, I.; Puga, M.I.; Rubio-Somoza, I.; Leyva, A.; Weigel, D.; García, J.A.; Paz-Ares, J. Target mimicry provides a new mechanism for regulation of microRNA activity. Nat. Genet. 2007, 39, 1033–1037. [Google Scholar] [CrossRef] [PubMed]
- Gao, C.; Ju, Z.; Cao, D.; Zhai, B.; Qin, G.; Zhu, H.; Fu, D.; Luo, Y.; Zhu, B. MicroRNA profiling analysis throughout tomato fruit development and ripening reveals potential regulatory role of RIN on microRNAs accumulation. Plant Biotechnol. J. 2015, 13, 370–382. [Google Scholar] [CrossRef]
- Eckardt, N.A. A microRNA cascade in plant defense. Plant Cell 2012, 24, 840. [Google Scholar] [CrossRef]
- Li, F.; Pignatta, D.; Bendix, C.; Brunkard, J.O.; Cohn, M.M.; Tung, J.; Sun, H.; Kumar, P.; Baker, B. MicroRNA regulation of plant innate immune receptors. Proc. Natl. Acad. Sci. USA 2012, 109, 1790–1795. [Google Scholar] [CrossRef]
- Foyer, C.H.; Verrall, S.R.; Hancock, R.D. Systematic analysis of phloem-feeding insect-induced transcriptional reprogramming in Arabidopsis highlights common features and reveals distinct responses to specialist and generalist insects. J. Exp. Bot. 2015, 66, 495–512. [Google Scholar] [CrossRef]
- Plavskin, Y.; Nagashima, A.; Perroud, P.-F.; Hasebe, M.; Quatrano, R.S.; Atwal, G.S.; Timmermans, M.C. Ancient trans-Acting siRNAs Confer Robustness and Sensitivity onto the Auxin Response. Dev. Cell 2016, 36, 276–289. [Google Scholar] [CrossRef] [PubMed]
- Gaquerel, E.; Stitz, M. Insect Resistance: An Emerging Molecular Framework Linking Plant Age and JA Signaling. Mol. Plant 2017, 10, 537–539. [Google Scholar] [CrossRef] [PubMed]
- Tu, L.; Zhang, X.; Liu, D.; Jin, S.; Cao, J.; Zhu, L.; Deng, F.; Tan, J.; Zhang, C. Suitable internal control genes for qRT-PCR normalization in cotton fiber development and somatic embryogenesis. Chin. Sci. Bull. 2007, 52, 3110–3117. [Google Scholar] [CrossRef]
- German, M.A.; Pillay, M.; Jeong, D.-H.; Hetawal, A.; Luo, S.; Janardhanan, P.; Kannan, V.; Rymarquis, L.A.; Nobuta, K.; German, R.; et al. Global identification of microRNA–target RNA pairs by parallel analysis of RNA ends. Nat. Biotechnol. 2008, 26, 941–946. [Google Scholar] [CrossRef]
- Patel, R.K.; Jain, M. NGS QC Toolkit: A Toolkit for Quality Control of Next Generation Sequencing Data. PLoS ONE 2012, 7, e30619. [Google Scholar] [CrossRef]
- Zhang, T.; Hu, Y.; Jiang, W.; Fang, L.; Guan, X.; Chen, J.; Zhang, J.; Saski, C.A.; Scheffler, B.E.; Stelly, D.M.; et al. Sequencing of allotetraploid cotton (Gossypium hirsutum L. acc. TM-1) provides a resource for fiber improvement. Nat. Biotechnol. 2015, 33, 531–537. [Google Scholar] [CrossRef]
- Paterson, A.H.; Wendel, J.F.; Gundlach, H.; Guo, H.; Jenkins, J.; Jin, D.; Llewellyn, D.; Showmaker, K.C.; Shu, S.; Udall, J.; et al. Repeated polyploidization of Gossypium genomes and the evolution of spinnable cotton fibres. Nature 2012, 492, 423–427. [Google Scholar] [CrossRef]
- Jones-Rhoades, M.W.; Bartel, D.P. Computational Identification of Plant MicroRNAs and Their Targets, Including a Stress-Induced miRNA. Mol. Cell 2004, 14, 787–799. [Google Scholar] [CrossRef]
- Yang, X.; Li, L. miRDeep-P: A computational tool for analyzing the microRNA transcriptome in plants. Bioinformatics 2011, 27, 2614–2615. [Google Scholar] [CrossRef]
- Kozomara, A.; Griffiths-Jones, S. miRBase: Annotating high confidence microRNAs using deep sequencing data. Nucleic Acids Res. 2014, 42, D68–D73. [Google Scholar] [CrossRef]
- Anders, S.; Huber, W. Differential expression analysis for sequence count data. Genome Boil. 2010, 11, R106. [Google Scholar] [CrossRef] [PubMed]
- Addo-Quaye, C.; Miller, W.; Axtell, M.J. CleaveLand: A pipeline for using degradome data to find cleaved small RNA targets. Bioinformatics 2009, 25, 130–131. [Google Scholar] [CrossRef] [PubMed]
- Trapnell, C.; Roberts, A.; Goff, L.; Pertea, G.; Kim, D.; Kelley, D.R.; Pimentel, H.; Salzberg, S.L.; Rinn, J.L.; Pachter, L. Differential gene and transcript expression analysis of RNA-seq experiments with TopHat and Cufflinks. Nat. Protoc. 2012, 7, 562–578. [Google Scholar] [CrossRef] [PubMed]
- Trapnell, C.; Williams, B.A.; Pertea, G.; Mortazavi, A.; Kwan, G.; Van Baren, M.J.; Salzberg, S.L.; Wold, B.J.; Pachter, L. Transcript assembly and quantification by RNA-Seq reveals unannotated transcripts and isoform switching during cell differentiation. Nat. Biotechnol. 2010, 28, 511–515. [Google Scholar] [CrossRef]
- Sun, L.; Luo, H.; Bu, D.; Zhao, G.; Yu, K.; Zhang, C.; Liu, Y.; Chen, R.; Zhao, Y. Utilizing sequence intrinsic composition to classify protein-coding and long non-coding transcripts. Nucleic Acids Res. 2013, 41, e166. [Google Scholar] [CrossRef]
- Varkonyi-Gasic, E.; Wu, R.; Wood, M.; Walton, E.F.; Hellens, R.P. Protocol: A highly sensitive RT-PCR method for detection and quantification of microRNAs. Plant Methods 2007, 3, 12. [Google Scholar] [CrossRef]
- Pfaffl, M.W. A new mathematical model for relative quantification in real-time RT-PCR. Nucleic Acids Res. 2001, 29, 45. [Google Scholar] [CrossRef]
- Guo, Q.; Qu, X.; Jin, W. PhaseTank: Genome-wide computational identification of phasiRNAs and their regulatory cascades. Bioinformatics 2015, 31, 284–286. [Google Scholar] [CrossRef]
- Robinson, J.T.; Thorvaldsdóttir, H.; Winckler, W.; Guttman, M.; Lander, E.S.; Getz, G.; Mesirov, J.P. Integrative genomics viewer. Nat. Biotechnol. 2011, 29, 24–26. [Google Scholar] [CrossRef]
- Liu, H.; Li, X.; Xiao, J.; Wang, S. A convenient method for simultaneous quantification of multiple phytohormones and metabolites: Application in study of rice-bacterium interaction. Plant Methods 2012, 8, 2. [Google Scholar] [CrossRef]
© 2019 by the authors. Licensee MDPI, Basel, Switzerland. This article is an open access article distributed under the terms and conditions of the Creative Commons Attribution (CC BY) license (http://creativecommons.org/licenses/by/4.0/).