The Selective Acetamidine-Based iNOS Inhibitor CM544 Reduces Glioma Cell Proliferation by Enhancing PARP-1 Cleavage In Vitro

 ,
,  ,
,  , , ,
, , , 
Abstract
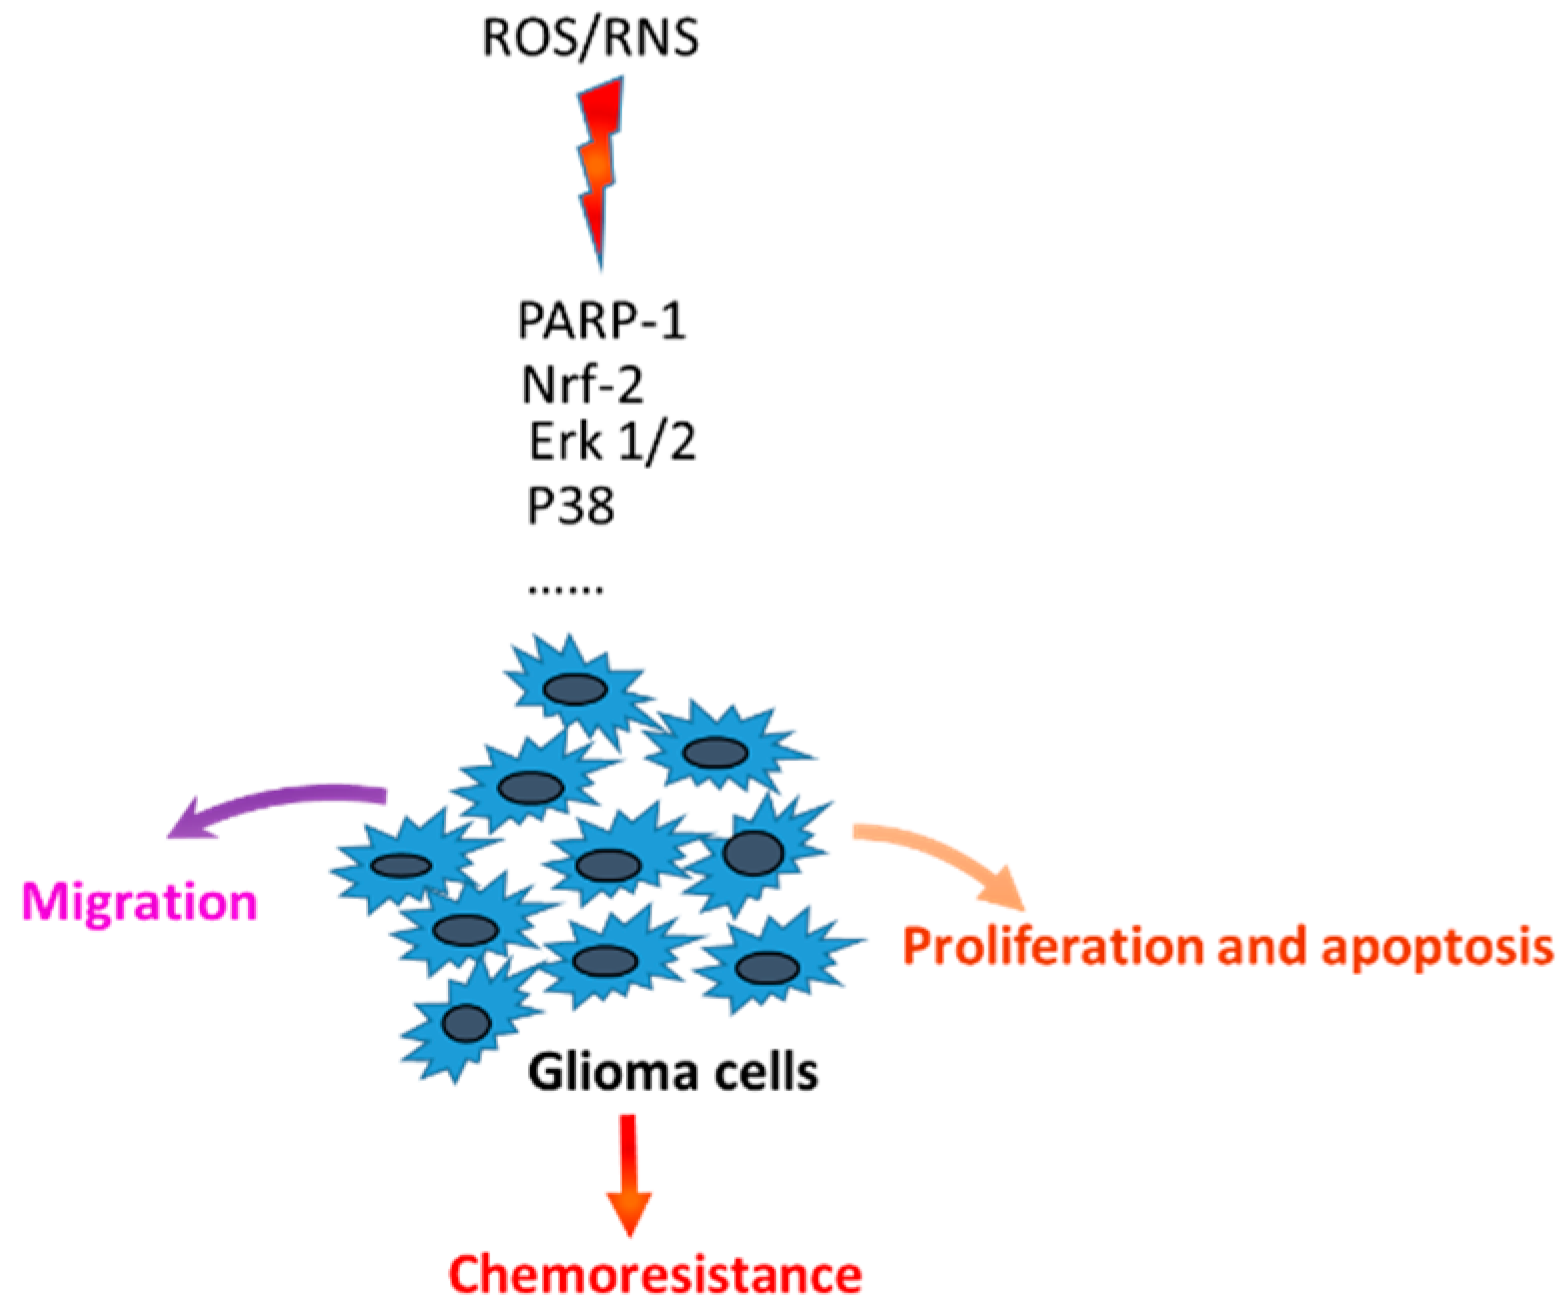
:1. Introduction
2. Results
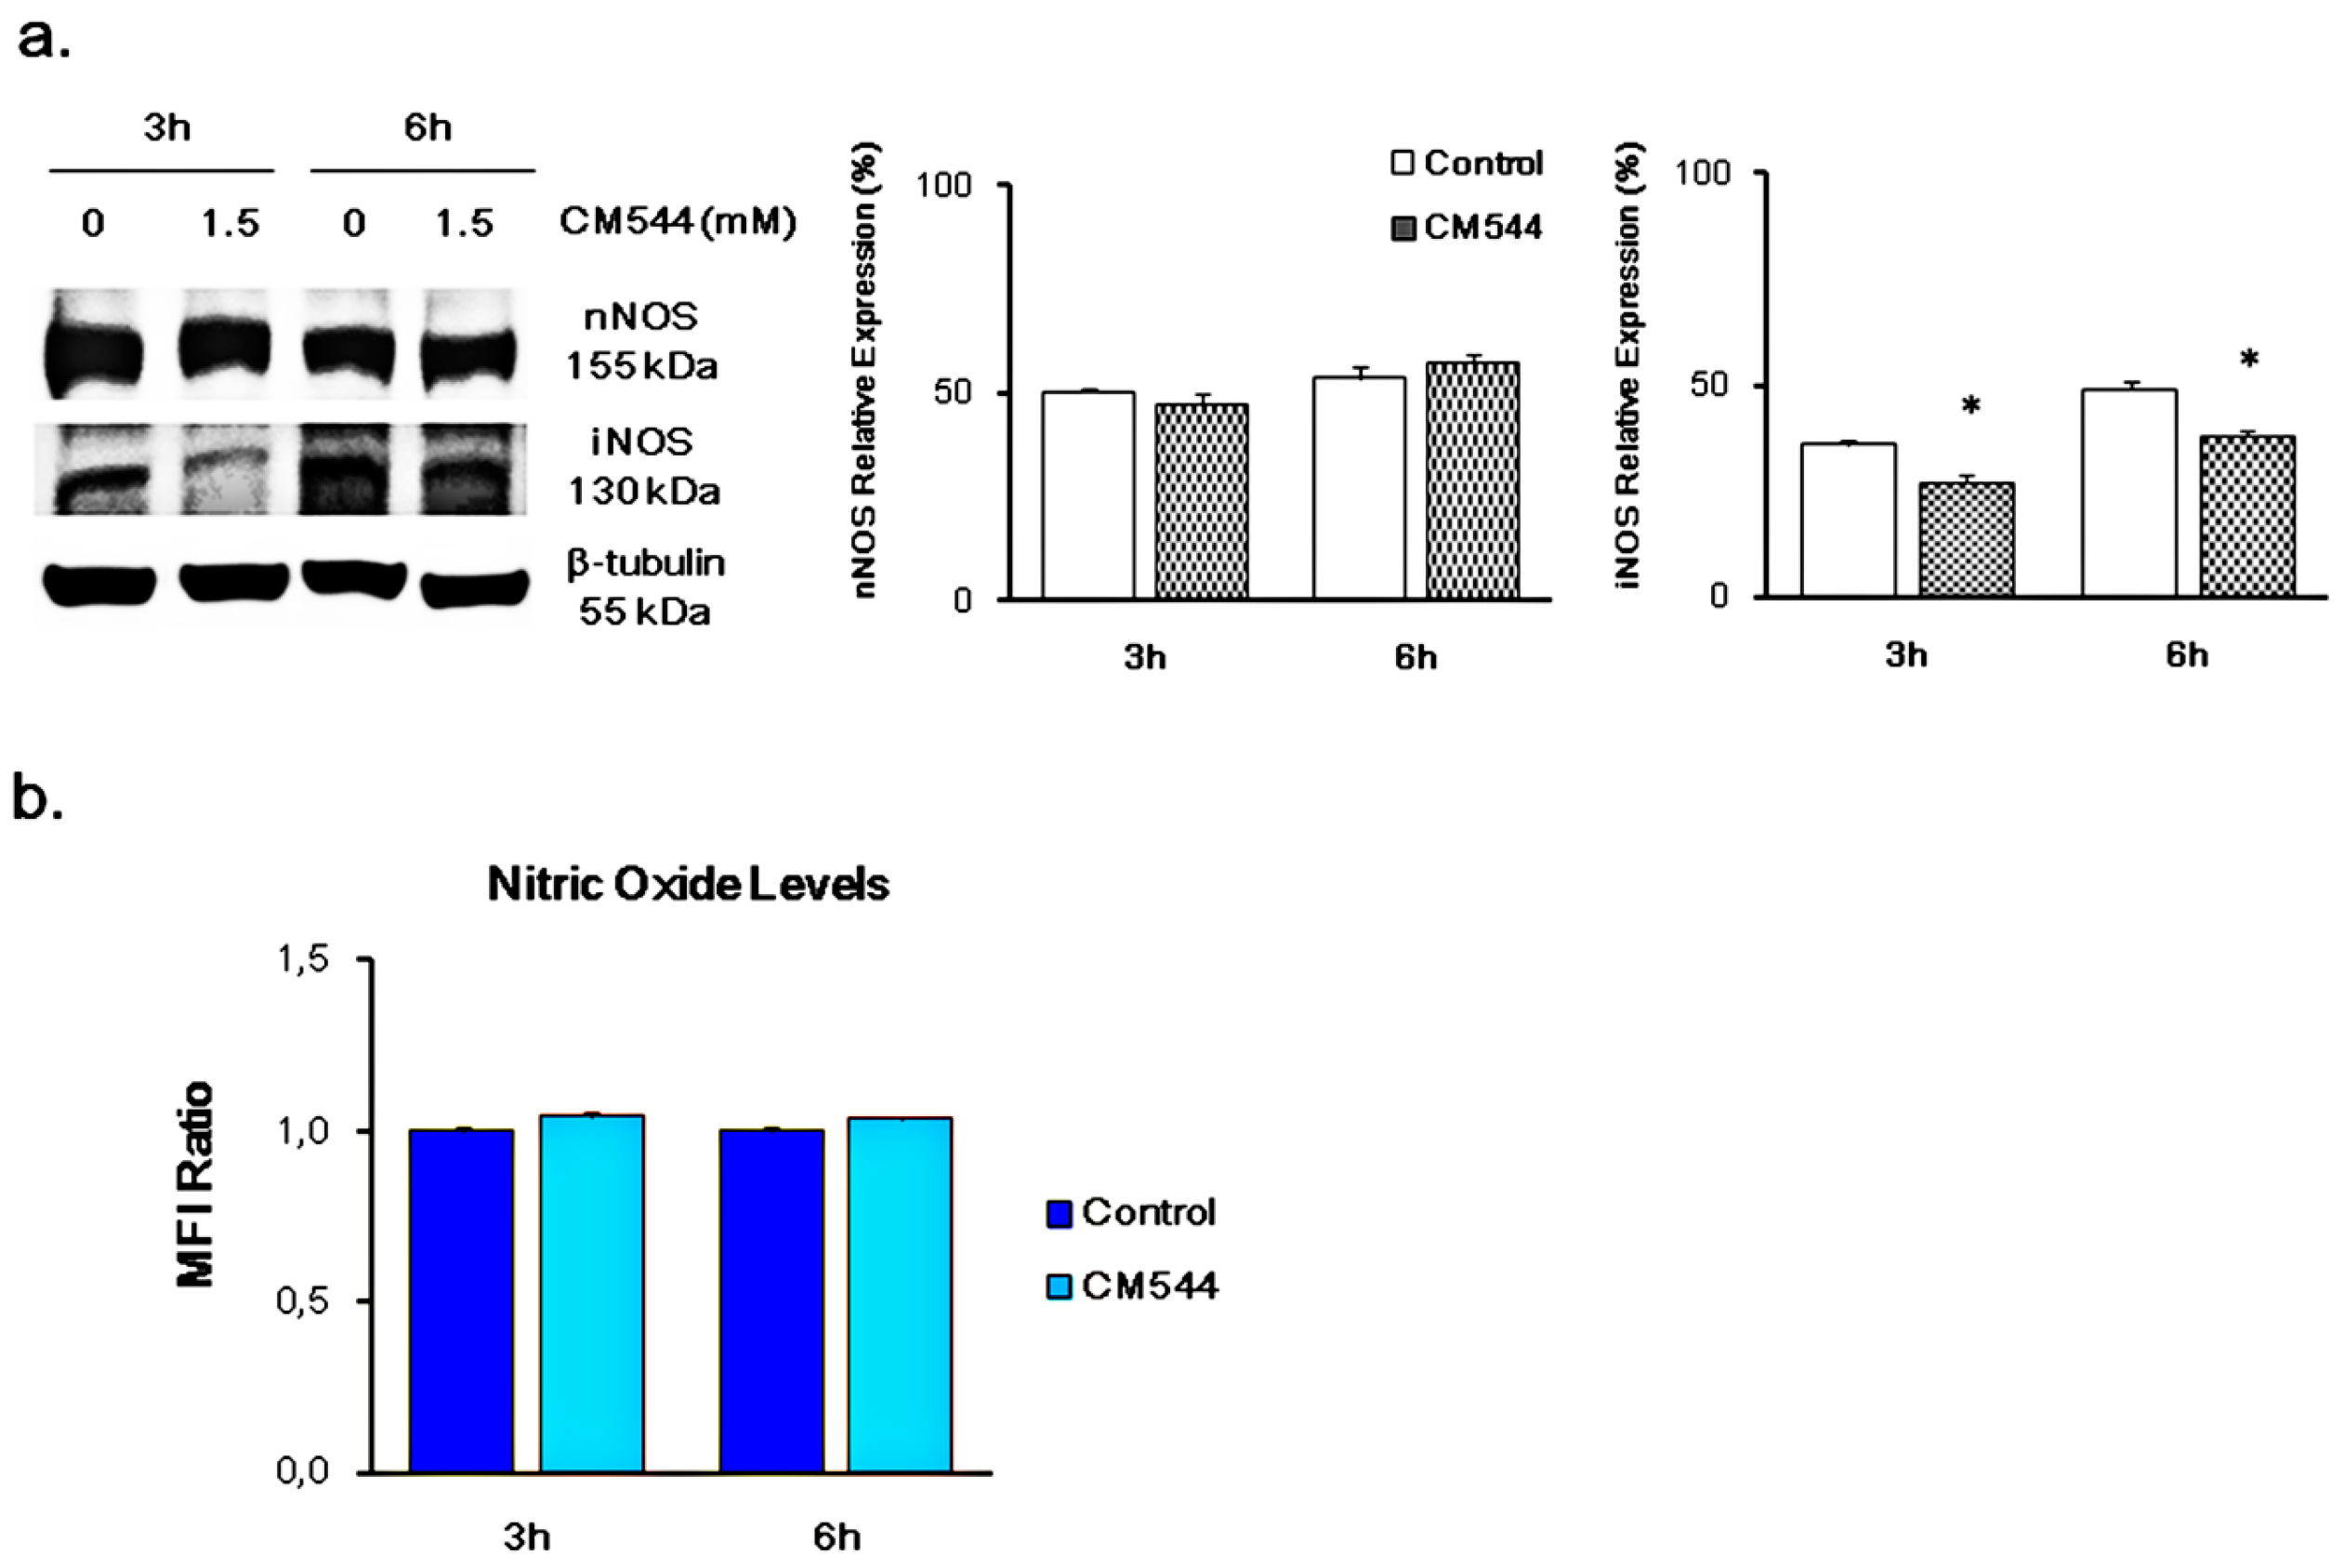
2.1. CM544 Influences the Expression of iNOS after Short Times of Exposure and is Ineffective on the Release of Free NO●
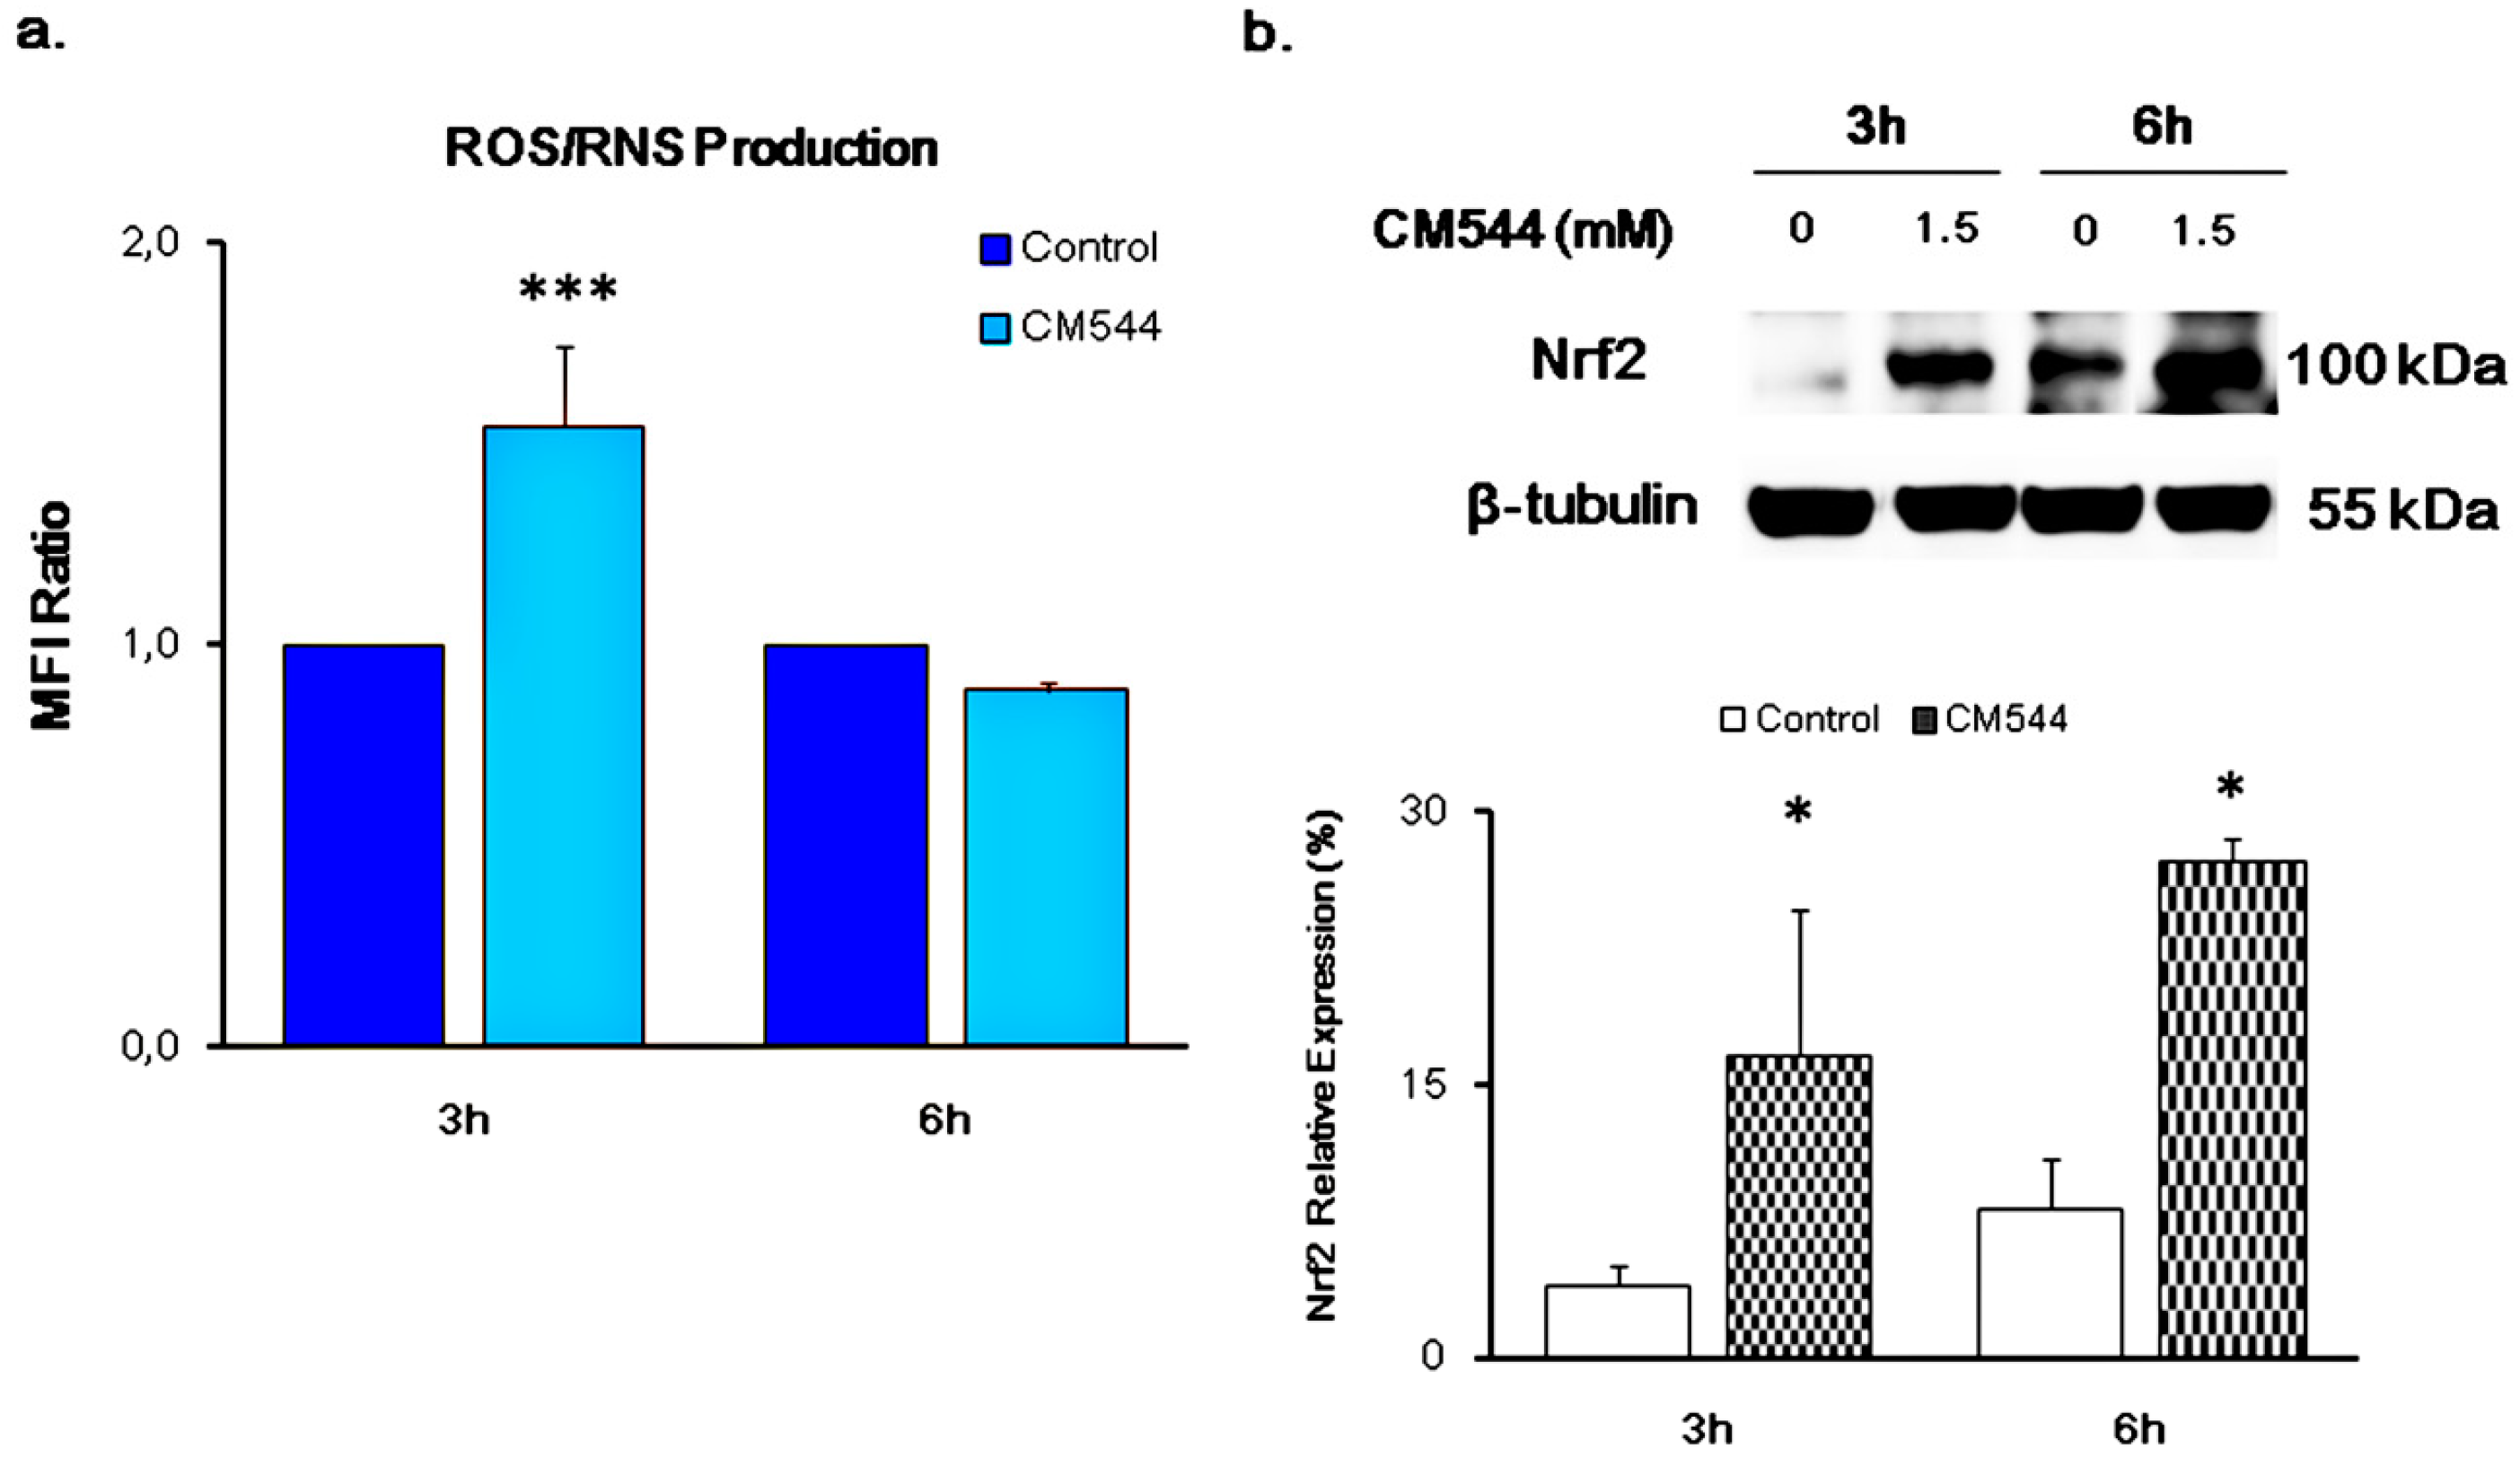
2.2. CM544 Enhances the Generation of Reactive Oxygen/Nitrogen Species and Induces the Expression of Nrf-2
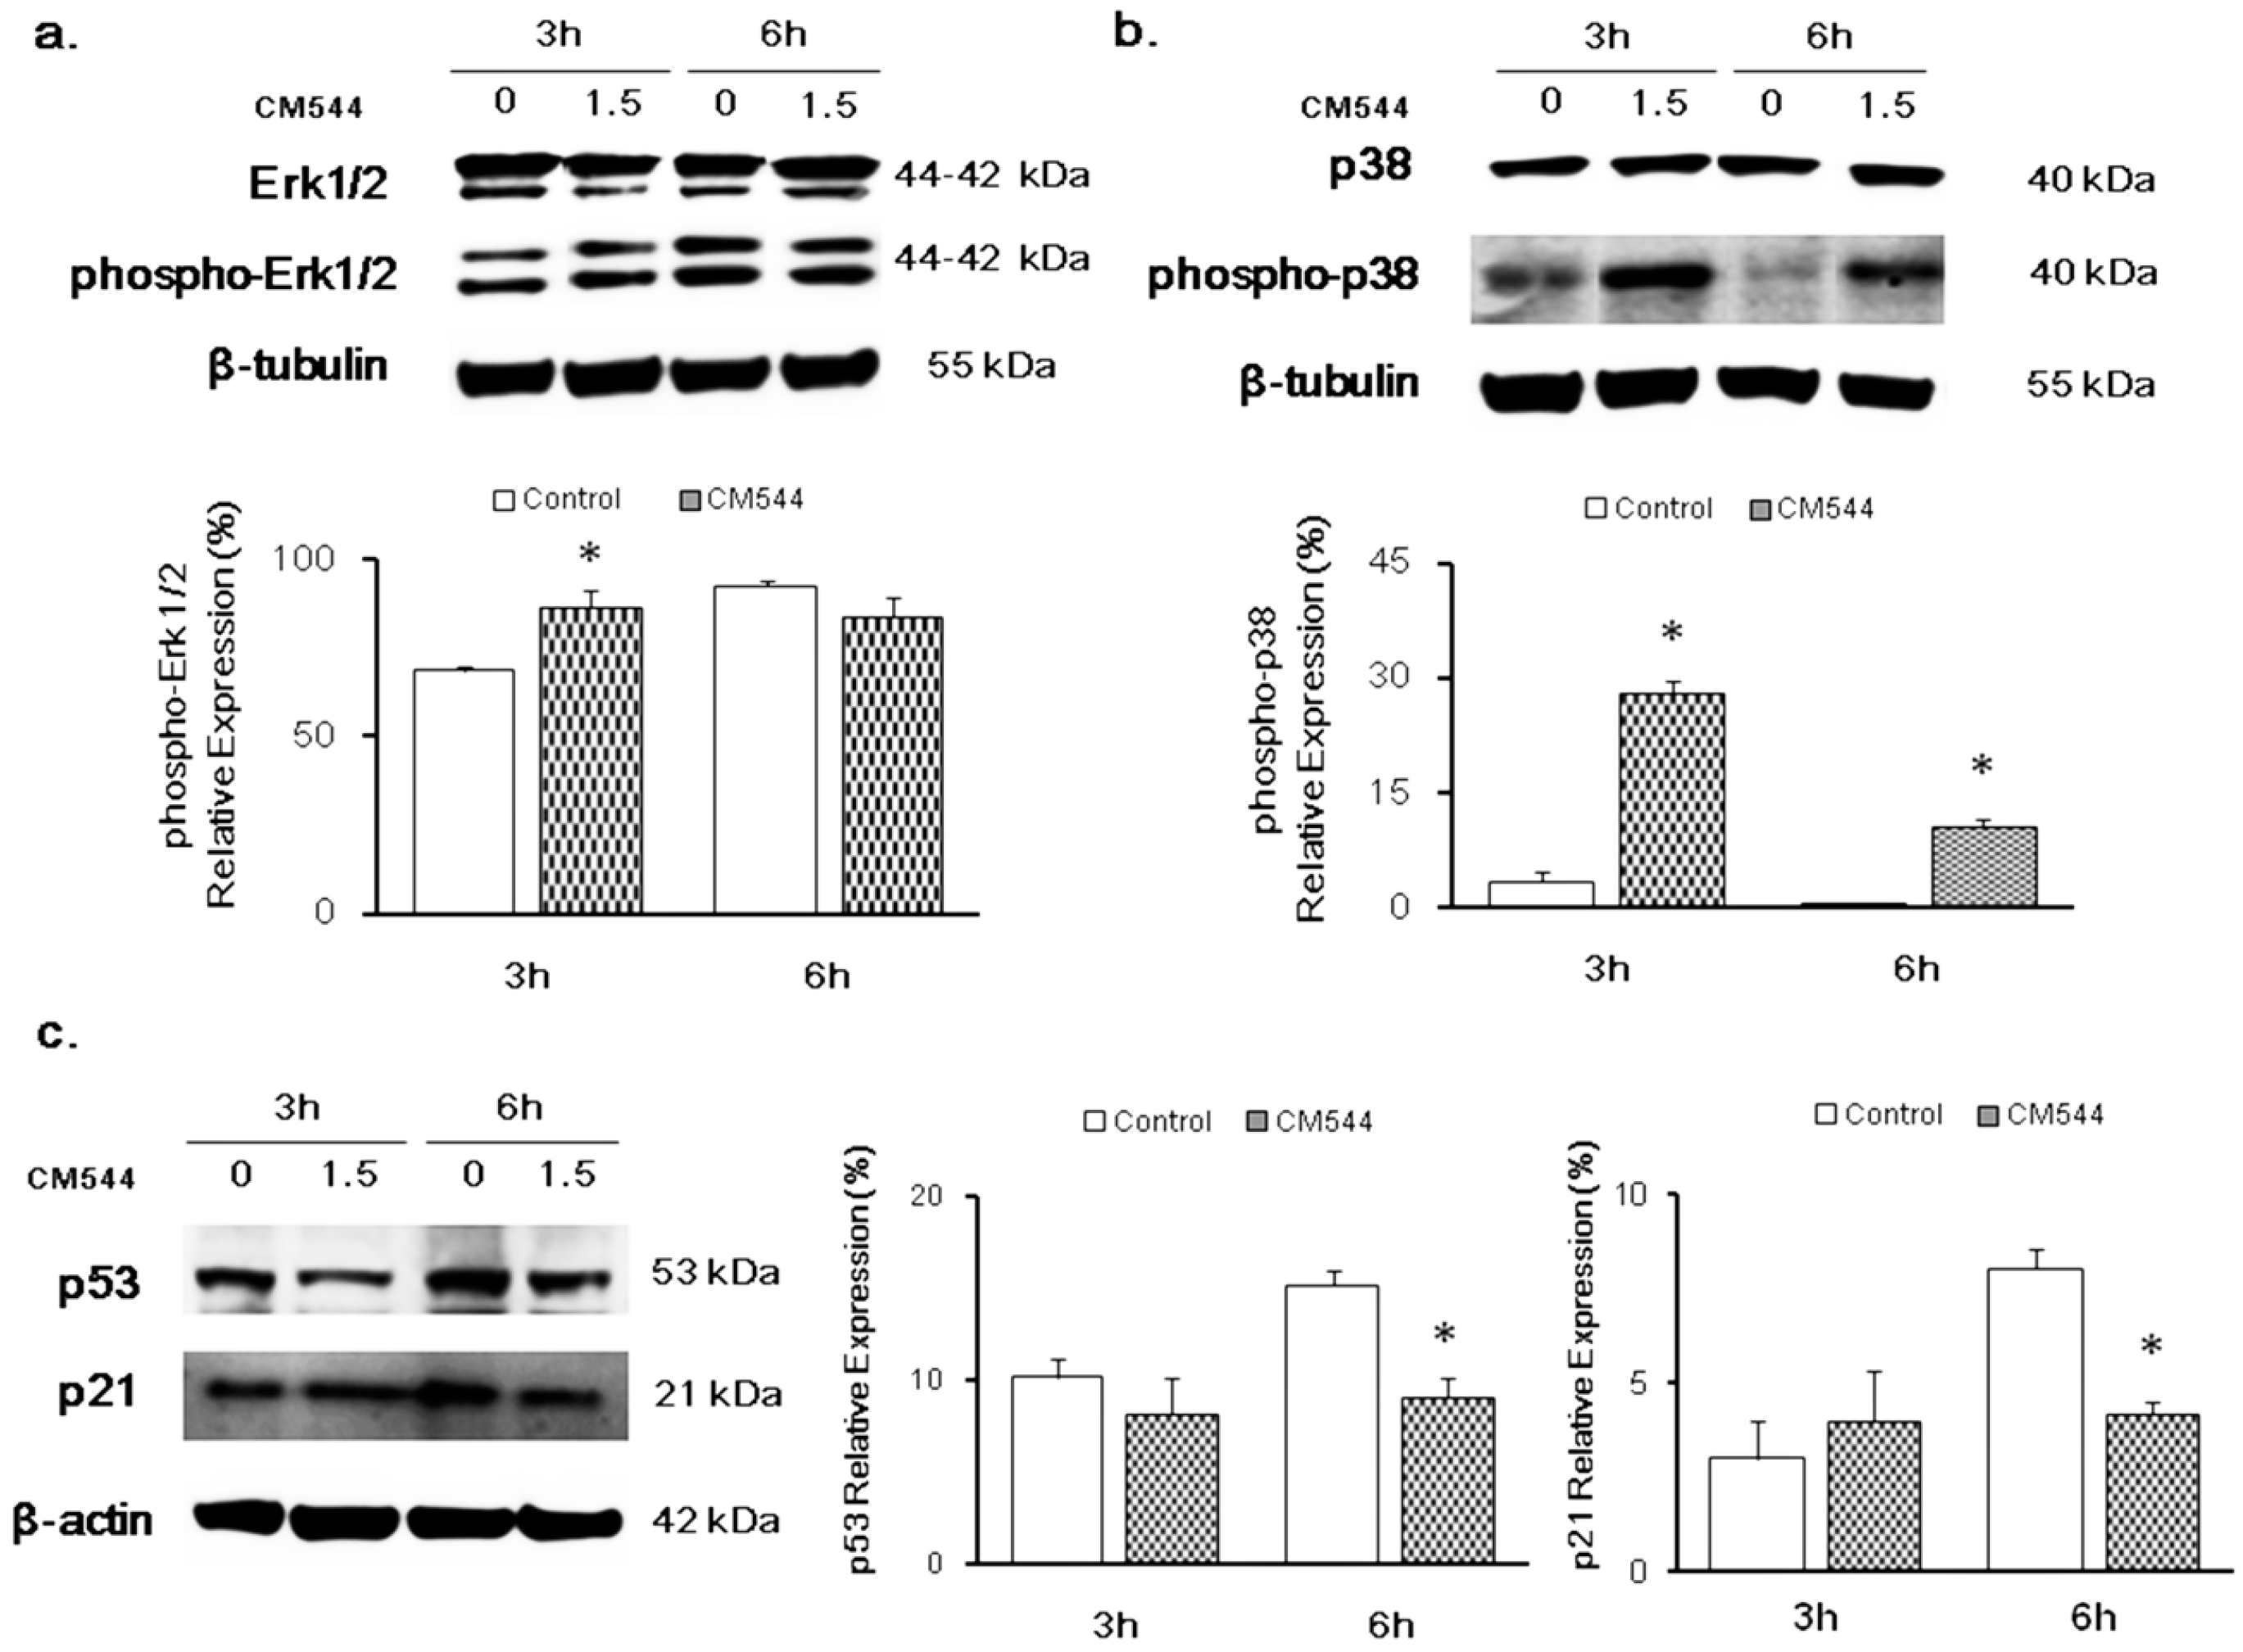
2.3. Modulation of MAPKs and p53 in the Presence of CM544
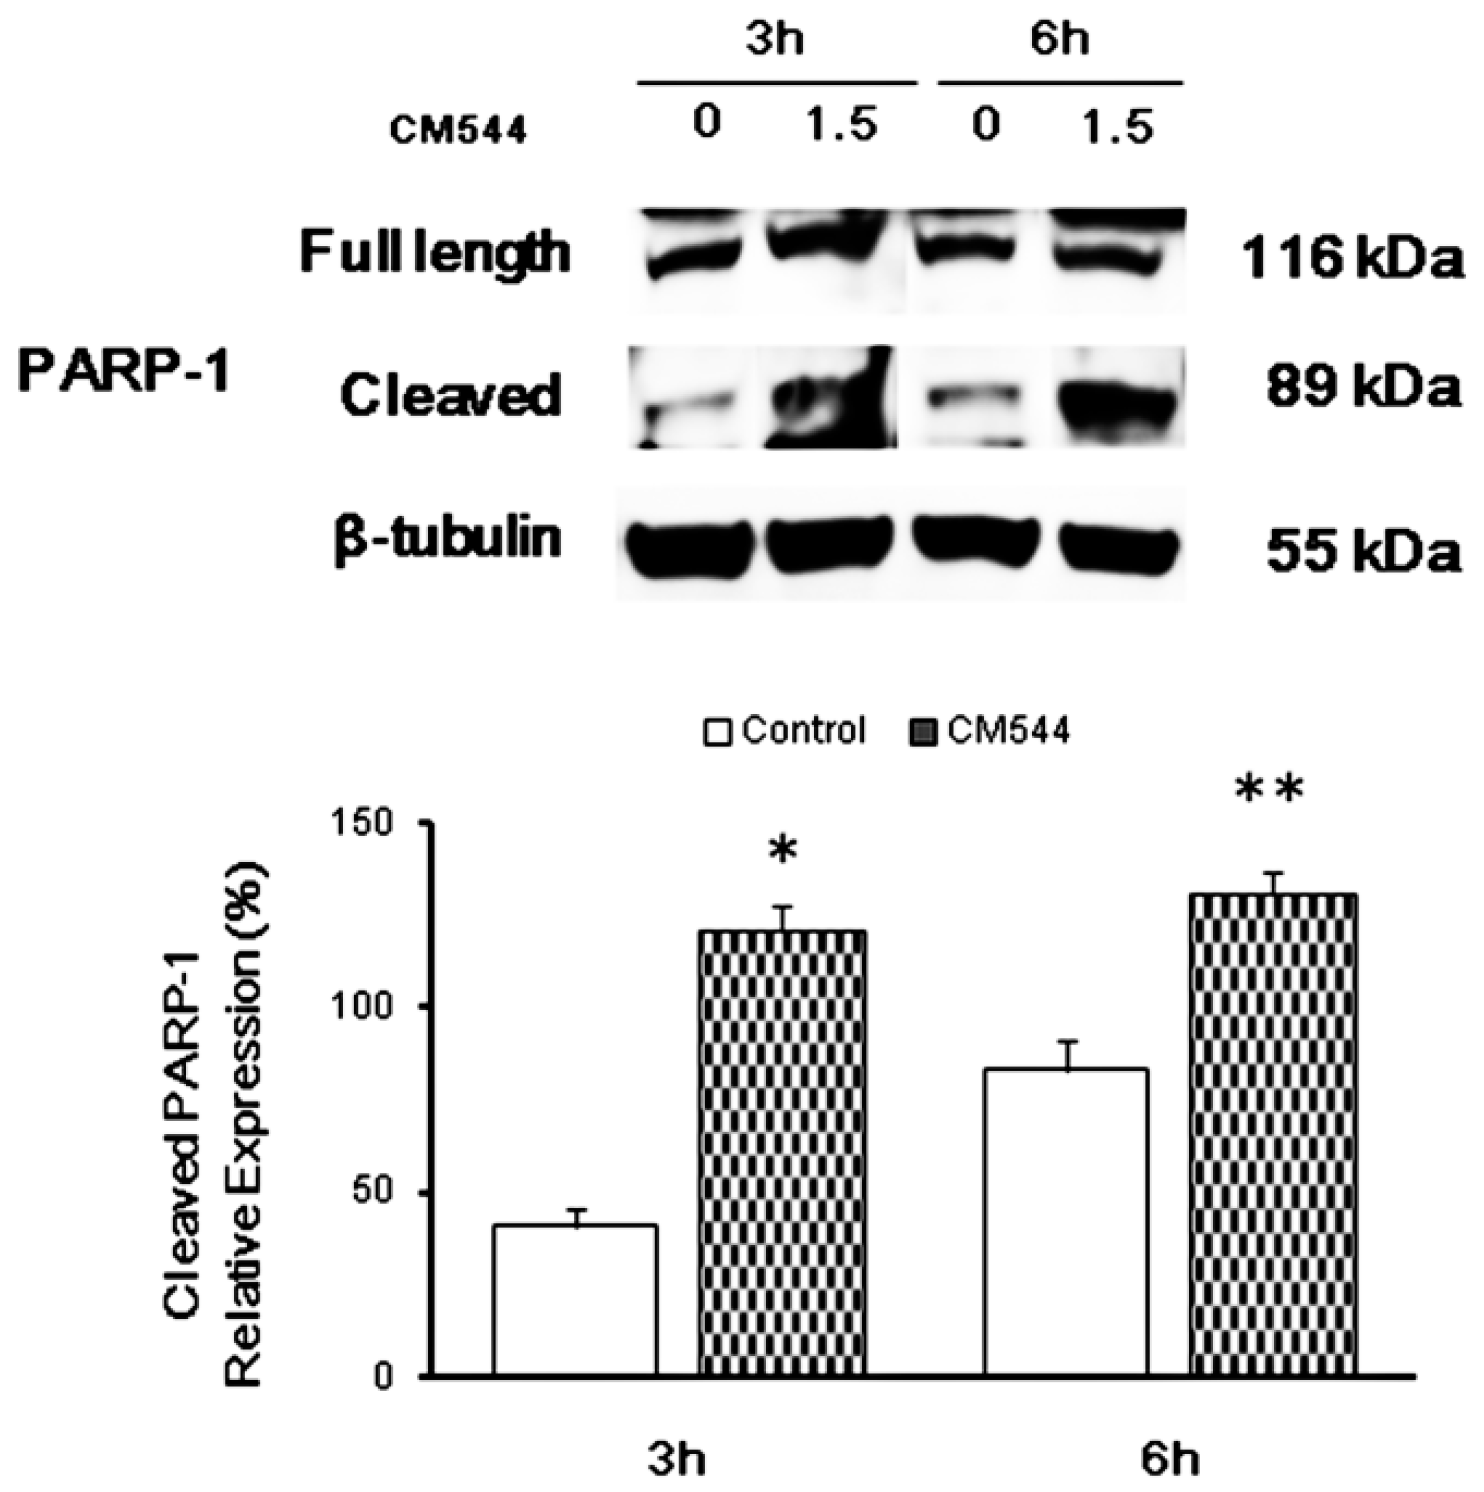
2.4. CM544 Causes PARP-1 Activation after 3 h of Treatment
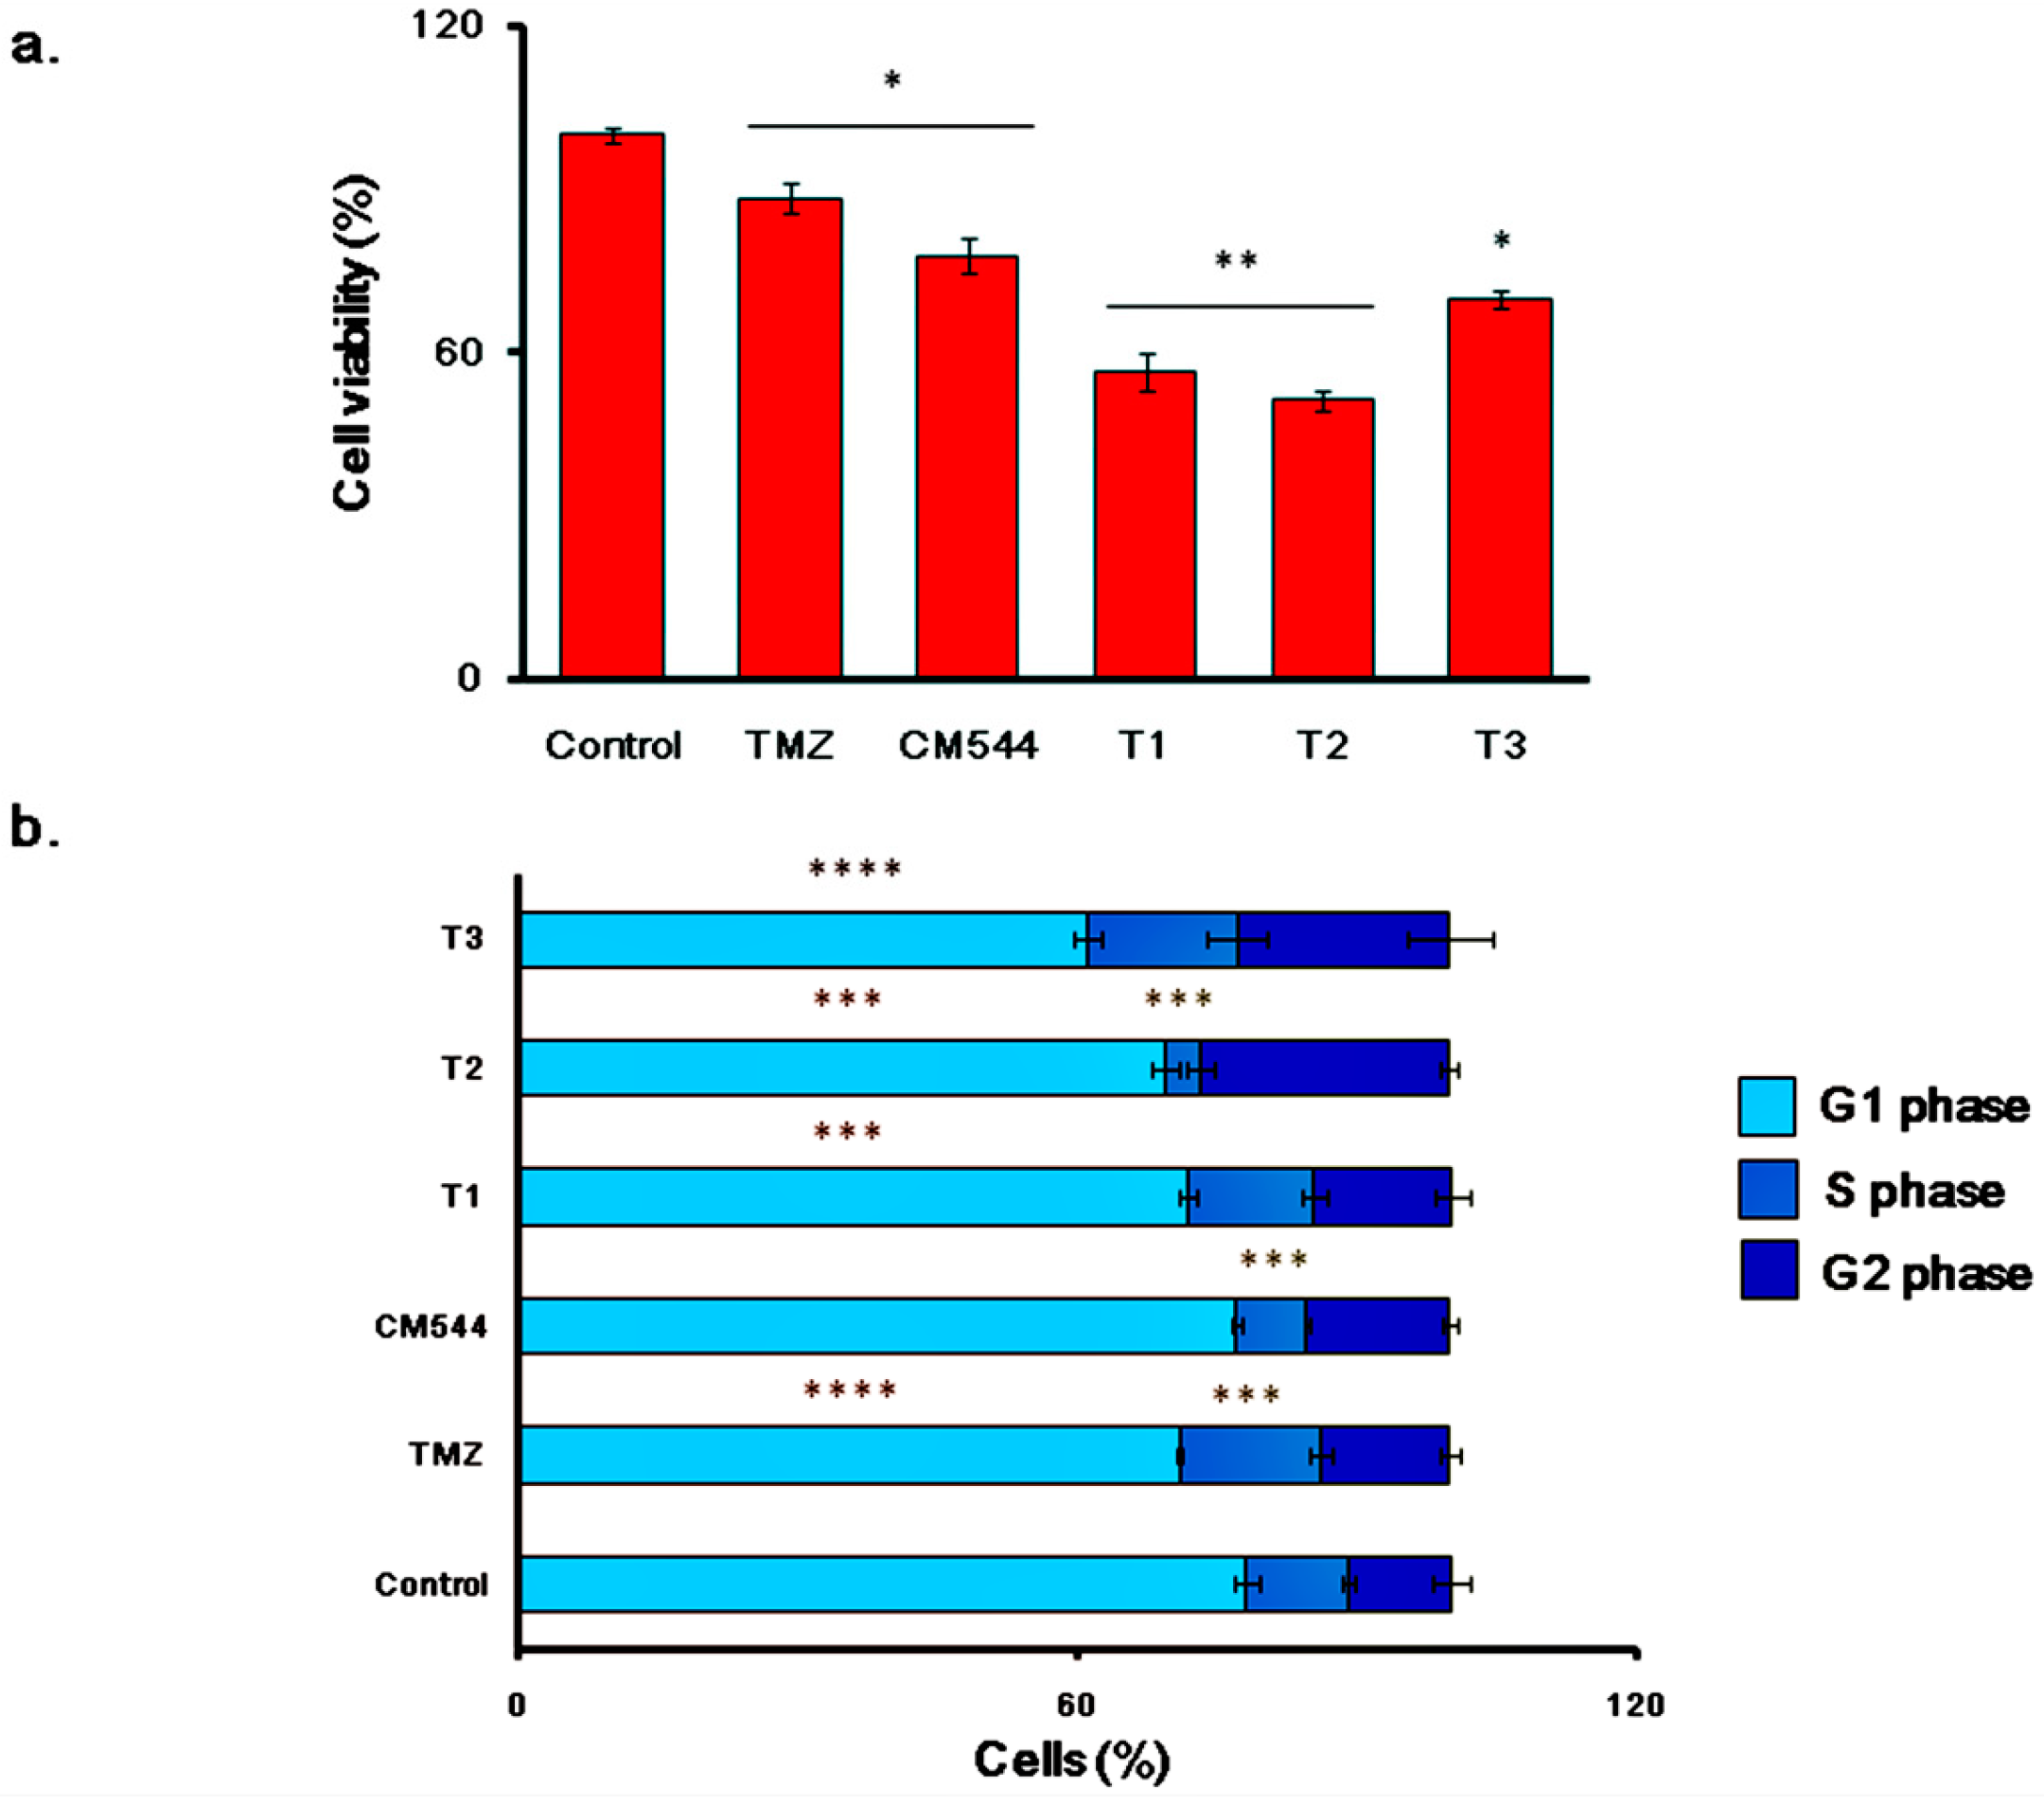
2.5. Cell Metabolic Activity and Cell Cycle Progression in Cultures Exposed to TMZ and CM544
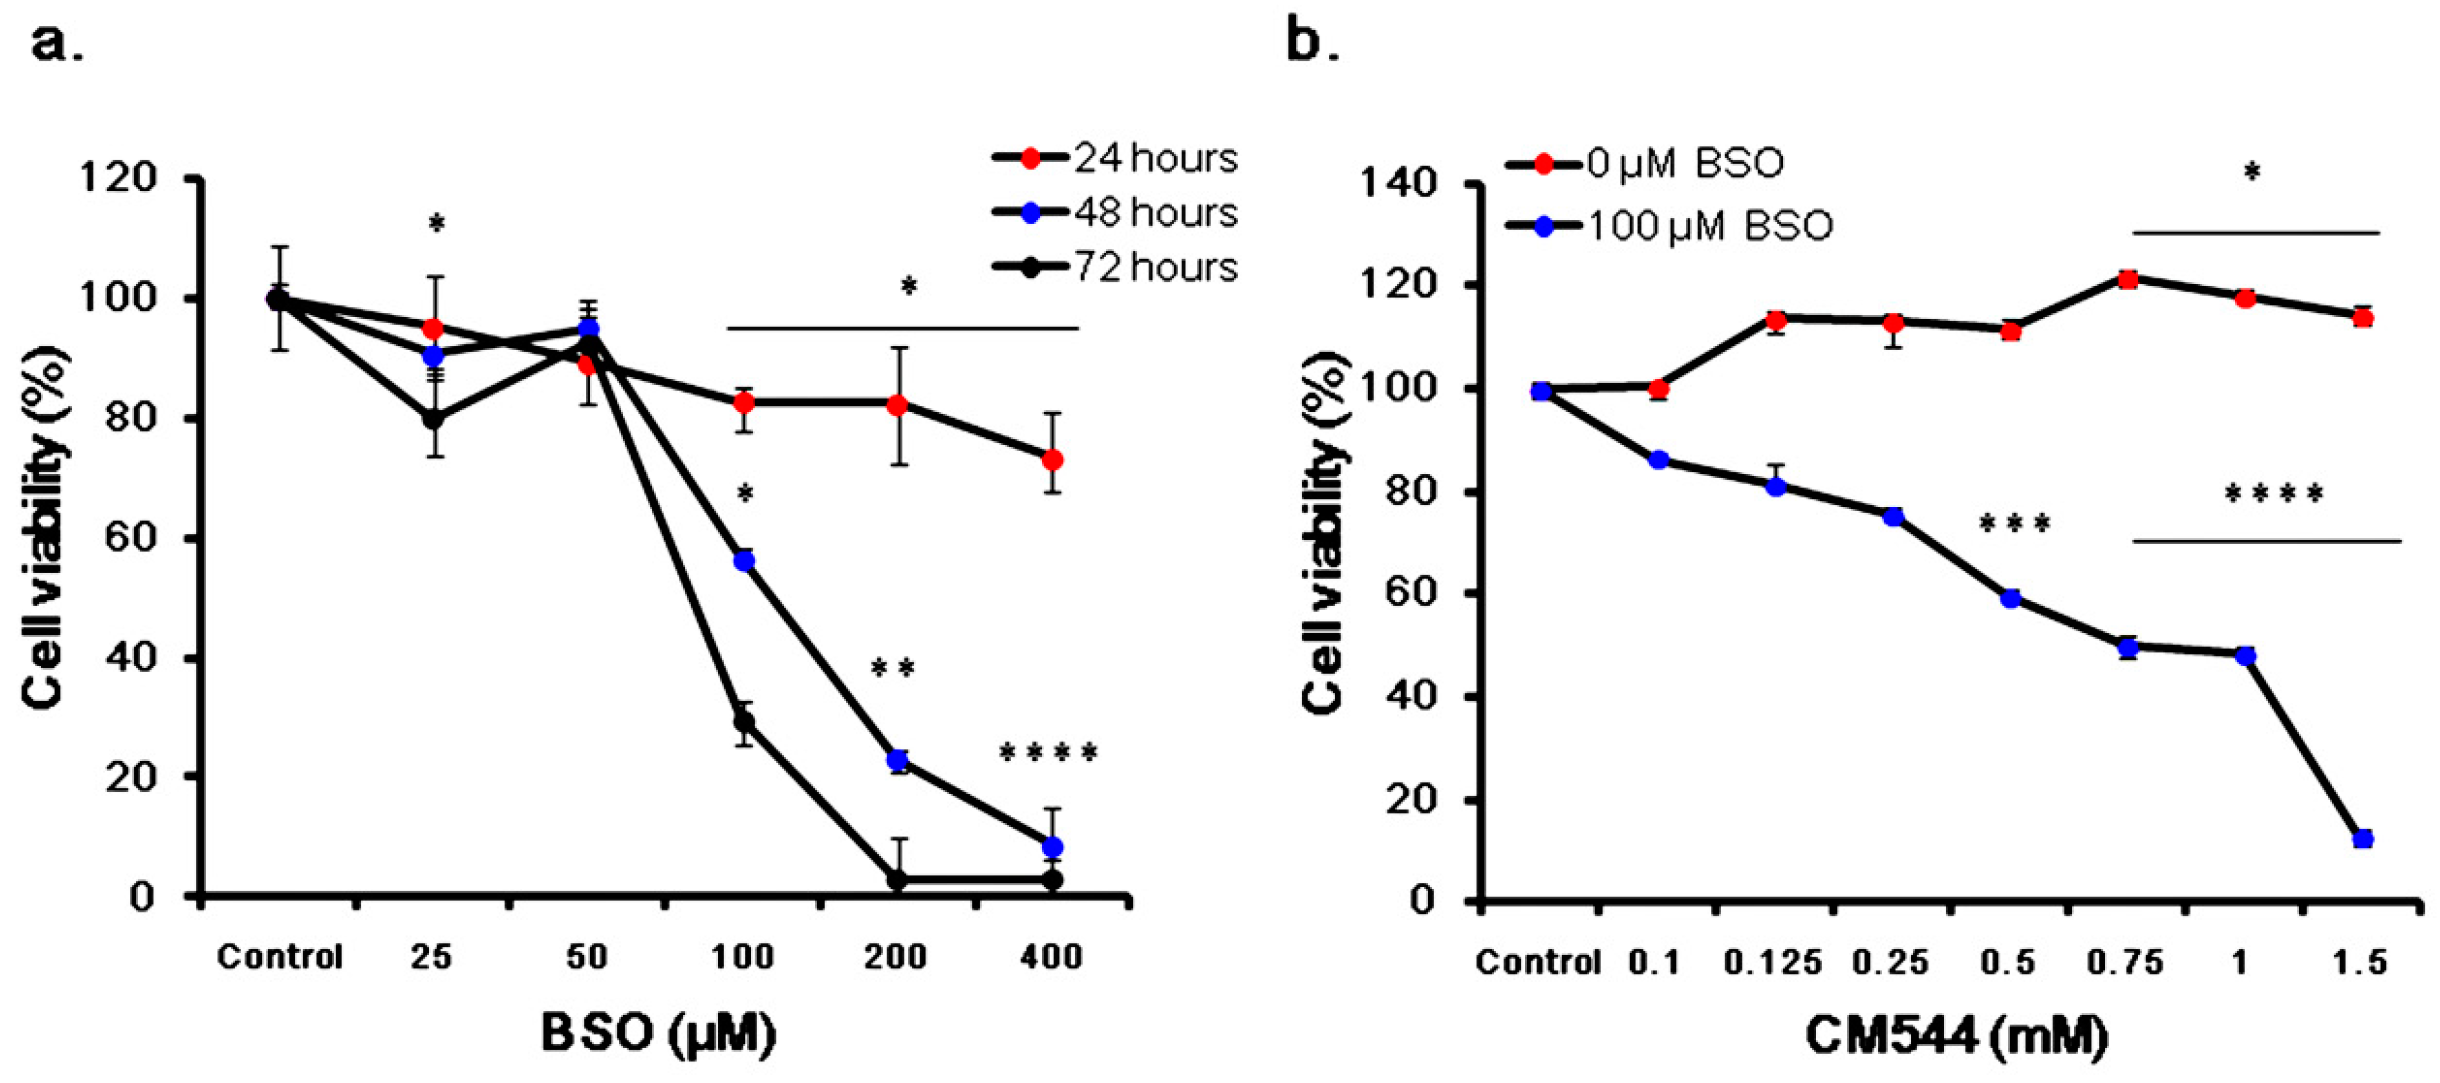
2.6. Cell Viability of CM544-Exposed Cells in the Presence of BSO
3. Discussion
4. Materials and Methods
4.1. Materials
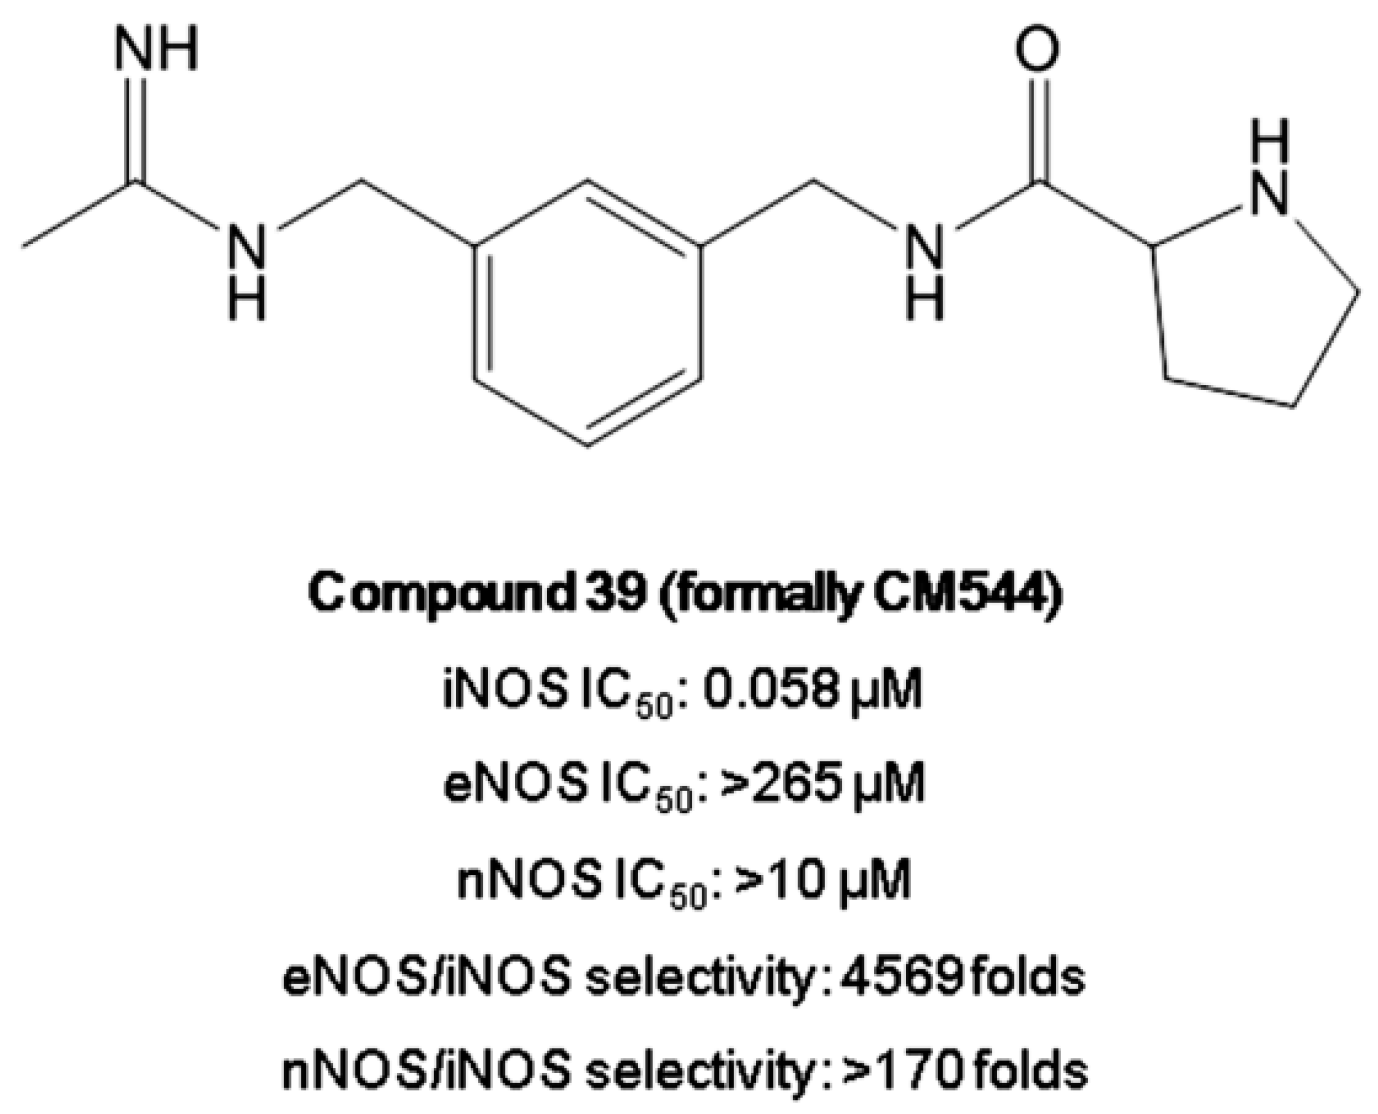
4.2. Synthesis
4.3. Cell Culture
4.4. Generation of NO●
4.5. Formation of ROS/RNS
4.6. Cell Lysis and Protein Extraction
4.7. Immunoblotting
4.8. MTT Assay
4.9. Cell Cycle Analysis
4.10. Quantification and Statistical Analysis
5. Conclusions
Author Contributions
Funding
Conflicts of Interest
References
- Garrido, W.; Rocha, J.D.; Jaramillo, C.; Fernandez, K.; Oyarzún, C.; Martin, R.S. Chemoresistance in high-grade gliomas: Relevance of adenosine signalling in stem-like cells of glioblastoma multiforme. Curr. Drug Targets 2014, 15, 931–942. [Google Scholar] [PubMed]
- Ahmed, R.; Oborski, M.J.; Hwang, M.; Lieberman, F.S.; Mountz, J.M. Malignant gliomas: Current perspectives in diagnosis, treatment, and early response assessment using advanced quantitative imaging methods. Cancer Manag. Res. 2014, 6, 149–170. [Google Scholar] [CrossRef] [PubMed]
- Ghimire, K.; Altmann, H.M.; Straub, A.C.; Isenberg, J.S. Nitric oxide: What’s new to NO? Am. J. Physiol. Cell Physiol. 2017, 312, C254–C262. [Google Scholar] [CrossRef]
- Cobbs, C.S.; Whisenhunt, T.R.; Wesemann, D.R.; Harkins, L.E.; Van Meir, E.G.; Samanta, M. Inactivation of wild-type p53 protein function by reactive oxygen and nitrogen species in malignant glioma cells. Cancer Res. 2003, 63, 8670–8673. [Google Scholar] [PubMed]
- Vannini, F.; Kashfi, K.; Nath, N. The dual role of iNOS in cancer. Redox Biol. 2015, 6, 334–343. [Google Scholar] [CrossRef] [PubMed] [Green Version]
- El-Sehemy, A.; Postovit, L.M.; Fu, Y. Nitric oxide signaling in human ovarian cancer: A potential therapeutic target. Nitric Oxide 2016, 54, 30–37. [Google Scholar] [CrossRef] [PubMed]
- Wu, X.; Song, M.; Gao, Z.; Sun, Y.; Wang, M.; Li, F.; Zheng, J.; Xiao, H. Nobiletin and its colonic metabolites suppress colitis-associated colon carcinogenesis by down-regulating iNOS, inducing antioxidative enzymes and arresting cell cycle progression. J. Nutr. Biochem. 2017, 42, 17–25. [Google Scholar] [CrossRef]
- Badn, W.; Siesjö, P. The dual role of nitric oxide in glioma. Curr. Pharm. Des. 2010, 16, 428–430. [Google Scholar]
- Eyler, C.E.; Wu, Q.; Yan, K.; MacSwords, J.M.; Chandler-Militello, D.; Misuraca, K.L.; Lathia, J.D.; Forrester, M.T.; Lee, J.; Stamler, J.S.; et al. Glioma stem cell proliferation and tumor growth are promoted by nitric oxide synthase-2. Cell 2011, 146, 53–66. [Google Scholar] [CrossRef]
- Pacella, S.; Fiorito, J.; Cacciatore, I.; di Giacomo, V.; Patruno, A.; Rapino, M.; Di Stefano, A.; Marinelli, L.; Fornasari, E.; Cataldi, A.; et al. Effect of MRJF4 on C6 Glioma Cells Proliferation and Migration. Cent. Nerv. Syst. Agents Med. Chem. 2017, 17, 129–134. [Google Scholar] [CrossRef]
- Palumbo, P.; Lombardi, F.; Siragusa, G.; Dehcordi, S.R.; Luzzi, S.; Cimini, A.; Cifone, M.G.; Cinque, B. Involvement of NOS2 activity on human glioma cell growth, clonogenic potential, and neurosphere generation. Int. J. Mol. Sci. 2018, 19, 2801. [Google Scholar] [CrossRef] [PubMed]
- Murnyák, B.; Kouhsari, M.C.; Hershkovitch, R.; Kálmán, B.; Marko-Varga, G.; Klekner, Á.; Hortobàgyi, T. PARP1 expression and its correlation with survival is tumour molecular subtype dependent in glioblastoma. Oncotarget 2017, 8, 46348–46362. [Google Scholar] [CrossRef] [PubMed]
- Mathews, M.T.; Berk, B.C. PARP-1 inhibition prevents oxidative and nitrosative stress-induced endothelial cell death via transactivation of the VEGF receptor 2. Arterioscler. Thromb. Vasc. Biol. 2008, 28, 711–717. [Google Scholar] [CrossRef] [PubMed]
- Nikoletopoulou, V.; Markaki, M.; Palikaras, K.; Tavernarakis, N. Crosstalk between apoptosis, necrosis and autophagy. Biochim. Biophys. Acta 2013, 1833, 3448–3459. [Google Scholar] [CrossRef] [PubMed] [Green Version]
- Fan, J.; Dawson, T.M.; Dawson, V.L. Cell Death Mechanisms of Neurodegeneration. Adv. Neurobiol. 2017, 15, 403–425. [Google Scholar] [CrossRef] [PubMed]
- Bouchard, V.J.; Rouleau, M.; Poirer, G.G. PARP-1, a determinant of cell survival in response to DNA damage. Exp. Hematol. 2003, 31, 446–454. [Google Scholar] [CrossRef] [PubMed]
- Pandey, V.; Bhaskara, V.K.; Babu, P.P. Implications of mitogen-activated protein kinase signaling in glioma. J. Neurosci. Res. 2016, 94, 114–127. [Google Scholar] [CrossRef]
- Lo, H.W. Targeting Ras-RAF-ERK and its interactive pathways as a novel therapy for malignant gliomas. Curr. Cancer Drug Targets 2010, 10, 840–848. [Google Scholar]
- Barbero, S.; Bajetto, A.; Bonavia, R.; Porcile, C.; Piccioli, P.; Pirani, P.; Ravetti, J.L.; Zona, G.; Spaziante, R.; Florio, T.; et al. Expression of the chemokine receptor CXCR4 and its ligand stromal cell-derived factor 1 in human brain tumors and their involvement in glial proliferation in vitro. Ann. N. Y. Acad. Sci. 2002, 973, 60–69. [Google Scholar] [CrossRef]
- Rodríguez-García, A.; Samsó, P.; Fontova, P.; Simon-Molas, H.; Manzano, A.; Castaño, E.; Rosa, J.L.; Martinez-Outshoorn, U.; Ventura, F.; Navarro-Sabaté, À.; et al. TGF-β1 targets Smad, p38 MAPK, and PI3K/Akt signaling pathways to induce PFKFB3 gene expression and glycolysis in glioblastoma cells. FEBS J. 2017, 284, 3437–3454. [Google Scholar] [CrossRef]
- Jeddi, F.; Soozangar, N.; Sadeghi, M.R.; Somi, M.H.; Samadi, N. Contradictory roles of Nrf-2/Keap1 signaling pathway in cancer prevention/promotion and chemoresistance. DNA Repair 2017, 54, 13–21. [Google Scholar] [CrossRef] [PubMed]
- Yang, W.; Shen, Y.; Wei, J.; Liu, F. MicroRNA-153/Nrf-2/GPx1 pathway regulates radiosensitivity and stemness of glioma stem cells via reactive oxygen species. Oncotarget 2015, 6, 22006–22027. [Google Scholar] [Green Version]
- Gallorini, M.; Petzel, C.; Bolay, C.; Hiller, K.A.; Cataldi, A.; Buchalla, W.; Krifka, S.; Schweikl, H. Activation of the Nrf2-regulated antioxidant cell response inhibits HEMA-induced oxidative stress and supports cell viability. Biomaterials 2015, 56, 114–128. [Google Scholar] [CrossRef]
- Zhu, J.; Wang, H.; Fan, Y.; Hu, Y.; Ji, X.; Sun, Q.; Liu, H. Knockdown of nuclear factor erythroid 2-related factor 2 by lentivirus induces differentiation of glioma stem-like cells. Oncol. Rep. 2014, 32, 1170–1178. [Google Scholar] [CrossRef] [PubMed]
- Cong, Z.X.; Wang, H.D.; Zhou, Y.; Wang, J.W.; Pan, H.; Zhang, D.D.; Zhang, L.; Zhu, L. Temozolomide and irradiation combined treatment-induced Nrf2 activation increases chemoradiation sensitivity in human glioblastoma cells. J. Neurooncol. 2014, 116, 41–48. [Google Scholar] [CrossRef] [PubMed]
- Rocha, C.R.; Kajitani, G.; Quinet, A.; Fortunato, R.S.; Menck, C.F. NRF2 and glutathione are key resistance mediators to temozolomide in glioma and melanoma cells. Oncotarget 2016, 7, 48081–48092. [Google Scholar] [CrossRef] [Green Version]
- Maccallini, C.; Fantacuzzi, M.; Amoroso, R. Amidine-based bioactive compunds for the regulation of arginine metabolism. Mini-Rev. Med. Chem. 2013, 13, 1305–1310. [Google Scholar] [CrossRef]
- Fantacuzzi, M.; Maccallini, C.; Lannutti, F.; Patruno, A.; Masella, S.; Pesce, M.; Speranza, L.; Ammazzalorso, A.; De Filippis, B.; Giampietro, L.; et al. Selective inhibition of iNOS by benzyl- and dibenzyl derivatives of N-(3-aminobenzyl)acetamidine. ChemMedChem 2011, 6, 1203–1206. [Google Scholar] [CrossRef]
- Maccallini, C.; Patruno, A.; Ammazzalorso, A.; De Filippis, B.; Fantacuzzi, M.; Franceschelli, S.; Giampietro, L.; Masella, S.; Tricca, M.L.; Amoroso, R. Selective inhibition of inducible nitric oxide synthase by derivatives of acetamidine. Med. Chem. 2012, 8, 991–995. [Google Scholar]
- Maccallini, C.; Montagnani, M.; Paciotti, R.; Ammazzalorso, A.; De Filippis, B.; Di Matteo, M.; Di Silvestre, S.; Fantacuzzi, M.; Giampietro, L.; Potenza, M.A.; et al. Selective Acetamidine-Based Nitric Oxide Synthase Inhibitors: Synthesis, Docking, and Biological Studies. ACS Med. Chem. Lett. 2015, 6, 635–640. [Google Scholar] [CrossRef] [Green Version]
- Maccallini, C.; Di Matteo, M.; Gallorini, M.; Montagnani, M.; Graziani, V.; Ammazzalorso, A.; Amoia, P.; De Filippis, B.; Di Silvestre, S.; Fantacuzzi, M.; et al. Discovery of N-{3-[(ethanimidoylamino)methyl]benzyl}-l-prolinamide dihydrochloride: A new potent and selective inhibitor of the inducible nitric oxide synthase as a promising agent for the therapy of malignant glioma. Eur. J. Med. Chem. 2018, 25, 53–64. [Google Scholar] [CrossRef] [PubMed]
- Ischiropoulos, H.; Gow, A.; Thom, S.R.; Kooy, N.W.; Royall, J.A.; Crow, J.P. Detection of reactive nitrogen species using 2,7-dichlorodihydrofluorescein and dihydrorhodamine 123. Methods Enzymol. 1999, 301, 367–373. [Google Scholar] [PubMed]
- Altinoz, M.A.; Elmaci, İ. Targeting nitric oxide and NMDA receptor-associated pathways in treatment of high grade glial tumors. Hypotheses for nitro-memantine and nitrones. Nitric Oxide 2017, 79, 68–83. [Google Scholar] [CrossRef] [PubMed]
- Umans, R.A.; Sontheimer, H. Combating malignant astrocytes: Strategies mitigating tumor invasion. Neurosci. Res. 2018, 126, 22–30. [Google Scholar] [CrossRef] [PubMed]
- Pacher, P.; Beckman, J.S.; Liaudet, L. Nitric oxide and peroxynitrite in health and disease. Physiol. Rev. 2007, 87, 315–424. [Google Scholar] [PubMed]
- Rojas, F.; Cortes, N.; Abarzua, S.; Dyrda, A.; van Zundert, B. Astrocytes expressing mutant SOD1 and TDP43 trigger motoneuron death that is mediated via sodium channels and nitroxidative stress. Front. Cell Neurosci. 2014, 8, 24. [Google Scholar] [CrossRef] [PubMed]
- Ryoo, I.G.; Lee, S.H.; Kwak, M.K. Redox modulating NRF-2: A potential mediator of cancer stem cells resistance. Oxid. Med. Cell. Longev. 2016, 2428153. [Google Scholar] [CrossRef]
- Jana, S.; Patra, K.; Jana, J.; Mandal, D.P.; Bhattacharjee, S. Nrf-2 transcriptionally activates P21(Cip/WAF1) and promotes A549 cell survival against oxidative stress induced by H(2)O(2). Chem. Biol. Interact. 2018, 1, 59–68. [Google Scholar] [CrossRef]
- Paranjpe, A.; Bailey, N.I.; Konduri, S.; Bobustuc, G.C.; Ali-Osman, F.; Yusuf, M.A.; Punganuru, S.R.; Madala, H.R.; Basak, D.; Mostofa, A.; et al. New insights into estrogenic regulation of O6-methylguanine DNA-methyltransferase (MGMT) in human breast cancer cells: Co-degradation of ER-α and MGMT proteins by fulvestrant or O6-benzylguanine indicates fresh avenues for therapy. J. Biomed. Res. 2016, 30, 393–410. [Google Scholar] [CrossRef]
- Selim, K.A.; Abdelrasoul, H.; Aboelmagd, M.; Tawila, A.M. The Role of the MAPK Signaling, Topoisomerase and Dietary Bioactives in Controlling Cancer Incidence. Diseases 2017, 5, 13. [Google Scholar] [CrossRef]
- Stojković, S.; Podolski-Renić, A.; Dinić, J.; Stanković, T.; Banković, J.; Hadžić, S.; Paunović, V.; Isaković, A.; Tanić, N.; Pešić, M. Development of resistance to antiglioma agents in rat C6 cells caused collateral sensitivity to doxorubicin. Exp. Cell Res. 2015, 335, 248–257. [Google Scholar] [CrossRef] [PubMed]
- Zsarnovszky, A.; Belcher, S.M. Spatial, temporal, and cellular distribution of the activated extracellular signal regulated kinases 1 and 2 in the developing and mature rat cerebellum. Brain Res. Dev. Brain Res. 2004, 150, 199–209. [Google Scholar] [CrossRef] [PubMed]
- Zheng, H.C. The molecular mechanisms of chemoresistance in cancers. Oncotarget 2017, 8, 59950–59964. [Google Scholar] [CrossRef] [PubMed]
- Montero, J.; Dutta, C.; van Bodegom, D.; Weinstock, D.; Letai, A. p53 regulates a non-apoptotic death induced by ROS. Cell Death Differ. 2013, 20, 1465–1474. [Google Scholar] [CrossRef] [PubMed] [Green Version]
- Wang, L.; Liang, C.; Li, F.; Guan, D.; Wu, X.; Fu, X.; Lu, A.; Zhang, G. PARP1 in Carcinomas and PARP1 Inhibitors as Antineoplastic Drugs. Int. J. Mol. Sci. 2017, 18, 2111. [Google Scholar] [CrossRef] [PubMed]
- Engeland, K. Cell cycle arrest through indirect transcriptional repression by p53: I have a DREAM. Cell Death Differ. 2018, 25, 114–132. [Google Scholar] [CrossRef] [PubMed]
- Harvey, C.J.; Thimmulappa, R.K.; Singh, A.; Blake, D.J.; Ling, G.; Wakabayashi, N.; Fujii, J.; Myers, A.; Biswal, S. Nrf2-regulated glutathione recycling independent of biosynthesis is critical for cell survival during oxidative stress. Free Radic. Biol. Med. 2009, 46, 443–453. [Google Scholar] [CrossRef] [Green Version]
- Adamiak, M.; Abdelbaset-Ismail, A.; Moore, J.B., 4th; Zhao, J.; Abdel-Latif, A.; Wysoczynski, M.; Ratajczak, M.Z. Inducible Nitric Oxide Synthase (iNOS) is a Novel Negative Regulator of Hematopoietic Stem/Progenitor Cell Trafficking. Stem Cell Rev. 2017, 13, 92–103. [Google Scholar] [CrossRef]
- Schweikl, H.; Gallorini, M.; Pöschl, G.; Urmann, V.; Petzel, C.; Bolay, C.; Hiller, K.A.; Cataldi, A.; Buchalla, W. Functions of transcription factors NF-κB and Nrf2 in the inhibition of LPS-stimulated cytokine release by the resin monomer HEMA. Dent. Mater. 2018. [Google Scholar] [CrossRef]
- di Giacomo, V.; Berardocco, M.; Gallorini, M.; Oliva, F.; Colosimo, A.; Cataldi, A.; Maffulli, N.; Berardi, A.C. Combined supplementation of ascorbic acid and thyroid hormone T(3) affects tenocyte proliferation. The effect of ascorbic acid in the production of nitric oxide. Muscles Ligaments Tendons J. 2017, 7, 11–18. [Google Scholar] [CrossRef]


© 2019 by the authors. Licensee MDPI, Basel, Switzerland. This article is an open access article distributed under the terms and conditions of the Creative Commons Attribution (CC BY) license (http://creativecommons.org/licenses/by/4.0/).
Share and Cite
Gallorini, M.; Maccallini, C.; Ammazzalorso, A.; Amoia, P.; De Filippis, B.; Fantacuzzi, M.; Giampietro, L.; Cataldi, A.; Amoroso, R. The Selective Acetamidine-Based iNOS Inhibitor CM544 Reduces Glioma Cell Proliferation by Enhancing PARP-1 Cleavage In Vitro. Int. J. Mol. Sci. 2019, 20, 495. https://doi.org/10.3390/ijms20030495
Gallorini M, Maccallini C, Ammazzalorso A, Amoia P, De Filippis B, Fantacuzzi M, Giampietro L, Cataldi A, Amoroso R. The Selective Acetamidine-Based iNOS Inhibitor CM544 Reduces Glioma Cell Proliferation by Enhancing PARP-1 Cleavage In Vitro. International Journal of Molecular Sciences. 2019; 20(3):495. https://doi.org/10.3390/ijms20030495
Chicago/Turabian StyleGallorini, Marialucia, Cristina Maccallini, Alessandra Ammazzalorso, Pasquale Amoia, Barbara De Filippis, Marialuigia Fantacuzzi, Letizia Giampietro, Amelia Cataldi, and Rosa Amoroso. 2019. "The Selective Acetamidine-Based iNOS Inhibitor CM544 Reduces Glioma Cell Proliferation by Enhancing PARP-1 Cleavage In Vitro" International Journal of Molecular Sciences 20, no. 3: 495. https://doi.org/10.3390/ijms20030495