Serological Number for Characterization of Circulating Antibodies

Institute of Microstructure Technology, Karlsruhe Institute of Technology (KIT), 76344 Eggenstein-Leopoldshafen, Germany
*
Author to whom correspondence should be addressed.
Int. J. Mol. Sci. 2019, 20(3), 604; https://doi.org/10.3390/ijms20030604
Submission received: 13 December 2018
/
Revised: 11 January 2019
/
Accepted: 29 January 2019
/
Published: 30 January 2019
(This article belongs to the Special Issue Protein Structural Dynamics)
Abstract
:The dissociation constant of the circulating IgG antibodies is suggested to be proportional to the partial concentrations of these antibodies in blood serum in equilibrium. This coefficient, called serological number, is a dimensionless parameter and may be equal for all antibodies in a serum. Based on the serological number, we derived the equilibrium equation of the humoral immune system which allows estimating the number of different binding motifs in a serum. This equation also allows estimating the number of binding motifs of posttranslational and conformational nature. The feasibility of measuring the serological number via peptide arrays was demonstrated. Fifteen peptides with unique binding motifs were incubated and stained with the blood serum of a healthy adult at different dilutions. From these experiments, the serological number was determined. The serological number may explain the pre-existing antibody response after vaccination.
1. Introduction
The easy extraction of circulating serum antibodies from blood samples and their ability to selectively bind to targets involved in immune defense make serum antibodies very attractive for studying the immune system response. However, in many cases, the interpretation is complex and requires considering the entire antibody repertoire as, for example, in the case of influenza-specific antibody response after vaccination, which is shaped by pre-exposure history [1]. A straightforward approach to performing serum-antibody profiling is serum sample incubation with random peptide microarrays. Hereby, the reactivity of antibodies is measured using labeled secondary antibodies that bind to the constant region of the subset of serum antibodies [2]. In the case of a limited number of peptides (<1000), Greiff et al. have proposed to use multivariate regression analysis to predict the peptide binding signals of the serum antibodies [3]. Although this method does not take into account the information on amino acid position, the authors reported a successful prediction for up to 40%–50% of the binding profiles for highly diverse random antibody mixtures which are not dominated by a few antibodies. Legutki et al., claiming the limits of the state-of-the-art peptide technology, have proposed to use a chip with the same 10 M random peptides to detect the so-called serological immunosignatures—correlated patterns of the peptide binders specific for different infectious diseases and cancers [4]. Sticking to the same sequences was determined by the very high costs of masks used by the authors for lithographic peptide synthesis that makes it impossible, for example, to obtain the binding motifs, i.e., invariant amino acids, without fabricating new peptides.
Due to the large progress in high throughput sequencing, a recombinant method has been used to try and identify serum IgG binding targets [5,6]. Christiansen et al. used a bioinformatics approach in order to identify binding peptide motifs of interest based on clustering and contrasting to control samples from a phage display [7]. However, comparison of patient and control samples confirmed a major issue in phage display, namely, the selection of unspecific peptides and the necessity of their validation, for instance, with peptide arrays. Weber et al. have combined the screening via phage display with a substitutional analysis of the phage display hits via peptide arrays [8]. Using such an approach, 42 unique binding motifs for IgG antibodies were identified in the serum of a healthy donor. Such peptides include invariant combinations of amino acids and represent the epitopes of the circulating antibodies.
Searching binding motifs of serum antibodies is believed to give insight into systemic reactions of the humoral immune system because the invariant sequences may enable an easy identification of the involved proteins by searching modern databases. On the other side, such characteristics as the dissociation constant KD, or the fractional concentration N0, of antibodies seem to be less relevant for the systemic analysis without knowing an immunogen. In addition, both parameters cannot be obtained in a high throughput manner in comparison with the binding motifs. However, it is interesting that both parameters have the same unit “mol/L” [9] and can build the dimensionless serological number, or S-number:
S = KD/N0
Dimensionless combinations of parameters are frequently used to distinguish principal features of complex phenomena as, for example, the Reynolds number for characterization of the fluid flow. It is worth noticing that the S-number could be an intrinsic parameter of the immune system and may represent an optimum between the number of circulating antibodies and their affinity to the immunogens. The reason for this optimum may be the minimization of the high-affinity antibody concentration to get more space for antibodies against other pathogens. In the case of antibodies, one speaks about specific binding motifs, which can be obtained by so-called substitutional analysis (Figure 1) [8]: all amino acids in a peptide MVPEFSGSFPMR are substituted in each position against the 20 amino acids, while the rest of the sequence remains conserved, to define the invariant amino acids—namely, the binding motif. The binding motifs can be clearly expressed as X–A/I/P/V–P–E–F–X–G–A/S–X–P–X–X in Figure 1, or be heterogenic, allowing several invariant amino acids in a certain position in the sequence (as indicated by a slash). In following these considerations, we refer to the dissociation constant of an antibody KD and such binding motifs. In this paper, we investigate the potential of the S-number as an additional parameter for studying the immune response and demonstrate the possibility of its determination via peptide arrays.
2. Results
2.1. Analytical Estimation of the S-Number of Different Binding Motifs
The sum of the S-numbers over all subset antibodies of a serum sample gives the equation of equilibrium for the humoral immune system:
Here, Zbm is the number of different binding motifs, Sk is the serological number of the antibody with a number k, and k is the index of addition over all circulating antibodies. It is worth noticing that no special assumptions are needed to perform such additions. If the S-number relates to the entire humoral system, i.e., S = S1 = Sk, Formula (2) can be simplified to
For this transformation, the following formula was used: , if the ratio ak/bk is constant for all k. After the addition over the fractional concentrations of all antibodies and averaging of the dissociation constants over Zbm, we obtain Formula (4), which states the relation between the S-number and the number of different binding motifs Zbm:
whereby Ntot is the total concentration of the antibodies in the serum. Applying in (4) the average = 10−8 mol/L and Ntot = 10 g/L for the IgG antibodies, as well Zbm = 42 reported for the serum used in this paper, S = 0.007 is obtained.
2.2. Dilution Measurements of the S-Number
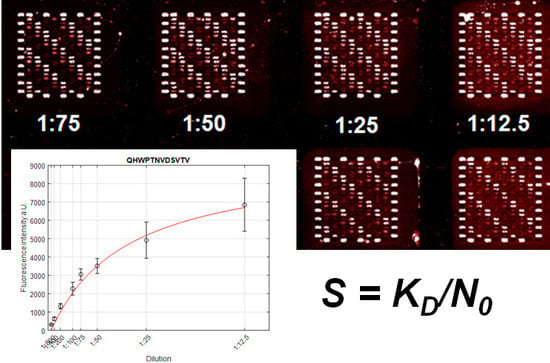
Table 1 includes motifs that have been associated with antigens, like the polio vaccine or Staphylococcus aureus motifs, which the immune system of the healthy donor has faced in the past, as well as heterogeneous motifs with a large number of invariant amino acids. The heterogeneous motifs cannot be unambiguously associated with a specific pathogen. The corresponding S-numbers, measured according to (7), are presented in Table 1. The average value of the S-number over all 15 binding motifs is 0.0146 with a standard deviation of 0.0095.
3. Discussion
Equation (4), which is based on the of the S-number approach, gives the value range of the S-number from 0.007 for the 42 binding motifs to 0.049 for 300 binding motifs. It is interesting that the S-numbers, which are measured independently according to (7), fall in this range. If we put the average S-number, 0.0146, for the serum sample measured in this paper into (4), we will obtain 90 different specific binders. We note that only 42 specific binder motifs were found by Weber et al. [8] for this serum sample using phage display technology. This discrepancy may have two reasons. First, the phage library did not include the rest of the linear specific binders. Secondly, the missing specific binders may have a conformational or posttranslational nature, which cannot be registered either with phage display or with linear peptide arrays. It is worth noticing that the derivation of (4) does not include any assumptions about the epitope nature and, thus, can be used to estimate the number of nonlinear epitopes that are very difficult to determine with any other methods.
In Table 1, we observe an increase of the S-number from 0.003 to 0.044, which still remains in the estimated S-number interval, but cannot be explained even by relatively large measurement errors. This deviation can be explained by differences in the IgG antibody affinities to the peptides integrated in pathogenic proteins and the peptide spots synthesized on a solid support. For instance, the 15th peptide exhibits an S-number of ~0.044, which is a factor ~3 higher than the averaged S-number. This may mean that this binding motif embedded in a protein exhibits a KD smaller by a factor ~3, i.e., has better affinity to the pathogen than the single peptide on a solid support.
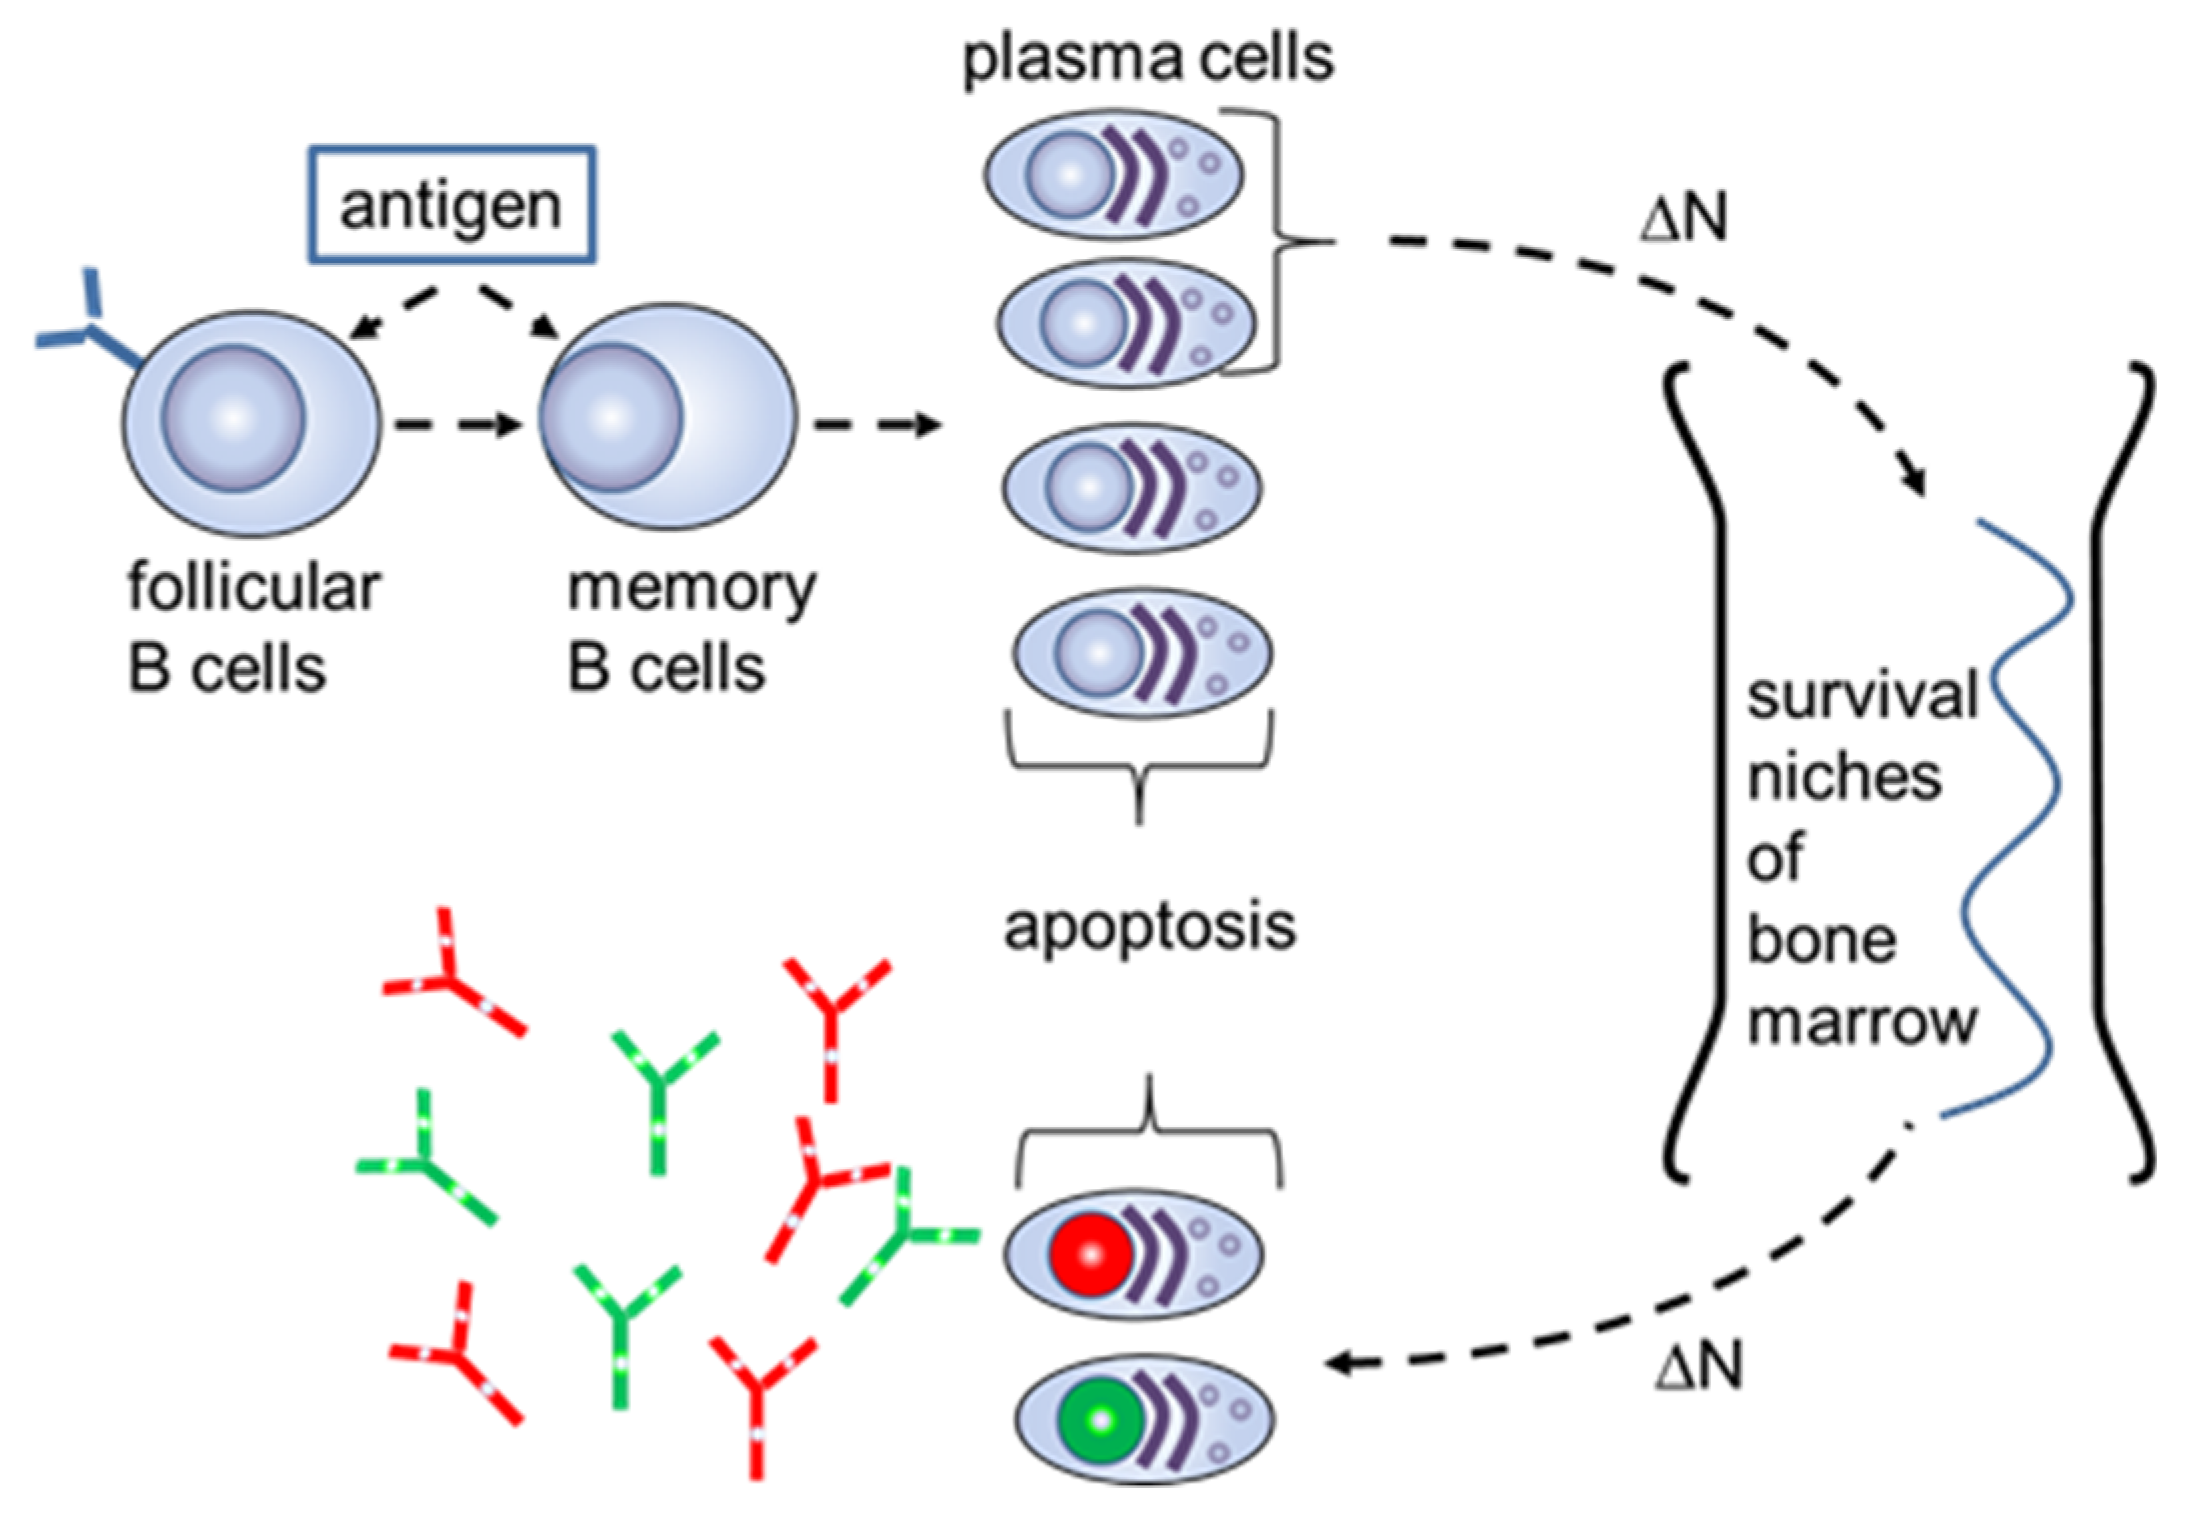
The S-number can be explained on the cellular level when considering the mechanisms of the long-term humoral memory (Figure 2).
As previously described, the limited number of survival niches in the bone marrow requires the regular elimination of long-lived plasma cells for “old” antigens by generating plasmablasts with a new specificity [10]. The number of plasmablasts which transform to long-term plasma cells in the bone marrow is equal to the number of the “old” plasma cells that are substituted in survival niches and then emitted into the blood. It was estimated that the humoral memory for an “old” antigen would wane at a frequency of 0.1% for each generation of new plasmablasts [11]. This mechanism keeps a constant level of circulating antibodies for antigens which have been already recognized by the adaptive immune system. Using (4), the S-number for “old” antibodies supplied to the blood due to the cellular exchange in the bone marrow has the form
where α is the number of antibodies generated by a single plasma cell that has left the bone marrow, β is the number of antibodies on a single B cell with the improved affinity, and Sc = KDc/ΔN. The cellular S-number Sc characterizes the generation of new plasma cells with a fractional concentration ΔN from the B cells with an improved cellular dissociation constant KDc towards the antigen. The generated plasma cells in the bone marrow will, in turn, build a fractional S-number Sk = KDc/ΔN = KDk/N0k. Here, the equations KDc = β⋅KDk and N0k = β⋅ΔN were taken into account. Thus, we see that the bone marrow transfers the serologic proportions from the B cells, with the improved affinity, to the circulating antibodies. The reason for a larger fractional concentration of the plasmablasts and their corresponding precursors—memory cells, with a smaller affinity to the antigen—may be due to the fact that B cells with smaller affinities reenter additional rounds of mutative replication and, therefore, they have a higher probability to be developed in larger amounts at the plasmablast stage.
The S-number approach allows developing a systemic view on the generation of serum antibodies by vaccinations. As mentioned in the introduction, the influenza-specific antibody response after vaccination is shaped by pre-exposure history [1,12,13,14]. Recent studies have shown that the vaccination against influenza can boost up to 60% of pre-existing antibodies [15,16]. If numerous low-affinity plasmablasts for a new viral antigen contact the survival niches, they eliminate 0.1% of the previously stored plasma cells. According to the S-number, the number of low-affinity memory cells, and correspondingly long-lived plasma cells in the bone marrow niches, is larger than the number of plasma cells for high-affinity antigens. Thus, significantly more low-affinity pre-existing antibodies than high-affinity pre-existing antibodies will be generated, as is observed after vaccination.
4. Materials and Methods
4.1. Equation for Measurement of the S-Number in Array Format
Equation (2) describes the dependence of the dissociation constant between a protein and a ligand in equilibrium, which can be measured optically by labeling analyte molecules:
where Isat is the maximum fluorescent signal at saturation, N the concentration of the analyte (antibody in our case) in the solution, and KD is the equilibrium dissociation constant [17]. KD can be measured in parallel for many molecules if one of the binding partners is arrayed in spots on a solid support and the other carries a fluorescent label, and if its concentration, N, is known [18].
Using the definition of the S-number (1) and introducing the dilution factor γ = N/N0, Formula (6) can be transformed to
Obviously, the condition S = γ is reached at Iobs = Isat/2. This means that if the patient’s serum will be constantly diluted, the dilution coefficient will be equal to the S-number at the signal Iobs = Isat/2. Actually, the S-number can be measured by other Iobs and dilution values. The general formula has the form S = α∙k, by Iobs = Isat/(α + 1), where α is an arbitrary positive number and can be defined from the fluorescent signal saturation curve. We chose Iobs = Isat/2, because this value refers to IC50, known as half maximal inhibitory concentration and can be easily measured by the available analytic techniques. Please note, to determine the S-number, it is not necessary to know either the concentration of antibodies or coefficients that converts the fluorescent signal to concentration units. Such a simple approach is especially useful for measuring S-numbers by studying a large number of antibody interactions with combinatorically synthesized peptide arrays.
4.2. Methods to Measure the S-number
Blood serum of a healthy individual was used. Ethical clearance was obtained from the state chamber of physicians of Baden-Wuerttemberg (reference number: F-2011-044 and F-2011-044#A1). Identical peptide arrays were used for dilution experiments. The peptide content included binding motifs for IgG serum antibodies of the healthy individual that were already determined by Weber et al. [8]. Every peptide was represented by 10 to 40 spots. The serum was serially diluted, ranging from 1:800 to 1:12.5, and incubated overnight. The serum was diluted in PBS-T containing 10% (v/v) Rockland blocking buffer (Rockland Immunochemicals Inc., Pottstown, PA, USA). After the incubation, the arrays were stained with the secondary antibody (goat) anti-human IgG (Fc γ) AF647 (Jackson Immunoresearch, West Grove, PA, USA) at 1 µg/mL. Fluorescent signals were measured with an InnoScan scanner (Innopsis, Carbonne, France). The collected fluorescent signals from the secondary antibodies (Figure S1) and the dilution values were fit using Formula (6) to calculate the S-numbers for each binding motif (Sections S2 and S3, Figures S2–S9, Supplementary Materials). The absolute intensity for each pixel within a spot and the spot duplicate was averaged and background corrected. Therefore, the average pixel intensity of a control area, not containing any peptide spots, was subtracted from the calculated spot intensity. Fits with a coefficient of determination rs < 0.9 were discarded.
5. Conclusions
The S-number, as an additional parameter for the characterization of circulating antibodies, was presented. It includes both the information about the antibody affinity and the fractional concentration.
Based on the assumption of a constant S-number for an antibody ensemble, the formula was derived that combines the total concentration of antibodies, their average dissociation constant, and the number of different binding motifs.
The determination of the S-number was experimentally demonstrated. Therefore, the arrays with the same peptide content representing the binding motifs were incubated with the serum samples of a single human donor at different dilutions and stained with secondary anti-human IgG antibodies. The signals obtained were approximated with the kinetic equation and, consequently, the antibody S-numbers for each binding motif were determined.
The experimentally measured S-numbers revealed values of the same order of magnitude for all motifs, and were approximated with the formula derived for the antibody ensemble with a constant S-number. These results should not be considered as evidence for an equal S-number for all IgG antibodies in human serum, and serve solely as an example of the measurement of the S-number via peptide arrays. In addition, the nature of the S-number is discussed from the point of view of B-cell ontogeny. The S-number may explain the generation of pre-existing antibodies after vaccination against influenza.
Supplementary Materials
The following are available online at https://www.mdpi.com/1422-0067/20/3/604/s1.
Author Contributions
A.P. carried out experiments and analyzed the results. A.N.-M. conceived the S-number concept, derived the formulas and proposed the experiment. Both authors wrote the manuscript and discussed results.
Funding
This study was supported by the ERC [St Grant no. 277863 and ERC PoC no. 680375].
Acknowledgments
We acknowledge support by Open Access Publishing Fund of Karlsruhe Institute of Technology. We are grateful to Neil MacKinnon for English editing, Dirk Hose and Anja Seckinger for valuable discussions about the S-number.
Conflicts of Interest
The authors declare no conflict of interest.
References
- Andrews, S.F.; Kaur, K.; Pauli, N.T.; Huang, M.; Huang, Y.P.; Wilson, P.C. High Preexisting Serological Antibody Levels Correlate with Diversification of the Influenza Vaccine Response. J. Virol. 2015, 89, 3308–3317. [Google Scholar] [CrossRef] [PubMed] [Green Version]
- Weiser, A.A.; Or-Guil, M.; Tapia, V.; Leichsenring, A.; Schuchhardt, J.; Frommel, C.; Volkmer-Engert, R. SPOT synthesis: Reliability of array-based measurement of peptide binding affinity. Anal. Biochem. 2005, 342, 300–311. [Google Scholar] [CrossRef] [PubMed]
- Greiff, V.; Redestig, H.; Luck, J.; Bruni, N.; Valai, A.; Hartmann, S.; Rausch, S.; Schuchhardt, J.; Or-Guil, M. A minimal model of peptide binding predicts ensemble properties of serum antibodies. BMC Genom. 2012, 13, 79. [Google Scholar] [CrossRef] [PubMed]
- Legutki, J.B.; Zhao, Z.G.; Greving, M.; Woodbury, N.; Johnston, S.A.; Stafford, P. Scalable high-density peptide arrays for comprehensive health monitoring. Nat. Commun. 2014, 5, 4785. [Google Scholar] [CrossRef] [PubMed] [Green Version]
- Ryvkin, A.; Ashkenazy, H.; Smelyanski, L.; Kaplan, G.; Penn, O.; Weiss-Ottolenghi, Y.; Privman, E.; Ngam, P.B.; Woodward, J.E.; May, G.D.; et al. Deep Panning: Steps towards probing the IgOme. PLoS ONE 2012, 7, e41469. [Google Scholar] [CrossRef] [PubMed]
- Liu, X.Y.; Hu, Q.; Liu, S.; Tallo, L.J.; Sadzewicz, L.; Schettine, C.A.; Nikiforov, M.; Klyushnenkova, E.N.; Ionov, Y. Serum Antibody Repertoire Profiling Using in Silico Antigen Screen. PLoS ONE 2013, 8, e67181. [Google Scholar] [CrossRef] [PubMed]
- Christiansen, A.; Kringelum, J.V.; Hansen, C.S.; Bogh, K.L.; Sullivan, E.; Patel, J.; Rigby, N.M.; Eiwegger, T.; Szepfalusi, Z.; de Masi, F.; et al. High-throughput sequencing enhanced phage display enables the identification of patient-specific epitope motifs in serum. Sci. Rep. 2015, 5, 12913. [Google Scholar] [CrossRef] [PubMed] [Green Version]
- Weber, L.K.; Palermo, A.; Kugler, J.; Armant, O.; Isse, A.; Rentschler, S.; Jaenisch, T.; Hubbuch, J.; Dubel, S.; Nesterov-Mueller, A.; et al. Single amino acid fingerprinting of the human antibody repertoire with high density peptide arrays. J. Immunol. Methods 2017, 443, 45–54. [Google Scholar] [CrossRef] [PubMed]
- OShannessy, D.J.; Winzor, D.J. Interpretation of deviations from pseudo-first-order kinetic behavior in the characterization of ligand binding by biosensor technology. Anal. Biochem. 1996, 236, 275–283. [Google Scholar] [CrossRef] [PubMed]
- Radbruch, A.; Muehlinghaus, G.; Luger, E.O.; Inamine, A.; Smith, K.G.C.; Dorner, T.; Hiepe, F. Competence and competition: The challenge of becoming a long-lived plasma cell. Nat. Rev. Immunol. 2006, 6, 741–750. [Google Scholar] [CrossRef] [PubMed]
- Hofer, T.; Muehlinghaus, G.; Moser, K.; Yoshida, T.; Mei, H.E.; Hebel, K.; Hauser, A.; Hoyer, B.; Luger, E.O.; Dorner, T.; et al. Adaptation of humoral memory. Immunol. Rev. 2006, 211, 295–302. [Google Scholar] [CrossRef] [PubMed]
- Brodin, P.; Jojic, V.; Gao, T.X.; Bhattacharya, S.; Angel, C.J.L.; Furman, D.; Shen-Orr, S.; Dekker, C.L.; Swan, G.E.; Butte, A.J.; et al. Variation in the Human Immune System Is Largely Driven by Non-Heritable Influences. Cell 2015, 160, 37–47. [Google Scholar] [CrossRef] [PubMed] [Green Version]
- Sasaki, S.; He, X.S.; Holmes, T.H.; Dekker, C.L.; Kemble, G.W.; Arvin, A.M.; Greenberg, H.B. Influence of Prior Influenza Vaccination on Antibody and B-Cell Responses. PLoS ONE 2008, 3, e2975. [Google Scholar] [CrossRef] [PubMed]
- Monto, A.S.; Malosh, R.E.; Petrie, J.G.; Martin, E.T. The Doctrine of Original Antigenic Sin: Separating Good from Evil. J. Infect. Dis. 2017, 215, 1782–1788. [Google Scholar] [CrossRef] [PubMed]
- Cobey, S.; Hensley, S.E. Immune history and influenza virus susceptibility. Curr. Opin. Virol. 2017, 22, 105–111. [Google Scholar] [CrossRef] [Green Version]
- Lee, J.; Boutz, D.R.; Chromikova, V.; Joyce, M.G.; Vollmers, C.; Leung, K.; Horton, A.P.; DeKosky, B.J.; Lee, C.H.; Lavinder, J.J.; et al. Molecular-level analysis of the serum antibody repertoire in young adults before and after seasonal influenza vaccination. Nat. Med. 2016, 22, 1456–1464. [Google Scholar] [CrossRef] [Green Version]
- Jones, R.B.; Gordus, A.; Krall, J.A.; MacBeath, G. A quantitative protein interaction network for the ErbB receptors using protein microarrays. Nature 2006, 439, 168–174. [Google Scholar] [CrossRef] [PubMed]
- Wegner, G.J.; Lee, H.J.; Corn, R.M. Characterization and optimization of peptide arrays for the study of epitope-antibody interactions using surface plasmon resonance imaging. Anal. Chem. 2002, 74, 5161–5168. [Google Scholar] [CrossRef]
Figure 1.
Substitutional analysis of peptide MVPEFSGSFPMR reveals the binding motif X–A/I/P/V–P–E–F–X–G–A/S–X–P–X–X [8]. The double spot array was used. Reproduced with permission, Copyright 2017, ELSEVIER.
Figure 1.
Substitutional analysis of peptide MVPEFSGSFPMR reveals the binding motif X–A/I/P/V–P–E–F–X–G–A/S–X–P–X–X [8]. The double spot array was used. Reproduced with permission, Copyright 2017, ELSEVIER.

Figure 2.
Schematic of the long-term humoral memory via elimination of the long-lived plasma cells for “old” antigens (red and green nucleus) with plasmablasts with a new specificity (lilac nucleus).
Figure 2.
Schematic of the long-term humoral memory via elimination of the long-lived plasma cells for “old” antigens (red and green nucleus) with plasmablasts with a new specificity (lilac nucleus).


Table 1.
Peptides corresponding to the binding motifs and their measured S-numbers.
| N | Amino Acid Sequence | Characteristics of the Motif | S-number | Standard Deviation in % |
|---|---|---|---|---|
| 1 | GGQVRSIHSGPT | heterogeneous motif | 0.00267 | 37 |
| 2 | KEVPALTAVETGAT | LXAXETX motif group, poliovirus motif | 0.00386 | 31 |
| 3 | MVPEFSGSFPMR | Staphylococcus aureus motif | 0.00620 | 56 |
| 4 | LIADLNAESTSR | heterogeneous motif | 0.00775 | 22 |
| 5 | VLSSTAIKVDSV | heterogeneous motif | 0.00865 | 49 |
| 6 | VMSVNASTTAAN | heterogeneous motif | 0.01183 | 41 |
| 7 | QMKAWFPQTTYD | KXXFPQXT motif | 0.01219 | 48 |
| 8 | LRPNAVQTDTLA | heterogeneous motif | 0.01302 | 39 |
| 9 | SWVLTATETGSS | LXAXETX motif group, poliovirus motif | 0.01427 | 34 |
| 10 | NPVEDYLDYSVI | NPVEXXX motif | 0.01490 | 60 |
| 11 | ETKSDDMLLSNV | heterogeneous motif | 0.01537 | 31 |
| 12 | AKIRMFLDTDYK | heterogeneous motif | 0.01841 | 58 |
| 13 | VDTINLPQNTIQ | heterogeneous motif | 0.02059 | 49 |
| 14 | TALDAVSTGFSW | heterogeneous motif | 0.02597 | 42 |
| 15 | QHWPTNVDSVTV | heterogeneous motif | 0.04362 | 24 |
© 2019 by the authors. Licensee MDPI, Basel, Switzerland. This article is an open access article distributed under the terms and conditions of the Creative Commons Attribution (CC BY) license (http://creativecommons.org/licenses/by/4.0/).
Share and Cite
MDPI and ACS Style
Palermo, A.; Nesterov-Mueller, A. Serological Number for Characterization of Circulating Antibodies. Int. J. Mol. Sci. 2019, 20, 604. https://doi.org/10.3390/ijms20030604
AMA Style
Palermo A, Nesterov-Mueller A. Serological Number for Characterization of Circulating Antibodies. International Journal of Molecular Sciences. 2019; 20(3):604. https://doi.org/10.3390/ijms20030604
Chicago/Turabian StylePalermo, Andrea, and Alexander Nesterov-Mueller. 2019. "Serological Number for Characterization of Circulating Antibodies" International Journal of Molecular Sciences 20, no. 3: 604. https://doi.org/10.3390/ijms20030604
Note that from the first issue of 2016, this journal uses article numbers instead of page numbers. See further details here.