Article

Enhanced Expression of QTL qLL9/DEP1 Facilitates the Improvement of Leaf Morphology and Grain Yield in Rice

State Key Laboratory of Rice Biology, China National Rice Research Institute, Hangzhou 310006, China
*
Authors to whom correspondence should be addressed.
These authors contributed equally to this work.
Int. J. Mol. Sci. 2019, 20(4), 866; https://doi.org/10.3390/ijms20040866
Submission received: 15 January 2019 / Revised: 12 February 2019 / Accepted: 13 February 2019 / Published: 17 February 2019
(This article belongs to the Special Issue Plant Genetics and Molecular Breeding)

Abstract

:
In molecular breeding of super rice, it is essential to isolate the best quantitative trait loci (QTLs) and genes of leaf shape and explore yield potential using large germplasm collections and genetic populations. In this study, a recombinant inbred line (RIL) population was used, which was derived from a cross between the following parental lines: hybrid rice Chunyou84, that is, japonica maintainer line Chunjiang16B (CJ16); and indica restorer line Chunhui 84 (C84) with remarkable leaf morphological differences. QTLs mapping of leaf shape traits was analyzed at the heading stage under different environmental conditions in Hainan (HN) and Hangzhou (HZ). A major QTL qLL9 for leaf length was detected and its function was studied using a population derived from a single residual heterozygote (RH), which was identified in the original population. qLL9 was delimitated to a 16.17 kb region flanked by molecular markers C-1640 and C-1642, which contained three open reading frames (ORFs). We found that the candidate gene for qLL9 is allelic to DEP1 using quantitative real-time polymerase chain reaction (qRT-PCR), sequence comparison, and the clustered regularly interspaced short palindromic repeat-associated Cas9 nuclease (CRISPR/Cas9) genome editing techniques. To identify the effect of qLL9 on yield, leaf shape and grain traits were measured in near isogenic lines (NILs) NIL-qLL9CJ16 and NIL-qLL9C84, as well as a chromosome segment substitution line (CSSL) CSSL-qLL9KASA with a Kasalath introgressed segment covering qLL9 in the Wuyunjing (WYJ) 7 backgrounds. Our results showed that the flag leaf lengths of NIL-qLL9C84 and CSSL-qLL9KASA were significantly different from those of NIL-qLL9CJ16 and WYJ 7, respectively. Compared with NIL-qLL9CJ16, the spike length, grain size, and thousand-grain weight of NIL-qLL9C84 were significantly higher, resulting in a significant increase in yield of 15.08%. Exploring and pyramiding beneficial genes resembling qLL9C84 for super rice breeding could increase both the source (e.g., leaf length and leaf area) and the sink (e.g., yield traits). This study provides a foundation for future investigation of the molecular mechanisms underlying the source–sink balance and high-yield potential of rice, benefiting high-yield molecular design breeding for global food security.

1. Introduction

Rice leaf morphogenesis and its spatial extension posture are important components of ideal plant architecture, which play a significant role in the photosynthetic efficiency and grain yield [1,2]. During the grain-filling stage, the top three leaves, particularly the flag leaf, are the main carbohydrate sources that were transported to panicles and grains for yield formation. The establishment of better source-to-sink biomass allocation would greatly contribute to the improvement of rice yield potential [3,4]. Therefore, using molecular genetic techniques to modulate the top three leaf morphology and improve the photosynthesis rate so as to balance the relationship with the grain sink will effectively achieve a high yield in rice.
The polarity development of leaves along the adaxial–abaxial, the medial–lateral, and the apical–basal axis determines the construction of the three-dimensional spatial morphology of the leaf. About 40 genes related to leaf morphogenesis have been cloned, and studies have mainly focused on leaf width, length, and rolling. Rice leaf width is mainly related to the number of veins and the distance between veins, which are regulated by the following aspects: microRNA shear-related genes, such as OsDCL1 [5] and GIF1 [6]; cell division-related genes, such as SRL2 [7], SLL1/RL9 [8,9], OsCCC1 [10], and OsWOX4 [11]; NAL2 /NAL3 [12], SLL1 [8], OsCD1 [13], and genes related to coding transcription factors and cellulases; NAL1/LSCHL4 [14,15], NAL7 [16], TDD1 [17], OsCOW1 [18], OsARF19 [19], and genes associated with auxin synthesis and metabolism; and genes including NAL9 encoding an ATP-dependent Clp protease proteolytic subunit [20]. In a series of cloned rolling genes in rice, the type I genes, such as ADL1 [21], OsAGO7 [22], OsAGO1a [23], SLL1 [8], and RL9 [9], regulate the unbalanced development of different tissues in the adaxial/abaxial side, which affects the curl degree of blades. The type II genes are associated with the development of bulliform cells in the adaxial side, and changes in the size or amount affect the curl degree of the blade. Adaxially and abaxially rolled leaves appear as favored by various genes, such as ACL1 [24], LC2/OsVIL3 [25,26], OsCOW1/NAL7 [16,18], OsCD1/NRL1/ND1/sle1/DNL1 [13,14,27,28,29], OsHox32 [30], OsMYB103L [31], OsZHD1 [32], REL1 [33], REL2 [34], RL14 [35], ROC5 [36], CLD1 [37], SRL1 [38] SFL1 [39], SLL2 [40], YABBY1 [41], and LRRK1 [42]. The type III genes, such as SLL1 [8], RL9 [9], SRL2 [7], AVB [43], and OsSND2 [44], control the development of sclerenchyma in the abaxial side and affect the curl degree of blades. The genes of type IV, such as CFL1 [45], include those with an abnormal cuticle development, leading to leaf curl. The genes of type V, such as CVD1, regulate commissural veins (CVs), and the lack of CV in cvd1 mutant is the main cause of leaf curl [46].
The length, width, and area are the three traits determining the shape and size of a leaf, which are quantitatively inherited. Using a DH (doubled haploid) population, Li et al. detected two major QTLs for the flag leaf length, which were located on chromosome 4 and chromosome 8, respectively [47]. Yan et al. studied the genotype–environment interaction of eight plant morphological traits using a DH population and mapped seven QTLs on chromosomes 1, 2, 3, 4, 6, 9, and 10 related to the length of the flag leaf [48]. Farooq et al. identified three leaf length QTLs on chromosomes 1, 2, and 4 using IR64 derived introgression lines [49]. Although the important role of leaf traits in plant ideotype in rice has attracted great attention, the cloning of QTLs for leaf length is rarely documented.
The coordinated balance of source and sink is an essential component to ensure a high yield in rice. Notably, genetic populations used for leaf traits were generally among those used for yield traits, where QTLs for leaf traits were frequently located in regions in which QTLs for yield traits were detected [50,51,52,53,54,55,56,57,58]. The major leaf width QTL qFLW4/LSCHL4/SPIKE allelic to NAL1 is related to both leaf morphology and yield traits [15,58,59]. Similarly, the pleiotropic effect on leaf morphology regulation was also found in the cloning of rice grain-shaped QTL. Large-grain alleles in the GS2 locus simultaneously increase leaf length [60,61]. However, in rice high-yield breeding, studies have yet to be conducted on the influence of the leaf shape alleles/QTLs from different donors in the interaction of molecular level between the regulation of leaf morphogenesis and yield formation. As reported, up to 50% of the variation in panicle weight depended on the variation in leaf size [50]. The co-location of QTLs/genes for source–sink traits in rice could increase the source while expanding the sink, provided that the QTLs have the same effect direction for both traits, which will be invaluable genetic resources for breeding high-yield varieties [62].
In this study, QTL mapping for leaf length and width of the top three leaves in rice was performed at two different environments using a recombinant inbred lines (RILs) set derived from the cross between maintainer line and restorer line of the indica–japonica super hybrid rice Chunyou 84, followed by validation and fine mapping. The target major QTL qLL9 controlling leaf length was delimitated into a 16.17 kb interval between markers C-1640 and C-1642 on chromosome 9, using a residual heterozygote identified from the RIL population, which were segregated at qLL9 with high homogenous backgrounds. Then, gene cloning, functional analysis, and breeding potential assessments of qLL9 were conducted.

2. Results

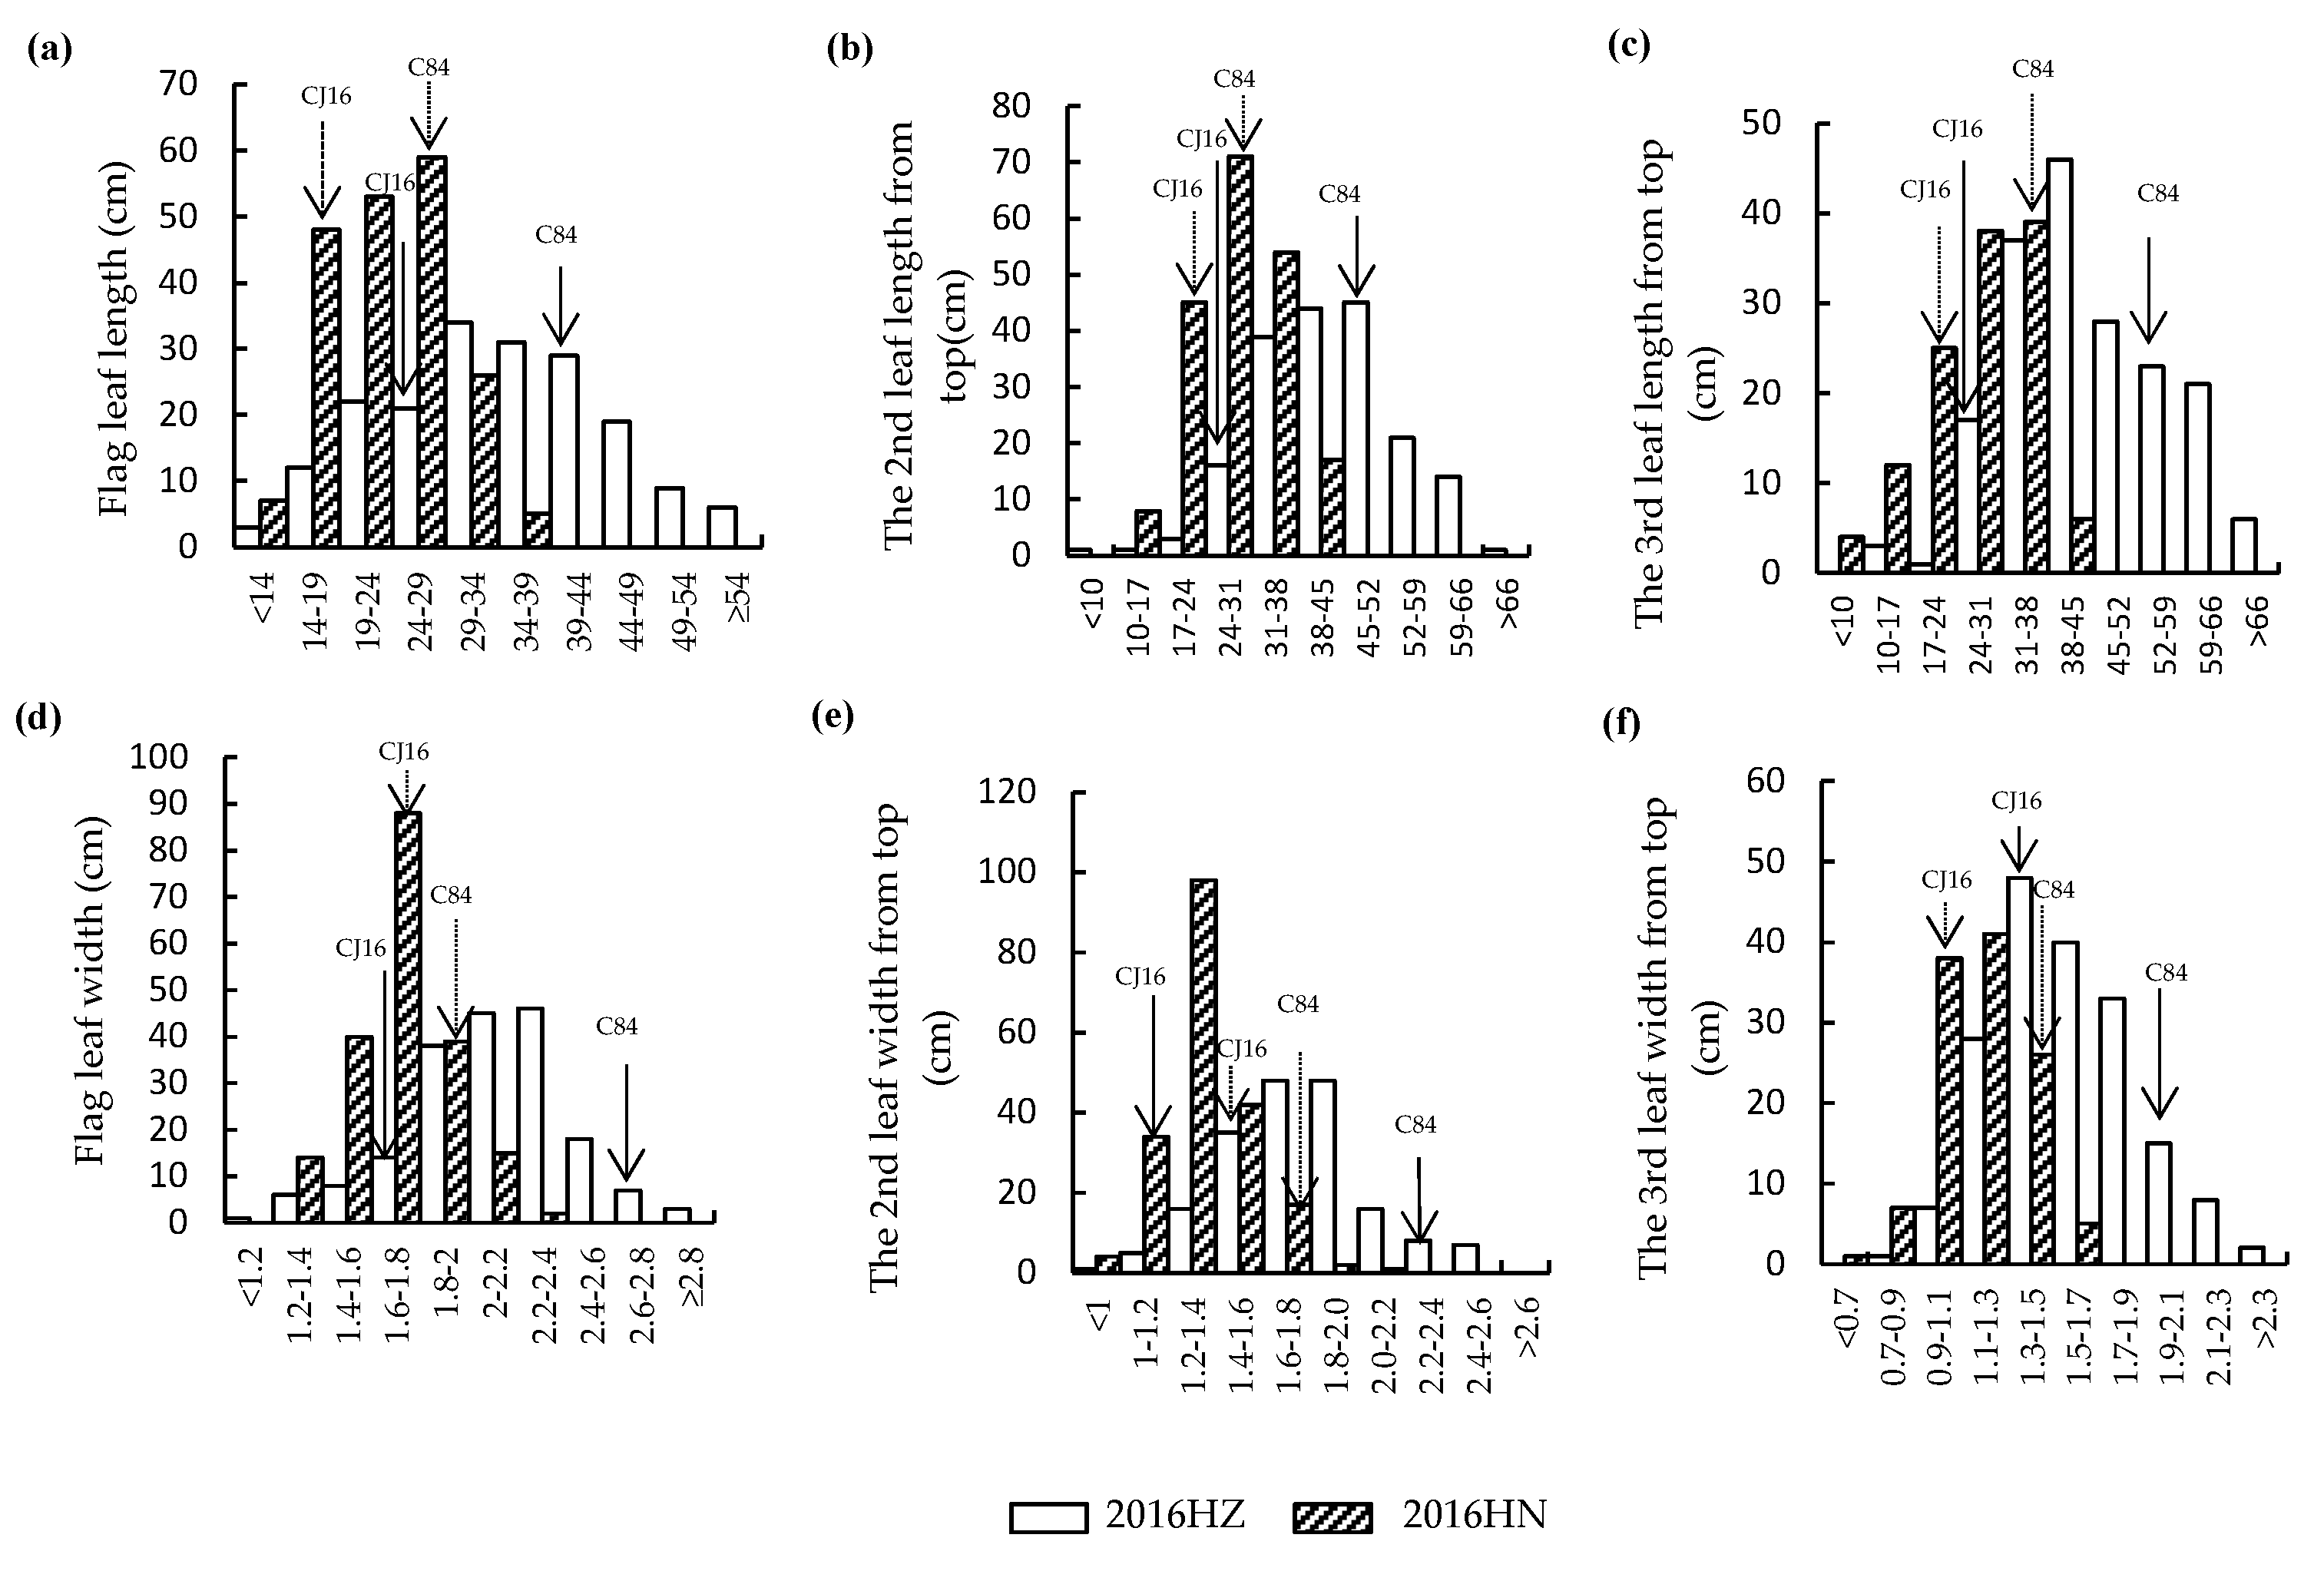
2.1. Analysis of Leaf Morphology in the RIL Population and Their Parental Cultivars

The morphology of the top three leaves of RIL parents Chunjiang 16B (CJ16) and Chunhui 84 (C84) was investigated and significant differences were found for leaf length, width, and area (Figure 1a–c). Compared with CJ16, the top three leaves length of C84 were 42.2%, 40.2%, and 46.6% longer, respectively (Figure 1d). Similarly, the leaf width of C84 was significantly wider than that of CJ16 (Figure 1e). Thus, a much larger leaf area was found in C84, that is, 2.7 times the flag leaf and 2.2 times both the second and third leaves (Figure 1f). In RIL population, the leaf traits of the top three leaves were all continuously distributed with large variations and transgressive segregation, showing a typical pattern of quantitative variation at both Hangzhou and Hainan experimental sites (Figure 2), which were suitable for QTL mapping. Furthermore, we observed that the leaf traits of RILs in Hangzhou generally tended to higher values, while those in Hainan tended to lower ones.

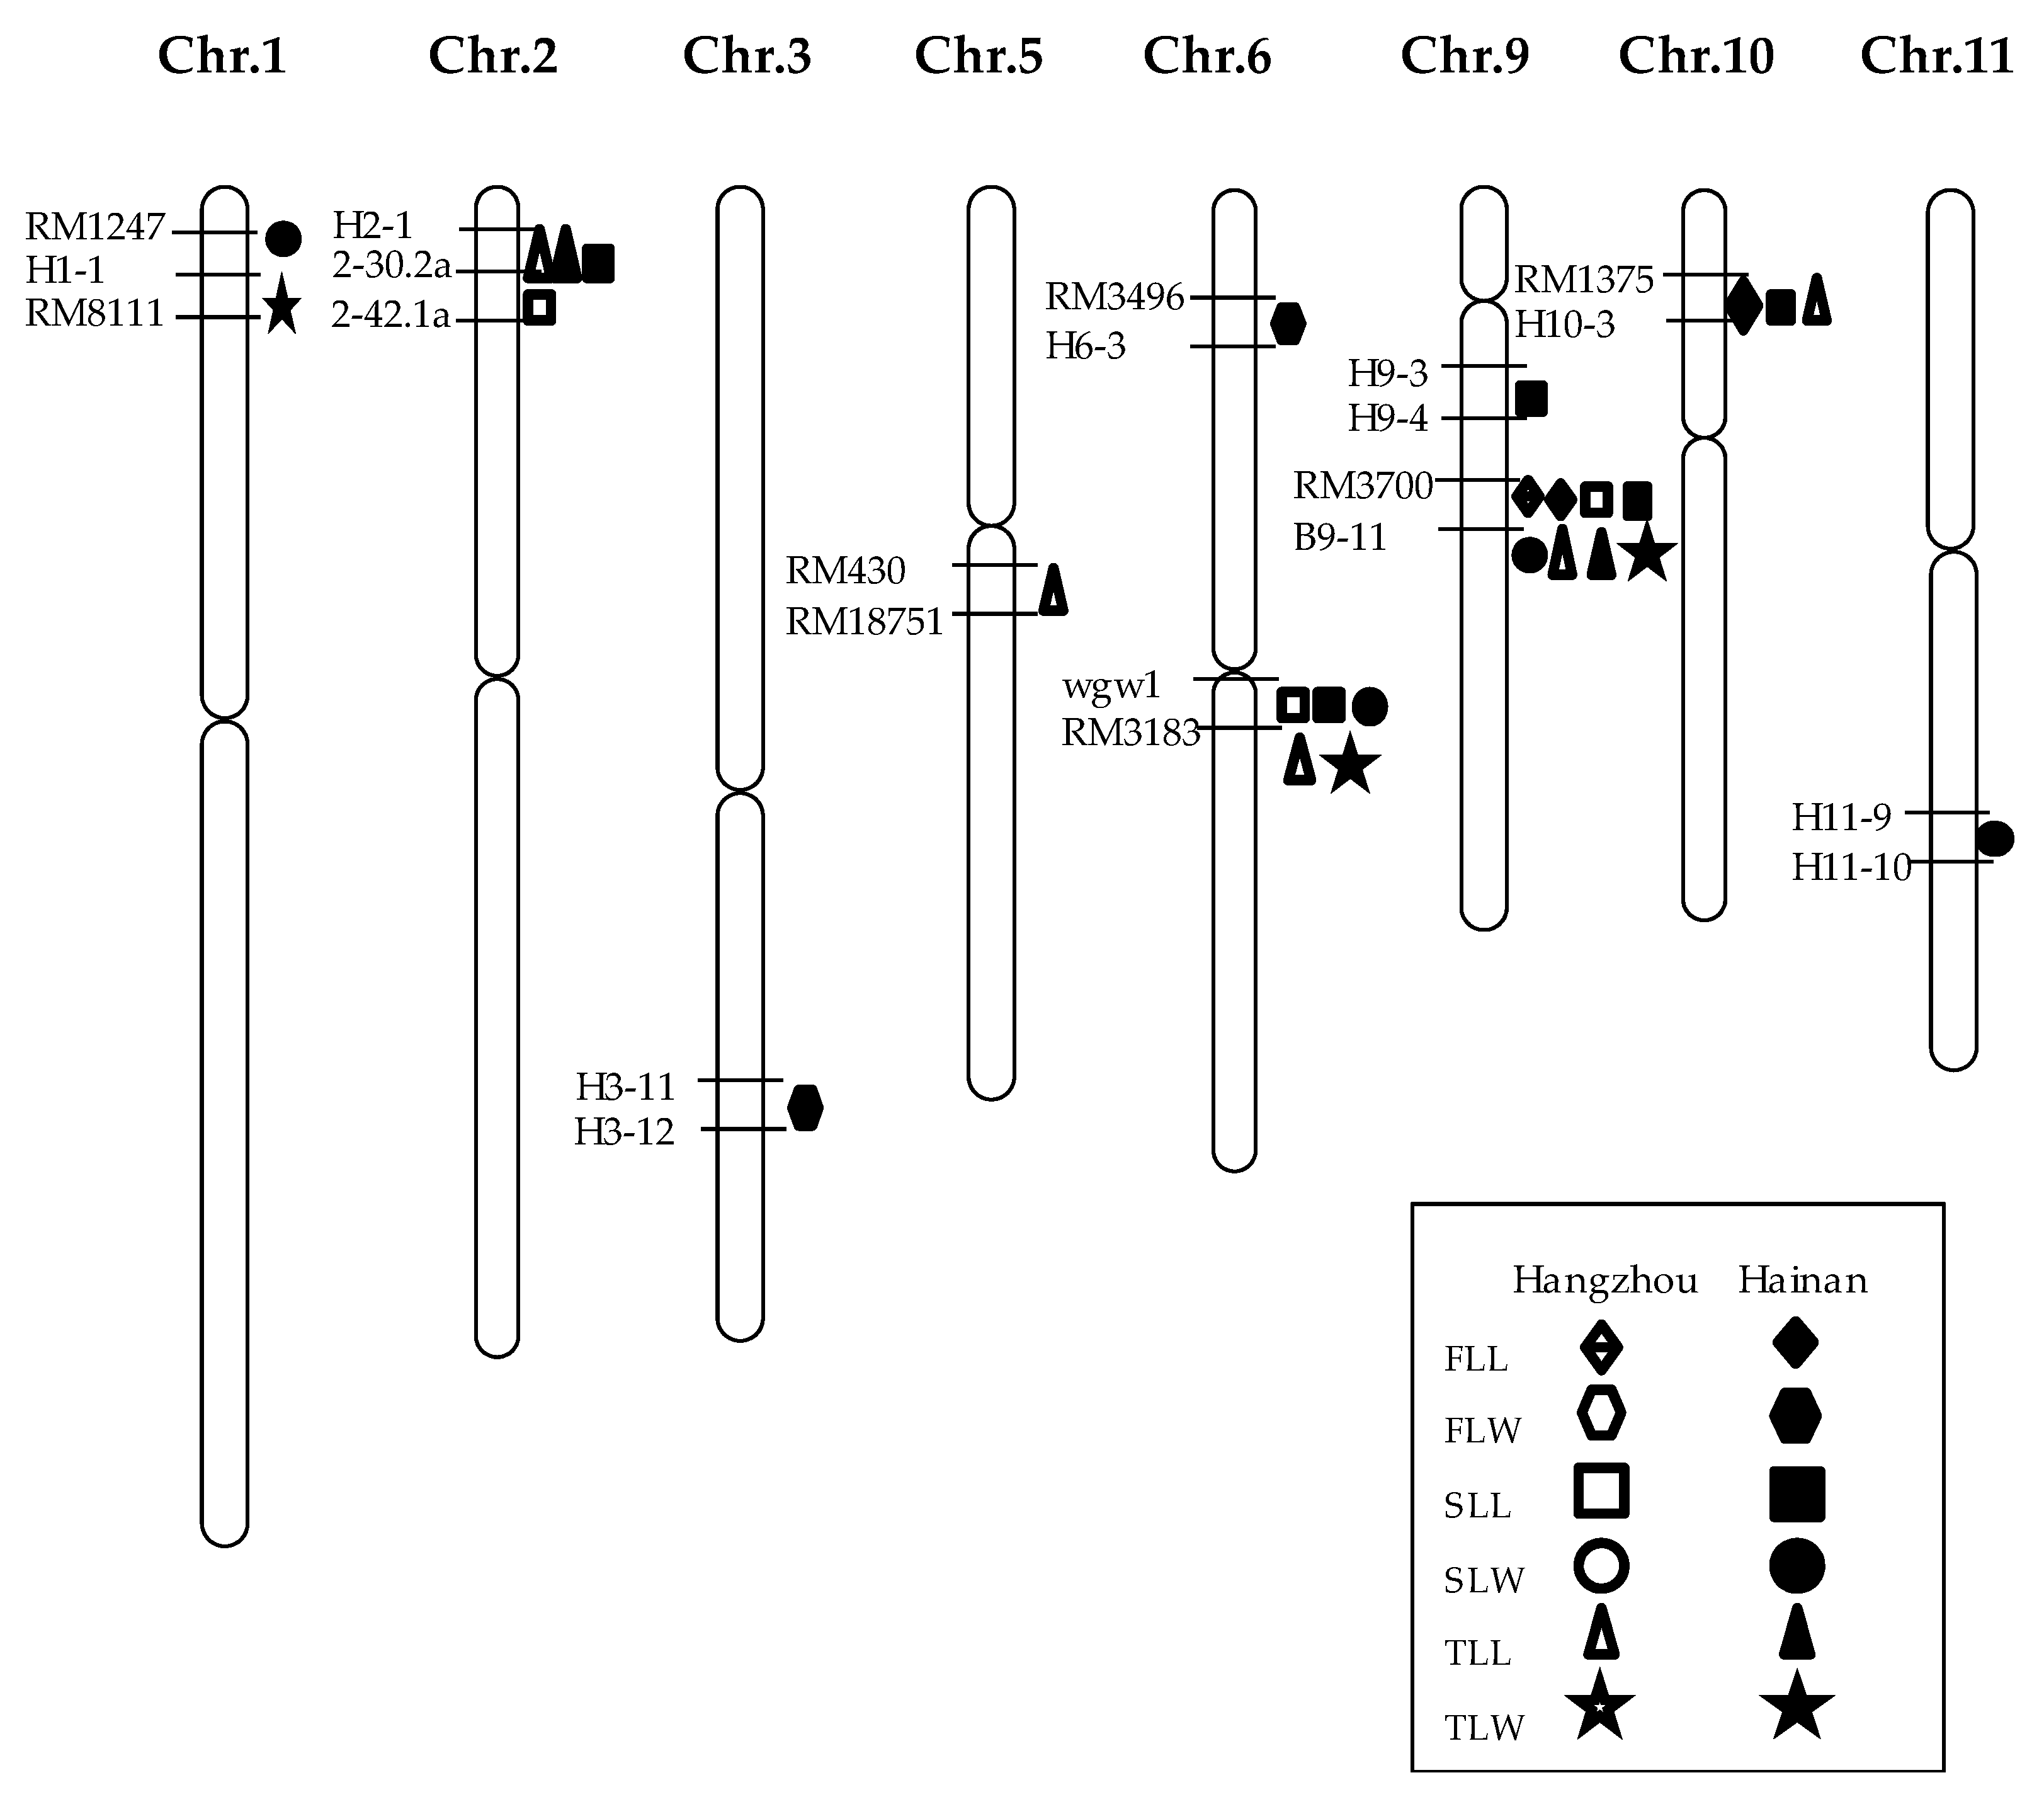
2.2. Correlation Analysis and QTL Mapping

The correlation analysis for leaf traits in the RIL population showed a low correlation between Hangzhou and Hainan for the length of the second and the third leaf. However, the flag leaf length and width, and the second and third leaf width, were significantly positively correlated between the two environments. This could be the result of the indica–japonica subspecies differentiation of the parents and the distinct temperature and light conditions of Hangzhou and Hainan (Table 1).
QTL mapping was performed for the leaf length and width of the top three leaves (Table 2 and Figure 3). The results showed that a total of 27 QTLs were detected in the two environments, which were distributed on chromosomes 1, 2, 3, 5, 6, 9, 10, and 11. In Hangzhou, nine QTLs were detected, including one QTL for the flag leaf length, three QTLs for the second leaf length, and five QTLs for the third leaf length, which explained phenotypic variance in the range of 7.76%–32.41 %. In Hainan, 18 QTLs were detected, including two QTLs for the flag length, two QTLs for the flag leaf width, five QTLs for the second leaf length, four QTLs for the second leaf width, two QTLs for the third leaf length, and three QTLs for the third leaf width, which explained phenotypic variance in the range of 1.85%–30.63%. Among them, three leaf length QTLs, namely, the flag leaf length QTL qFLL9, the second leaf length QTL qSLL9, and the third leaf length QTL qTLL9, were simultaneously mapped in RM3700-B9-11 interval on chromosome 9 across the two environments, with the enhancing alleles all from C84, explaining phenotypic variance ranging from 19.19% to 32.41%, which agreed with the significantly positive correlation of flag leaf length between Hangzhou and Hainan (Table 1). Meanwhile, even though no significant correlation was found for the leaf length of the second and third leaf, consistent QTLs across both locations were also detected, that is, qSLL6 and qTLL2, which could be because of their larger genetic effects and/or less sensitivity to environmental variation. In addition, we noted QTLs for the width of the second and third leaf were also detected in the interval between RM3700 and B9-11, but with the increasing alleles coming from CJ16. These results prompt us to mainly focus on the major region flanked by RM3700 and B9-11 on chromosomes 9, which showed stable effects on leaf morphological development, and named qLL9.

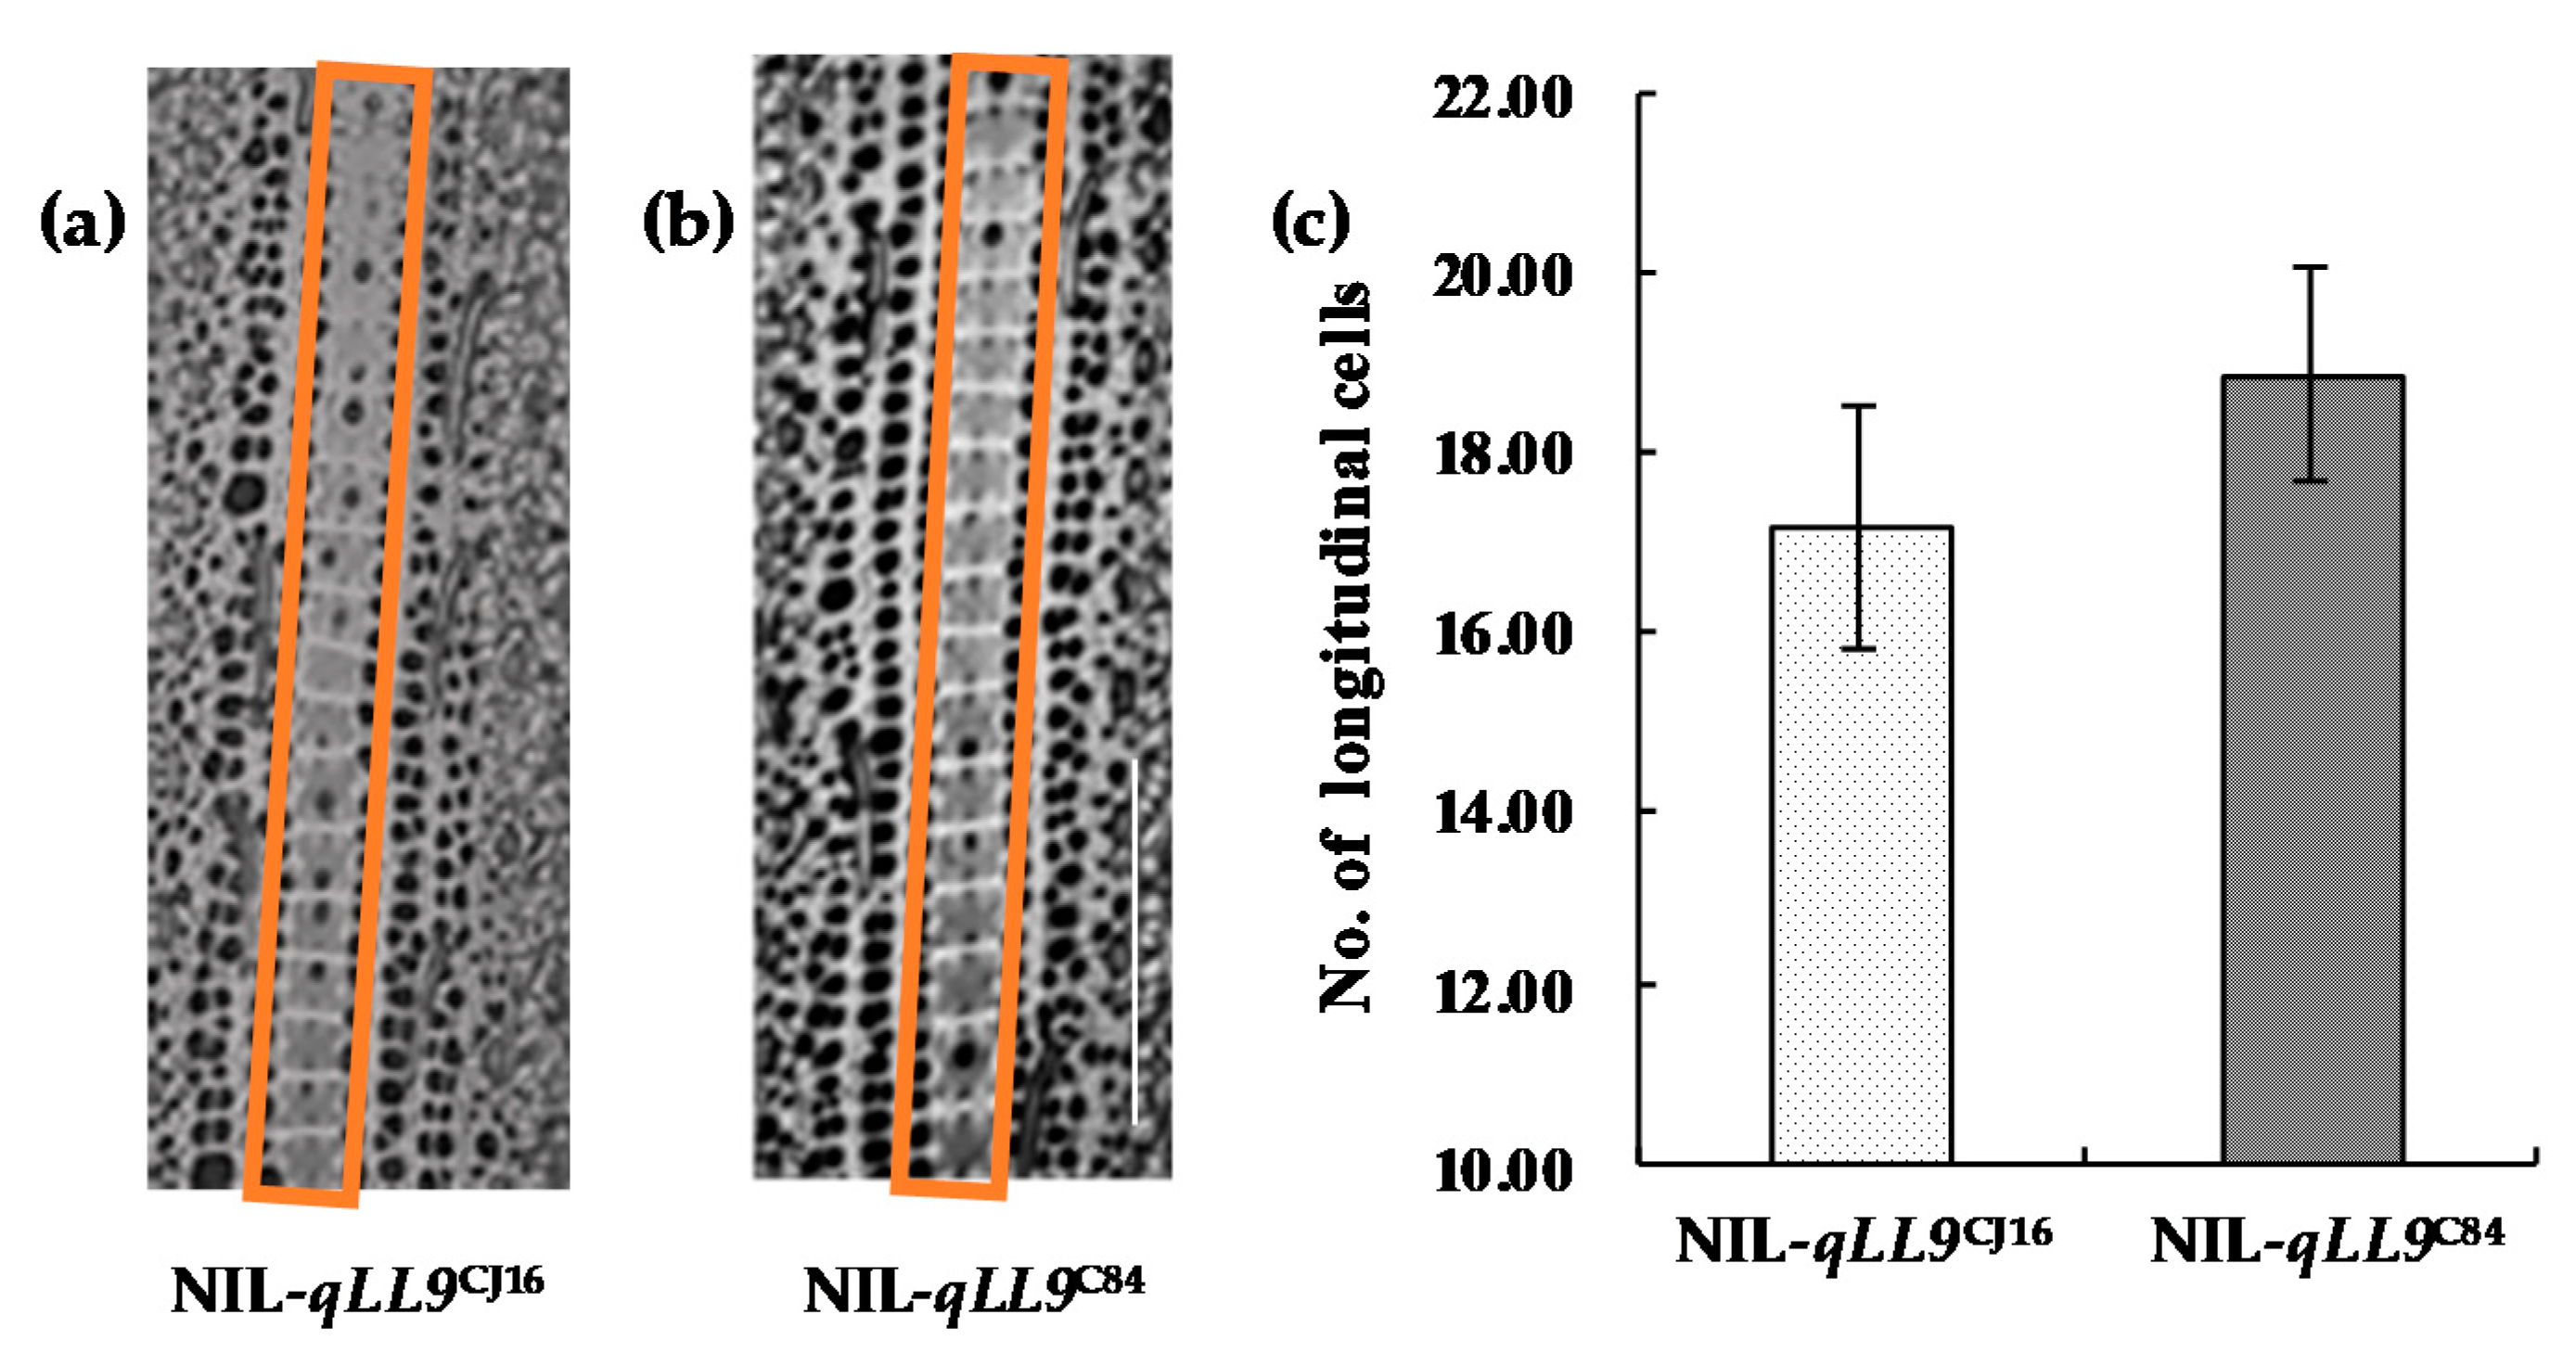
2.3. Fine Mapping and Leaf Shape Characterization of qLL9

According to the flanking markers RM3700 and B9-11 on chromosome 9, one residual heterozygote with a heterozygous segment covering the interval was identified from the RILs, from which a large population was derived. Nine representative near isogenic lines (NILs) with introgressions covering different portions of the target region were identified using DNA markers in the target interval for QTL fine mapping (Table 3; Figure 4a). Then, combined with their flag leaf length, qLL9 was delimitated into a 16.17 kb region between markers C9-1640 and C9-1642 (Figure 4a).
To further clarify the effect of qLL9 on leaf morphology, we compared the leaf traits in a near-isogenic line set of NIL-qLL9CJ16 and NIL-qLL9C84, and a chromosome segment substitution line (CSSL)-qLL9KASA and its recurrent parent Wuyunjing (WYJ) 7. In both groups, significant differences for the flag leaf were only found for the length, but not the width (Figure 5), while both the leaf length and width variation were significant for the second and third leaf from the top (Figure S1), which were highly consistent with the findings in our QTL primary mapping (Table 2). Obviously, compared with NIL-qLL9CJ16, the longer flag leaf length of NIL-qLL9C84 resulted in a larger flag leaf area (Figure 5d–f). However, the opposite allelic effects on leaf length and width of the second and third leaf from the top even made the leaf area variation not significant (Supplementary Figure 1). Similarly, after introgression of the Kasalath allele at qLL9 in WYJ 7, CSSL-qLL9KASA resulted in a 1.5 times longer flag leaf from 29.4–43.5 cm2 (Figure 5g–i).
On the other hand, it is noted that the flag leaf epidermal cells showed no significant difference in either the size or number in unit area between NIL-qLL9CJ16 and NIL-qLL9C84, which suggested the variation of flag leaf length could be mainly attributed to the increase of the total cell number (Figure 6). In summary, qLL9 influenced the leaf length and area variation by regulating the development of leaf cells.

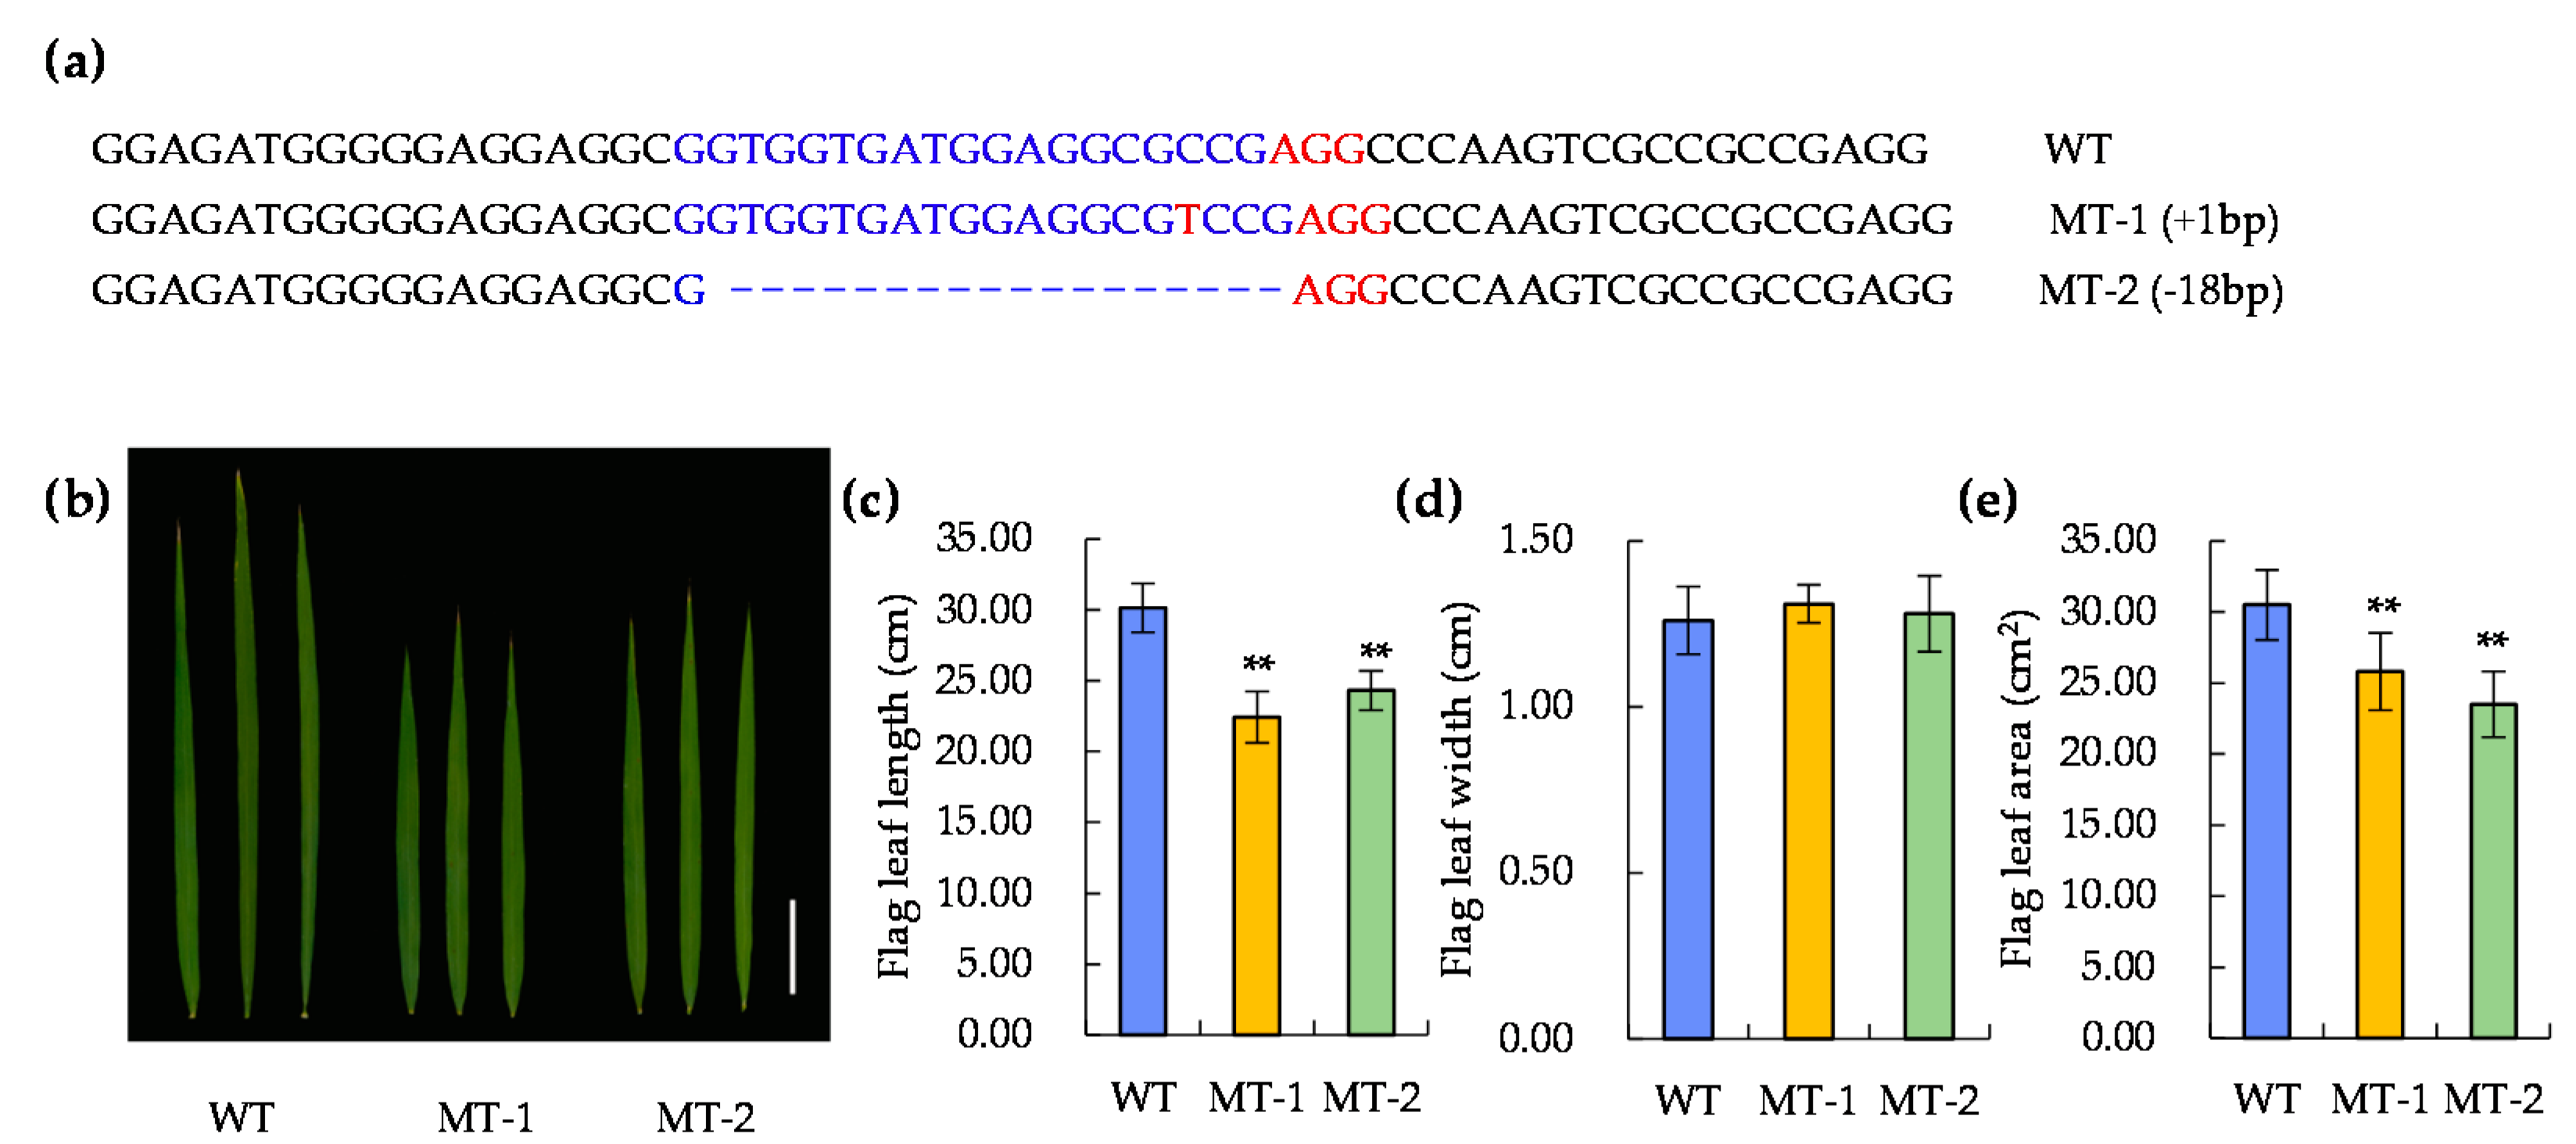
2.4. Determination of the Candidate Gene

According to the database of Rice Genome Annotation Project (http://rice.plantbiology.msu.edu), three open reading frames (ORFs) were predicted in the target region defined by C9-1640 and C9-1642 (Figure 4b and Table 4), namely, LOC_Os09g26970 encoding cytochrome P450 protein, LOC_Os09g26980 encoding retrotransposon protein, and LOC_Os09g26999 encoding G protein γ subunit (a cloned gene DEP1) [63]. By sequencing and qRT-PCR for the three candidates, six non-synonymous single nucleotide polymorphisms (SNPs) were found across the three candidate genes (Figure 4b and Table 5). No significant difference was detected in the LOC_Os09g26970 and LOC_Os09g26980 expression between NIL-qLL9CJ16 and NIL-qLL9C84 at both the tillering and heading stages, but the expression of LOC_Os09g26999 in NIL-qLL9C84 was significantly increased by 14.1 times and 52.3 times, respectively, compared with NIL-qLL9CJ16 at the two stages (Figure 4c,d). Therefore, LOC_Os09g26999 could be the best potential candidate for qLL9. In addition, we found that qLL9 was allelic to the known gene DEP1 [63]. We inferred that the difference of amino acid of qLL9 would have an influence on the gene expression and would thus affect the leaf morphological development.
It has been reported that DEP1 is mainly related to panicle development [63]. To further verify its correlation with leaf development, the CRISPR/Cas9 gene knockout technique was adopted in the genetic background of Nipponbare (Figure 7). Two knockout plants of LOC_Os09g26999, namely mutant 1 (MT-1) and mutant 2 (MT-2), were screened in T0 generation (Figure 8; Figure S2). After continuous selfing and marker assay, homozygous positive transgenic lines in T2 generation were obtained and used for investigating the flag leaf morphology. The results showed no significant difference in the flag leaf width between the knockout and wild-type plants. However, the flag leaf length and area were significantly decreased in both knockout lines. (Figure 8b–e). The results showed that qLL9 was mainly responsible for the leaf length development, and the loss-function of qLL9 could lead to a reduction in leaf length, and thereby leaf area.
To further explore the causal factor for differential expression of LOC_Os09g26999 observed in the NIL set, we compared the promoter sequence of 2.0 kb upstream of the ATG between them, and found nine variations (Table 6). Then, the activity difference of the two types of promoters was compared by dual luciferase reporter assay. The result showed that the LUC-C84 promoter had 3.9 times higher expression of reporter genes than the LUC-CJ16 promoter (Figure 9). That is to say, the promoter activity of qLL9 also played a significant role in the gene expression and leaf-trait variation.

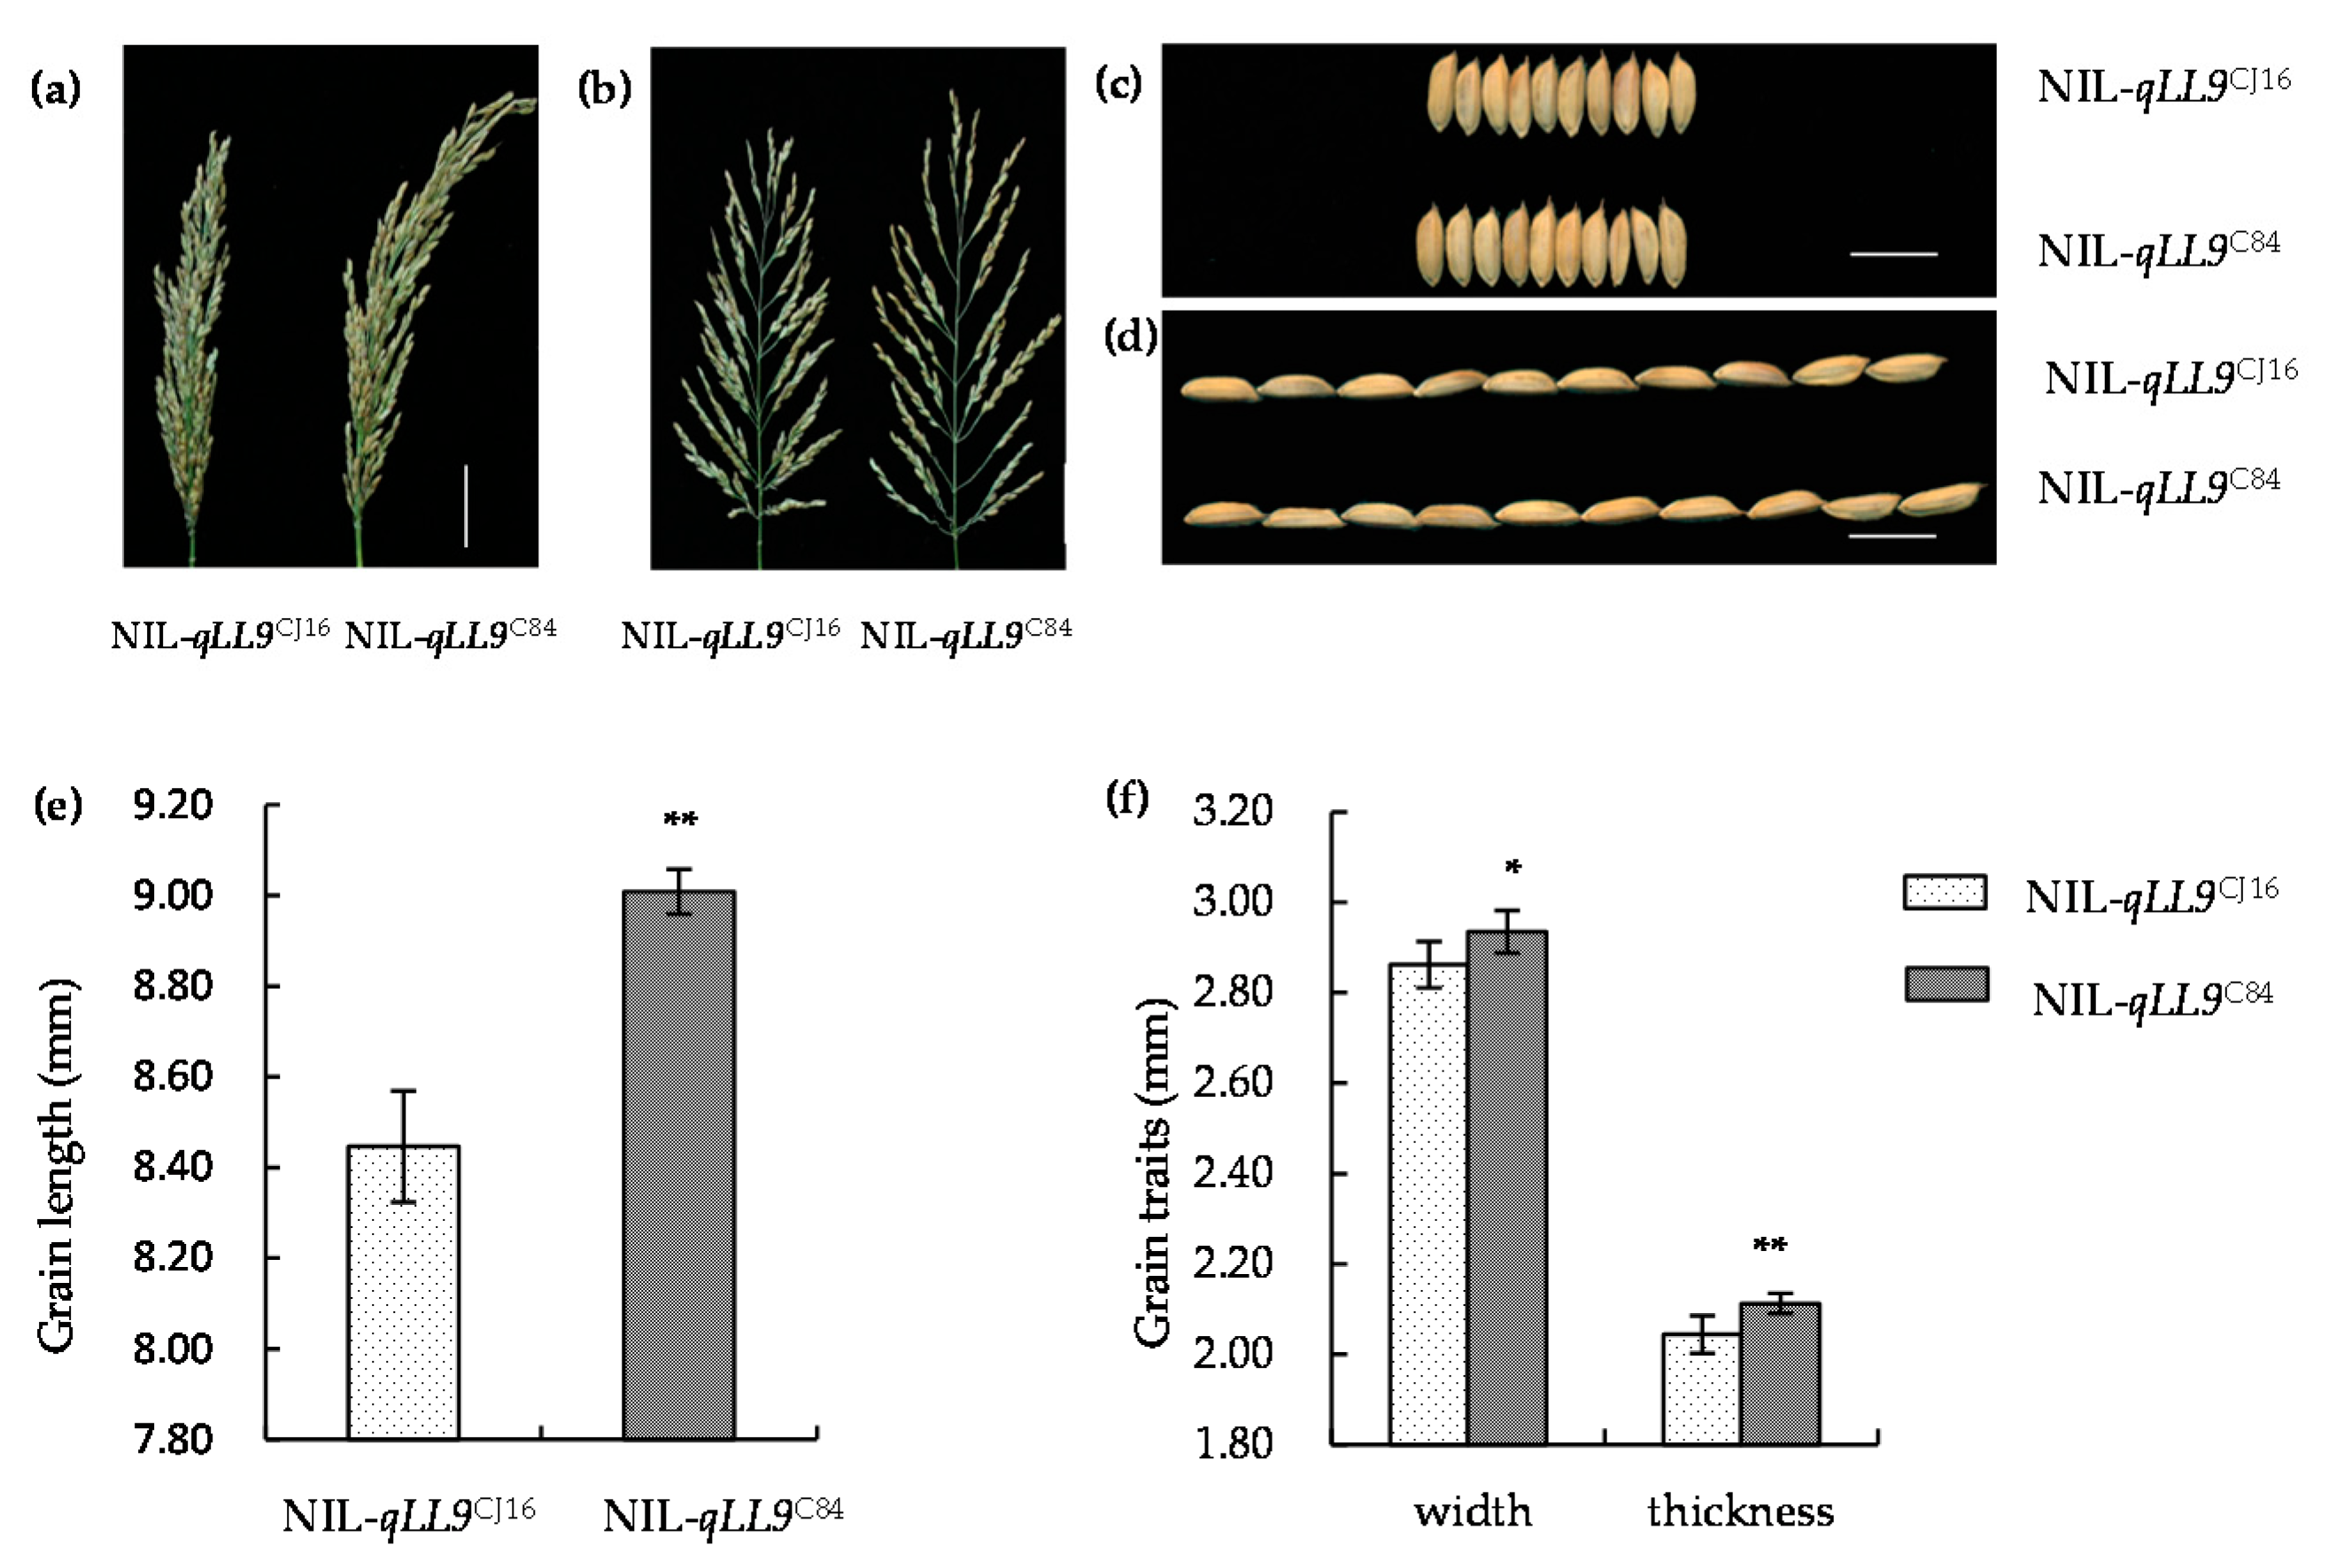
2.5. qLL9 Affecting the Yield Traits

To verify whether qLL9 affected the yield formation, we firstly investigated its effects on grain shape using NIL-qLL9CJ16 and NIL-qLL9C84 plants (Figure 10). We found that the grain length, width, and thickness of NIL-qLL9C84 are all slightly larger than those of NIL-qLL9CJ16 by 6.66%, 2.55%, and 3.37%, respectively.
Then, we compared the other yield component traits between the NIL-qLL9CJ16 and NIL-qLL9C84 plants. There was no significant difference between them in the number of productive panicles per plant, the number of primary branches per panicle, the number of second branches per panicle, and the number of grains per panicle (Table 7). However, the thousand-grain weight of NIL-qLL9C84 was significantly higher than that of NIL-qLL9CJ16 (22.99 g and 20.79 g, respectively), while the seed setting rate of NIL-qLL9C84 was lower (69.71% and 75.80%, respectively). Even so, the yield per plant of NIL-qLL9C84 was 16.59% higher than that of NIL-qLL9CJ16. That is, the increase in the yield per plant was mainly attributed to the increase in thousand-grain weight. Further, yield measurement in plots also showed that the NIL-qLL9C84 could yield more grains than NIL-qLL9CJ16, increasing by 15.08%. As for the actual yield per hectare, NIL-qLL9C84 could increase by 991.67 kg compared with NIL-qLL9CJ16. These results showed that the C84 allele at qLL9 significantly increases the grain size, thousand-grain weight, and grain yield in the field production.

3. Discussion

In this study, the main effect QTL qLL9 related to the leaf length was positioned by RIL population. LOC_Os09g26999 was identified as the target gene through sequence comparison, expression analysis, and CRISPR-Cas9 gene editing technology. It is allelic to the known spike-shaped gene DEP1/EP/qPE9-1 [63,64,65]. The plants of NILs and CSSLs carrying different alleles of qLL9 showed great differences in leaf, spike, and yield. All results indicated that QTL qLL9 has a pleiotropic function in rice. In addition to regulating spike development, qLL9 is also plays a key role in the development of leaf morphology, grain shape, yield, and other traits.
Previous studies have demonstrated that QTL qLL9 candidate gene LOC_Os09g26999 encodes a cysteine-rich region [66]. Huang et al found that the replacement of a 637 bp stretch from the fifth exon of LOC_Os09g26999 with a 12 bp sequence results in erect panicle architecture because of the early termination of translation [63]. Due to the differences of LOC_Os09g26999 relative expression and promoter activity in CJ16 and C84, the promoter sequences and regulatory elements were compared by website (https://sogo.dna.affrc.go.jp). We found that nine nucleotide differences were observed among the parental lines, eight of which were located in cis-acting elements possibly by mediating enhancer activity depending on upstream region G/C mutation at 1255 bp upstream of ATG, which is consistent with site II transcriptional core sequence regulatory elements (TGGGCCCJ16 to TGGCCCC84). It plays an important role in the specific expression of proliferating cell nuclear antigen (PCNA) gene in rice meristem [67,68]. We speculate that G/C mutation may be through mediation of enhancer activity dependent on far upstream regions. Comparison of CDS showed that a single base substitution event is observed from A to G at 3,182 bp downstream of ATG in LOC_Os09g26999 between CJ16 and C84, leading to the substitution of amino acids from tyrosine to cysteine. This event might lead to changes in the structure of the γ subunit, affecting the signal transduction of G protein. Further work is needed to determine whether the difference expression of LOC_Os09g26999 is due to changes in protein structure or differences in promoter activity.
The leaf morphological development in rice is regulated by the size and number of leaf epidermal cells. In rot4-1D mutant, the reduction in the number of leaf longitudinal cells induces a short leaf [69]. Tsuge et al revealed that the Arabidopsis thaliana rotundifolia3 leaf mutant has the same number of cells as the wild type, but with reduced cell elongation in the leaf-length direction [70]. Rice flag leaf width QTL qFLW7, homologous to Arabidopsis LNG1, regulates the longitudinal growth of cells and its overexpression results in elongated leaves [71]. In this study, no significant difference was observed in the cell size per unit area of the leaf epidermis between NIL-qLL9C84- and NIL-qLL9CJ16, whereas the total number of cells increased leading to leaf longer. The expression levels of eight cell cycle-related genes in NILs were analyzed at the heading stage (Figure 11 and Supplementary Table S1), which showed that the expression of MCM5 plays an important role in the initiation and extension of DNA replication in the G1 phase, which was significantly up-regulated in NIL-qLL9C84 compared to NIL-qLL9CJ16 [72]. Plant Class A cyclin (Cyclin) CYCA2;3 and CYCA2;2 [73,74] could identify and interact with different cyclin-dependent kinases, which were also remarkably up-regulated in NIL-qLL9C84. Therefore, qLL9 from indica rice C84 could improve the DNA replication efficiency of leaf tissue cells, accelerate cell division, and promote leaf elongation, which also corresponded to the fact that the morphology of the leaf epidermal cells of NIL-qLL9C84 was unchanged while the total number of the cells increased. These findings indicated that qLL9 may affect plant morphological development by participating in the regulation of cell division cycle. Notably, the regulatory mechanisms of different genes on leaf morphological development are different, thus their interactions in leaf morphogenesis should be studied in details in the future.

4. Materials and Methods

4.1. RIL Population and Field Trial

The RIL population consisting of 188 lines was derived from the cross of the japonica rice Chunjiang 16B (CJ16) as the female parent and the indica rice Chunhui84 (C84) as the male parent, which are the maintainer and restorer lines of the commercial intersubspecific hybrid rice Chunyou84. The rice population was tested at experimental fields of the China Rice Research Institute located in Hangzhou, Zhejiang, and Lingshui, Hainan, during May–October 2016 and November 2016–April 2017, respectively. Twenty-five-day-old seedlings were transplanted at a hill spacing of 20 cm × 20 cm with three replications. In each replication, one line was grown in three-row plots with six plants per row. The block was managed in accordance with conventional field management, and diseases, insects, and weeds were controlled [75]. The leaf morphology and yield traits were investigated at the heading stage and mature stage. In each trial, data of the three replications were averaged for each line and used for data analysis.

4.2. Statistical and Genetic Analysis

The linkage map of the RILs consisted of sixty-nine simple sequence repeats (SSR) and eighty-nine sequence tagged site (STS) DNA markers. QTL analysis was conducted using QTL Network 2.1. Critical F values for genome-wise type I error were calculated with 1000 permutation tests and used for claiming a significant event. A significant level of p < 0.005 was set for candidate interval selection, putative QTL detection, and QTL effect estimation. The proportion of phenotypic variance (R2) explained by a single main QTL for a given trait in a given population was calculated by Markov Chain Monte Carlo algorithm. In the genome scan, a testing window of 10 centimorgan (cM), filtration window of 10 cM, and walk speed of 1 cM were chosen. The naming of QTLs was based on the method of McCouch et al. [75].

4.3. Map-Based Cloning and Candidate-Gene Promoter Activity for qLL9

Using flanking markers RM3700 and B9-11 of qLL9 obtained from QTL mapping, residual heterozygotes (RHs) were screened from the RIL population, which were segregated at qLL9 with high homogenous genetic background. Six pairs of molecular markers were developed in this target interval (Table 3). By substitution mapping, we investigated the flag leaf length and the new developed marker genotypes of 2307 RH-derived introgression lines, and then the qLL9 was fine mapped.

4.4. RNA Extraction and qRT-PCR

Total RNA of NIL-qLL9CJ16 and NIL-qLL9C84 was extracted from the penultimate leaves at the tillering stage and the flag leaf at heading stage to analyze the expression difference of candidate genes (Table 3 and Table 4). We used the AxyPrepTM Multisource Total RNA Miniprep Kit (Axygen) to extract total RNA, which was then retro-transcribed using PrimeScriptTM RT Reagent Kit with gDNA Eraser (Takara, Dalian, China). Quality and concentration of the RNA extracted were checked with electrophoresis on 1% agarose gel and measured using the Nanodrop ND-2000 spectrophotometer (NanoDrop Technologies, Wilmington, CA, USA). Concentration of the RNA samples used for cDNA synthesis was normalized by dilution with RNase-free ultra-pure water. qRT-PCR assays of 20 μL reaction volumes, which contained 0.5 μL of synthesized cDNA, 0.4 μM of gene-specific primers, and 10 μL of SYBR® Premix Ex TaqTM (Takara), were conducted using ABI 7500 Real-time PCR System (Applied Biosystems, Foster, CA, USA). Following the manufacturer’s instruction, the qRT-PCR conditions were set up as follows: denaturing at 95 °C for 30 s, then 40 cycles of 95 °C for 5 s, 55 °C for 30 s, and 72 °C for 30 s. To standardize the quantification of gene expression, we used the rice Ubiquitin (UBQ) gene (Os03g0234200, http://rapdb.dna.affrc.go.jp/) as an internal control.
According to the sequence shown in http://rice.plantbiology.msu.edu/index.shtml, the primer POs26999-F/R (Table 3) was used to amplify LOC_Os09g26999 promoter of CJ16 and C84, which were constructed into pGreenII0800-LUC using homologous recombination [76]. Positive clones were screened by colony PCR and sequencing and were named as proCJ16-LUC and proC84-LUC. The plasmids and the internal reference (R-LUC) were transformed into the protoplasts of rice variety 93-11 by 40% PEG-3350 (Sigma, St. Louis, MO, USA) solution-mediated transformation [77]. The dual-luciferase reporter gene detection kit (Promega Company, Madison, WI, USA) was used for detection and analysis of the promoter activity.

4.5. CRISPR/Cas9 Transgene Analysis

The target sequence of the potential candidate LOC_Os09g26999 refers to a previous study [78]. Synthetic primers Os26999-g++ and Os26999-g−−were used to make the target site adapter (Table 3). This adapter was connected to an SK-gRNA carrier, and positive intermediate carrier SK-gRNA-Os26999 was screened out. pC1300-2×35S::Cas9-gOs26999 final expression carrier was constructed by means of enzyme digestion-joining method. Agrobacterium tumefaciens EHA105 was transformed through positive cloning. Agrobacterium tumefaciens-mediated gene transfer experiments were carried out with the background of Nipponbare [79]. The result was analyzed via the sequential decoding method (http://dsdecode.scgene.com/) to identify transgenic positive plants. At heading stage, 15 wild-type and 15 mutant plants were selected to measure the length, width, and area of the flag leaf.

4.6. Construction of Near Isogenic Lines and Chromosome Segment Substitution Lines and Trait Measurement

Using flanking markers C-1640 and C-1642 (Table 3), a set of near isogenic lines (NILs) for qLL9 was identified from RH-derived segregating populations with a higher homogenous background, named NIL-qLL9CJ16 and NIL-qLL9C84. At the same time, one chromosome segment substitution line (CSSL) for qLL9 was obtained with Kasalath (KASA) as the donor parent and Wuyunjing 7 (WYJ 7) as the recurrent parent through one cross followed by six continuous backcrosses and one self-crossing, named CSSL-qLL9KASA.
The leaf length, width, and area of the NIL and CSSL set were investigated at the heading stage, while the panicle length, the number of primary and secondary branches, the number of grains per panicle, grain length, grain width, grain thickness, thousand-grain weight, and setting percentage were scored from 10 randomly selected main panicles at maturity. Then, Student’s t-test was adopted to analyze the phenotypic difference between the two genotypic groups in each set.
The grain yield was measured using the NIL set NIL-qLL9CJ16 and NIL-qLL9C84, of which each was planted in three 48 m2 plots, at a hill spacing of 20 cm × 20 cm. At maturity, three points in each plot were randomly harvested, with 30 hills per point, to determine the grain yield, which is then converted into the grain yield per hectare.

4.7. Morphological Observation on Leaf Epidermal Cytology

The commercially available transparent nail polish without color is selected, which is conducive to the transparency of microscopic materials. The flag leaves of tested rice plants at the heading stage were sampled and painted with the nail polish evenly at the same part for 10 min air-dry. When an open mouth exists at the end of the coating layer of the nail polish, the dried coating is torn with a transparent tape and placed on the fragment. Then, the cover slip was covered. The filter paper was covered by the blunt end of the dissecting needle, and the fragment was gently pressed to make a temporary filling piece. Under the electron microscopy, the cell size and number of 15 leaves of a single plant were analyzed [80].

5. Conclusions

Our work identified the genetic contribution of qLL9 to both flag leaf morphologic development and yield formation. Improving the photosynthetic efficiency and coordinating the source–sink interaction through leaf morphogenesis are the premise to increase the rice yield and to establish the ideal plant type. Identification and utilization of the QTLs with beneficially pleiotropism for both leaf shape and grain yield would greatly contribute to molecular breeding of superior rice. For example, the QTL qLSCHL4/NAL1 is correlated with leaf shape and involved in regulating the development of chlorophyll content, grain number and grain weight [15]. QTL qFLW79311 related to flag leaf width, could improve leaf shape and grain traits, remarkably increase rice yield in the field [71]. Similarly, GS2 could increase both grain weight/size and leaf length and thus grain yield [60,61]. According to the main objectives of rice molecular design breeding, future studies should systematically analyze the source-sink relationship and the genetic network of plant type establishment, directional polymerize the qLL9, NAL1, qFLW7, GS2, and other beneficial genes from indica and japonica subspecies of rice to improve the yield potential and establish the ideal plant architecture in molecular breeding of superior rice.

Supplementary Materials

Supplementary materials can be found at https://www.mdpi.com/1422-0067/20/4/866/s1.

Author Contributions

Data curation, X.F., J.X., M.Z., T.L., Y.Z., and J.W.; Formal analysis, X.F., T.L., and D.R.; Funding acquisition, G.Z.; Investigation, X.F., J.X., M.Z., M.C., L.S., Y.Z., J.W., and J.H.; Methodology, J.H., L.Z., Z.G., L.G., D.R., G.C., and G.Z.; Project administration, Q.Q. and G.Z.; Resources, G.D. and J.L.; Software, M.Z. and Z.G.; Supervision, Q.Q. and G.Z.; Writing—original draft, X.F. and J.X.; Writing—review & editing, G.Z.

Funding

This work was supported by grants from the National Natural Science Foundation of China (31770195, 3186114300 and 31570184); National Key Research and Development Program (2016YFD0101801); and CAAS Science and Technology Innovation Program (CAAS-XTCX2016009).

Conflicts of Interest

The authors declare no conflict of interest.

References

  1. Heath, D.V.; Gregory, F.G. The constancy of the mean net assimilation rate and its ecological importance. Ann. Bot. Lond. 1938, 2, 811–818. [Google Scholar] [CrossRef]
  2. Donald, C.M. The breeding of crop ideotypes. Euphytica 1968, 17, 385–403. [Google Scholar] [CrossRef]
  3. Mason, T.G.; Maskell, E.J. Studies on the transport of carbohydrates in the cotton plant. I. A study of diurnal variation in the carbohydrates of leaf, bark, and wood, and of the effects of ringing. Ann. Bot.-Lond. 1928, 42, 189–253. [Google Scholar] [CrossRef]
  4. Hasson, A.; Blein, T.; Laufs, P. Leaving the meristem behind: The genetic and molecular control of leaf patterning and morphogenesis. C. R. Biol. 2010, 333, 350–360. [Google Scholar] [CrossRef] [PubMed]
  5. Liu, B.; Li, P.C.; Li, X.; Liu, C.Y.; Cao, S.Y.; Chu, C.C.; Cao, X.F. Loss of function of OsDCL1 affects micro RNA accumulation and causes developmental defects in rice. Plant Physiol. 2005, 139, 296–305. [Google Scholar] [CrossRef] [PubMed]
  6. Wang, E.; Xu, X.; Zhang, L.; Zhang, H.; Lin, L.; Wang, Q.; Li, Q.; Ge, S.; Lu, B.R.; Wang, W.; et al. Duplication and independent selection of cell-wall invertase genes GIF1 and OsCIN1 during rice evolution and domestication. BMC Evol. Biol. 2010, 10, 108–120. [Google Scholar] [CrossRef] [PubMed]
  7. Liu, X.F.; Li, M.; Liu, K.; Tang, D.; Sun, M.F.; Li, Y.F.; Shen, Y.; Du, G.J.; Cheng, Z.K. Semi-Rolled Leaf2 modulates rice leaf rolling by regulating abaxial side cell differentiation. J. Exp. Bot. 2016, 67, 2139–2150. [Google Scholar] [CrossRef] [PubMed]
  8. Zhang, G.H.; Xu, Q.; Zhu, X.D.; Qian, Q.; Xue, H.W. SHALLOT-LIKE1 is a KANADI transcription factor that modulates rice leaf rolling by regulating leaf abaxial cell development. Plant Cell 2009, 21, 719–735. [Google Scholar] [CrossRef]
  9. Yan, C.J.; Yan, S.; Zhang, Z.q.; Liang, G.H.; Lu, J.F.; Gu, M.H. Genetic analysis and gene fine mapping for a rice novel mutant (rl9(t)), with rolling leaf character. Chin. Sci. Bull. 2006, 51, 63–69. [Google Scholar] [CrossRef]
  10. Kong, X.Q.; Gao, X.H.; Sun, W.; An, J.; Zhao, Y.X.; Zhang, H. Cloning and functional characterization of a cation–chloride cotransporter gene OsCCC1. Plant Mol. Biol. 2011, 75, 567–578. [Google Scholar] [CrossRef]
  11. Tian, X.; Zhang, D.B. cDNA cloning and expression analysis of OsWOX4 in rice. J. Shanghai Jiaotong Univ. Agric. Sci. 2011, 29, 8–14. [Google Scholar]
  12. Cho, S.H.; Yoo, S.C.; Zhang, H.T.; Pandeya, D.; Koh, H.J.; Hwang, J.Y.; Kim, G.T.; Paek, N.C. The rice narrow leaf2 and narrow leaf3 loci encode WUSCHEL-related homeobox 3A OsWOX3A, and function in leaf, spikelet, tiller and lateral root development. New Phytol. 2013, 198, 1071–1084. [Google Scholar] [CrossRef] [PubMed]
  13. Luan, W.J.; Liu, Y.Q.; Zhang, F.X.; Song, Y.L.; Wang, Z.Y.; Peng, Y.K.; Sun, Z.X. OsCD1 encodes a putative member of the cellulose synthase-like D sub-family and is essential for rice plant architecture and growth. Plant Biotechnol. J. 2010, 9, 513–524. [Google Scholar] [CrossRef] [PubMed]
  14. Hu, J.; Zhu, Li.; Zeng, D.L.; Gao, Z.Y.; Guo, L.B.; Fang, Y.X.; Zhang, G.H.; Dong, G.J.; Yan, M.X.; Liu, J.; Qian, Q. Identification and characterization of NARROW AND ROLLED LEAF 1, a novel gene regulating leaf morphology and plant architecture in rice. Plant Mol. Biol. 2010, 73, 283–292. [Google Scholar] [CrossRef] [PubMed]
  15. Zhang, G.H.; Li, S.Y.; Wang, L.; Ye, W.J.; Zeng, D.L.; Rao, Y.C.; Peng, Y.L.; Hu, J.; Yang, Y.L.; Xu, J.; et al. LSCHL4 from japonica cultivar, which is allelic to NAL1, increases yield of indica super rice 93-11. Mol. Plant 2014, 7, 1350–1364. [Google Scholar] [CrossRef] [PubMed]
  16. Fujino, K.; Matsuda, Y.; Ozawa, K.; Nishimura, T.; Koshiba, T.; Fraaije, M.W.; Sekiguchi, H. NARROW LEAF 7 controls leaf shape mediated by auxin in rice. Mol. Genet. Genom. 2008, 279, 499–507. [Google Scholar] [CrossRef] [PubMed]
  17. Sazuka, T.; Kamiya, N.; Nishimura, T.; Ohmae, K.; Sato, Y.; Imamura, K.; Nagato, Y.; Koshiba, T.; Nagamura, Y.; Ashikari, M.; et al. A rice tryptophan deficient dwarf mutant, tdd1, contains a reduced level of indole acetic acid and develops abnormal flowers and organless embryos. Plant J. 2009, 60, 227–241. [Google Scholar] [CrossRef]
  18. Woo, Y.M.; Park, H.J.; Su’udi, M.; Yang, J.I.; Park, J.J.; Back, K.; Park, Y.M.; An, G. Constitutively wilted 1, a member of the rice YUCCA gene family, is required for maintaining water homeostasis and an appropriate root to shoot ratio. Plant Mol. Biol. 2007, 65, 125–136. [Google Scholar] [CrossRef]
  19. Zhang, S.Z.; Wu, T.; Liu, S.J.; Liu, X.; Jiang, L.; Wan, J.M. Disruption of OsARF19 is Critical for Floral Organ Development and Plant Architecture in Rice (Oryza sativa L.). Plant Mol. Biol. Rep. 2016, 34, 748–760. [Google Scholar] [CrossRef]
  20. Li, W.; Wu, C.; Hu, G.C.; Xing, Li.; Qian, W.J.; Si, H.M.; Sun, Z.X.; Wang, X.C.; Fu, Y.P.; Liu, W.Z. Characterization and fine mapping of a novel rice narrow leaf mutant nal9. J. Integr. Plant Biol. 2013, 55, 1016–1025. [Google Scholar] [CrossRef]
  21. Hibara, K.; Obara, M.; Hayashida, E.; Abe, M.; Ishimaru, T.; Satoh, H.; Itoh, J.; Nagato, Y. The ADAXIALIZED LEAF1 gene functions in leaf and embryonic pattern formation in rice. Dev. Biol. 2009, 334, 345–354. [Google Scholar] [CrossRef] [PubMed]
  22. Shi, Z.Y.; Wang, J.; Wan, X.S.; Shen, G.Z.; Wang, X.; Zhang, J.L. Over-expression of rice OsAGO7 gene induces upward curling of the leaf blade that enhanced erect-leaf habit. Planta 2007, 226, 99–108. [Google Scholar] [CrossRef] [PubMed]
  23. Li, L.; Xue, X.; Zou, S.M.; Chen, Z.X.; Zhang, Y.F.; Li, Q.Q.; Zhu, J.K.; Ma, Y.Y.; Pan, X.B.; Pan, C.H. Suppressed expressed of AGO1a leads to adaxial leaf rolling in rice. Chin. J. Rice Sci. 2013, 273, 223–230. [Google Scholar]
  24. Li, L.; Shi, Z.Y.; Li, L.; Shen, G.Z.; Wang, X.Q.; An, L.S.; Zhang, J.L. Overexpression of ACL1 abaxially curled leaf 1, increased bulliform cells and induced abaxial curling of leaf blades in rice. Mol. Plant 2010, 35, 807–817. [Google Scholar] [CrossRef] [PubMed]
  25. Wang, J.; Hu, J.; Qian, Q.; Xue, H.W. LC2 and OsVIL2 promote rice flowering by photoperoid-induced epigenetic silencing of OsLF. Mol. Plant 2013, 62, 514–527. [Google Scholar] [CrossRef] [PubMed]
  26. Zhao, S.Q.; Hu, J.; Guo, L.B.; Qian, Q.; Xue, H.W. Rice leaf inclination 2, a VIN3-like protein, regulates leaf angle through modulating cell division of the collar. Cell Res. 2010, 20, 935–947. [Google Scholar] [CrossRef] [PubMed]
  27. Li, M.; Xiong, G.Y.; Li, R.; Cui, J.J.; Tang, D.; Zhang, B.C.; Pauly, M.; Cheng, Z.K.; Zhou, Y.H. Rice cellulose synthase-like D4 is essential for normal cell-wall biosynthesis and plant growth. Plant J. 2009, 60, 1055–1069. [Google Scholar] [CrossRef] [Green Version]
  28. Yoshikaw, T.; Eiguchi, M.; Hibara, K.I.; Ito, J.I.; Nagato, Y. Rice SLENDER LEAF 1 gene encodes cellulose synthase-like D4 and is specifically expressed in M-phase cells to regulate cell proliferation. J. Exp. Bot. 2013, 647, 2049–2061. [Google Scholar] [CrossRef]
  29. Ding, Z.Q.; Lin, Z.F.; Li, Q.; Wu, H.; Xiang, C.Y.; Wang, J.F. DNL1, encodes cellulose synthase-like D4, is a major QTL for plant height and leaf width in rice (Oryza sativa L.). Biochem. Biophys. Res. Commun. 2014, 457, 133–140. [Google Scholar] [CrossRef]
  30. Li, Y.Y.; Shen, A.; Xiong, W.; Sun, Q.L.; Luo, Q.; Song, T.; Li, Z.L.; Luan, W.J. Overexpression of OsHox32 results in pleiotropic effects on plant type architecture and leaf development in rice. Rice 2016, 9, 46. [Google Scholar] [CrossRef]
  31. Yang, C.H.; Li, D.Y.; Liu, X.; Ji, C.J.; Hao, L.L.; Zhao, X.F.; Li, X.B.; Chen, C.Y.; Cheng, Z.K.; Zhu, L.H. OsMYB103L, an R2R3-MYB transcription factor, influences leaf rolling and mechanical strength in rice (Oryza sativa L.). BMC Plant Biol. 2014, 14, 158. [Google Scholar] [CrossRef] [PubMed]
  32. Xu, Y.; Wang, Y.H.; Long, Q.Z.; Huang, J.X.; Wang, Y.L.; Zhou, K.N.; Zheng, M.; Sun, J.; Chen, H.; Chen, S.H.; et al. Overexpression of OsZHD1, a zinc finger homeodomain class homeobox transcription factor, induces abaxially curled and drooping leaf in rice. Planta 2009, 239, 803–816. [Google Scholar] [CrossRef] [PubMed]
  33. Chen, Q.L.; Xie, Q.J.; Gao, J.; Wang, W.Y.; Sun, B.; Liu, B.H.; Zhu, H.T.; Peng, H.F.; Zhao, H.B.; Liu, C.H.; et al. Characterization of Rolled and Erect Leaf 1 in regulating leave morphology in rice. J. Exp. Bot. 2015, 66, 6047–6058. [Google Scholar] [CrossRef] [PubMed]
  34. Yang, S.Q.; Li, W.Q.; Miao, H.; Gan, P.F.; Qiao, L.; Chang, Y.L.; Shi, C.H.; Chen, K.M. REL2, A Gene Encoding An Unknown Function Protein which Contains DUF630 and DUF632 Domains Controls Leaf Rolling in Rice. Rice 2016, 9, 37. [Google Scholar] [CrossRef] [PubMed]
  35. Fang, L.K.; Zhao, F.M.; Cong, Y.F.; Sang, X.C.; Du, Q.; Wang, D.Z.; Li, Y.F.; Ling, Y.H.; Yang, Z.L.; He, G.H. Rolling-leaf14 is a 2OG-Fe II, oxygenase family protein that modulates rice leaf rolling by affecting secondary cellwall formation in leaves. Plant Biotechnol. J. 2012, 10, 524–532. [Google Scholar] [CrossRef] [PubMed]
  36. Zou, L.P.; Sun, X.H.; Zhang, Z.G.; Liu, P.; Wu, J.X.; Tian, C.J.; Qiu, J.L.; Lu, T.G. Leaf Rolling Controlled by the Homeodomain Leucine Zipper Class IV Gene Roc5 in Rice. Plant Physiol. 2011, 156, 1589–1602. [Google Scholar] [CrossRef] [PubMed]
  37. Li, W.Q.; Zhang, M.J.; Gan, P.F.; Qiao, L.; Yang, S.Q.; Miao, H.; Wang, G.F.; Zhang, M.M.; Liu, W.T.; Li, H.F.; et al. CLD1/SRL1 modulates leaf rolling by affecting cell wall formation, epidermis integrity and water homeostasis in rice. Plant J. 2017, 92, 904–923. [Google Scholar] [CrossRef]
  38. Xiang, J.J.; Zhang, G.H.; Qian, Q.; Xue, H.W. Semi-rolled leaf1 encodes a putative glycosylphosphatidylinositol-anchored protein and modulates rice leaf rolling by regulating the formation of bulliform cells. Plant Physiol. 2012, 159, 1488–1500. [Google Scholar] [CrossRef]
  39. Alamin, M.; Zeng, D.D.; Qin, R.; Sultana, H.; Jin, X.L.; Shi, C.H. Characterization and fine mapping of SFL1, a gene controlling Screw Flag Leaf in Rice. Plant Mol. Biol. Rep. 2017, 35, 491–503. [Google Scholar] [CrossRef]
  40. Zhang, J.J.; Wu, S.Y.; Jiang, L.; Wang, J.L.; Zhang, X.; Guo, X.P.; Wu, C.Y.; Wan, J.M. A detailed analysis of the leaf rolling mutant sll2 reveals complex nature in regulation of bulliform cell development in rice (Oryza sativa L.). Plant Biol. 2015, 17, 437–448. [Google Scholar] [CrossRef]
  41. Dai, M.Q.; Zhao, Y.; Ma, Q.; Hu, Y.F.; Hedden, P.; Zhang, Q.F.; Zhou, D.X. The rice YABBY1 gene is involved in the feedback regulation of gibberellin metabolism. Plant Physiol. 2007, 144, 121–133. [Google Scholar] [CrossRef] [PubMed]
  42. Zhou, Y.; Wang, D.; Wu, T.; Yang, Y.; Liu, C.; Yan, L.; Tang, D.; Zhao, X.; Zhu, Y.; Lin, J.; et al. LRRK1, a receptor-like cytoplasmic kinase, regulates leaf rolling through modulating bulliform cell development in rice. Mol. Breed. 2018, 38, 48. [Google Scholar] [CrossRef]
  43. Ma, L.; Sang, X.C.; Zhang, T.; Yu, Z.Y.; Li, Y.F.; Zhao, F.M.; Wang, Z.W.; Wang, Y.T.; Yu, P.; Wang, N.; et al. ABNORMAL VASCULAR BUNDLES regulates cell proliferation and procambium cell establishment during aerial organ development in rice. New Phytol. 2017, 213, 275–286. [Google Scholar] [CrossRef] [PubMed]
  44. Ye, Y.F.; Wu, K.; Chen, J.F.; Liu, Q.; Wu, Y.J.; Liu, B.M.; Fu, X.D. OsSND2, a NAC family transcription factor, is involved in secondary cell wall biosynthesis through regulating MYBs expression in rice. Rice 2018, 11, 36. [Google Scholar] [CrossRef] [PubMed]
  45. Wu, R.H.; Li, S.B.; He, S.; Waßmann, F.; Yu, C.; Qin, G.; Schreiber, L.; Qu, L.J.; Gu, H. CFL1, a WW domain protein, regulates cuticle development by modulating the function of HDG1, a class IV homeodomain transcription factor, in rice and Arabidopsis. Plant Cell 2011, 23, 3392–3411. [Google Scholar] [CrossRef] [PubMed]
  46. Jing, W.; Cao, C.J.; Shen, L.K.; Zhang, H.S.; Jing, G.Q.; Zhang, W.H. Characterization and fine mapping of a rice leaf-rolling mutant deficient in commissural veins. Crop Sci. 2017, 57, 2595–2604. [Google Scholar] [CrossRef]
  47. Li, S.G.; He, P.; Wang, Y.P.; Li, H.Y.; Chen, Y.; Zhou, K.D.; Zhu, L.H. Genetic analysis and gene mapping of the leaf traits in rice Oryza sativa L. Acta Agron. Sin. 2000, 26, 261–265. [Google Scholar]
  48. Yan, J.Q.; Zhu, J.; He, C.X.; Benmoussa, M.; Wu, P. Molecular marker-assisted dissection of genotype × environment interaction for plant type traits in rice (Oryza sativa L.). Crop Sci. 1999, 39, 538–544. [Google Scholar] [CrossRef]
  49. Farooq, M.; Tagle, A.G.; Santos, R.E.; Ebron, L.A.; Fujita, D.; Kobayashi, N. Quantitative trait loci mapping for leaf length and leaf width in rice cv. IR64 derived lines. J. Integr. Plant Biol. 2010, 52, 578–584. [Google Scholar] [CrossRef]
  50. Li, Z.K.; Pinson, S.R.M.; Stansel, J.W.; Paterson, A. Genetic dissection of the source-sink relationship affecting fecundity and yield in rice (Oryza sativa L.). Mol. Breed. 1998, 4, 419–426. [Google Scholar] [CrossRef]
  51. Mei, H.W.; Luo, L.J.; Ying, C.S.; Wang, Y.P.; Yu, X.Q.; Guo, L.B.; Paterson, A.H.; Li, Z.K. Gene actions of QTLs affecting several agronomic traits resolved in a recombinant inbred rice population and two testcross populations. Theor. Appl. Genet. 2005, 110, 649–659. [Google Scholar] [CrossRef] [PubMed]
  52. Cui, K.H.; Peng, S.; Xing, Y.; Yu, S.; Xu, C.; Zhang, Q. Molecular dissection of the genetic relationships of source, sink and transport tissue with yield traits in rice. Theor. Appl. Genet. 2003, 106, 649–658. [Google Scholar] [CrossRef] [PubMed]
  53. Yue, B.; Xue, W.Y.; Luo, L.J.; Xing, Y.Z. QTL Analysis for flag leaf characteristics and their relationships with yield and yield traits in rice. Acta Agron. Sin. 2006, 33, 824–832. [Google Scholar] [CrossRef]
  54. Jiang, S.k.; Zhang, X.J.; Wang, J.Y.; Chen, W.F.; Xu, Z.J. Fine mapping of the quantitative trait locus qFLL9 controlling flag leaf length in rice. Euphytica 2010, 176, 341–347. [Google Scholar] [CrossRef]
  55. Wang, P.; Zhou, G.L.; Cui, K.H.; Li, Z.K.; Yu, S.B. Clustered QTL for source leaf size and yield traits in rice (Oryza sativa L.). Mol. Breed. 2012, 29, 99–113. [Google Scholar] [CrossRef]
  56. Wang, P.; Zhou, G.L.; Yu, H.H.; Yu, S.B. Fine mapping a major QTL for flag leaf size and yield-related traits in rice. Theor. Appl. Genet. 2011, 123, 1319–1330. [Google Scholar] [CrossRef]
  57. Ding, X.P.; Li, X.K.; Xiong, L.Z. Evaluation of near-isogenic lines for drought resistance QTL and fine mapping of a locus affecting flag leaf width, spikelet number, and root volume in rice. Theor. Appl. Genet. 2011, 123, 815–826. [Google Scholar] [CrossRef]
  58. Chen, M.L.; Luo, J.; Shao, G.N.; Wei, X.J.; Tang, S.Q.; Sheng, Z.H.; Song, J.; Hu, P.S. Fine mapping of a major QTL for flag leaf width in rice, qFLW4, which might be caused by alternative splicing of NAL1. Plant Cell Rep. 2012, 31, 863–872. [Google Scholar] [CrossRef]
  59. Fujita, D.; Trijatmiko, K.R.; Tagle, A.G.; Sapasap, M.V.; Koide, Y.; Sasaki, K.; Tsakirpaloglou, N.; Gannaban, R.B.; Nishimura, T.; Yanagihara, S.; et al. NAL1 allele from a rice landrace greatly increases yield in modern indica cultivars. Proc. Natl. Acad. Sci. USA 2013, 110, 20431–20436. [Google Scholar] [CrossRef]
  60. Hu, J.; Wang, Y.X.; Fang, Y.X.; Zeng, L.J.; Xu, J.; Yu, H.P.; Shi, Z.Y.; Pan, J.J.; Zhang, D.; Kang, S.J.; et al. A Rare allele of GS2 enhances grain size and grain yield in rice. Mol. Plant 2015, 8, 1455–1465. [Google Scholar] [CrossRef]
  61. Duan, P.; Ni, S.; Wang, J.M.; Zhang, B.L.; Xu, R.; Wang, Y.X.; Chen, H.Q.; Zhu, X.D.; Li, Y.H. Regulation of OsGRF4 by OsmiR396 controls grainsize and yield in rice. Nat. Plants 2015, 2, 15203. [Google Scholar] [CrossRef] [PubMed]
  62. Quarrie, S.A.; Pekic, S.; Radosevic, Q.; Rancic, R.D.; Kaminska, A.; Barnes, J.D.; Leverington, M.; Ceoloni, C.; Dodig, D. Dissecting a wheat QTL for yield present in a range of environments: From the QTL to candidate genes. J. Exp. Bot. 2006, 57, 2627–2637. [Google Scholar] [CrossRef] [PubMed]
  63. Huang, X.Z.; Qian, Q.; Liu, Z.B.; Sun, H.Y.; He, S.Y.; Luo, D.; Xia, G.M.; Chu, C.C.; Li, J.Y.; Fu, X.D. Natural variation at the DEP1 locus enhances grain yield in rice. Nat. Genet. 2009, 41, 494–497. [Google Scholar] [CrossRef] [PubMed]
  64. Wang, J.Y.; Nakazaki, T.; Chen, S.Q.; Chen, W.F.; Saito, H.; Tsukiyama, T.; Okumoto, Y.; Xu, Z.J.; Tanisaka, T. Identification and characterization of the erect-pose panicle gene EP conferring high grain yield in rice (Oryza sativa L.). Theor. Appl. Genet. 2009, 119, 85–91. [Google Scholar] [CrossRef] [PubMed]
  65. Zhou, Y.; Zhu, J.Y.; Li, Z.Y.; Yi, C.D.; Liu, J.; Zhang, H.G.; Tang, S.Z.; Gu, M.H.; Liang, G.H. Deletion in a quantitative trait gene qpe9-1 associated with panicle erectness improves plant architecture during rice domestication. Genetics 2009, 183, 315–324. [Google Scholar] [CrossRef] [PubMed]
  66. Mao, S.; Lu, G.H.; Yu, K.H.; Bo, Z.; Chen, J.H. Specific protein detection using thermally reduced graphene oxide sheet decorated with gold nanoparticle-antibody conjugates. Adv. Mater 2010, 22, 3521–3526. [Google Scholar] [CrossRef] [PubMed]
  67. Kosugi, S.; Suzuka, I.; Ohashi, Y. Two of three promoter elements identified in a rice gene for proliferating cell nuclear antigen are essential for meristematic tissue-specific expression. Plant J. 1995, 7, 877–886. [Google Scholar] [CrossRef] [Green Version]
  68. Zhao, M.Z.; Sun, J.; Xiao, Z.Q.; Cheng, F.; Xu, H.; Tang, L.; Chen, W.F.; Xu, Z.J.; Xu, Q. Variations in DENSE AND ERECT PANICLE 1 (DEP1) contribute to the diversity of the panicle trait in high-yielding japonica rice varieties in northern China. Breed. Sci. 2016, 66, 599–605. [Google Scholar] [CrossRef]
  69. Narita, N.N.; Moore, S.; Horiguchi, G.; Kubo, M.; Demura, T.; Fukuda, H.; Goodrich, J.; Tsukaya, H. Overexpression of a novel small peptide ROTUNDIFOLIA4 decreases cell proliferation and alters leaf shape in Arabidopsis thaliana. Plant J. 2004, 38, 399–713. [Google Scholar] [CrossRef]
  70. Tsuge, T.; Tsukaya, H.; Uchimiya, H. Two independent and polarized processes of cell elongation regulate leaf blade expansion in Arabidopsis thaliana (L.) Heynh. Development 1996, 122, 1589–1600. [Google Scholar]
  71. Xu, J.; Wang, L.; Wang, Y.X.; Zeng, D.L.; Zhou, M.Y.; Fu, X.; Ye, W.J.; Hu, J.; Zhu, L.; Ren, D.Y.; et al. Reduction of OsFLW7 expression enhanced leaf area and grain production in rice. Sci. Bull. 2017, 62, 1631–1633. [Google Scholar] [CrossRef]
  72. Snyder, M.; He, W.; Zhang, J.J. The DNA replication factor MCM5 is essential for stat1-mediated transcriptional activation. Proc. Natl. Acad. Sci. USA 2005, 102, 14539–14544. [Google Scholar] [CrossRef] [PubMed]
  73. Imai, K.K.; Ohashi, Y.H.; Tsuge, T.; Yoshizumi, T.; Matsui, M.; Oka, A.; Aoyama, T. The a-type cyclin CYCA2;3 is a key regulator of ploidy levels in Arabidopsis endoreduplication. Plant Cell 2006, 18, 382–396. [Google Scholar] [CrossRef] [PubMed]
  74. Boudolf, V.; Lammens, T.; Boruc, J.; Leene, J.V.; Daele, H.V.D.; Maes, S.; Isterdael, G.V.; Russinova, E.; Kondorosi, E.; Witters, E.; et al. CDKB1;1 Forms a functional complex with CYCA2;3 to suppress endocycle onset. Plant Physiol. 2009, 150, 1482–1493. [Google Scholar] [CrossRef] [PubMed]
  75. Zhou, M.Y.; Song, X.W.; Xu, J.; Fu, X.; Li, T.; Zhu, Y.C.; Xiao, X.Y.; Mao, Y.J.; Zeng, D.L.; Hu, J.; et al. Construction of genetic map and mapping and verification of grain traits QTLs using recombinant inbred lines derived from a cross between indica C84 and japonica CJ16B. Chin. J. Rice Sci. 2018, 32, 207–218. [Google Scholar]
  76. Shen, L.; Hua, Y.F.; Fu, Y.P.; Li, J.; Liu, Q.; Jiao, X.Z.; Xin, G.W.; Wang, J.J.; Wang, X.C.; Yan, C.J.; et al. Rapid generation of genetic diversity by multiplex CRISPR/Cas9 genome editing in rice. Sci. China Life Sci. 2017, 60, 506–515. [Google Scholar] [CrossRef] [PubMed]
  77. Ma, X.L.; Zhang, Q.Y.; Zhu, Q.L.; Liu, W.; Chen, Y.; Qiu, R.; Wang, B.; Yang, Z.F.; Li, H.Y.; Lin, Y.R.; et al. A robust CRISPR/Cas9 system for convenient, high-efficiency multiplex genome editing in monocot and dicot plants. Mol. Plant 2015, 8, 1274–1284. [Google Scholar] [CrossRef]
  78. Hellens, R.P.; Allan, A.C.; Friel, E.N.; Bolitho, K.; Grafton, K.; Templeton, M.D.; Karunairetnam, S.; Gleave, A.P.; Laing, W.A. Transient expression vectors for functional genomics, quantification of promoter activity and RNA silencing in plants. Plant Methods 2005, 1, 13. [Google Scholar] [CrossRef]
  79. You, M.K.; Lim, S.H.; Kim, M.J.; Jeong, Y.S.; Lee, M.G.; Ha, S.H. Improvement of the fluorescence intensity during a flow cytometric analysis for rice protoplasts by localization of a green fluorescent protein into chloroplasts. Int. J. Mol. Sci. 2015, 16, 788–804. [Google Scholar] [CrossRef]
  80. Ishimaru, K.; Shirota, K.; Higa, M.; Kawamitsu, Y. Identification of quantitative trait loci for adaxial and abaxial stomatal frequencies in Oryza sativa. Plant Physiol. Biochem. 2001, 39, 173–177. [Google Scholar] [CrossRef]
Figure 1. The leaf shape of parents of recombinant inbred lines (RILs). (a) Plant morphology at tillering stage; bar = 18 cm. (b) Plant morphology at heading stage; bar = 18 cm. (c) The top three leaves’ shape of CJ16 and C84. From left to right are the first leaf, the second leaf, and the third leaf, respectively; bar = 5 cm. (d) Comparison of the top three leaves’ length between CJ16 and C84. (e) Comparison of the top three leaves’ width between CJ16 and C84. (f) Comparison of the top three leaves’ area between CJ16 and C84. Data are represented as mean ± SD (n = 11). Asterisks represent significant difference determined by Student’s t-test at p-value <0.01 (**), p-value <0.05 (*).
Ijms 20 00866 g001
Figure 2. Frequency distributions of leaf traits in CJ16/C84 RILs. (a) Flag leaf length; (b) the second leaf length from top; (c) the third leaf length from top; (d) flag leaf width; (e) the second leaf width from top; (f) the third leaf width from top. HZ: Hangzhou; HN: Hainan.
Ijms 20 00866 g002
Figure 3. Locations of quantitative trait loci (QTLs) for leaf traits in the genetic map. FLL: flag leaf length; FLW: flag leaf width; SLL: the second leaf length; SLW: the second leaf width; TLL: the third leaf length; TLW: the third leaf width.
Ijms 20 00866 g003
Figure 4. Map-based cloning of qLL9 and expression analysis of candidate genes. (a) High-resolution mapping of qLL9. Numbers on the map indicate the physical distance on chromosome 9. Nine recombinant plants were used to refine the candidate region to 16.17 kb region by substitution mapping, in which green and pink rectangles indicate the homozygous CJ16 genotype and homozygous C84 genotype, respectively. Flag leaf length (FLL) values were obtained from the corresponding selfed progenies and represented as mean ± SD (n = 12). (b) Predicted open reading frames and sequence difference of the qLL9 between CJ16 and C84 are shown. Relative expression of three candidate genes LOC_09g26970, LOC_09g26980, and LOC_09g26999 of near isogenic line (NIL)-qLL9CJ16 and NIL-qLL9C84 at tillering stage (c) and heading stage (d) by quantitative real-time polymerase chain reaction (qRT-PCR). Data are mean ± SD (n = 3). Asterisks represent significant difference determined by Student’s t-test at p-value < 0.01 (**).
Ijms 20 00866 g004
Figure 5. Phenotypes of near-isogenic lines and chromosome segment substitution lines. (a) Plant morphology at tillering stage; bar = 18 cm. (b) Plant morphology at heading stage; bar = 18 cm. (c) The top three leaf shape of NIL-qLL9CJ16 and NIL-qLL9C84. From left to right are the first leaf, the second leaf, and the third leaf, respectively; bar = 5 cm. Comparison between the NIL-qLL9CJ16 and NIL-qLL9C84 for the flag leaf length (d), the flag leaf width (e), and the flag leaf area (f). Comparison between Wuyunjing (WYJ) 7 and chromosome segment substitution line (CSSL)-qLL9KASA for the flag leaf length (g), the flag leaf width (h), and the flag leaf area (i). Data are mean ± SD (n = 15). Asterisks represent significant difference determined by Student’s t-test at p-value < 0.01 (**).
Ijms 20 00866 g005
Figure 6. Histological cell morphology of NIL-qLL9CJ16 and NIL-qLL9C84. (a,b) Comparison of cytological morphological characteristics in the orange boxes between the two genotypes of the NIL set; bar = 200 μm. (c) Number of longitudinal cells in NIL-qLL9CJ16 and NIL-qLL9C84. Data are mean ± SD (n = 15) and no significant difference was found.
Ijms 20 00866 g006
Figure 7. CRISPR/Cas9 vector construction. (a) Primer sequence on LOC_Os09g26999. (b) The intermediate vector SK-gRNA contains the U3 promotor and sgRNA scaffold. (c) Binary vector pC1300-Cas9 contains the 2 × 35S promotor and a Cas9 protein. SK-gRNA-Os09g26999 are digested with Kpn I and Bgl II, respectively, and cloned into pC1300-Cas9 (digested with Kpn I and BamH I) by a one-step ligation.
Ijms 20 00866 g007
Figure 8. Sequence of target loci in CRISPR/Cas9 transgenic plants and phenotypic comparison between the knockout and wild-type (WT) plants. (a) Sequence variation of target loci in two transgenic plants. (b) Flag leaf variation; bar = 5 cm. Difference in (c) flag leaf length (cm), (d) flag leaf width (cm), and (e) flag leaf area. WT, Nipponbare; MT-1, Mutant 1; MT-2, Mutant 2. Data are represented as mean ± SD (n = 15). Asterisks represent significant difference determined by Student’s t-test at p-value <0.01 (**).
Ijms 20 00866 g008
Figure 9. Comparison of the promoter activity of LOC_Os09g26999 between CJ16 and C84. (a) Diagram of carrier construction. (b) Ratio of promoter activity. Data are represented as mean ± SD (n = 3). Asterisks represent significant difference determined by Student’s t-test at p-value <0.01 (**).
Ijms 20 00866 g009
Figure 10. Panicle and grain morphology of NIL-qLL9CJ16 and NIL-qLL9C84. (a,b) Panicle morphology at heading stage; bars = 4 cm. (c,d) Grain morphology at repining stage; bar = 1 cm. (e) Grain length. (f) Grain width and thickness. Data are represented as mean ± SD (n = 10). Asterisks represent significant difference determined by Student’s t-test at p-value <0.01 (**), p-value <0.05 (*).
Ijms 20 00866 g010
Figure 11. Comparison of eight cell cycle related gene expression between NIL-qLL9CJ16 and NIL-qLL9C84 at the heading stage by qRT-PCR, and the data are represented as mean ± SD (n = 3); asterisks represent significant difference determined by Student’s t-test at p-value <0.01(**), p-value <0.05 (*).
Ijms 20 00866 g011
Table 1. Correlation analysis on leaf traits in recombinant inbred lines (RILs) derived from the cross of CJ16 and C84.
HZHN
FLLFLWSLLSLWTLLTLWFLLFLWSLLSLWTLL
HZ-FLL
HZ-FLW−0.078
HZ-SLL0.833 **−0.013
HZ-SLW−0.178 *0.627 **−0.072
HZ-TLL0.525 **0.000 0.746 **−0.023
HZ-TLW−0.203 **0.597 **−0.073 0.699 **0.086
HN-FLL0.341 **−0.317 **0.271 **−0.202 *0.336 **−0.252 **
HN-FLW−0.250 **0.389 **−0.298 **0.382 **−0.287 **0.246 **0.076
HN-SLL0.225 **−0.268 **0.135 −0.137 0.195 *−0.226 **0.873 **0.229 **
HN-SLW−0.418 **0.390 **−0.510 **0.441 **−0.395 **0.361 **−0.0210.754 **0.160
HN-TLL0.000 −0.182 *-0.098 −0.087 0.007 −0.132 0.642 **0.254 **0.813 **0.313 **
HN-TLW−0.405 **0.246 **−0.477 **0.337 **−0.355 **0.300 **0.0880.624 **0.206 *0.760 **0.358 **
FLL: flag leaf length; FLW: flag leaf width; SLL: the second leaf length; SLW: the second leaf width; TLL: the third leaf length; TLW: the third leaf width. Data are represented as mean ± SD (n = 3). Asterisks represent significant difference determined by Student’s t-test at p-value < 0.01 (**), p-value < 0.05 (*).
Table 2. Locations of quantitative trait loci (QTLs) for leaf traits in the RIL population.
TraitQTLIntervalPeak PositionAdditive EffectExplained Phenotypic
Variance (%)
Marker 1Marker 2HZHNHZHNHZHN
FLLqFLL9RM3700B9-1161.156.87−7.1707−6.868232.4130.63
qFLL10RM1375H10-3 20.09 3.3926 5.09
FLWqFLW3H3-11H3-12 152.3 0.0648 6.6
qFLW6RM3496H6-3 27.14 −0.0839 16.07
SLLqSLL2-12-30.2-a2-42.1-a36.2 −2.8643 8.98
qSLL2-2H2-12-30.2-a 23.9 −1.3914 5.29
qSLL6wgw1RM318359.460.13.5234−4.284214.9717.29
qSLL9RM3700B9-1160.157.6−6.4659−6.543129.6220.85
qSLL9-2H9-3H9-4 12.18 −0.7557 8.8
qSLL10RM1375H10-3 27.11 3.9058 5.91
SLWqSLW1RM1247H1-1 24.2 −0.0759 10.69
qSLW6wgw1RM3183 59.35 −0.0727 10.31
qSLW9RM3700B9-11 59.2 0.0839 18.39
qSLW11H11-9H11-10 71.4 −0.0329 1.85
TLLqTLL2H2-12-30.2-a13.019.44−3.6555−0.993513.108.99
qTLL5RM430RM1875170.3 −2.5759 8.43
qTLL6wgw1RM318335.2 −4.8389 15.65
qTLL9RM3700B9-1159.161.2−6.0826−4.832621.8719.19
qTLL10RM5689RM137528.6 2.3523 7.76
TLWqTLW1H1-1RM8111 22.41 −0.0669 10.79
qTLW6wgw1RM3183 59.35 −0.0684 13.84
qTLW9RM3700B9-11 61.31 0.0834 16.28
Table 3. Primers for QTL fine mapping, quantitative real-time polymerase chain reaction (qRT-PCR), vector construction, and gene editing.
PrimerForward (5′-3′)Reverse (5′-3′)Experiment
RM3700AAATGCCCCATGCACAACTTGTCAGATTGTCACCAGGGFine mapping
C9-1594CCTGTACACTGTAGGCCTGTGGTGTCAAAGTACATAGGCCC
C9-1635GGTGGAAAGGAAGGAGAGCTCTAGCCCTGCCTCGTTGTAA
C9-1638GTGTGTGTGTGTGTGTGTGTTCATAGTACATGCCCTCCGT
C9-1640ATAAGTCCATATTGCCCACCTCAAGCTTCTGGATCGTTAACAGG
C9-1642GTACCCTCCTCCGATGACACTTGTGGAGGACGAGAAGGTG
C9-1715GGTGGCGAGAAGAATTTGCATTTCGCCTCTCACTGACCTT
B9-11TCTTACGAATAGGCCCTTGGAGAGCCCACAACACTTGTGC
ActinATCCATCTTGGCATCTCTCAGCCACAATGGATGGGCCAGACTqRT-PCR
LOC_Os09g26960CTGAGCCTCGCCAATCTGCGAAGATCTCCTCCATGCTC
LOC_Os09g26970CAAACATCTGGGCTTGGTCTTCTAAGCAACCTGCCCAATC
LOC_Os09g26980ATTGATGTGAAAGGGCAAGACTCACCTTAAGCCCAAGGTTGTAG
LOC_Os09g26999GTAGCTGCAAGCCAAGCTGTTGAAGCAGCTGGAGCAAC
POs26999GGCCAGTGCCAAGCTTAAGGGAAGTTGGCCGCCTGCCAGGGTCTTGCAGATCTCTCCACACGCAGCACGCCAACVector construction
Os09g26999-g++/g--GGCAGGTGGTGATGGAGGCGCCGAAACCGGCGCCTCCATCACCACC
Os09g26999-JCCGGCGATTTATACCCACCACCGCTCACCTTGAGGAACGTDetection of target mutations
Hyg-F1GCTGTTATGCGGCCATTGTCGACGTCTGTCGAGAAGTTTC
Cas9-F2/pC1300-R2ACCAGACACGAGACGACTAAATCGGTGCGGGCCTCTTC
T3ATCGGTGCGGGCCTCTTC
Table 4. Annotated genes included in the 16.17kb region for qLL9.
Gene IDAnnotation from the Rice Genome Annotation Project
LOC_Os09g26970Retrotransposon protein, Putative, Unclassified, Expressed
LOC_Os09g26980Cytochrome P450, Putative, Expressed
LOC_Os09g26999Gγ subunit; Dense and Erect Panicle1; DENSE PANICLE 1
Table 5. The position of SNP and amino acid variation for the three candidate genes.
Locus NamePosition on chr.9Position on geneCJ16C84CJ16C84
LOC_Os09g2697016393266397GCValLeu
LOC_Os09g2697016393717848TCValAla
LOC_Os09g26970163959233054TCValAla
LOC_Os09g26980164038504146GAAlaVal
LOC_Os09g26980164040943902TCMetCys
LOC_Os09g26999164147353182AGTyrCys
Table 6. The position of nine SNPs in the promoter of LOC_Os09g26999.
Position CJ16C84
−1341AC
−1255GC
−951CG
−906TG
−629GT
−503AC
−493GC
−486TG
−31TGT
Table 7. Yield traits of NIL-qLL9CJ16 and NIL-qLL9C84.
TraitNIL-qLL9CJ16NIL-qLL9C84
Panicle length (cm)20.44 ± 0.8426.7 ± 0.83 **
Panicles per plant9.25 ± 1.429.42 ± 1.26
Number of primary branches22.11 ± 2.1821.4 ± 2.42
Number of secondry branches80.00 ± 15.5177.60 ± 7.84
Grains per panicle404.11 ± 71.70355.17 ± 34.09
1000-grain weight (g)20.79 ± 0.7422.99 ± 0.45 **
Seed setting rate (%)75.80 ± 0.0269.71 ± 0.02 **
Yield per plant (g)27.93 ± 4.4132.56 ± 8.19
Actual yield per plot (kg/48 m2)31.52 ± 3.2036.28 ± 3.27 *
Actual yield change (%)15.08
Data are represented as mean ± SD. Asterisks represent significant difference determined by Student’s t-test at p-value <0.01(**), p-value <0.05 (*).

