Defenses Against ROS in Crops and Weeds: The Effects of Interference and Herbicides

 , ,
, , 
Abstract
:1. Introduction
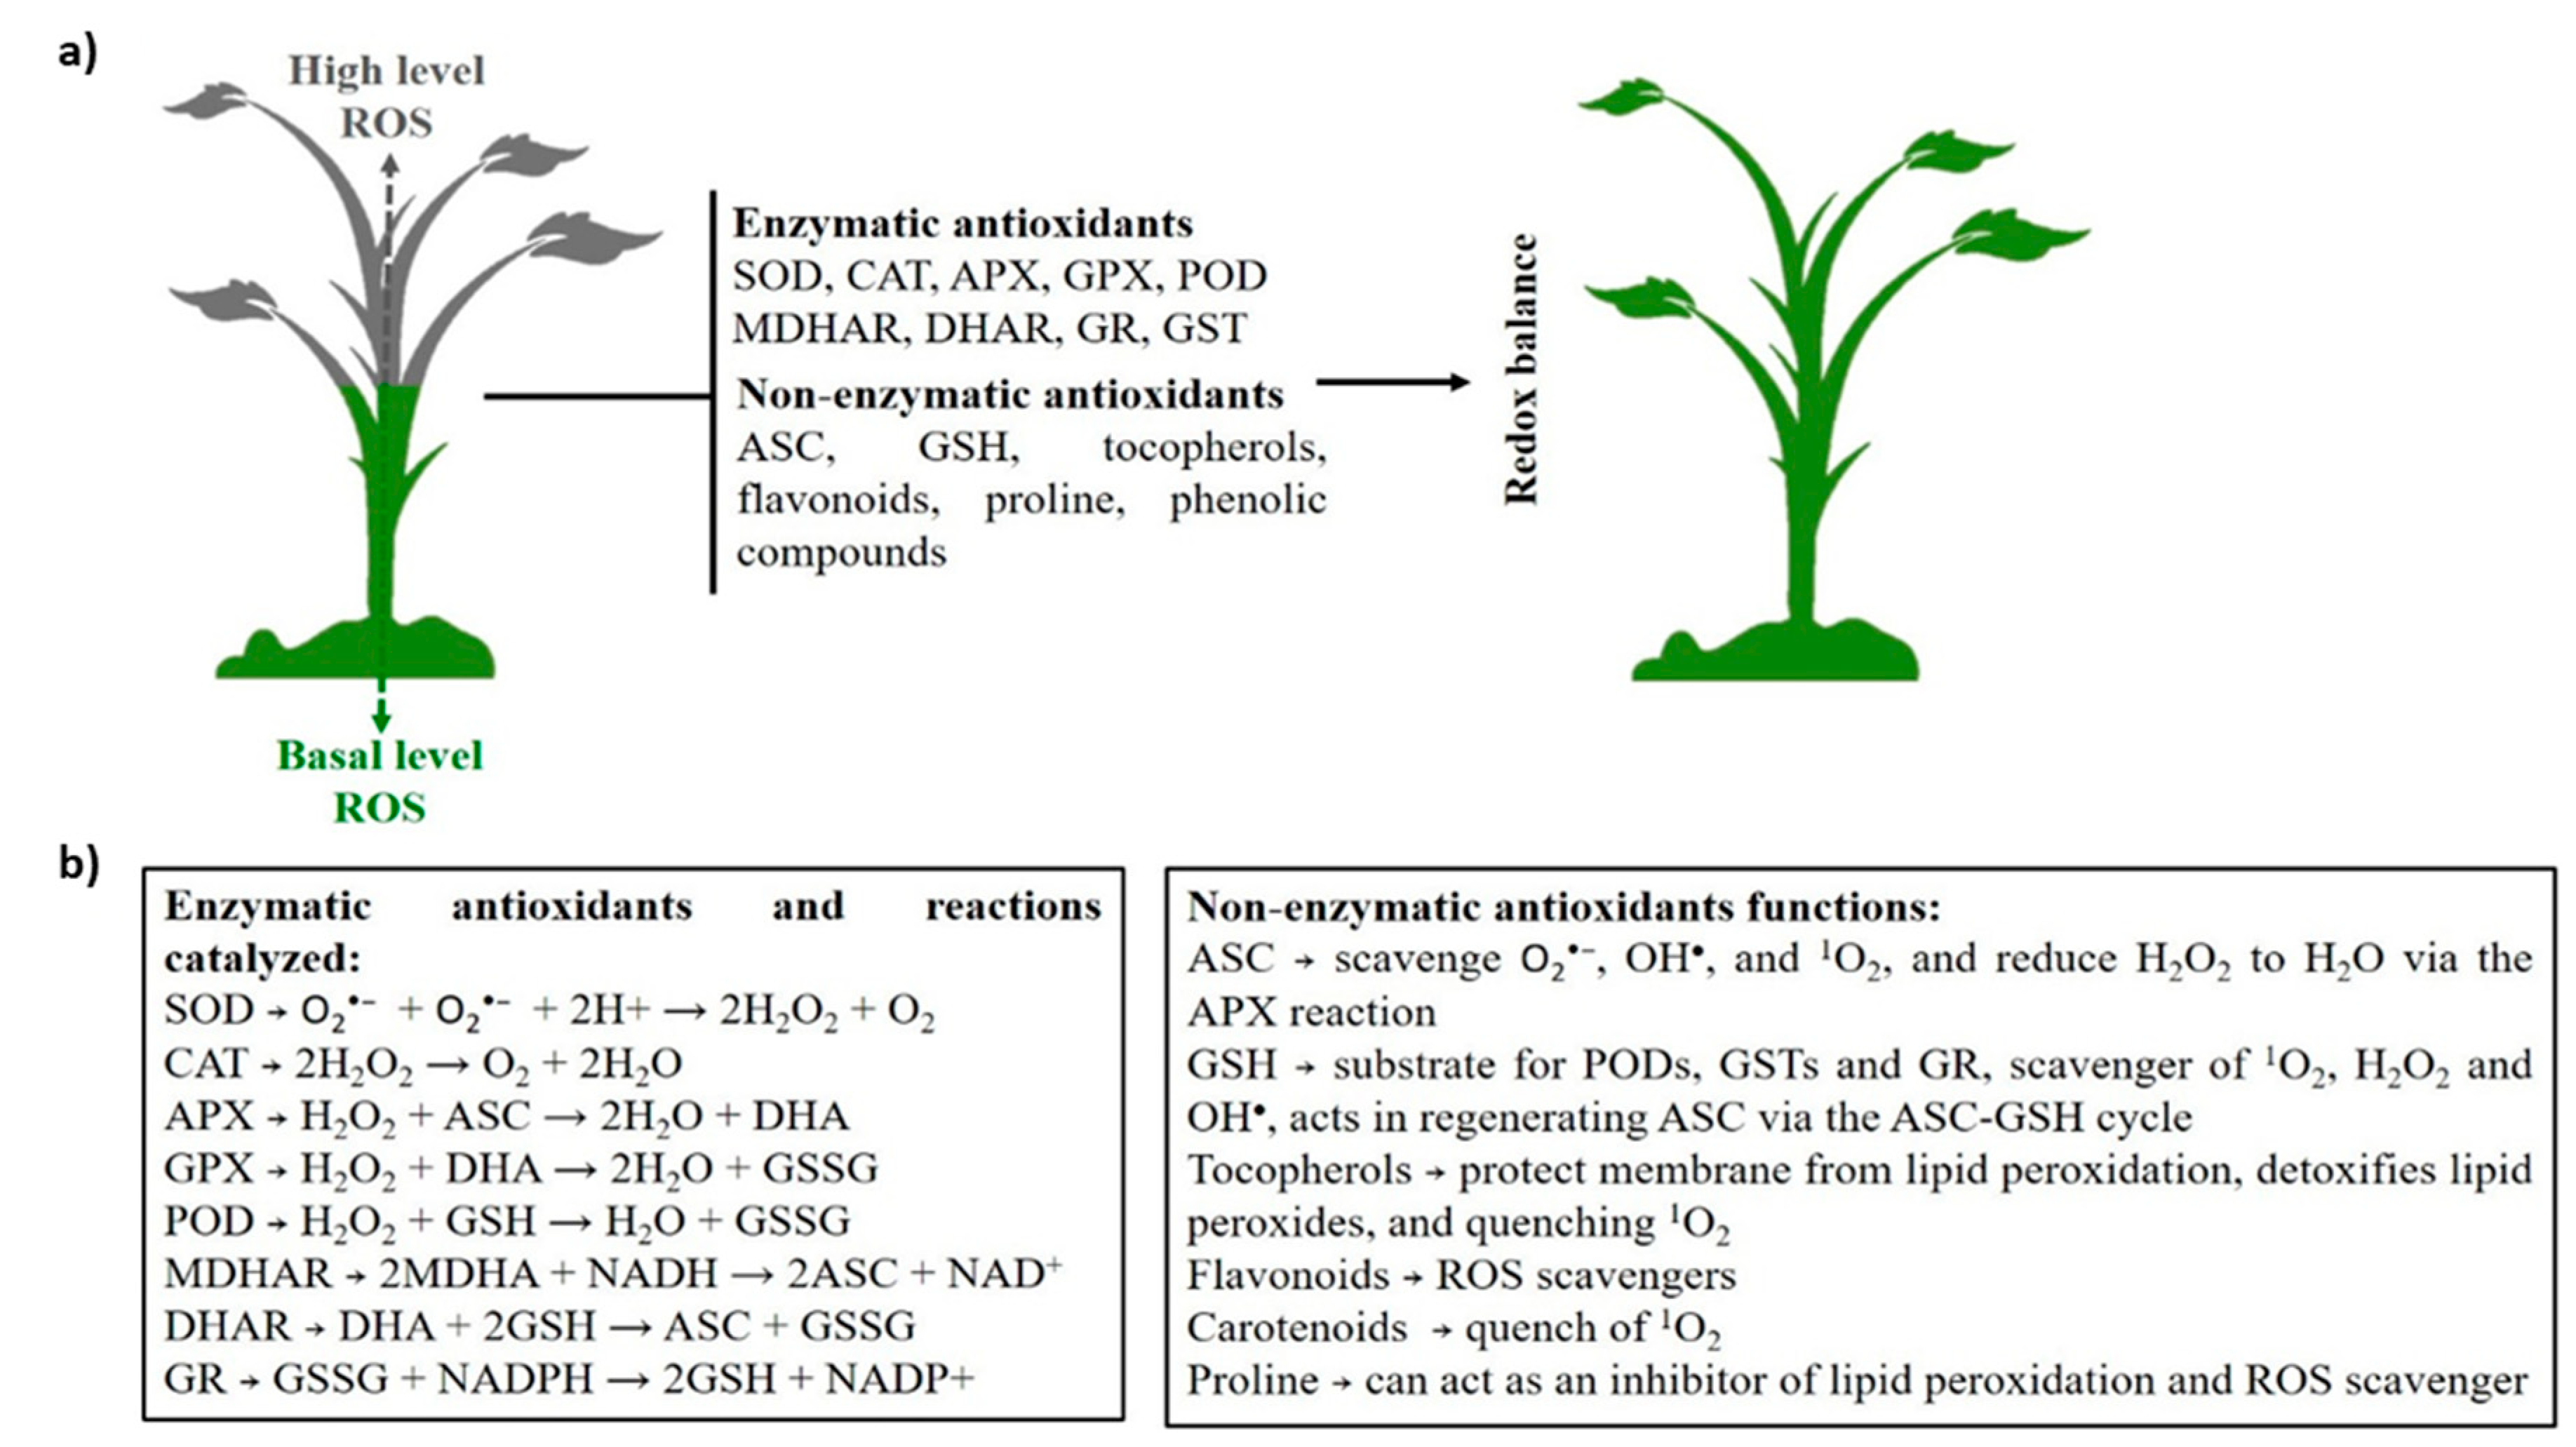
2. The Basis of ROS Production and Plant Mechanisms of Defense
3. Modulation of Enzymes and Antioxidant Genes Induced by Weed Interference and Herbicide Exposure
3.1. Crop and Weed Interference
3.2. Herbicide Treatment
4. Coevolution of Herbicide Resistance and Antioxidant Systems
5. Transcriptomic/Proteomic Approaches Helping to Clarify the Antioxidant Response to Herbicides in Plants
6. Concluding Remarks
Funding
Acknowledgments
Conflicts of Interest
Abbreviations
| 1O2 | singlet oxygen |
| O2•− | superoxide radical |
| H2O2 | hydrogen peroxide |
| OH• | hydroxyl radical |
| SOD | superoxide dismutase |
| CAT | catalase |
| APX | ascorbate peroxidase |
| GPX | glutathione peroxidase |
| POD | peroxidase |
| PRX | peroxiredoxin |
| MDHAR DHAR | monodehydroascorbate reductase dehydroascorbate reductase |
| GR | glutathione reductase |
| GST | glutathione-S-transferase |
| ASC | ascorbic acid |
| GSH | glutathione |
| Trx | thioredoxin |
References
- Pan, D.; Li, Q.X.; Lin, Z.; Chen, C.; Tang, W.; Pan, C.; Tan, H.; Zeng, D. Interactions between salicylic acid and antioxidant enzymes tilting the balance of H2O2 from photorespiration in non-target crops under halosulfuron-methyl stress. Pestic. Biochem. Physiol. 2017, 143, 214–223. [Google Scholar] [CrossRef] [PubMed]
- Gill, S.S.; Tuteja, N. Reactive oxygen species and antioxidant machinery in abiotic stresses tolerance in crop plants. Plant Physiol. Biochem. 2010, 48, 909–930. [Google Scholar] [CrossRef] [PubMed]
- Mittler, R. ROS are good. Trends Plant Sci. 2017, 22, 11–19. [Google Scholar] [CrossRef] [PubMed]
- Czarnocka, W.; Karpiński, S. Friend or foe? Reactive oxygen species production, scavenging and signaling in plant response to environmental stresses. Free Radic. Biol. Med. 2018, 122, 4–20. [Google Scholar] [CrossRef] [PubMed]
- Jiang, L.; Yang, H. Prometryne-induced oxidative stress and impact on antioxidant enzymes in wheat. Ecotoxicol. Environ. Saf. 2009, 72, 1687–1693. [Google Scholar] [CrossRef] [PubMed]
- Jiang, L.; Ma, L.; Sui, Y.; Han, S.Q.; Wu, Z.Y.; Feng, Y.X.; Yang, H. Effect of manure compost on the herbicide prometryne bioavailability to wheat plants. J. Hazard. Mater. 2010, 184, 337–344. [Google Scholar] [CrossRef] [PubMed]
- Afifi, M.; Swanton, C. Early physiological mechanisms of weed competition. Weed Sci. 2012, 60, 542–551. [Google Scholar] [CrossRef]
- An, J.; Shen, X.; Ma, Q.; Yang, C.; Liu, S.; Chen, Y. Transcriptome profiling to discover putative genes associated with paraquat resistance in goosegrass (Eleusine indica L.). PLoS ONE 2014, 9, e99940. [Google Scholar] [CrossRef] [PubMed]
- Maroli, A.S.; Nandula, V.; Dayan, F.E.; Duke, E.; Gerard, P.; Tharayil, N. Metabolic profiling and enzyme analyses indicate a potential role of antioxidant systems in complementing glyphosate resistance in an Amaranthus palmeri biotype. J. Agric. Food Chem. 2015, 63, 9199–9209. [Google Scholar] [CrossRef] [PubMed]
- Darmanti, S.; Santosa, L.H.; Dewi, K.; Nugroho, L.H. Antioxidative defenses of soybean [Glycine max (L.) Merr. cv. Grobogan] against purple nutsedge (Cyperus rotundus L.) interference during drought stress. J. Anim. Plant Sci. 2016, 26, 225–232. [Google Scholar]
- Agostinetto, D.; Tarouco, C.P.; Nohatto, M.A.; Oliveira, C.; Fraga, D.S. Metabolic activity of wheat and ryegrass plants in competition. Planta Daninha 2017, 35, e017155463. [Google Scholar] [CrossRef]
- Keith, B.K.; Burns, E.E.; Bothner, B.; Carey, C.C.; Mazurie, A.J.; Hilmer, J.K.; Biyiklioglu, S.; Budak, H.; Dyer, W.E. Intensive herbicide use has selected for constitutively elevated levels of stress-responsive mRNAs and proteins in multiple herbicide-resistant Avena fatua L. Pest. Manag. Sci. 2017, 73, 2267–2281. [Google Scholar] [CrossRef] [PubMed]
- Piasecki, C.; Rizzardi, M.A.; Schons, J.; Caverzan, A.; Chavarria, G. Does the interference of GR® volunteer corn alter stress metabolism on soybean? Planta Daninha 2018, 36, e018171955. [Google Scholar] [CrossRef]
- Piasecki, C.; Rizzardi, M.A.; Schons, J.; Caverzan, A.; Oliveira, C. Interference of volunteer corn on stress metabolism and yield of dry bean. Planta Daninha 2018, 36, e018176669. [Google Scholar] [CrossRef]
- Harre, N.T.; Nie, H.; Jiang, Y.; Young, B.G. Differential antioxidant enzyme activity in rapid-response glyphosate-resistant Ambrosia trifida. Pest. Manag. Sci. 2018, 74, 2125–2132. [Google Scholar] [CrossRef] [PubMed]
- Ahsan, N.; Lee, D.G.; Lee, K.W.; Alam, I.; Lee, S.H.; Bahk, J.D.; Lee, B.H. Glyphosate-induced oxidative stress in rice leaves revealed by proteomic approach. Plant Physiol. Biochem. 2008, 46, 1062–1070. [Google Scholar] [CrossRef] [PubMed]
- Agostinetto, D.; Oliveira, C.; Langaro, A.C.; Nohatto, M.A.; Manica-Berto, R. Change in physiological features in ryegrass biotypes in competition with soybean due resistance to glyphosate. Planta Daninha 2016, 34, 517–526. [Google Scholar] [CrossRef]
- Zhang, J.J.; Lu, Y.C.; Zhang, J.J.; Tan, L.R.; Yang, H. Accumulation and toxicological response of atrazine in rice crops. Ecotoxicol. Environ. Saf. 2014, 102, 105–112. [Google Scholar] [CrossRef] [PubMed]
- Song, N.H.; Yin, X.L.; Chen, G.F.; Yang, H. Biological responses of wheat (Triticum aestivum) plants to the herbicide chlorotoluron in soils. Chemosphere 2007, 68, 1779–1787. [Google Scholar] [CrossRef] [PubMed]
- Boulahia, K.; Carol, P.; Planchais, S.; Abrous-Belbachir, O. Phaseolus vulgaris L. seedlings exposed to prometryn herbicide contaminated soil trigger an oxidative stress response. J. Agric. Food Chem. 2016, 64, 3150–3160. [Google Scholar] [CrossRef] [PubMed]
- Neve, P.; Vila-Aiub, M.; Roux, F. Evolutionary-thinking in agricultural weed management. New Phytol. 2009, 184, 783–793. [Google Scholar] [CrossRef] [PubMed]
- Mittler, R. Oxidative stress, antioxidants and stress tolerance. Trends Plant Sci. 2002, 7, 405–410. [Google Scholar] [CrossRef]
- Suzuki, N.; Koussevitzky, S.; Mittler, R.; Miller, G. ROS and redox signaling in the response of plants to abiotic stress. Plant Cell Environ. 2012, 35, 259–270. [Google Scholar] [CrossRef] [PubMed]
- Das, K.; Roychoudhury, A. Reactive oxygen species (ROS) and response of antioxidants as ROS-scavengers during environmental stress in plants. Front. Plant Sci. 2014, 2, 1–13. [Google Scholar] [CrossRef]
- Scandalios, J.G. The rise of ROS. Trends Biochem. Sci. 2002, 27, 483–486. [Google Scholar] [CrossRef]
- Caverzan, A.; Casassola, A.; Brammer, S.P. Reactive oxygen species and antioxidant enzymes involved in plant tolerance to stress. In Abiotic and Biotic Stress in Plants-Recent Advances and Future Perspectives; InTech: Rijeka, Croatia, 2016; pp. 463–480. [Google Scholar]
- Foyer, C.H.; Noctor, G. Redox homeostasis and antioxidant signaling: A metabolic interface between stress perception and physiological responses. Plant Cell 2005, 17, 1866–1875. [Google Scholar] [CrossRef] [PubMed]
- Anjum, N.A.; Gill, S.S.; Gill, R.; Hasanuzzaman, M.; Duarte, A.C.; Pereira, E.; Ahmad, I.; Tuteja, R.; Tuteja, N. Metal/metalloid stress tolerance in plants: Role of ascorbate, its redox couple, and associated enzymes. Protoplasma 2014, 251, 1265–1283. [Google Scholar] [CrossRef] [PubMed]
- Kumar, S.; Trivedi, P.K. Glutathione S-Transferases: Role in Combating Abiotic Stresses Including Arsenic Detoxification in Plants. Front. Plant Sci. 2018, 7, 751. [Google Scholar] [CrossRef] [PubMed]
- Ramos, L.R.M.; Pitelli, R.A. Effects of different weed control periods on the productivity of corn crop. Pesq. Agropecu. Bras. 1998, 29, 1523–1531. [Google Scholar]
- Radosevich, S.R.; Holt, J.S.; Ghersa, C.M. Ecology of Weeds and Invasive Plants: Relationship to Agriculture and Natural Resource Management, 3rd ed.; John Wiley & Sons: Hoboken, NJ, USA, 2007. [Google Scholar]
- Barroso, A.A.M.; Yamauti, M.S.; Alves, P.L.C.A. Interference between weed species and two bean cultivars in two times of sowing. Bragantia 2010, 69, 609–616. [Google Scholar] [CrossRef]
- Gal, J.; Afifi, M.; Lee, E.; Lukens, L.; Swanton, C.J. Detection of neighboring weeds alters soybean seedling roots and nodulation. Weed Sci. 2015, 63, 888–900. [Google Scholar] [CrossRef]
- Ulguim, A.R.; Agostinetto, D.; Oliveira, C.; Ruchel, Q.; Silva, J.D.G.; Vargas, L.; Avila, L.A. Does competition between soybeans and Wild Poinsettia with low-level resistance or susceptibility to glyphosate affect physiology and secondary metabolism? Semina 2017, 38, 1133–1144. [Google Scholar] [CrossRef]
- Rockenbach, A.P.; Rizzardi, M.A.; Nunes, A.L.; Bianchi, M.A.; Caverzan, A.; Schneider, T. Interference between weeds and crop: Changes in secondary metabolism. Rev. Bras. Herbic. 2018, 17, 59–70. [Google Scholar] [CrossRef]
- McKenzie-Gopsill, A. Morphological, Molecular and Physiological Mechanisms of Early Season Weed Competition in Soybean (Glycine max (L.) Merr.). Ph.D. Thesis, University of Guelph, Guelph, ON, Canada, 2016. [Google Scholar]
- De Almeida, D.G.; Zucoloto, M.; Zetun, M.C.; Coelho, I.; Sobreir, F.M. Oxidative stress in vegetable cells mediated by allelochemicals. Revista Facultad Nacional de Agronomía Medellín 2008, 61, 4237–4247. [Google Scholar]
- Ciniglia, C.; Mastrobuoni, F.; Scortichini, M.; Petriccione, M. Oxidative damage and cell-programmed death induced in Zea mays L. by allelochemical stress. Ecotoxicology 2015, 24, 926–937. [Google Scholar] [CrossRef] [PubMed]
- Sytykiewicz, H. Expression patterns of glutathione transferase gene (GstI) in maize seedlings under juglone-induced oxidative stress. Int. J. Mol. Sci. 2011, 12, 7982–7995. [Google Scholar] [CrossRef] [PubMed]
- Heap, I. Global perspective of herbicide-resistant weeds. Pest Manag. Sci. 2014, 70, 1306–1315. [Google Scholar] [CrossRef] [PubMed]
- Cobb, A.H.; Reade, P.H.R. Herbicides and Plant Physiology, 2nd ed.; John Wiley & Sons: New York, NY, USA, 2010; 286p. [Google Scholar]
- Servaites, J.C.; Tucci, M.A.; Geiger, D.R. Glyphosate effects on carbon assimilation, ribulose bisphosphate carboxylase activity, and metabolite levels in sugar beet leaves. Plant Physiol. 1987, 85, 370–374. [Google Scholar] [CrossRef] [PubMed]
- Duke, S.O.; Baerson, S.R.; Rimando, A.M. Herbicides: Glyphosate. In Encyclopedia of Agrochemicals; Plimmer, J.R., Gammon, D.W., Ragsdale, N.N., Eds.; John Wiley & Sons: New York, NY, USA, 2007. [Google Scholar]
- Délye, C.; Jasieniuk, M.; Le Corre, V. Deciphering the evolution of herbicide resistance in weeds. Trends Genet. 2013, 29, 649–658. [Google Scholar] [CrossRef] [PubMed]
- Grossmann, K.; Niggeweg, R.; Christiansen, N.; Looser, R.; Ehrhardt, T. The herbicide saflufenacil (KixorTm) is a new inhibitor of protoporphyrinogen IX oxidase activity. Weed Sci. 2010, 58, 1–9. [Google Scholar] [CrossRef]
- Jasieniuk, M.; Brûlé-Babel, A.L.; Morrison, I.N. The evolution and genetics of herbicide resistance in weeds. Weed Sci. 1996, 44, 176–193. [Google Scholar] [CrossRef]
- Délye, C. Unraveling the genetic bases of non-target-site-based resistance (NTSR) to herbicides: A major challenge for weed science in the forthcoming decade. Pest Manag. Sci. 2013, 69, 176–187. [Google Scholar] [CrossRef] [PubMed]
- Heap, I. The International Survey of Herbicide Resistant Weeds. Available online: www.weedscience.org (accessed on 1 February 2019).
- Yuan, J.S.; Tranel, P.J.; Stewart, C.N., Jr. Non-target-site herbicide resistance: A family business. Trends Plant Sci. 2007, 12, 6–13. [Google Scholar] [CrossRef] [PubMed]
- Cummins, I.; Cole, D.J.; Edwards, R. A role for glutathione transferases functioning as glutathione peroxidases in resistance to multiple herbicides in black-grass. Plant J. 1999, 18, 285–292. [Google Scholar] [CrossRef] [PubMed]
- Cummins, I.; Bryant, D.N.; Edwards, R. Safener responsiveness and multiple herbicide resistance in the weed black-grass (Alopecurus myosuroides). Plant Biotechnol. J. 2009, 7, 807–820. [Google Scholar] [CrossRef] [PubMed]
- Cummins, I.; Wortley, D.J.; Sabbadin, F.; He, Z.; Coxon, C.R.; Straker, H.E.; Sellars, J.D.; Knight, K.; Edwards, L.; Hughes, D.; et al. Key role for a glutathione transferase in multiple-herbicide resistance in grass weeds. Proc. Natl. Acad. Sci. USA 2013, 110, 5812–5817. [Google Scholar] [CrossRef] [PubMed]
- Jin, Z.L.; Zhang, F.; Ahmed, Z.I.; Rasheed, M.; Naeem, M.S.; Ye, Q.F.; Zhou, W.J. Differential morphological and physiological responses of two oilseed Brassica species to a new herbicide ZJ0273 used in rapeseed fields. Pest. Biochem. Physiol. 2010, 98, 1–8. [Google Scholar] [CrossRef]
- Wu, G.L.; Cui, J.; Tao, L.; Yang, H. Fluroxypyr triggers oxidative damage by producing superoxide and hydrogen peroxide in rice (Oryza sativa). Ecotoxicology 2010, 19, 124–132. [Google Scholar] [CrossRef] [PubMed]
- Radwan, D.E.M. Salicylic acid-induced alleviation of oxidative stress caused by clethodim in maize (Zea mays L.) leaves. Pest. Biochem. Physiol. 2012, 102, 182–188. [Google Scholar] [CrossRef]
- Jiang, L.; Yang, Y.; Jia, L.X.; Lin, J.L.; Liu, Y.; Pan, B.; Lin, Y. Biological responses of wheat (Triticum aestivum) plants to the herbicide simetryneinsoils. Ecotoxicol. Environ. Saf. 2016, 127, 87–94. [Google Scholar] [CrossRef] [PubMed]
- Islam, F.; Farooq, M.A.; Gill, R.A.; Wang, J.; Yang, C.; Ali, B.; Wang, G.X.; Zhou, W. 2,4-D attenuates salinity-induced toxicity by mediating anatomical changes, antioxidant capacity and cation transporters in the roots of rice cultivars. Sci. Rep. 2017, 7, 10443. [Google Scholar] [CrossRef] [PubMed]
- Vercampt, H.; Koleva, L.; Vassilev, A.; Vangronsveld, J.; Cuypers, A. Short-term phytotoxicity in Brassica napus (L.) in response to pre-emergently applied metazachlor: A microcosm study. Environ. Toxicol. Chem. 2017, 36, 59–70. [Google Scholar] [CrossRef] [PubMed]
- Guo, M.J.; Wang, Y.G.; Yuan, X.Y.; Dong, S.Q.; Wen, Y.Y.; Song, X.E.; Guo, P.Y. Responses of the antioxidant system to fluroxypyr in foxtail millet (Setaria italica L.) at the seedling stage. J. Integr. Agric. 2018, 17, 554–565. [Google Scholar] [CrossRef]
- Hu, T. A glutathione s-transferase confers herbicide tolerance in rice. Crop Breed. Appl. Biotechnol. 2014, 14, 76–81. [Google Scholar] [CrossRef]
- Eltayeb, A.E.; Yamamoto, S.; Habora, M.E.E.; Yin, L.; Tsujimoto, H.; Tanaka, K. Transgenic potato overexpressing Arabidopsis cytosolic AtDHAR1 showed higher tolerance to herbicide, drought and salt stresses. Breed. Sci. 2011, 61, 3–10. [Google Scholar] [CrossRef]
- Zhao, N.; Li, W.; Bai, S.; Guo, W.; Yuan, G.; Wang, F.; Liu, W.; Wang, J. Transcriptome profiling to identify genes involved in mesosulfuron-methyl resistance in Alopecurus aequalis. Front. Plant Sci. 2017, 8, 1–16. [Google Scholar] [CrossRef] [PubMed]
- Babineau, M.; Mahmood, K.; Mathiassen, S.K.; Kudsk, P.; Kristensen, M. De novo transcriptome assembly analysis of weed Apera spica-venti from seven tissues and growth stages. BMC Genom. 2017, 18, 128. [Google Scholar] [CrossRef] [PubMed]
- Matzrafi, M.; Shaar-Moshe, L.; Rubin, B.; Peleg, Z. Unraveling the transcriptional basis of temperature-dependent pinoxaden resistance in Brachypodium hybridum. Front. Plant Sci. 2017, 8, 1–11. [Google Scholar] [CrossRef] [PubMed]
- Chen, J.; Huang, H.; Wei, S.; Huang, Z.; Wang, X.; Zhang, C. Investigating the mechanisms of glyphosate resistance in goosegrass (Eleusine indica (L.) Gaertn.) by RNA sequencing technology. Plant J. 2017, 89, 407–415. [Google Scholar] [CrossRef] [PubMed]
- Duhoux, A.; Carrère, S.; Duhoux, A.; Délye, C. Transcriptional markers enable identification of rye-grass (Lolium sp.) plants with non-target-site-based resistance to herbicides inhibiting acetolactate-synthase. Plant Sci. 2015, 257, 22–36. [Google Scholar] [CrossRef] [PubMed]
- Pan, L.; Gao, H.; Xia, W.; Zhang, T.; Dong, L. Establishing a herbicide-metabolizing enzyme library in Beckmannia syzigachne to identify genes associated with metabolic resistance. J. Exp. Bot. 2016, 67, 1745–1757. [Google Scholar] [CrossRef] [PubMed]
- Yang, Q.; Deng, W.; Li, X.; Yu, Q.; Bai, L.; Zheng, M. Target-site and non-target-site based resistance to the herbicide tribenuron-methyl in flixweed (Descurainia sophia L.). BMC Genom. 2016, 17, 551–564. [Google Scholar] [CrossRef] [PubMed]
- Gardin, J.A.C.; Gouzy, J.; Carrère, S.; Délye, C. ALOMYbase, a resource to investigate non-target-site-based resistance to herbicides inhibiting acetolactate-synthase (ALS) in the major grass weed Alopecurus myosuroides (black-grass). BMC Genom. 2015, 16, 590. [Google Scholar] [CrossRef] [PubMed]
- Doğramacı, M.; Foley, M.E.; Horvath, D.P.; Hernandez, A.G.; Khetani, R.S.; Fields, C.J.; Keating, K.M.; Mikel, M.A.; Anderson, J.V. Glyphosate’s impact on vegetative growth in leafy spurge identifies molecular processes and hormone cross-talk associated with increased branching. BMC Genom. 2015, 16, 395. [Google Scholar] [CrossRef] [PubMed]
- Gaines, T.A.; Lorentz, L.; Figge, A.; Herrmann, J.; Maiwald, F.; Ott, M.C.; Han, H.; Busi, R.; Yu, Q.; Powles, S.B.; et al. RNA-Seq transcriptome analysis to identify genes involved in metabolism-based diclofop resistance in Lolium rigidum. Plant J. 2014, 78, 865–876. [Google Scholar] [CrossRef] [PubMed]


| HRAC Group a | Herbicide Mechanism of Action (MA) | Biological Process Committed | Herbicide Chemical Family | Herbicide Active Ingredient b | ROS Production c |
|---|---|---|---|---|---|
| A | Inhibition of acetyl-CoA carboxylase (ACCase) | Fatty acid biosynthesis | Aryloxyphenoxy-propionate “FOPS”, Cyclohexanedione “DIMs”, Phenylpyrazoline “DEN” | benzoylprop-ethyl, diclofop-methyl, haloxyfop-methyl, cyhalofop, clethodim, setoxydim, pinoxaden | No |
| B | Inhibition of acetohydroxyacid synthase (AHAS, ALS) | Amino acid biosynthesis (Leu, Ile, Val) | Sulfonylurea, Imidazolinone, Triazolopyrimidine, Pyrimidinyl(thio)benzoate | metsulfuron-methyl, chlorimuron-ethyl, nicosulfuron, imazapyr, imazethapyr, flumetsulam, cloransulam-methyl, diclosulam, flucarbazone-sodium, pyritiobac | Yes |
| C1, C2, C3 | Inhibition of photosystem II protein D1 (psbA) | Photosynthesis (electron transfer) | Triazine, Triazinone, Triazolinone, Uracil, Pyridazinone, Phenyl-carbamate, Urea, Amide, Nitrile, Benzothiadiazinone, Phenyl-pyridazine | ametryne, atrazine, simazine, hexazinone, metribuzin, amicarbazone, bromacil, pyrazon, desmedipham, chlorotoluron, diuron, linuron, propanil, bromoxynil, ioxynil, bentazon, pyridate | Yes |
| D | Diversion of the electrons transferred by the photosystem I ferredoxin (Fd) | Photosynthesis (electron transfer) | Bipyridylium | diquat, paraquat | Yes |
| E | Inhibition of protoporphyrinogen oxidase (PPO) | Photosynthesis (heme biosyn- thesis for chlorophyll) | Diphenylether, Phenylpyrazole, N-phenylphthalimide, Thiadiazole, Oxadiazole, Triazolinone, Oxazolidinedione, Pyrimidindione | acifluorfen-Na, fomesafen, lactofen, oxyfluorfen, pyraflufen-ethyl, flumioxazin, fluthiacet-methyl, oxadiazon, azafenidin, pentoxazone, butafenacil, flufenpyr-ethyl | Yes |
| F1, F2, F3 | Inhibition of phytoene desaturase (PDS) or 4-hydroxyphenylpyruvate dioxygenase (4-HPPD) or of an unknown protein | Photosynthesis (carotenoid biosynthesis) | Pyridazinone, Pyridinecarboxamide, Triketone, Isoxazole, Pyrazole, Triazole, Isoxazolidinone, Urea, Diphenylether | norflurazon, diflufenican, fluridone, mesotrione, isoxaflutole, pyrazoxyfen, amitrole, clomazone, fluometuron, aclonifen | Yes |
| G | Inhibition of 5-enolpyruvylshikimate-3-phosphate synthase (EPSPS) | Amino acid biosynthesis (Phe, Trp, Tyr) | Glycine | glyphosate | Yes |
| H | Inhibition of glutamine synthase | Amino acid biosynthesis (Gln) | Phosphinic acid | glufosinate-ammonium | Yes |
| I | Inhibition of dihydropteroate synthase | Tetrahydrofolate biosynthesis | Carbamate | asulam | Yes |
| K1, K2 | Enhancement of tubulin depolymerization | Microtubule polymerization | Dinitroaniline, Phosphoroamidate, Pyridine, Benzamide, Benzoic acid, Carbamate | oryzalin, pendimethalin, trifluralin, amiprophos-methyl, dithiopyr, propyzamide, DCPA, carbetamide | No |
| K3 | Inhibition of fatty acid synthase (FAS) | Fatty acid biosynthesis | Chloroacetamide, Acetamide, Oxyacetamide, Tetrazolinone | acetochlor, alachlor, metolachlor, napropamide, flufenacet, fentrazamide, anilofos | No |
| L | Inhibition of cellulose-synthase | Cell wall biosynthesis | Nitrile, Benzamide, Triazolocarboxamide, Quinoline carboxylic acid | dichlobenil, isoxaben, flupoxam, quinclorac | No |
| M | Uncoupling of oxidative phosphorylation | ATP biosynthesis | Dinitrophenol | dinoseb, dinoterb | Yes |
| N | Inhibition of fatty acid elongase | Fatty acid biosynthesis | Thiocarbamate, Phosphorodithioate, Benzofuran, Chloro-Carbonic-acid | butylate, cycloate, EPTC, bensulide, ethofumesate, TCA, dalapon | No |
| O | Stimulation of transport inhibitor response protein 1 (TIR1) | Regulation of auxin-responsive genes | Phenoxy-carboxylic-acid, Benzoic acid, Pyridine carboxylic acid, Quinoline carboxylic acid | 2,4-D, MCPA, dicamba, clopyralid, fluroxypyr, picloram, triclopyr, quinclorac, quinmerac, benazolin-ethyl | Yes |
| P | Inhibition of auxin transport | Long-range hormone signaling | Phthalamate, Semicarbazone | naptalam, diflufenzopyr-Na | Yes |
| Species | Herbicide Concentration | Time | Tissue | * Antioxidants Enzyme | * ROS Level | * Lipid Peroxidation | References |
|---|---|---|---|---|---|---|---|
| Triticum aestivum L. | Chlorotoluron 0, 5, 10, 15, 20 25 mg kg−1 | 10 days | Roots Leaves | CAT ↑ 5 mg kg−1 (80%); ↑ 10 mg kg−1 (35%); ↑ 15 mg kg−1 (5%); ↓ 20 mg kg−1 (11%); ↓ 25 mg kg−1 (23%); SOD ↑ 5 mg kg−1 (100%); ↑ 10 mg kg−1 (200%); ↑ 15 mg kg−1 (300%); ↑ 20 mg kg−1 (430%); ↑ 25 mg kg−1 (500%); APX ↑ 5 mg kg−1 (160%); ↑ 10 mg kg−1 (260%); ↑ 15 mg kg−1 (80%); ↑ 20 mg kg−1 (70%); ↑ 25 mg kg−1 (40%); POD ↑ 5 mg kg−1 (88%); ↑ 10 mg kg−1 (233%); ↑ 15 mg kg−1 (210%); ↑ 20 mg kg−1 (188%); ↑ 25 mg kg−1 (133%); CAT ↓ 5 mg kg−1 (17%); ↓ 10 mg kg−1 (23%); ↓ 15 mg kg−1 (35%); ↓ 20 mg kg−1 (41%); ↓ 25 mg kg−1 (47%); SOD ↑ 5 mg kg−1 (4%); ↑ 10 mg kg−1 (60%); ↑ 15 mg kg−1 (180%); ■ 20 mg kg−1 (0%); ↓ 25 mg kg−1 (4%); APX ↑ 5 mg kg−1 (100%); ↑ 10 mg kg−1 (300%); ↑ 15 mg kg−1 (75%); ↑ 20 mg kg−1 (50%); ↑ 25 mg kg−1 (25%); POD ■ | nd †H2O2 ↑ †O2•− ↑ | ■ 5 mg kg−1 (0%) ↑ 10 mg kg−1 (50%) ↑ 15 mg kg−1 (40%) ↑ 20 mg kg−1 (35%) ■ 25 mg kg−1 (0%) ↑ 5 mg kg−1 (125%) ↑ 10 mg kg−1 (225%) ↑ 15 mg kg−1 (150%) ↑ 20 mg kg−1 (50%) ↑ 25 mg kg−1 (25%) | [19] |
| Triticum aestivum L. | Prometryne 0, 4, 8, 12, 16, 20, 24 mg kg−1 | 10 days | Roots Leaves | CAT ↓ 4 mg kg−1 (20%); ↓ 8 mg kg−1 (24%); ↓ 12 mg kg−1 (37%); ↓ 16 mg kg−1 (42%); ↓ 20 mg kg−1 (48%); ↓ 24 mg kg−1 (55%); SOD ↑ 4 mg kg−1 (14%); ↑ 8 mg kg−1 (52%); ↑ 12 mg kg−1 (45%); ■ 16 mg kg−1 (0%); ■ 20 mg kg−1 (0%); ↓ 24 mg kg−1 (37%); APX ■ 4 mg kg−1 (0%); ↑ 8 mg kg−1 (23%); ↑ 12 mg kg−1 (44%); ↑ 16 mg kg−1 (16%); ■ 20 mg kg−1 (0%); ↓ 24 mg kg−1 (25%); POD ↑ 4 mg kg−1 (58%); ↑ 8 mg kg−1 (76%); ↑ 12 mg kg−1 (66%); ↑ 16 mg kg−1 (58%); ↑ 20 mg kg−1 (23%); ■ 24 mg kg−1 (0%); GST ↑ 4 mg kg−1 (50%); ↑ 8 mg kg−1 (64%); ↑ 12 mg kg−1 (57%); ↑ 16 mg kg−1 (42%); ↑ 20 mg kg−1 (21%); ■ 24 mg kg−1 (0%); CAT ↑ 4 mg kg−1 (21%); ↑ 8 mg kg−1 (50%); ↑ 12 mg kg−1 (42%); ↑ 16 mg kg−1 (21%); ■ 20 mg kg−1 (0%); ↓ 24 mg kg−1 (30%); SOD ■ 4 mg kg−1 (0%); ↑ 8 mg kg−1 (57%); ↑ 12 mg kg−1 (68%); ↑ 16 mg kg−1 (47%); ↑ 20 mg kg−1 (0%); ■ 24 mg kg−1 (0%); APX ↑ 4 mg kg−1 (16%); ↑ 8 mg kg−1 (36%); ↑ 12 mg kg−1 (56%); ↑ 16 mg kg−1 (66%); ↑ 20 mg kg−1 (43%); ↑ 24 mg kg−1 (26%); POD ■ 4 mg kg−1 (0%); ↑ 8 mg kg−1 (37%); ↑ 12 mg kg−1 (43%); ↑ 16 mg kg−1 (18%); ■ 20 mg kg−1 (0%); ■ 24 mg kg−1 (0%); GST ■ 4 mg kg−1 (0%); ↑ 8 mg kg−1 (100%); ↑ 12 mg kg−1 (116%); ↑ 16 mg kg−1 (50%); ↑ 20 mg kg−1 (16%); ↓ 24 mg kg−1 (33%); | nd | ↑ 4 mg kg−1 (250%) ↑ 8 mg kg−1 (450%) ↑ 12 mg kg−1 (400%) ↑ 16 mg kg−1 (325%) ↑ 20 mg kg−1 (275%) ↑ 24 mg kg−1 (250%) ↑ 4 mg kg−1 (140%) ↑ 8 mg kg−1 (260%) ↑ 12 mg kg−1 (200%) ↑ 16 mg kg−1 (140%) ↑ 20 mg kg−1 (135%) ↑ 24 mg kg−1 (135%) | [5] |
| Brassica napus L. Brassica rapa L. | ZJ0273 0, 100, 500, 1000 mg L−1 | 7 days 14 days 28 days 7 days 14 days 28 days | Leaves | SOD ↓ 100 mg L−1 (5%); ↓ 500 mg L−1 (22%); ↓ 1000 mg L−1 (38%); SOD ↓ 100 mg L−1 (3%); ↓ 500 mg L−1 (17%); ↓ 1000 mg L−1 (28%); SOD ↓ 100 mg L−1 (8%); ↓ 500 mg L−1 (21%); ↓ 1000 mg L−1 (33%); POD ↓ 100 mg L−1 (5%); ↓ 500 mg L−1 (42%); ↓ 1000 mg L−1 (55%); POD ↓ 100 mg L−1 (6%); ↓ 500 mg L−1 (33%); ↓ 1000 mg L−1 (47%); POD ↓ 100 mg L−1 (1%); ↓ 500 mg L−1 (3%); ↓ 1000 mg L−1 (29%); SOD ↓ 100 mg L−1 (10%); ↓ 500 mg L−1 (22%); ↓ 1000 mg L−1 (34%); SOD ↓ 100 mg L−1 (2%); ↓ 500 mg L−1 (17%); ↓ 1000 mg L−1 (29%); SOD ↓ 100 mg L−1 (1%); ↓ 500 mg L−1 (8%); ↓ 1000 mg L−1 (15%); POD ↓ 100 mg L−1 (9%); 500 mg L−1 (36%); ↓ 1000 mg L−1 (49%); POD ↓ 100 mg L−1 (5%); ↓ 500 mg L−1 (21%); ↓ 1000 mg L−1 (45%); POD ↓ 100 mg L−1 (1%); ↓ 500 mg L−1 (8%); ↓ 1000 mg L−1 (24%); | nd | (7) ↑ 100 mg L−1 (9%) ↑ 500 mg L−1 (53%) ↑ 1000 mg L−1 (58%) (14) ■ 100 mg L−1 (0%) ↑ 500 mg L−1 (32%) ↑ 1000 mg L−1 (44%) (28) ↓ 100 mg L−1 (9%) ■ 500 mg L−1 (0%) ↑ 1000 mg L−1 (1%) (7) ↑ 100 mg L−1 (32%) ↑500 mg L−1 (86%) ↑ 1000 mg L−1 (101%) (14) ↑ 100 mg L−1 (25%) ↑ 500 mg L−1 (45%) ↑ 1000 mg L−1 (63%) (28) ■ 100 mg L−1 (0%) ↑ 500 mg L−1 (11%) ↑ 1000 mg L−1 (19%) | [53] |
| Oryza sativa L. | Fluroxypyr 0, 0.05, 0.1, 0.2, 0.4, 0.8 mg L−1 | 6 days | Roots Leaves | CAT ■ SOD ↑ 0.05 mg L−1 (18%); ↑ 0.1 mg L−1 (20%); ↑ 0.2 mg L−1 (32%); ↑ 0.4 mg L−1 (22%); ↑ 0.8 mg L−1 (13%); APX ↑ 0.05 mg L−1 (10%); ↑ 0.1 mg L−1 (15%); ↑ 0.2 mg L−1 (10%); ■ 0.4 mg L−1 (0%); ↓ 0.8 mg L−1 (10%); POD ↑ 0.05 mg L−1 (50%); ↑ 0.1 mg L−1 (57%); ↑ 0.2 mg L−1 (90%); ↑ 0.4 mg L−1 (93%); ↑ 0.8 mg L−1 (110%); CAT ■ 0.05 mg L−1 (0%); ↑ 0.1 mg L−1 (15%); ■ 0.2 mg L−1 (0%); ↓ 0.4 mg L−1 (10%); ↓ 0.8 mg L−1 (30%); SOD ↑ 0.05 mg L−1 (20%); ↑ 0.1 mg L−1 (35%); ↑ 0.2 mg L−1 (40%); ↑ 0.4 mg L−1 (35%); ↑ 0.8 mg L−1 (30%); APX ■ POD ■ 0.05 mg L−1 (0%); ■ 0.1 mg L−1 (0%); ■ 0.2 mg L−1 (0%); ↑ 0.4 mg L−1 (45%); ↑ 0.8 mg L−1 (55%); | †H2O2 ↑ †O2•− ↑ | ↑ 0.05 mg L−1 (17%) ↑ 0.1 mg L−1 (25%) ↑ 0.2 mg L−1 (45%) ↑ 0.4 mg L−1 (40%) ↑ 0.8 mg L−1 (17%) ■ 0.05 mg L−1 (0%) ↑ 0.1 mg L−1 (10%) ↑ 0.2 mg L−1 (13%) ↑ 0.4 mg L−1 (22%) ↑ 0.8 mg L−1 (9%) | [54] |
| Zea mays L. | Clethodim 0, 50, 100, 200, 500, 1000 ppm | 21 days | Leaves | CAT ↓ 50 ppm (57%); ↓ 100 ppm (47%); ↓ 200 ppm (23%); ↓ 500 ppm (15%); ↓ 1000 ppm (9%); SOD ↓ 50 ppm (13%); ↓ 100 ppm (25%); ↓ 200 ppm (35%); ↓ 500 ppm (35%); ↓ 1000 ppm (32%); APX ↑ 50 ppm (90%); ↑ 100 ppm (175%); ↑ 200 ppm (82%); ↑ 500 ppm (75%); ↑ 1000 ppm (17%); POD ↑ 50 ppm (92%); ↑ 100 ppm (77%); ↑ 200 ppm (180%); ↑ 500 ppm (123%); ↑ 1000 ppm (190%); | H2O2↑ 50 ppm (1%) ↑ 100 ppm (23%) ↑ 200 ppm (36%) ↑ 500 ppm (50%) ↑ 1000 ppm (63%) | ↑ 50 ppm (45%) ↓ 100 ppm (7%) ↑ 200 ppm (67%) ↑ 500 ppm (120%) ↑ 1000 ppm (182%) | [55] |
| Oryza sativa L. | Atrazine 0, 0.05, 0.1, 0.2, 0.4, 0.8 mg L−1 | 6 days | Roots Leaves | CAT ■ 0.05 mg L−1 (0%); ↑ 0.1 mg L−1 (25%); ↑ 0.2 mg L−1 (25%); ↑ 0.4 mg L−1 (25%); ■ 0.8 mg L−1 (0%); SOD ■ 0.05 mg L−1 (0%); ↑ 0.1 mg L−1 (60%); ↑ 0.2 mg L−1 (75%); ↑ 0.4 mg L−1 (150%); ↑ 0.8 mg L−1 (95%); APX ■ 0.05 mg L−1 (0%); ↑ 0.1 mg L−1 (25%); ↑ 0.2 mg L−1 (65%); ↑ 0.4 mg L−1 (70%); ↑ 0.8 mg L−1 (25%); POD ■ 0.05 mg L−1 (0%); ■ 0.1 mg L−1 (0%); ↑ 0.2 mg L−1 (65%); ↑ 0.4 mg L−1 (85%); ↑ 0.8 mg L−1 (125%); GST ■ 0.05 mg L−1 (0%); ■ 0.1 mg L−1 (0%); ↓ 0.2 mg L−1 (50%); ↓ 0.4 mg L−1 (58%); ↓ 0.8 mg L−1 (50%); GR ■ 0.05 mg L−1 (0%); ↑ 0.1 mg L−1 (25%); ↑ 0.2 mg L−1 (100%); ↑ 0.4 mg L−1 (50%); ↑ 0.8 mg L−1 (40%); CAT ↑ 0.05 mg L−1 (50%); ↑ 0.1 mg L−1 (100%); ↑ 0.2 mg L−1 (125%); ↑ 0.4 mg L−1 (150%); ↑ 0.8 mg L−1 (200%); SOD ■ 0.05 mg L−1 (0%); ↑ 0.1 mg L−1 (40%); ↑ 0.2 mg L−1 (50%); ↑ 0.4 mg L−1 (140%); ↑ 0.8 mg L−1 (300%); APX ■ 0.05 mg L−1 (0%); ■ 0.1 mg L−1 (0%); ↑ 0.2 mg L−1 (40%); ↑ 0.4 mg L−1 (45%); ■ 0.8 mg L−1 (0%); POD ■ 0.05 mg L−1 (0%); ↑ 0.1 mg L−1 (40%); ↑ 0.2 mg L−1 (45%); ↑ 0.4 mg L−1 (360%); ↑ 0.8 mg L−1 (540%); GST ■ 0.05 mg L−1 (0%); ■ 0.1 mg L−1 (0%); ↑ 0.2 mg L−1 (50%); ↑ 0.4 mg L−1 (50%); ↑ 0.8 mg L−1 (40%); GR ■ 0.05 mg L−1 (0%); ↑ 0.1 mg L−1 (50%); ↑ 0.2 mg L−1 (95%); ↑ 0.4 mg L−1 (150%); ↑ 0.8 mg L−1 (115%); | nd †H2O2 ↑ †O2•− ↑ | ■ 0.05 mg L−1 (0%) ↑ 0.1 mg L−1 (22%) ↑ 0.2 mg L−1 (33%) ↑ 0.4 mg L−1 (45%) ↑ 0.8 mg L−1 (22%) ■ 0.05 mg L−1 (0%) ↑ 0.1 mg L−1 (25%) ↑ 0.2 mg L−1 (25%) ↑ 0.4 mg L−1 (37%) ↑ 0.8 mg L−1 (25%) | [18] |
| Triticum aestivum L. | Simetryne 0, 0.8, 1.6, 3.2, 4.8, 6.4, 8.0 mg kg−1 | 7 days | Roots Leaves | CAT ↑ 0.8 mg kg−1 (43%); ↑ 1.6 mg kg−1 (73%); ↑ 3.2 mg kg−1 (15%); ↓ 4.8 mg kg−1 (30%); ↓ 6.4 mg kg−1 (45%); ↓ 8.0 mg kg−1 (70%); SOD ↑ 0.8 mg kg−1 (25%); ↑ 1.6 mg kg−1 (65%); ↑ 3.2 mg kg−1 (105%); ↑ 4.8 mg kg−1 (60%); ↑ 6.4 mg kg−1 (40%); ↑ 8.0 mg kg−1 (20%); APX ↑ 0.8 mg kg−1 (50%); ↑ 1.6 mg kg−1 (90%); ↑ 3.2 mg kg−1 (135%); ↑ 4.8 mg kg−1 (120%); ↑ 6.4 mg kg−1 (65%); ↑ 8.0 mg kg−1 (50%); POD ↑ 0.8 mg kg−1 (10%); ↑ 1.6 mg kg−1 (50%); ↑ 3.2 mg kg−1 (100%); ↑ 4.8 mg kg−1 (80%); ↑ 6.4 mg kg−1 (30%); ■ 8.0 mg kg−1 (0%); GST ↑ 0.8 mg kg−1 (20%); ↑ 1.6 mg kg−1 (25%); ↑ 3.2 mg kg−1 (75%); ↑ 4.8 mg kg−1 (55%); ↑ 6.4 mg kg−1 (30%); ↑ 8.0 mg kg−1 (20%); GR ↑ 0.8 mg kg−1 (45%); ↑ 1.6 mg kg−1 (90%); ↑ 3.2 mg kg−1 (170%); ↑ 4.8 mg kg−1 (150%); ↑ 6.4 mg kg−1 (140%); ↑ 8.0 mg kg−1 (95%); CAT ↑ 0.8 mg kg−1 (25%); ↑ 1.6 mg kg−1 (85%); ↑ 3.2 mg kg−1 (150%); ↑ 4.8 mg kg−1 (100%); ↑ 6.4 mg kg−1 (50%); ↓ 8.0 mg kg−1 (25%); SOD ↑ 0.8 mg kg−1 (40%); ↑ 1.6 mg kg−1 (110%); ↑ 3.2 mg kg−1 (195%); ↑ 4.8 mg kg−1 (145%); ↑ 6.4 mg kg−1 (100%); ↑ 8.0 mg kg−1 (50%); APX ↑ 0.8 mg kg−1 (20%); ↑ 1.6 mg kg−1 (45%); ↑ 3.2 mg kg−1 (100%); ↑ 4.8 mg kg−1 (90%); ↑ 6.4 mg kg−1 (65%); ↑ 8.0 mg kg−1 (45%); POD ■ 0.8 mg kg−1 (0%); ↑ 1.6 mg kg−1 (15%); ↑ 3.2 mg kg−1 (35%); ↑ 4.8 mg kg−1 (15%); ↑ 6.4 mg kg−1 (10%); ■ 8.0 mg kg−1 (0%); GST ↑ 0.8 mg kg−1 (10%); ↑ 1.6 mg kg−1 (25%); ↑ 3.2 mg kg−1 (50%); ↑ 4.8 mg kg−1 (70%); ↓ 6.4 mg kg−1 (25%); ↓ 8.0 mg kg−1 (35%); GR ■ 0.8 mg kg−1 (0%); ↑ 1.6 mg kg−1 (10%); ↑ 3.2 mg kg−1 (25%); ↑ 4.8 mg kg−1 (10%); ↑ 6.4 mg kg−1 (5%); ■ 8.0 mg kg−1 (0%); | †H2O2 ↑ †O2•− ↑ | ↑ 0.8 mg kg−1 (20%) ↑ 1.6 mg kg−1 (20%) ↑ 3.2 mg kg−1 (45%) ↑ 4.8 mg kg−1 (25%) ↑ 6.4 mg kg−1 (20%) ■ 8.0 mg kg−1 (0%) ↑ 0.8 mg kg−1 (15%) ↑ 1.6 mg kg−1 (35%) ↑ 3.2 mg kg−1 (45%) ↑ 4.8 mg kg−1 (35%) ↑ 6.4 mg kg−1 (15%) ↑ 8.0 mg kg−1 (10%) | [56] |
| Phaseolus vulgaris L. | Prometryn 0, 10, 100, 500 µM | 21 days | Roots Leaves | CAT ↑ 10 µM (35%); ↑ 100 µM (40%); ■ 500 µM (0%); APX ↑ 10 µM (35%); ↑ 100 µM (70%); ↓ 500 µM (22%); GST ↑ 10 µM (8%); ↑ 100 µM (15%); ↓ 500 µM (11%); CAT ↑ 10 µM (30%); ↑ 100 µM (100%); ↓ 500 µM (25%); APX ↑ 10 µM (20%); ↑ 100 µM (42%); ↓ 500 µM (49%); GST ↑ 10 µM (55%); ↑ 100 µM (110%); ↓ 500 µM (18%); | nd nd | nd ■ 10 µM (0%) ↑ 100 µM (80%) ↑ 500 µM (148%) | [20] |
| Oryza sativa L. (ZJ 88) Oryza sativa L. (XS 134) | 2,4-D 0.8 kg a.i. ha−1 | 15 days | Roots | CAT ↑ 0.8 kg a.i. ha−1 (15%); SOD ↑ 0.8 kg a.i. ha−1 (79%); APX ↑ 0.8 kg a.i. ha−1 (15%); POD ↓ 0.8 kg a.i. ha−1 (7%); CAT ↑ 0.8 kg a.i. ha−1 (19%); SOD ↑ 0.8 kg a.i. ha−1 (32%); APX ↑ 0.8 kg a.i. ha−1 (54%); POD ↑ 0.8 kg a.i. ha−1 (2%); | H2O2 ↑ 0.8 kg a.i. ha−1 (59%) O2•− ↑ 0.8 kg a.i. ha−1 (29%) H2O2 ↑ 0.8 kg a.i. ha−1 (22%) O2•− ↑ 0.8 kg a.i. ha−1 (19%) | ↑ 0.8 kg a.i. ha−1 (214%) ↑ 0.8 kg a.i. ha−1 (121%) | [57] |
| Brassica napus L. | Metazachlor 0, 0.2, 0.4 mM | 14 days 28 days | Leaves | CAT ↑ 0.2 Mm (80%); ↑ 0.4 mM (25%); SOD ↑ 0.2 Mm (30%); ↑ 0.4 mM (25%); APX ↑ 0.2 Mm (42%); ↑ 0.4 mM (35%); POD ↑ 0.2 Mm (170%); ↑ 0.4 mM (130%); GR ↑ 0.2 Mm (42%); ↑ 0.4 mM (83%); CAT ↑ 0.2 Mm (107%); ↑ 0.4 mM (175%); SOD ↑ 0.2 Mm (15%); ↑ 0.4 mM (68%); APX ↑ 0.2 Mm (42%); ↑ 0.4 mM (65%); POD ↑ 0.2 Mm (22%); ↑ 0.4 mM (220%); GR ↑ 0.2 Mm (30%); ↑ 0.4 mM (63%); | nd | ↑ 0.2 mM (10%) ↑ 0.4 mM (23%) ↑ 0.2 mM (40%) ↑ 0.4 mM (43%) | [58] |
| Setaria italica L. (Jingu 21) Setaria italica L. (Zhangzagu 3) Setaria italica L. (Zhangzagu 5) Setaria italica L. (Zhangzagu 10) | Fluroxypyr 0, 0.5, 1, 2, 4 L a.i. ha−1 | 15 days | Leaves | CAT ↑ 0.5 L a.i. ha−1 (138%); ↑ 1 L a.i. ha−1 (480%); ↑ 2 L a.i. ha−1 (265%); ↑ 4 L a.i. ha−1 (65%); SOD ↑ 0.5 L a.i. ha−1 (75%); ↑ 1 L a.i. ha−1 (98); ↑ 2 L a.i. ha−1 (75%); ↑ 4 L a.i. ha−1 (75%;); APX ↑ 0.5 L a.i. ha−1 (72%); ↑ 1 L a.i. ha−1 (300%); ↑ 2 L a.i. ha−1 (155%); ↑ 4 L a.i. ha−1 (163%); POD ↑ 0.5 L a.i. ha−1 (80%); ↑ 1 L a.i. ha−1 (213%); ↑ 2 L a.i. ha−1 (200%); ↑ 4 L a.i. ha−1 (185%); GR ↑ 0.5 L a.i. ha−1 (57%); ↑ 1 L a.i. ha−1 (255%); ↑ 2 L a.i. ha−1 (150%); ↑ 4 L a.i. ha−1 (100%); CAT ↑ 0.5 L a.i. ha−1 (110%); ↑ 1 L a.i. ha−1 (210%); ↑ 2 L a.i. ha−1 (222%); ↑ 4 L a.i. ha−1 (115%); SOD ↑ 0.5 L a.i. ha−1 (575%); ↑ 1 L a.i. ha−1 (673%); ↑ 2 L a.i. ha−1 (718%); ↑ 4 L a.i. ha−1 (520%); APX ↑ 0.5 L a.i. ha−1 (65%); ↑ 1 L a.i. ha−1 (212%); ↑ 2 L a.i. ha−1 (243%); ↑ 4 L a.i. ha−1 (118%); POD ↑ 0.5 L a.i. ha−1 (100%); ↑ 1 L a.i. ha−1 (110%); ↑ 2 L a.i. ha−1 (180%); ↑ 4 L a.i. ha−1 (185%); GR ↑ 0.5 L a.i. ha−1 (32%); ↑ 1 L a.i. ha−1 (142%); ↑ 2 L a.i. ha−1 (272%); ↑ 4 L a.i. ha−1 (97%); CAT ↑ 0.5 L a.i. ha−1 (412%); ↑ 1 L a.i. ha−1 (370%); ↑ 2 L a.i. ha−1 (311%); ↑ 4 L a.i. ha−1 (435%); SOD ↑ 0.5 L a.i. ha−1 (72%); ↑ 1 L a.i. ha−1 (140%); ↑ 2 L a.i. ha−1 (227%); ↑ 4 L a.i. ha−1 (125%); APX ↑ 0.5 L a.i. ha−1 (15%); ↑ 1 L a.i. ha−1 (20%); ↑ 2 L a.i. ha−1 (92%); ↑ 4 L a.i. ha−1 (70%); POD ↑ 0.5 L a.i. ha−1 (28%); ↑ 1 L a.i. ha−1 (83%); ↑ 2 L a.i. ha−1 (90%); ↑ 4 L a.i. ha−1 (125%); GR ↑ 0.5 L a.i. ha−1 (18%); ↑ 1 L a.i. ha−1 (105%); ↑ 2 L a.i. ha−1 (295%); ↑ 4 L a.i. ha−1 (25%); CAT ↑ 0.5 L a.i. ha−1 (293%); ↑ 1 L a.i. ha−1 (320%); ↑ 2 L a.i. ha−1 (430%); ↑ 4 L a.i. ha−1 (110%); SOD ↑ 0.5 L a.i. ha−1 (138%); ↑ 1 L a.i. ha−1 (202%); ↑ 2 L a.i. ha−1 (230%); ↑ 4 L a.i. ha−1 (140%); APX ↑ 0.5 L a.i. ha−1 (113%); ↑ 1 L a.i. ha−1 (163%); ↑ 2 L a.i. ha−1 (345%); ↑ 4 L a.i. ha−1 (235%); POD ↑ 0.5 L a.i. ha−1 (88%); ↑ 1 L a.i. ha−1 (235%); ↑ 2 L a.i. ha−1 (670%); ↑ 4 L a.i. ha−1 (740%); GR ↑ 0.5 L a.i. ha−1 (13%); ↑ 1 L a.i. ha−1 (62%); ↑ 2 L a.i. ha−1 (195%); ↑ 4 L a.i. ha−1 (109%); | H2O2 ↑ 0.5 L a.i. ha−1 (70%) ↑ 1 L a.i. ha−1 (130%) ↑ 2 L a.i. ha−1 (160%) ↑ 4 L a.i. ha−1 (182%) O2•− ↑ 0.5 L a.i. ha−1 (3%) ↑ 1 L a.i. ha−1 (10%) ↑ 2 L a.i. ha−1 (15%) ↑ 4 L a.i. ha−1 (28%) H2O2 ↑ 0.5 L a.i. ha−1 (2%) ↑ 1 L a.i. ha−1 (10%) ↑ 2 L a.i. ha−1 (30%) ↑ 4 L a.i. ha−1 (60%) O2•− ■ 0.5 L a.i. ha−1 (0%) ↑ 1 L a.i. ha−1 (2%) ↑ 2 L a.i. ha−1 (2%) ↑ 4 L a.i. ha−1 (3%) H2O2 ↑ 0.5 L a.i. ha−1 (42%) ↑ 1 L a.i. ha−1 (55%) ↑ 2 L a.i. ha−1 (55%) ↑ 4 L a.i. ha−1 (60%) O2•− ■ 0.5 L a.i. ha−1 (0%) ■ 1 L a.i. ha−1 (0%) ■ 2 L a.i. ha−1 (0%) ↑ 4 L a.i. ha−1 (10%) H2O2 ↑ 0.5 L a.i. ha−1 (1%) ↑ 1 L a.i. ha−1 (12%) ↑ 2 L a.i. ha−1 (13%) ↑ 4 L a.i. ha−1 (80%) O2•− ↑ 0.5 L a.i. ha−1 (5%) ↑ 1 L a.i. ha−1 (10%) ↑ 2 L a.i. ha−1 (10%) ↑ 4 L a.i. ha−1 (13%) | ↑ 0.5 L a.i. ha− (35%) ↑ 1 L a.i. ha−1 (52%) ↑ 2 L a.i. ha−1 (62%) ↑ 4 L a.i. ha−1 (80%) ↑ 0.5 L a.i. ha−1 (10%) ↑ 1 L a.i. ha−1 (37%) ↑ 2 L a.i. ha−1 (52%) ↑ 4 L a.i. ha−1 (65%) ■ 0.5 L a.i. ha−1 (0%) ↑ 1 L a.i. ha−1 (7%) ↑ 2 L a.i. ha−1 (20%) ↑ 4 L a.i. ha−1 (25%) ↑ 0.5 L a.i. ha−1 (20%) ↑ 1 L a.i. ha−1 (37%) ↑ 2 L a.i. ha−1 (65%) ↑ 4 L a.i. ha−1 (80%) | [59] |
| Weed Species | Herbicide Resistance | ROS Scavenging Pathway Genes | Reference |
|---|---|---|---|
| Avena fatua | Pinoxaden Flucarbazone | GST, SOD | [12] |
| Alopecurus aequalis Sobol | Mesosulfuron-methyl | GST, POD | [62] |
| Apera spica-venti | Sensitive | GST | [63] |
| Brachypodium hybridum | Pinoxaden | GST, POD | [64] |
| Eleusine indica L. | Glyphosate | GST | [65] |
| Lolium spp. | Pyroxsulam; Iodosulfuron+mesosulfuron | GST | [66] |
| Beckmannia syzigachne | Fenoxaprop-P-ethyl | GST, POD | [67] |
| Descurainia sophia L. | Tribenuron-methyl | GST, POD | [68] |
| Alopecurus myosuroides L. | Iodosulfuron+mesosulfuron | GST, POD | [69] |
| Euphorbia esula | Glyphosate | GST | [70] |
| Eleusine indica L. | Paraquat | GLR, MDAR, GR, POD, GST, CAT, Trx | [8] |
| Lolium rigidum | Diclofop-methyl | GST | [71] |
© 2019 by the authors. Licensee MDPI, Basel, Switzerland. This article is an open access article distributed under the terms and conditions of the Creative Commons Attribution (CC BY) license (http://creativecommons.org/licenses/by/4.0/).
Share and Cite
Caverzan, A.; Piasecki, C.; Chavarria, G.; Stewart, C.N., Jr.; Vargas, L. Defenses Against ROS in Crops and Weeds: The Effects of Interference and Herbicides. Int. J. Mol. Sci. 2019, 20, 1086. https://doi.org/10.3390/ijms20051086
Caverzan A, Piasecki C, Chavarria G, Stewart CN Jr., Vargas L. Defenses Against ROS in Crops and Weeds: The Effects of Interference and Herbicides. International Journal of Molecular Sciences. 2019; 20(5):1086. https://doi.org/10.3390/ijms20051086
Chicago/Turabian StyleCaverzan, Andréia, Cristiano Piasecki, Geraldo Chavarria, C. Neal Stewart, Jr., and Leandro Vargas. 2019. "Defenses Against ROS in Crops and Weeds: The Effects of Interference and Herbicides" International Journal of Molecular Sciences 20, no. 5: 1086. https://doi.org/10.3390/ijms20051086
APA StyleCaverzan, A., Piasecki, C., Chavarria, G., Stewart, C. N., Jr., & Vargas, L. (2019). Defenses Against ROS in Crops and Weeds: The Effects of Interference and Herbicides. International Journal of Molecular Sciences, 20(5), 1086. https://doi.org/10.3390/ijms20051086