The Effect of AtHKT1;1 or AtSOS1 Mutation on the Expressions of Na+ or K+ Transporter Genes and Ion Homeostasis in Arabidopsis thaliana under Salt Stress

 , and
, and 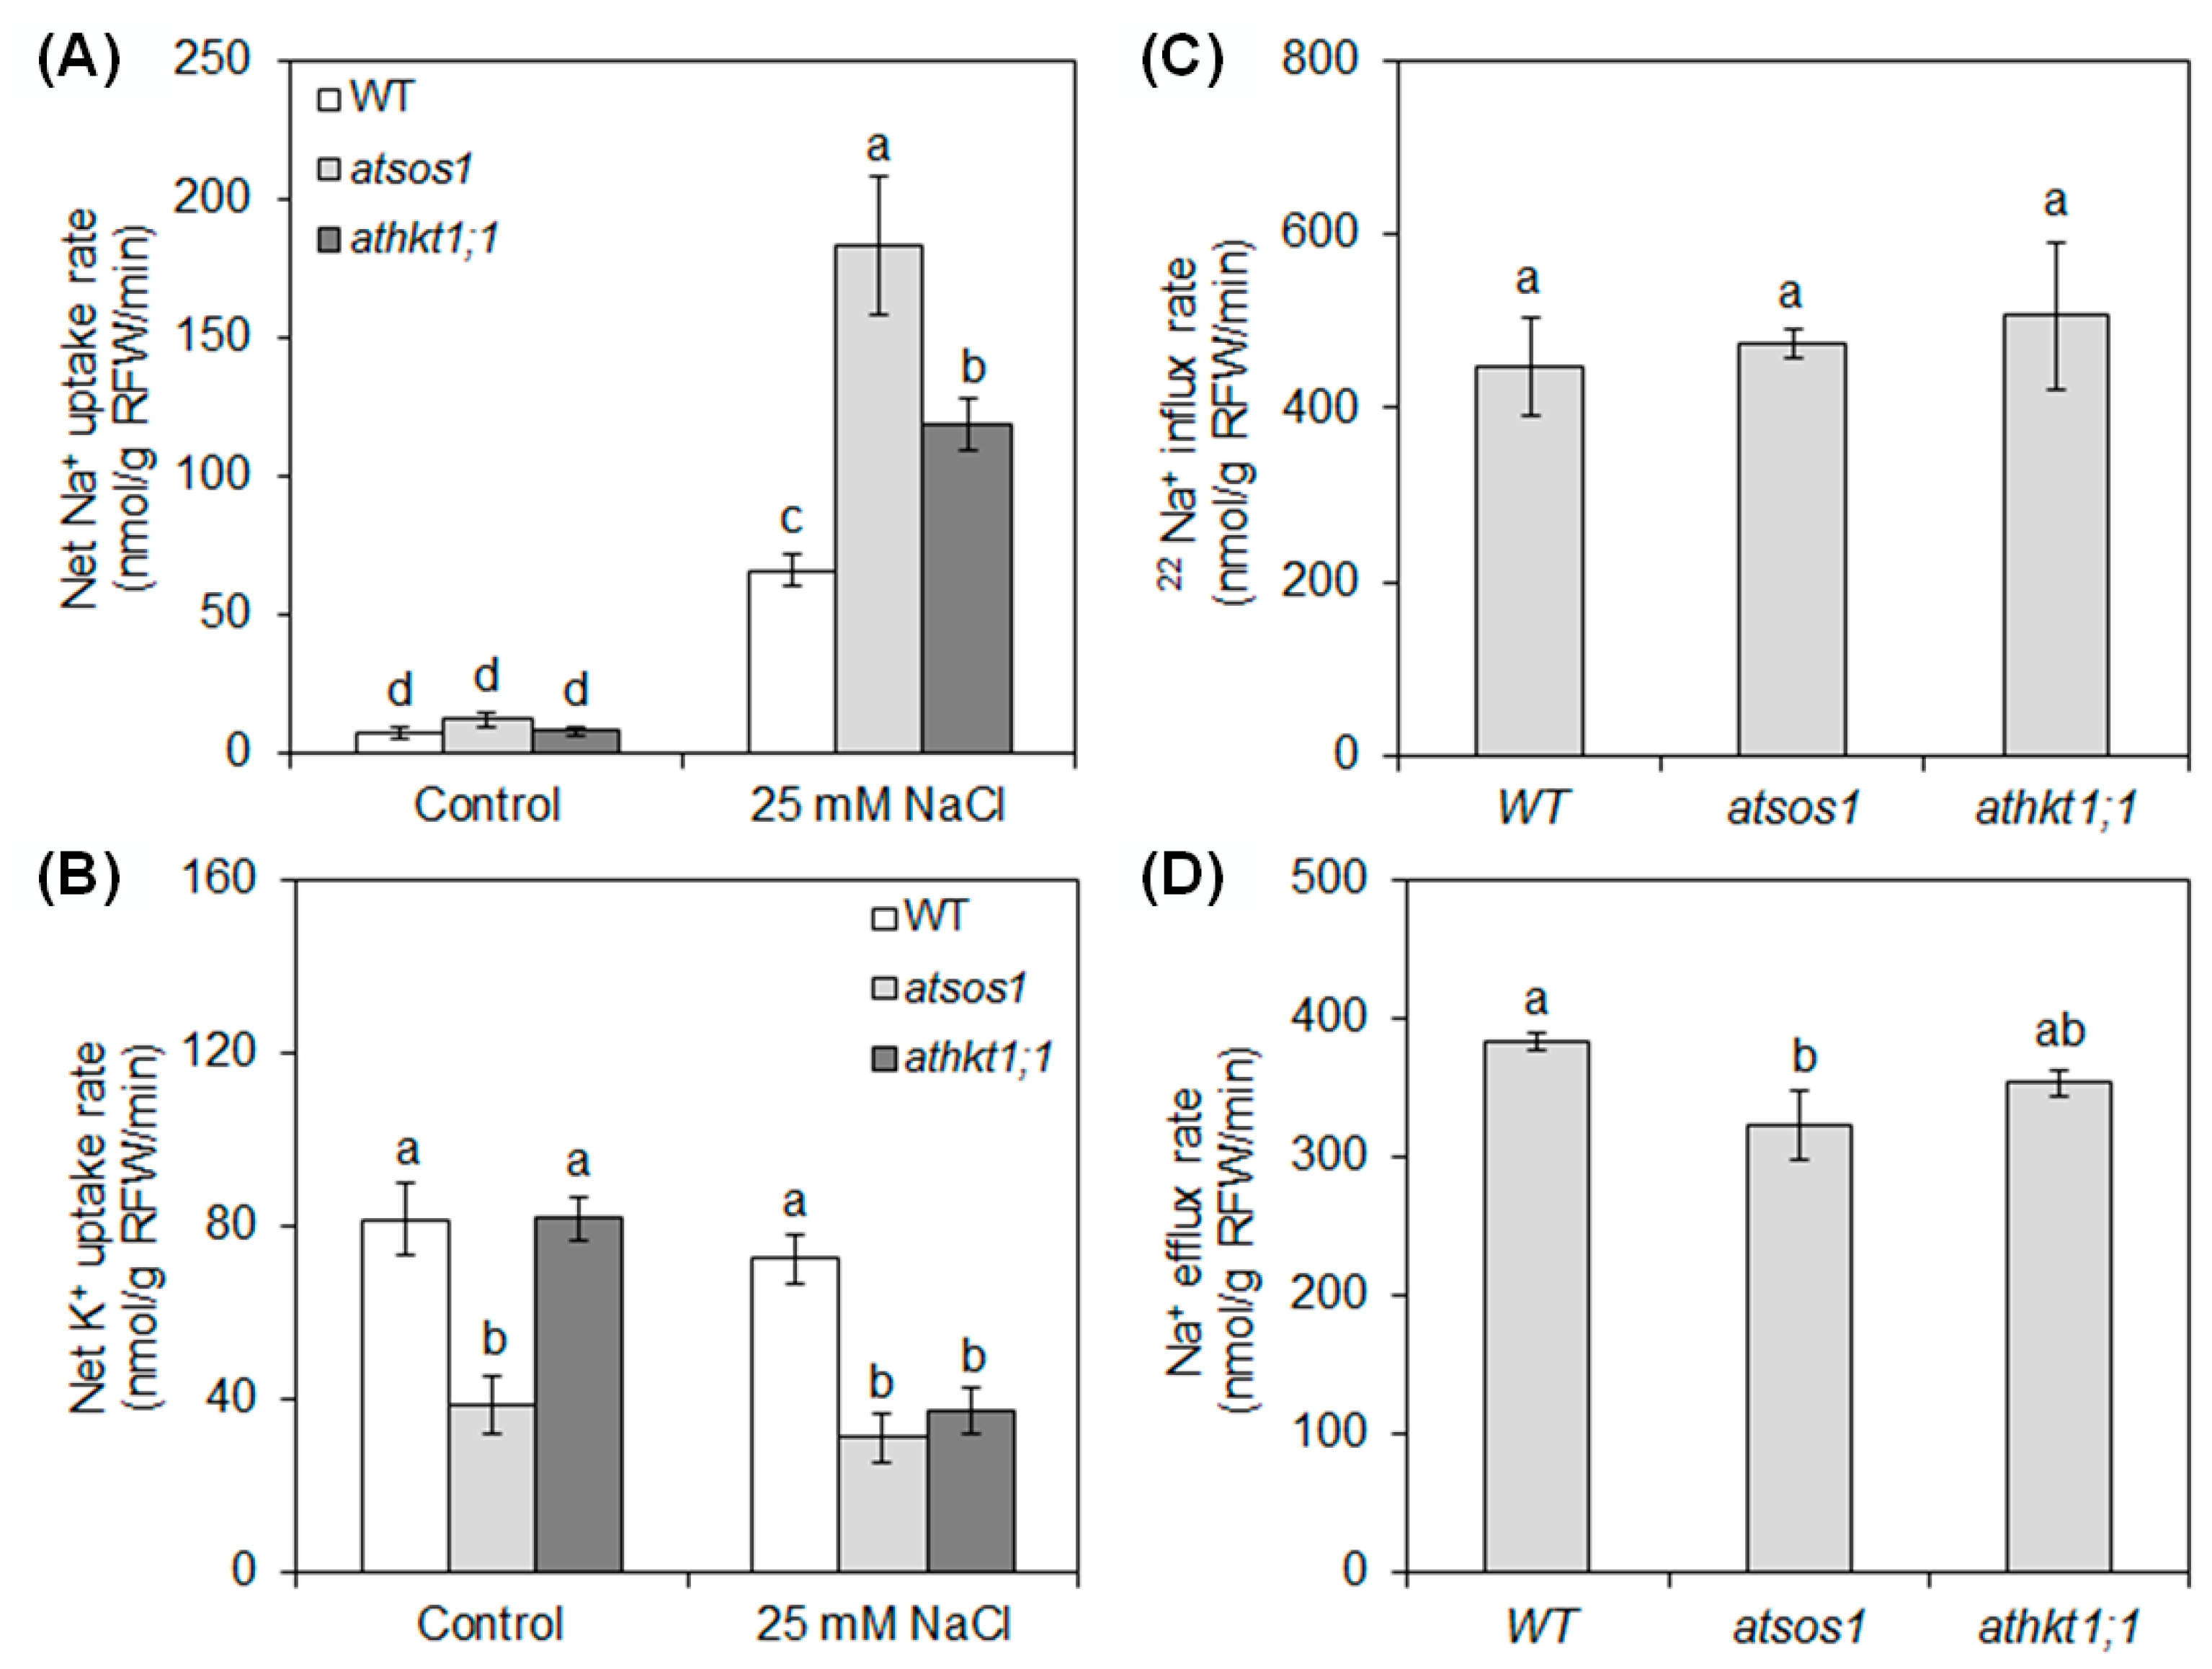
Abstract
:1. Introduction
2. Results
2.1. Mutation of AtSOS1 and AtHKT1;1 Altered Na+ and K+ Uptake under Salt Stress
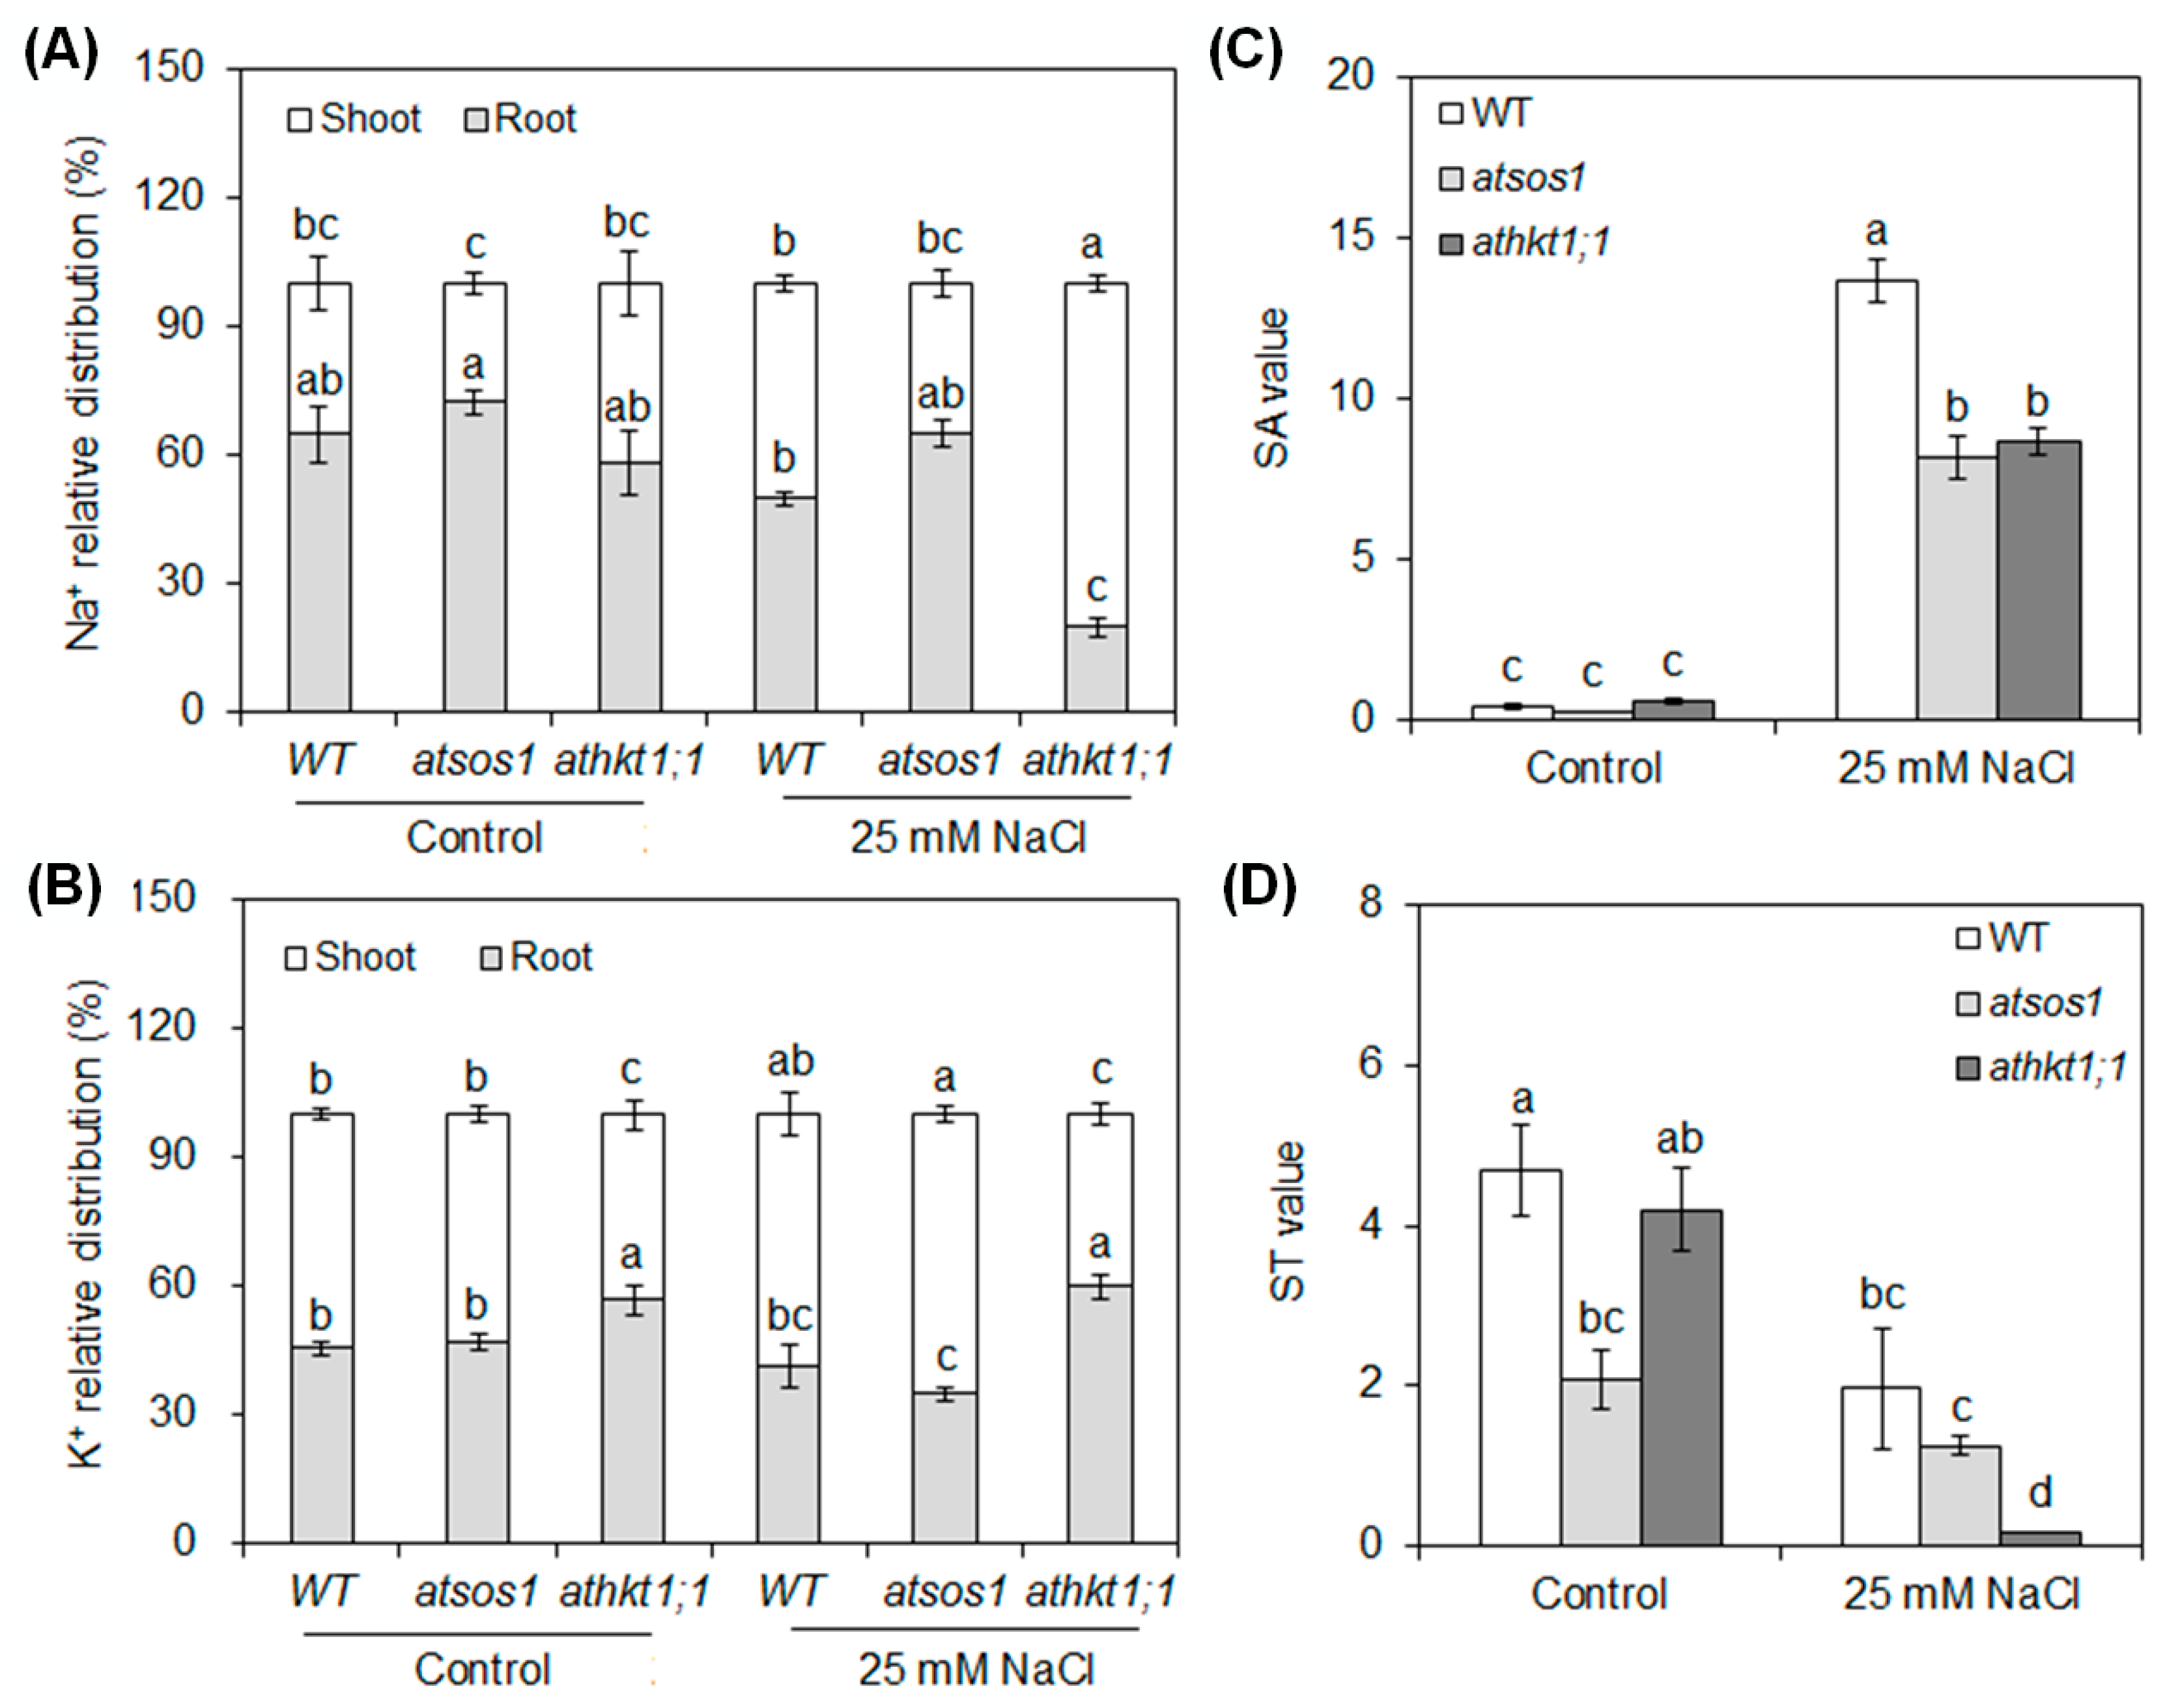
2.2. Mutation of AtSOS1 and AtHKT1;1 Altered Na+ and K+ Partitioning and the Net Selective Absorption and Transport Capacity for K+ over Na+ in Plant Tissues under Salt Stress
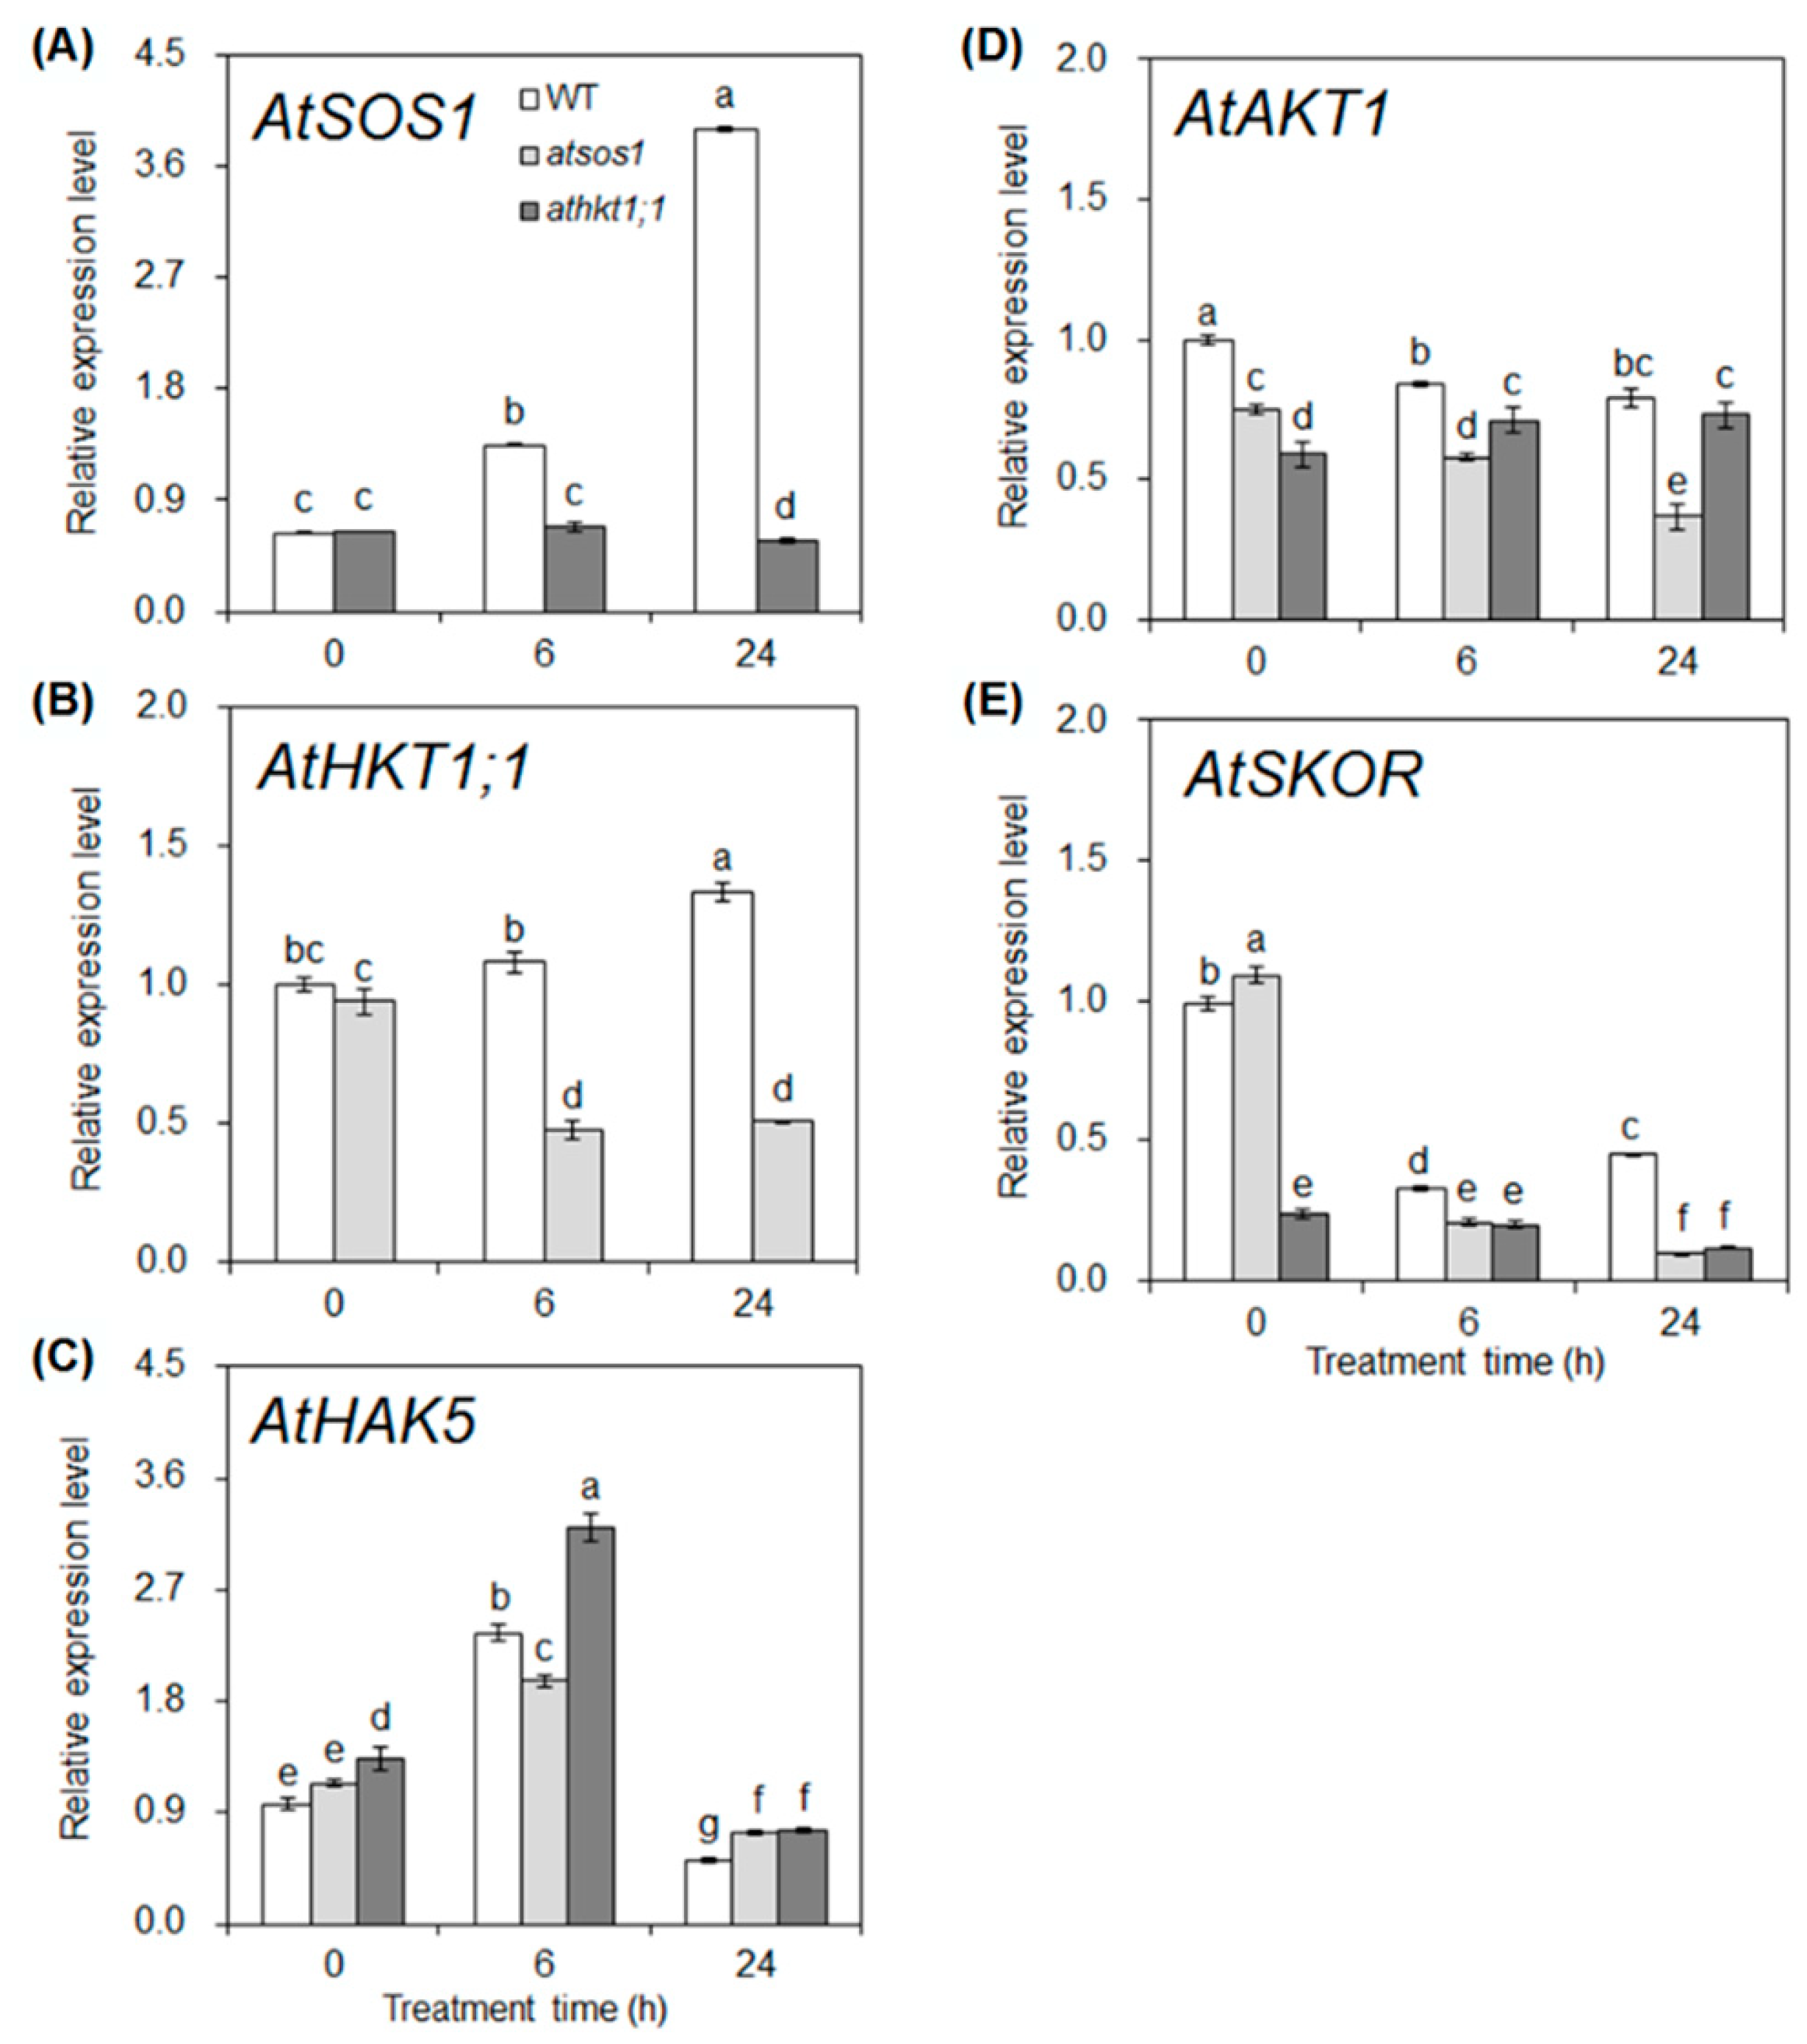
2.3. Mutation of AtHKT1;1 and AtSOS1 Altered the Expression Levels of K+ and Na+ Transporter Genes in Roots under Salt Stress
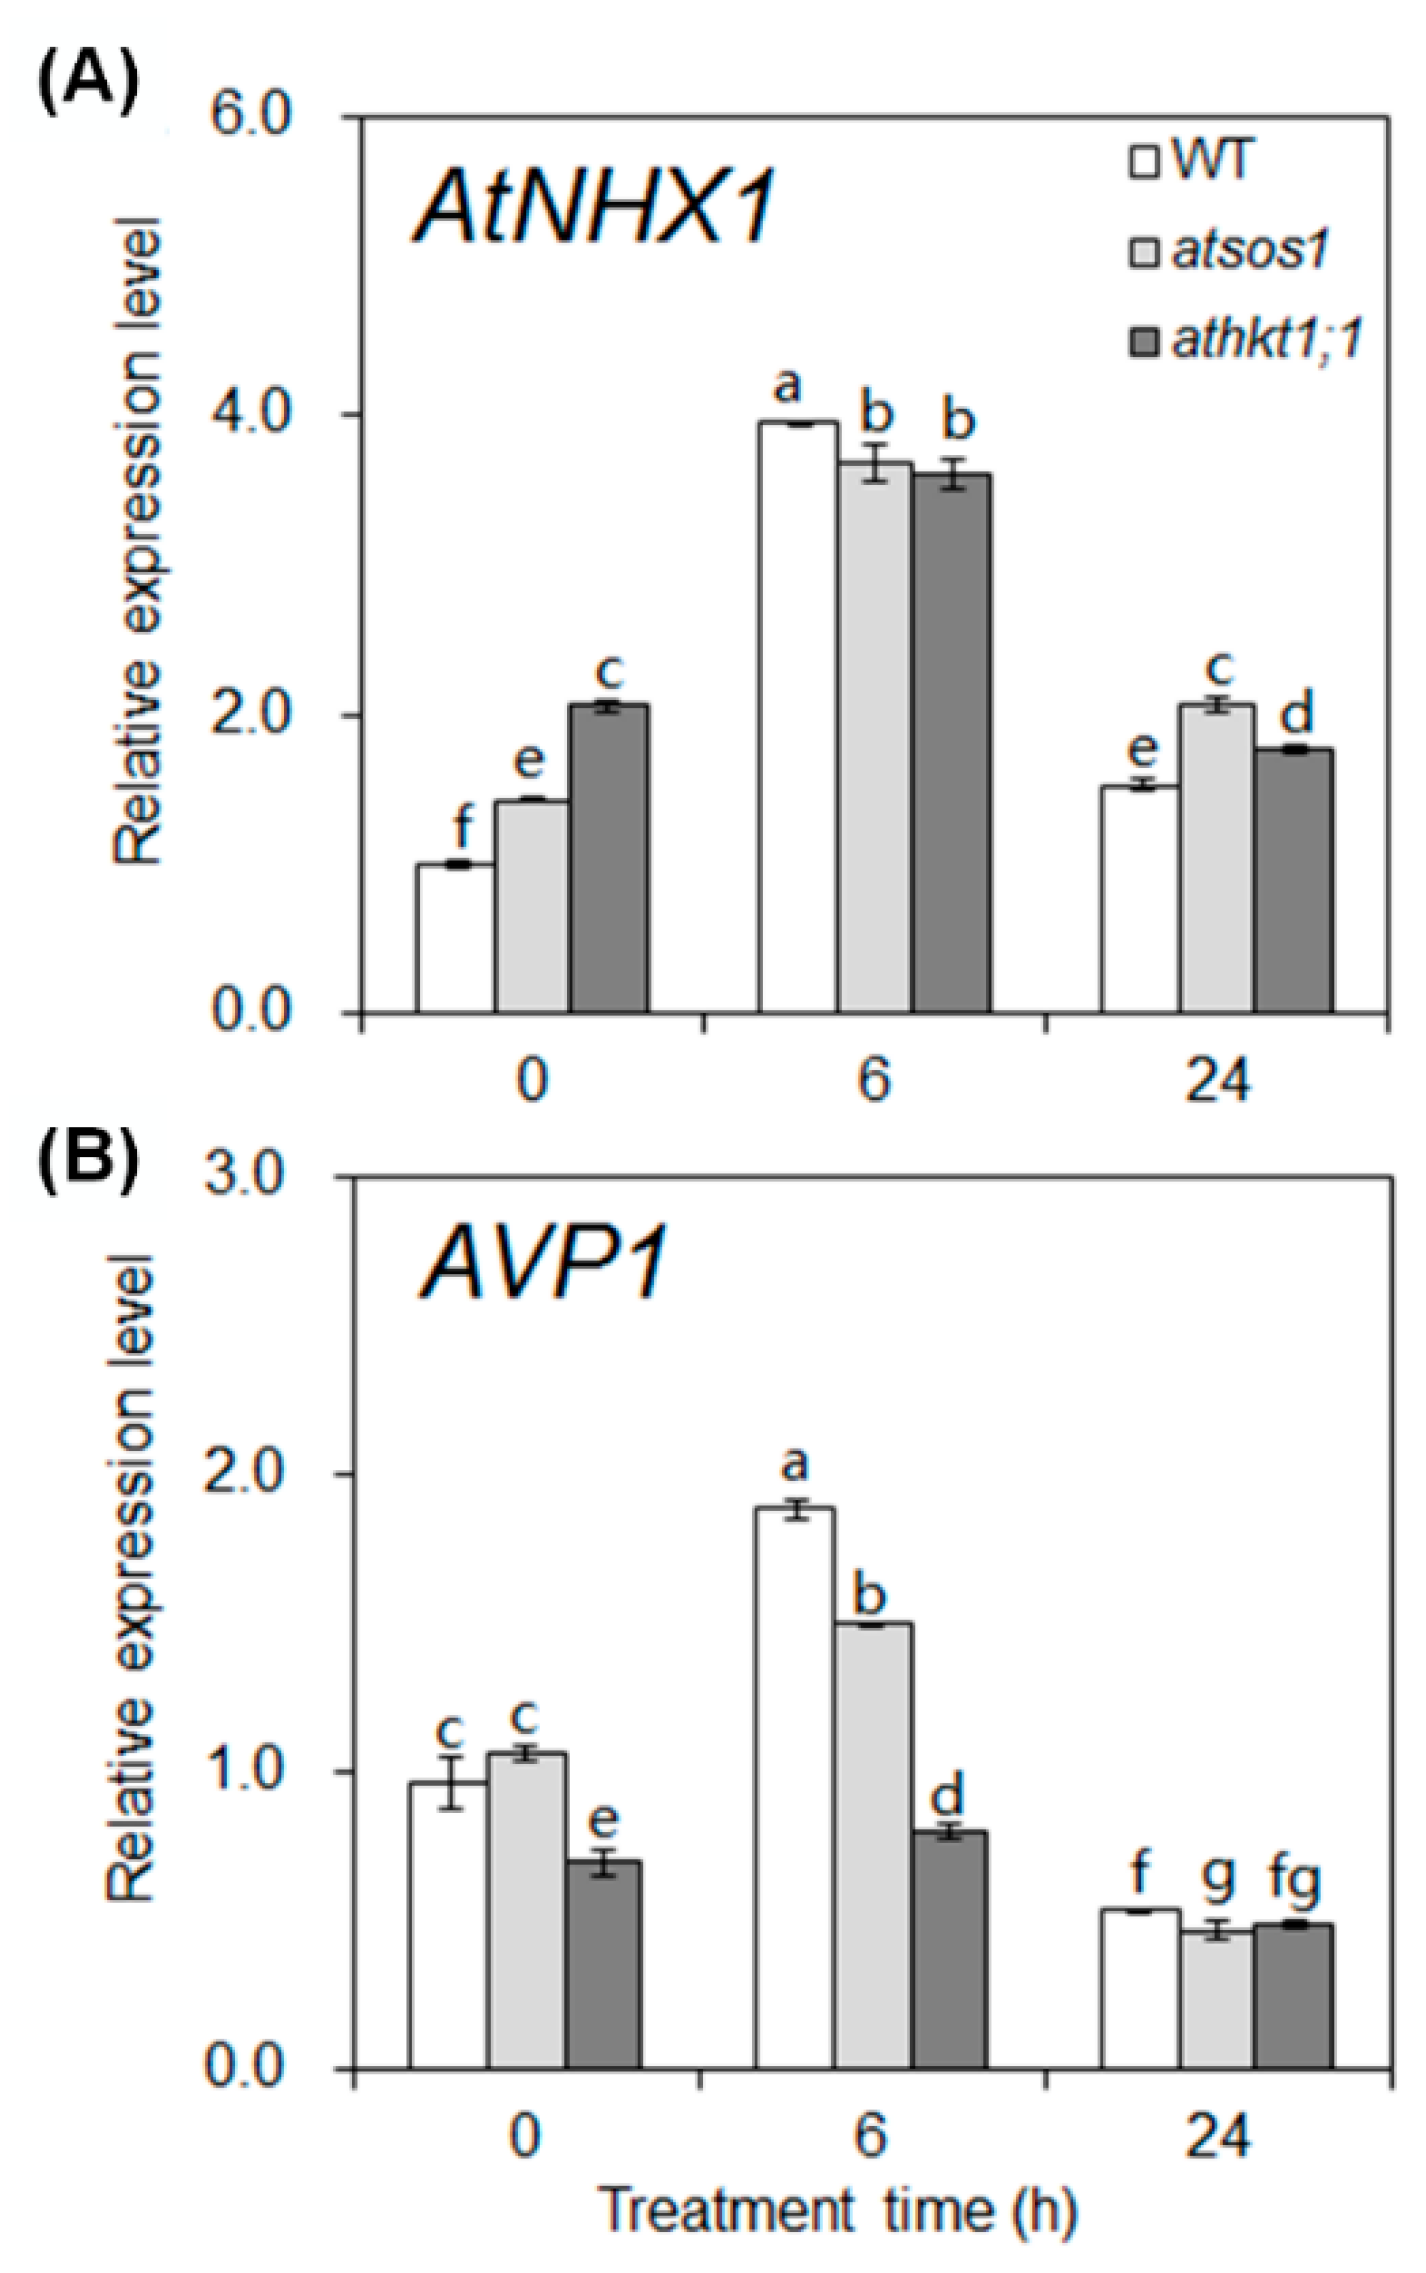
2.4. Mutation of AtHKT1;1 and AtSOS1 Altered the Expression Levels of K+ and Na+ Transporter Genes in Shoots under Salt Stress
3. Discussion
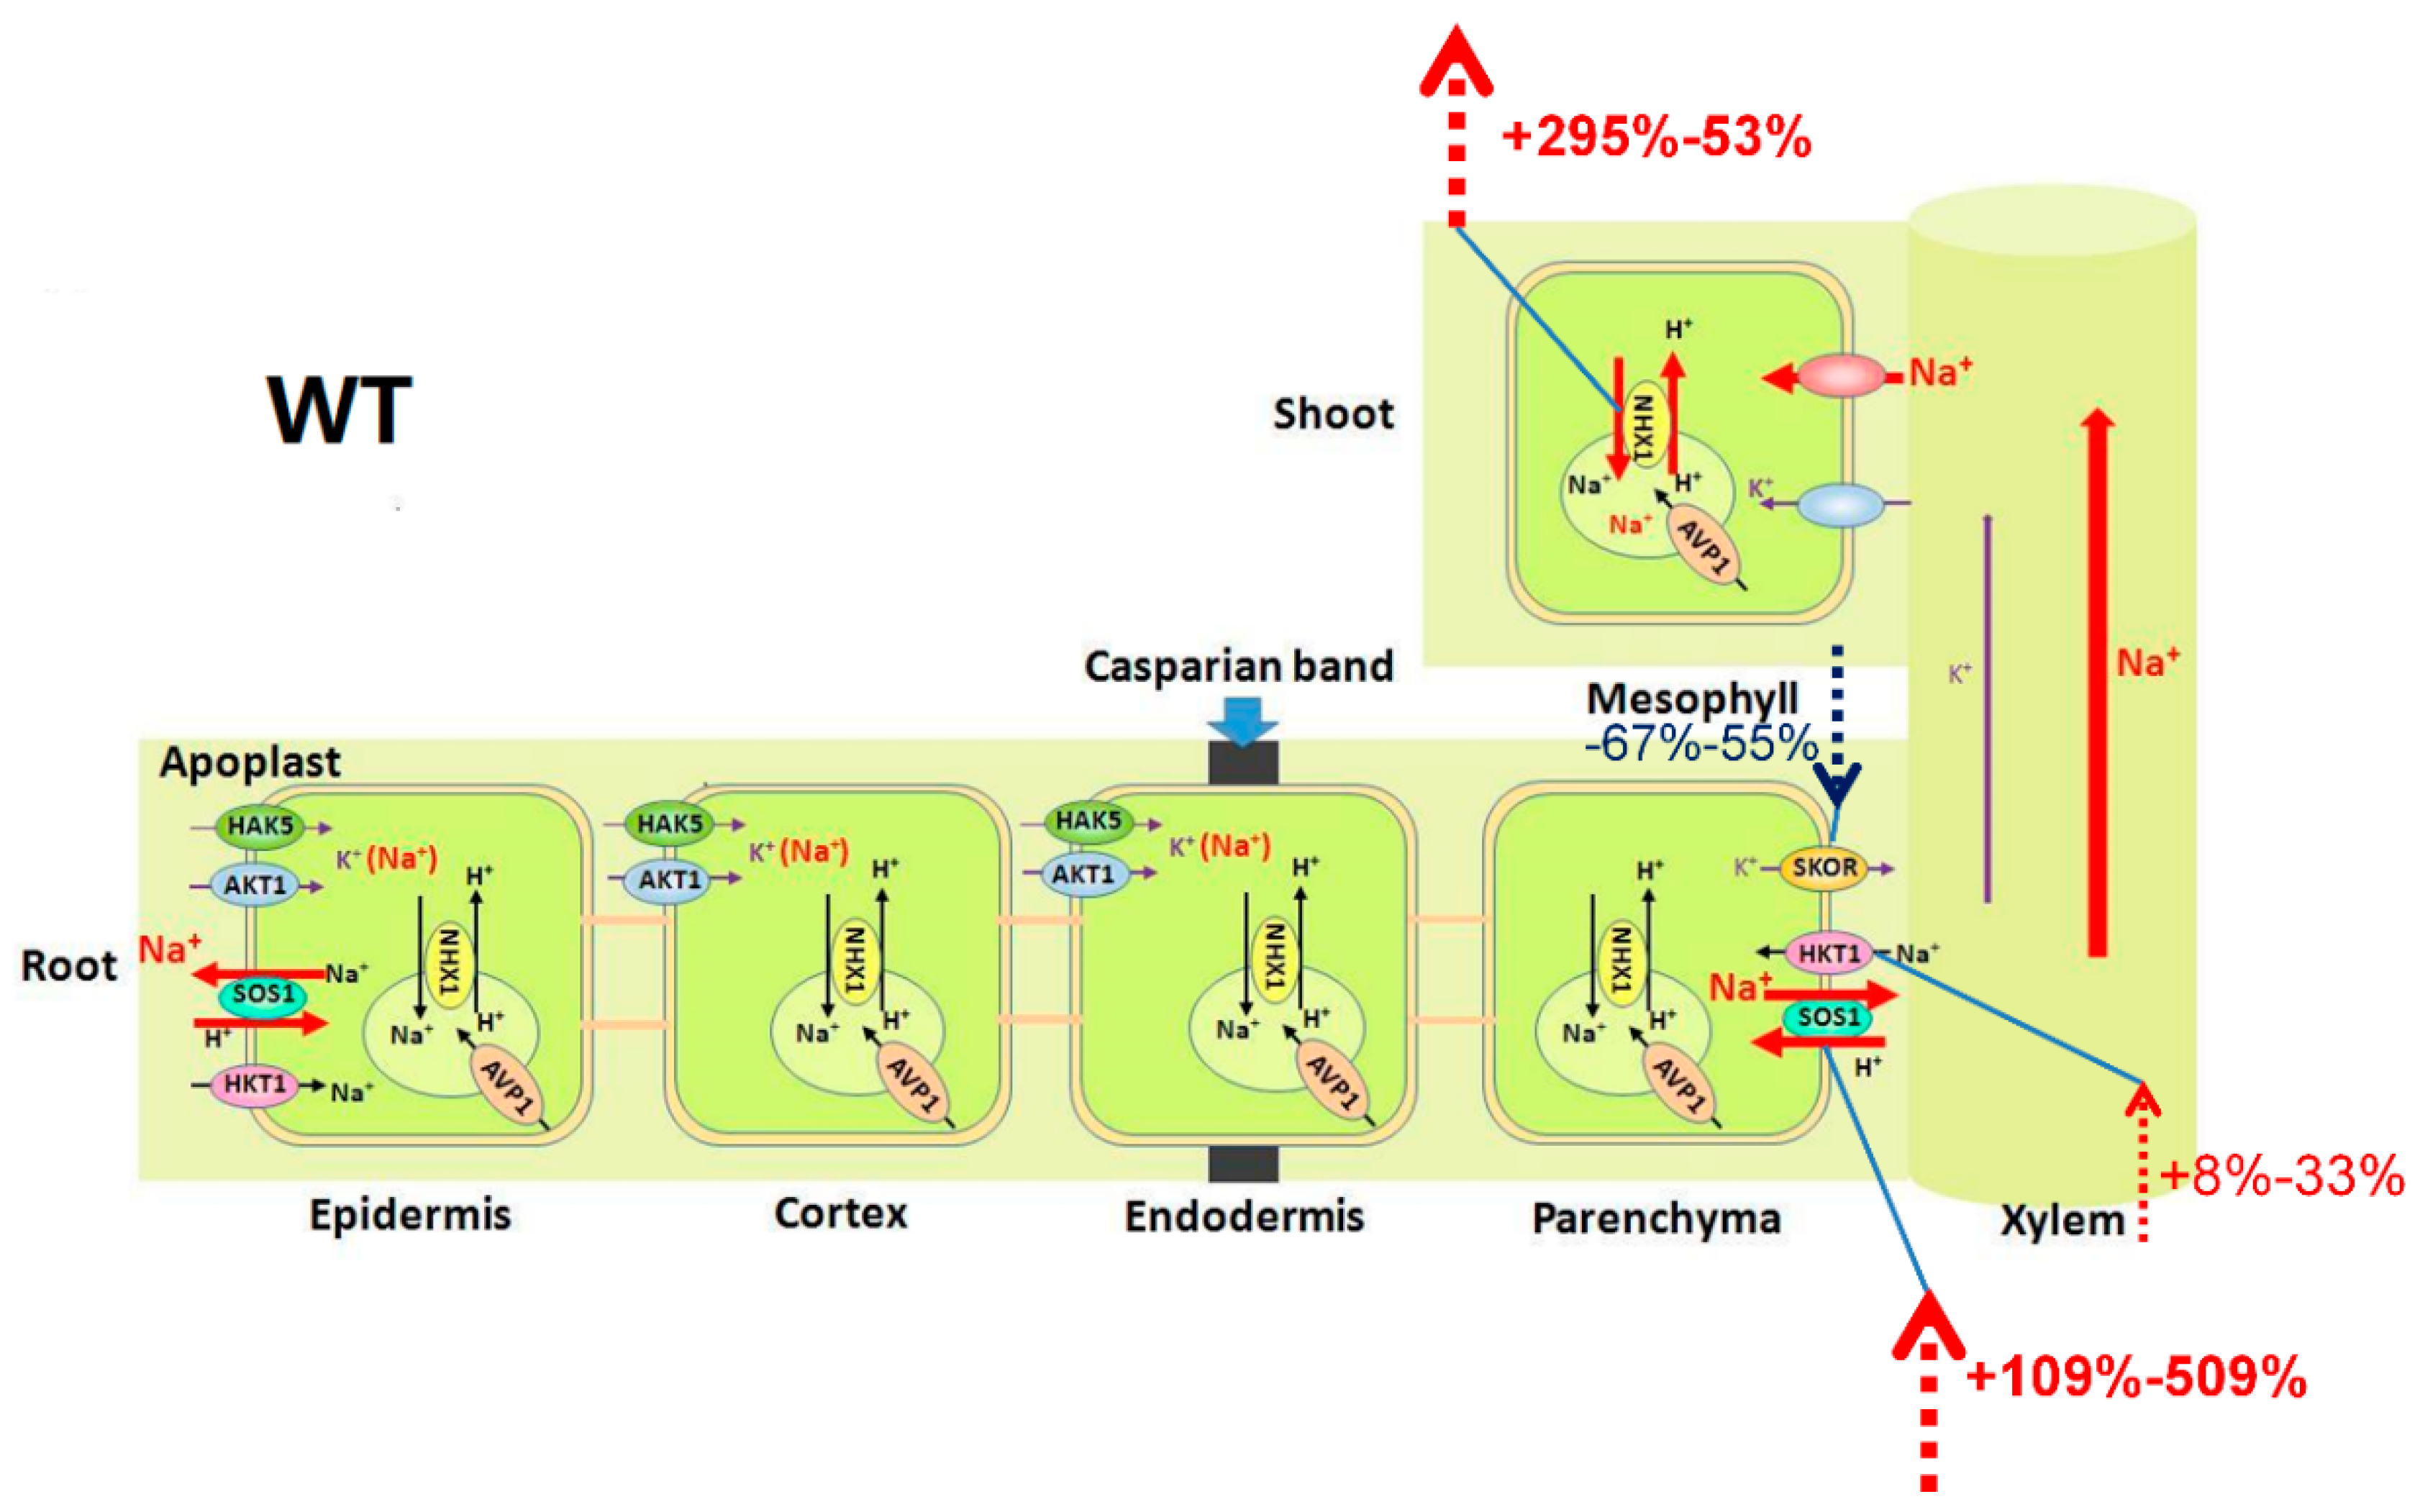
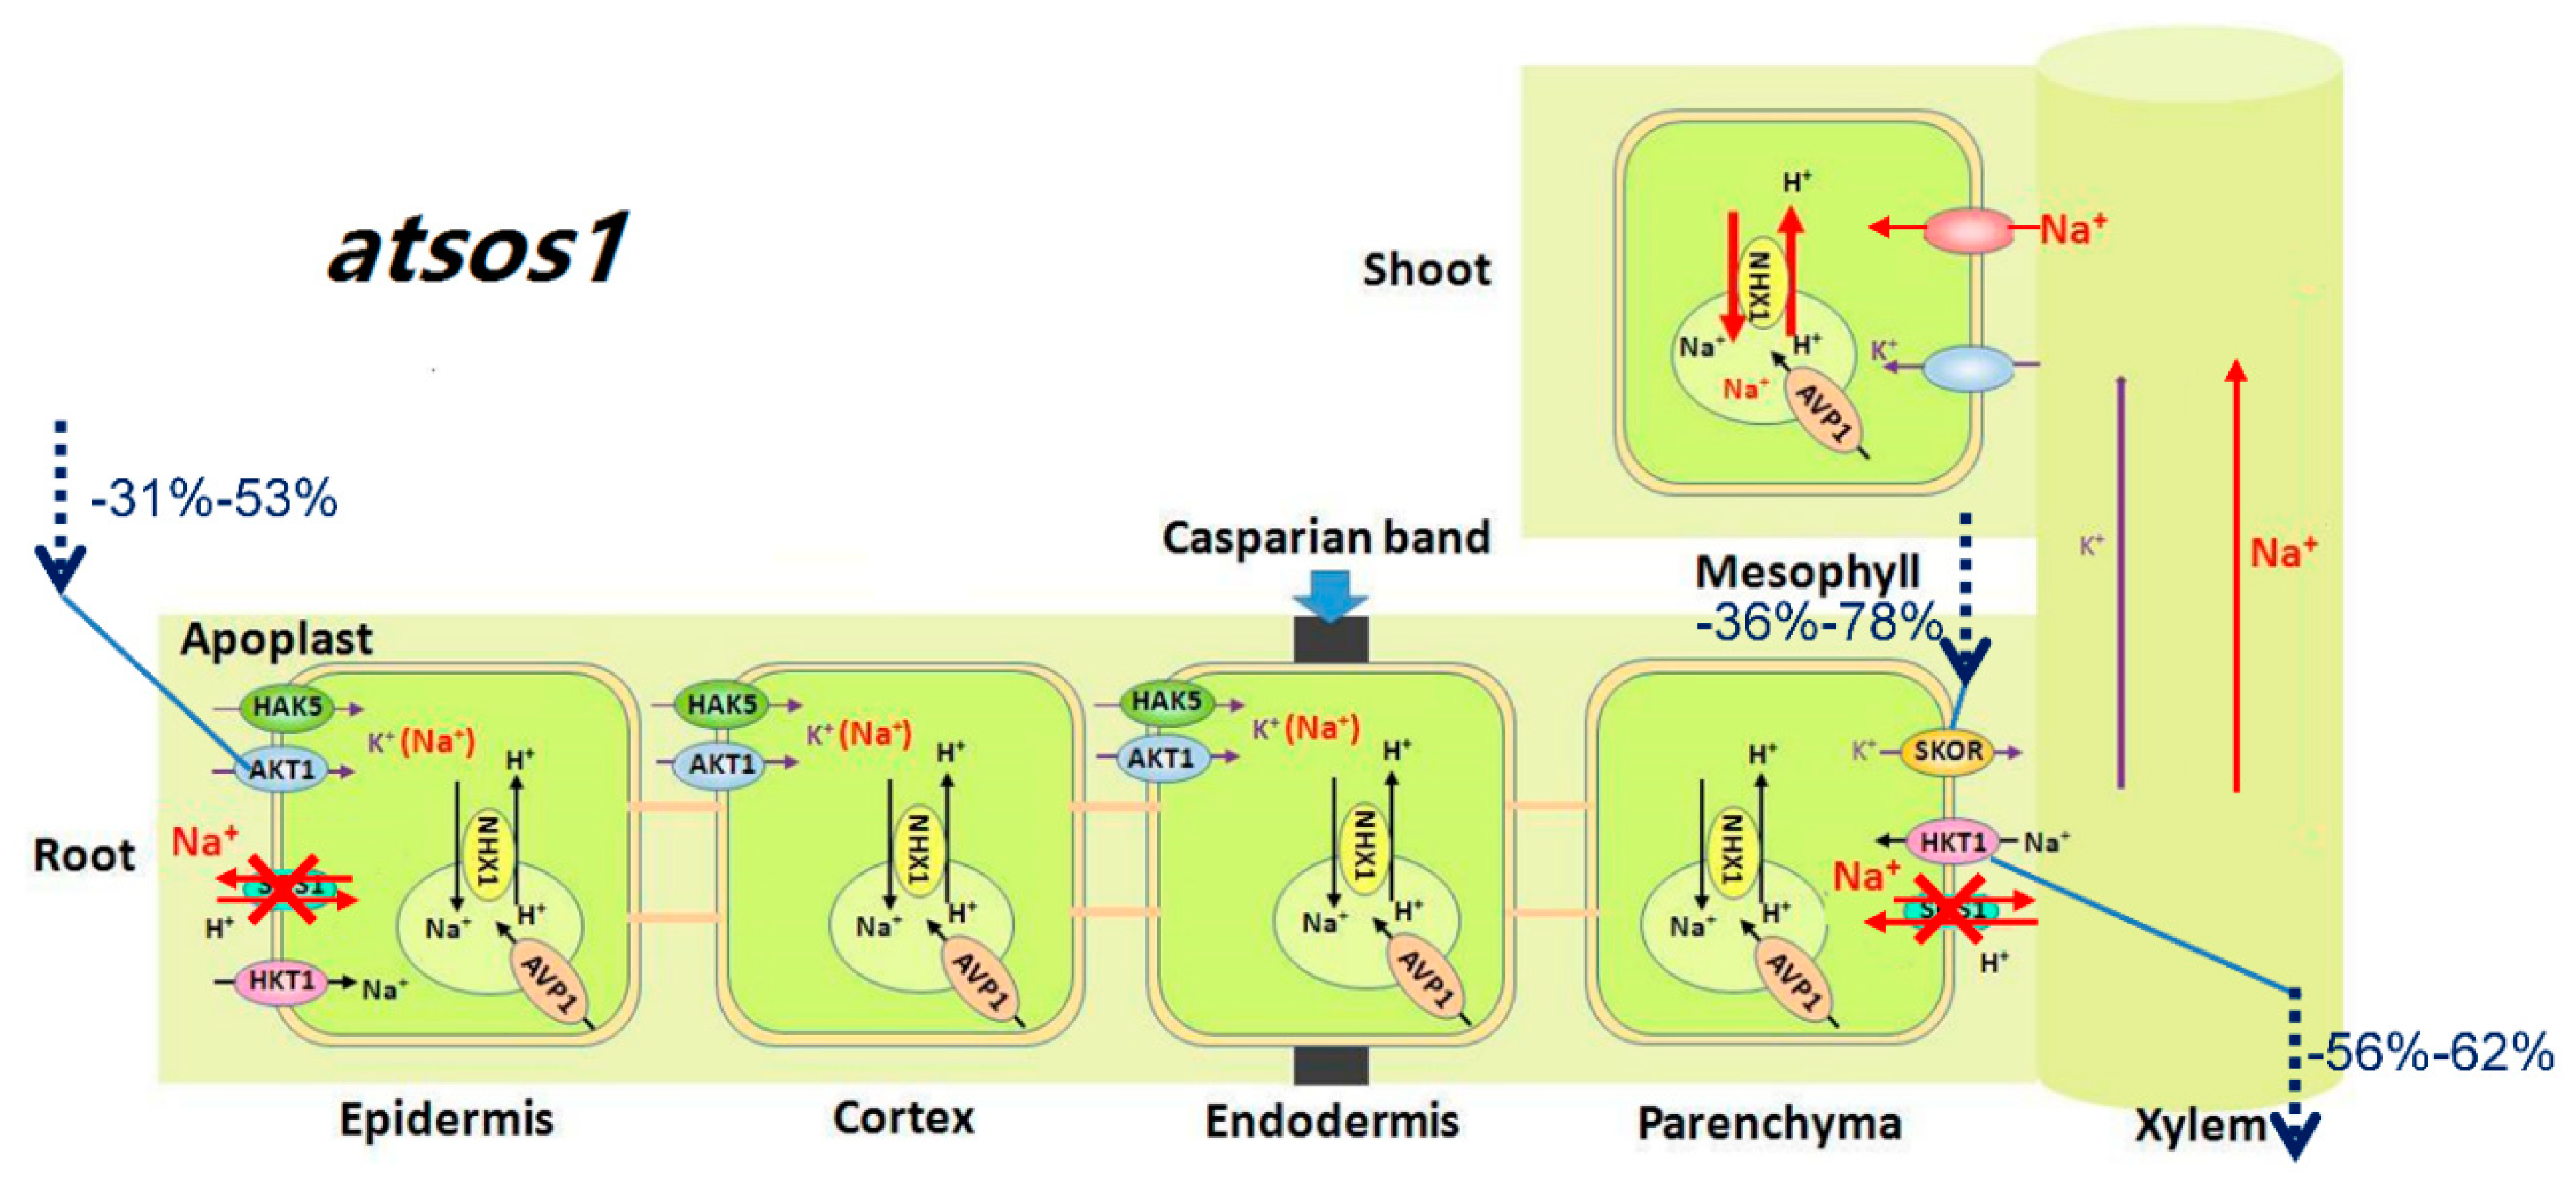
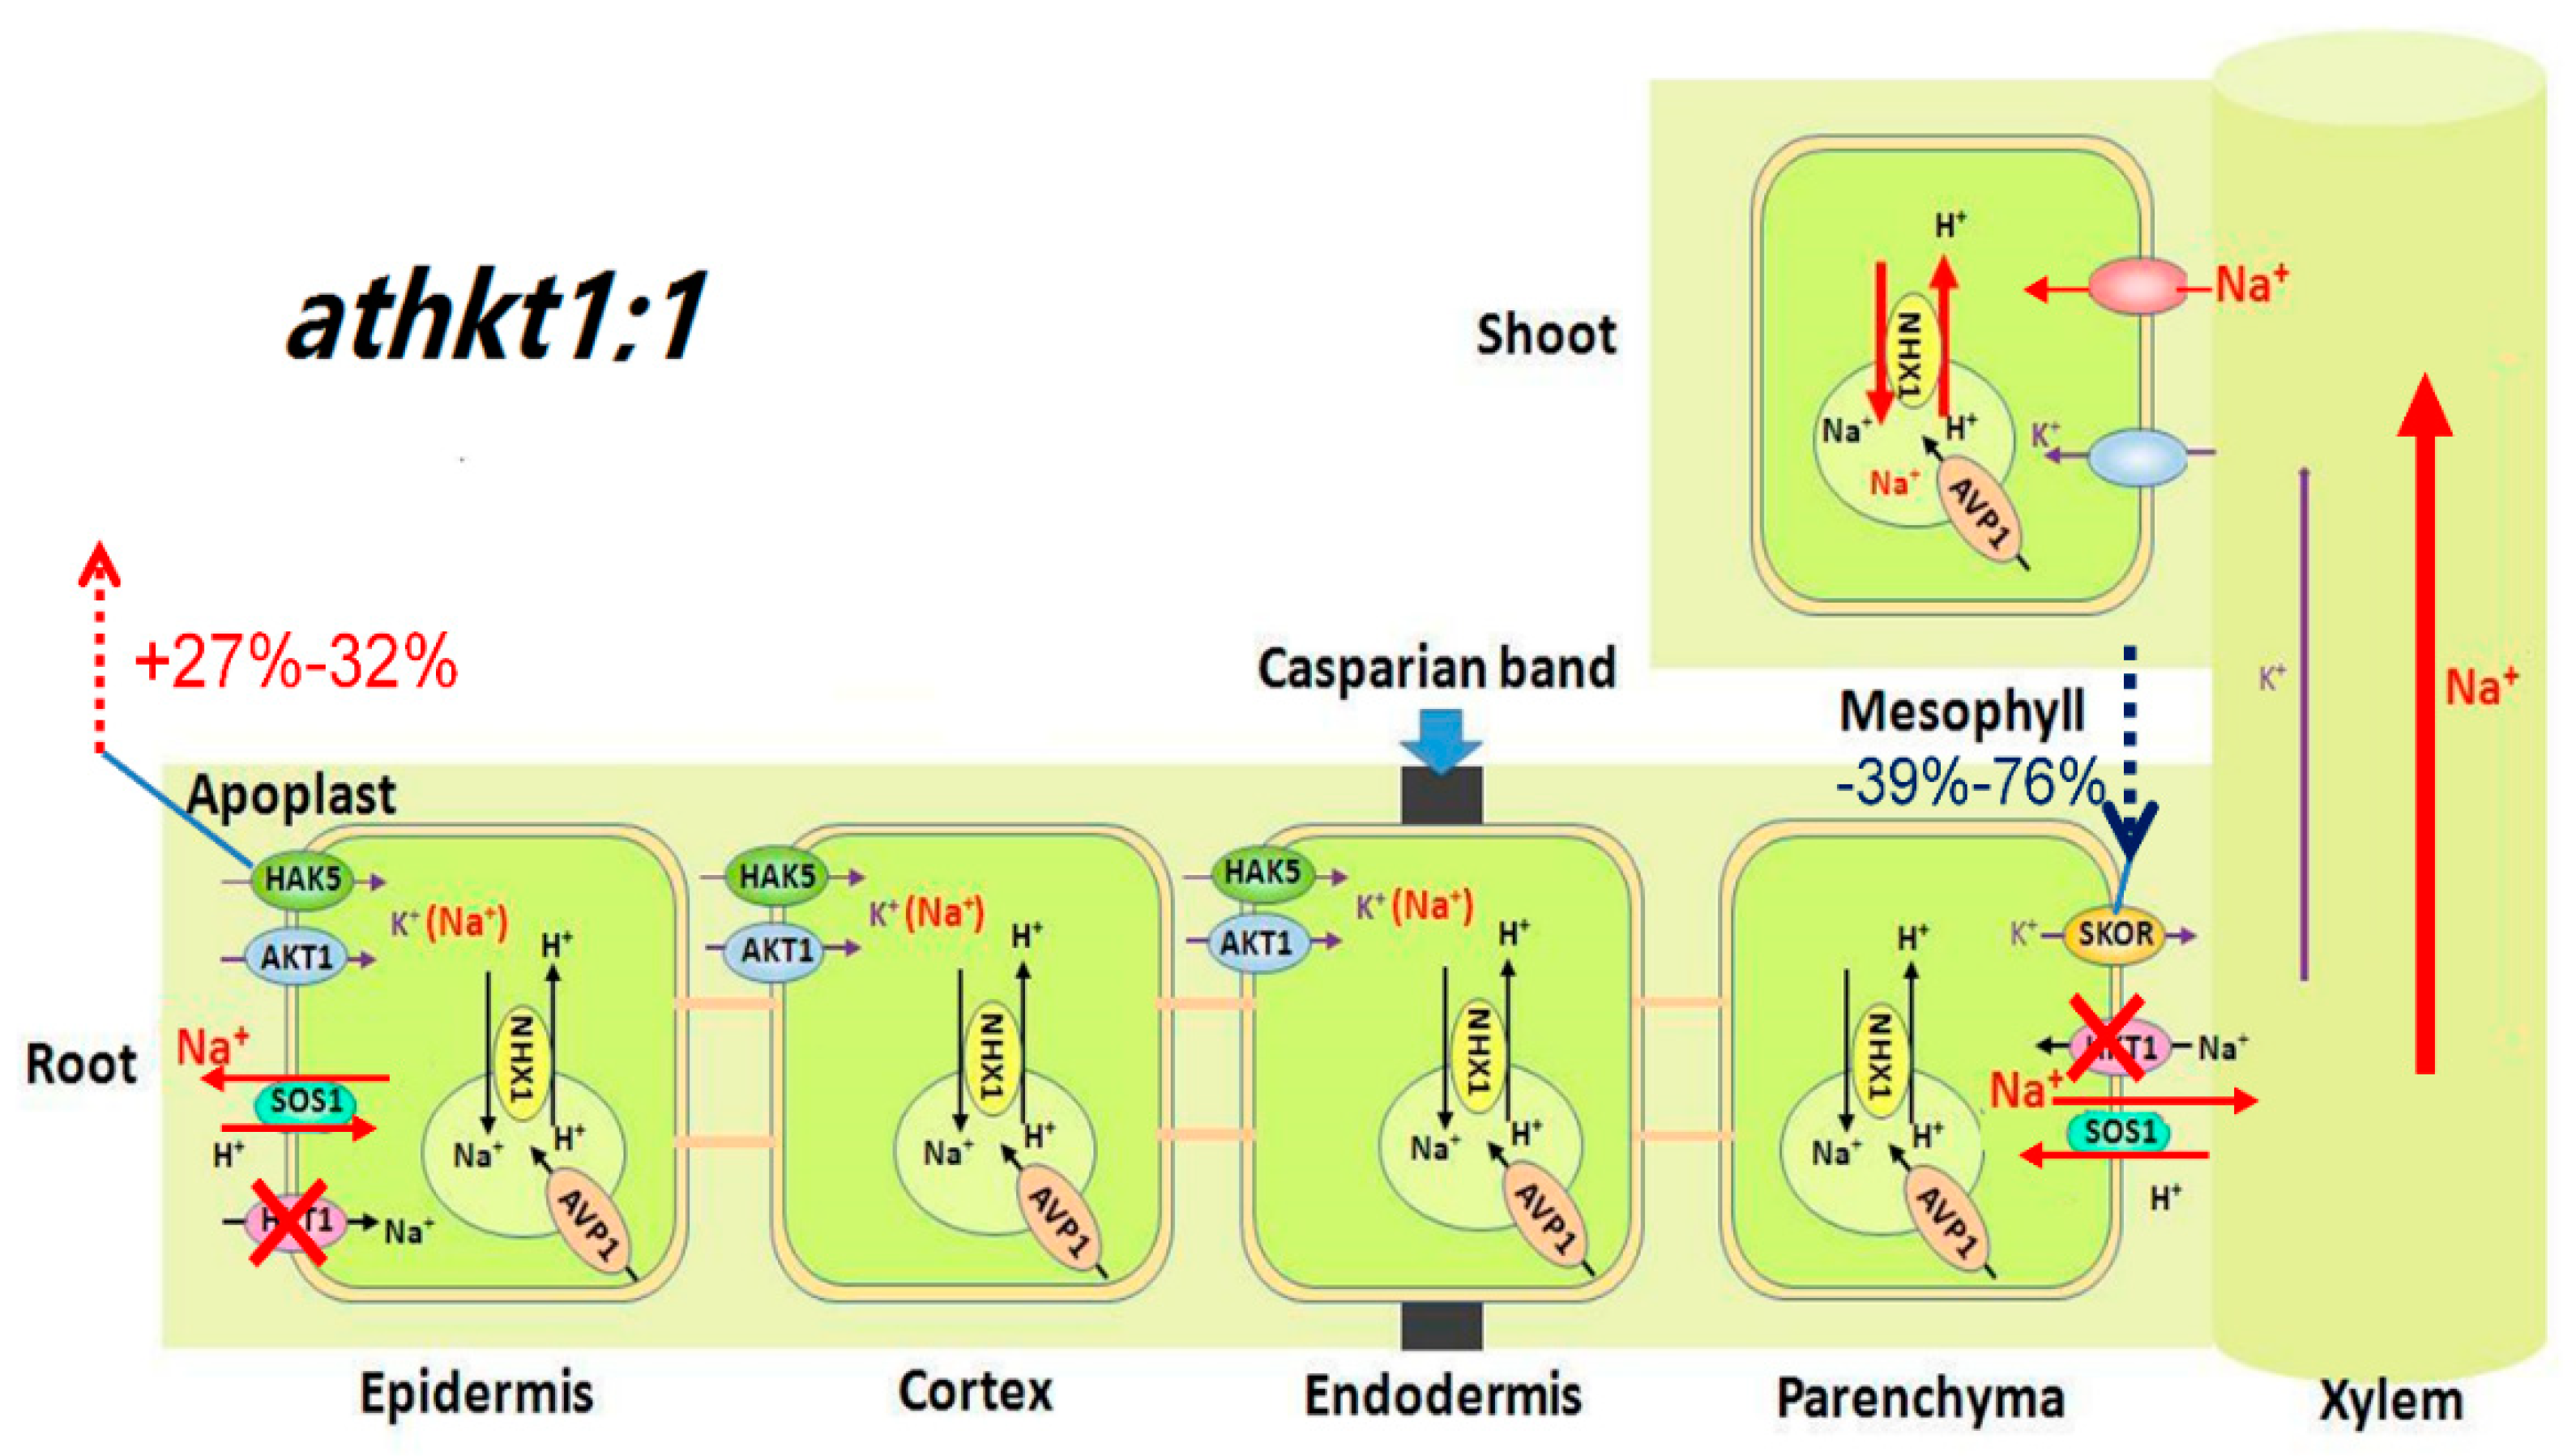
3.1. Coordination of AtHKT1;1 and AtSOS1 Controls Na+ and K+ Homeostasis by Regulating Relevant Transporters
3.2. AtSOS1 Might Be Essential for Normal Growth and Development of A. thaliana with or without Mild Salt Stress
3.3. AtHKT1;1 Might Be the Major Component of Selective Transport Capacity for K+ over Na+ in A. thaliana under Salt Stress
4. Materials and Methods
4.1. Plant Materials and Growth Conditions
4.2. 22Na+ Influx Experiments
4.3. Calculation of Net Na+ and K+ Uptake Rate, Na+ Efflux Rate, Relative Distribution of Na+ and K+ in Tissue, and the Net Selective Absorption and Transport Capacity for K+ over Na+ (SA and ST)
4.4. Analysis of the Relevant Gene Expression Level in Roots and Shoots of Wild Type and Mutants
4.5. Statistical Analysis
5. Conclusions
Supplementary Materials
Author Contributions
Funding
Acknowledgments
Conflicts of Interest
Abbreviations
| AKT | Arabidopsis K+ transporter |
| ANOVA | Analysis of variance |
| AVP | Arabidopsis H+-pyrophosphatase |
| Ct | Threshold cycle |
| HAK | High-affinity K+ transporter |
| HKT | High-affinity K+ transporter |
| NHX | Tonoplast Na+/H+ antiporter |
| PCR | Polymerase chain reaction |
| SE | Standard error |
| SKOR | Stelar K+ outward rectifier |
| SOS1 | Plasma membrane Na+/H+ antiporter |
| WT | Wild type |
References
- Flowers, T.J. Improving crop salt tolerance. J. Exp. Bot. 2004, 55, 307–319. [Google Scholar] [CrossRef] [PubMed] [Green Version]
- Yamaguchi, T.; Blumwald, E. Developing salt-tolerant crop plants: Challenges and opportunities. Trends Plant Sci. 2005, 10, 615–620. [Google Scholar] [CrossRef] [PubMed]
- Shabala, S. Learning from halophytes: Physiological basis and strategies to improve abiotic stress tolerance in crops. Ann. Bot. 2013, 112, 1209–1221. [Google Scholar] [CrossRef] [PubMed]
- Zhu, J.K. Plant salt tolerance. Trends Plant Sci. 2001, 6, 66–71. [Google Scholar] [CrossRef]
- Zhang, J.L.; Flower, T.J.; Wang, S.M. Differentiation of low-affinity Na+ uptake pathways and kinetics of the effects of K+ on Na+ uptake in the halophyte Suaeda maritima. Plant Soil 2013, 368, 629–640. [Google Scholar] [CrossRef]
- Chinnusamy, V.; Zhu, J.H.; Zhu, J.K. Salt stress signaling and mechanisms of plant salt tolerance. Genet. Eng. 2006, 27, 141–177. [Google Scholar]
- Zhang, J.L.; Flowers, T.J.; Wang, S.M. Mechanisms of sodium uptake by roots of higher plants. Plant Soil 2010, 326, 45–60. [Google Scholar] [CrossRef]
- Mian, A.; Oomen, R.J.; Isayenkov, S.; Sentenac, H.; Maathuis, F.J.; Véry, A. Over-expression of an Na+-and K+-permeable HKT transporter in barley improves salt tolerance. Plant J. 2011, 68, 468–479. [Google Scholar] [CrossRef] [PubMed]
- Zimmermann, S.; Sentenac, H. Plant ion channels: From molecular structures to physiological functions. Curr. Opin. Plant Biol. 1992, 2, 477–482. [Google Scholar] [CrossRef]
- Mäser, P.; Thomine, S.; Schroeder, J.I.; Ward, J.M.; Hirschi, K.; Sze, H.; Talke, I.N.; Amtmann, A.; Maathuis, F.J.M.; Sanders, D.; et al. Phylogenetic relationships within cation transporter families of Arabidopsis. Plant Physiol. 2001, 126, 1646–1667. [Google Scholar] [CrossRef] [PubMed]
- Uozumi, N.; Kim, E.J.; Rubio, F.; Yamaguchi, T.; Muto, S.; Tsuboi, A.; Bakker, E.P.; Nakamura, T.; Schroeder, J.I. The Arabidopsis HKT1 gene homolog mediates inward currents in Xenopus laevis oocytes and Na+ uptake in Saccharomyces cerevisiae. Plant Physiol. 2000, 122, 1249–1259. [Google Scholar] [CrossRef] [PubMed]
- Rus, A.; Yokoi, S.; Sharkhuu, A.; Reddy, M.; Lee, B.H.; Matsumoto, T.K.; Koiwa, H.; Zhu, J.K.; Bressan, R.A.; Hasegawa, P.M. AtHKT1 is a salt tolerance determinant that controls Na+ entry into plant roots. PNAS 2001, 98, 14150–14155. [Google Scholar] [CrossRef] [PubMed]
- Zhang, H.M.; Kim, M.S.; Sun, Y.; Dowd, S.E.; Shi, H.Z.; Paré, P.W. Soil bacteria confer plant salt tolerance by tissue-specific regulation of the sodium transporter HKT1. Mol. Plant-Microbe Interac. 2008, 21, 737–744. [Google Scholar] [CrossRef] [PubMed]
- Wang, Q.; Guan, C.; Wang, P.; Lv, M.L.; Ma, Q.; Wu, G.Q.; Bao, A.K.; Zhang, J.L.; Wang, S.M. AtHKT1;1 and AtHAK5 mediate low-affinity Na+ uptake in Arabidopsis thaliana under mild salt stress. Plant Growth Regul. 2015, 75, 615–623. [Google Scholar] [CrossRef]
- Sunarpi; Horie, T.; Motoda, J.; Kubo, M.; Yang, H.; Yoda, K.; Horie, R.; Chan, W.Y.; Leung, H.Y.; Hattori, K.; et al. Enhanced salt tolerance mediated by AtHKT1 transporter-induced Na+ unloading from xylem vessels to xylem parenchyma cells. Plant J. 2005, 44, 928–938. [Google Scholar] [CrossRef] [PubMed]
- Davenport, R.J.; Munoz-Mayor, A.; Jha, D.; Essah, P.A.; Rus, A.; Tester, M. The Na+ transporter AtHKT1 controls retrieval of Na+ from the xylem in Arabidopsis. Plant Cell Environ. 2007, 30, 497–507. [Google Scholar] [CrossRef] [PubMed]
- Møller, I.S.; Gilliham, M.; Jha, D.; Mayo, G.M.; Roy, S.; Coates, J.C.; Haseloff, J.; Tester, M. Shoot Na+ exclusion and increased salinity tolerance engineered by cell type-specific alteration of Na+ transport in Arabidopsis. Plant Cell 2009, 21, 2163–2178. [Google Scholar] [CrossRef] [PubMed]
- Wegner, L.H.; Raschke, K. Ion channels in the xylem parenchyma of barley roots. Plant Physiol. 1994, 105, 799–813. [Google Scholar] [CrossRef] [PubMed]
- Wegner, L.H.; De Boer, A.H. Properties of two outward rectifying channels in root xylem parenchyma cells suggest a role in K+ homeostasis and long-distance signaling. Plant Physiol. 1997, 115, 1707–1719. [Google Scholar] [CrossRef]
- Horie, T.; Hauser, F.; Schroeder, J.I. HKT transporter-mediated salinity resistance mechanisms in Arabidopsis and monocot crop plants. Trends Plant Sci. 2009, 14, 660–668. [Google Scholar] [CrossRef] [PubMed]
- Hauser, F.; Horie, T. A conserved primary salt tolerance mechanism mediated by HKT transporters: A mechanism for sodium exclusion and maintenance of high K+/Na+ ratio in leaves during salinity stress. Plant Cell Environ. 2010, 33, 552–565. [Google Scholar] [CrossRef] [PubMed]
- Shabala, S.; Cuin, T.A.; Pang, J.Y.; Percey, W.; Chen, Z.H.; Conn, S.; Eing, C.; Wengner, L.H. Xylem ionic relations and salinity tolerance in barley. Plant J. 2010, 61, 839–853. [Google Scholar] [CrossRef] [PubMed] [Green Version]
- Gaymard, F.; Pilot, G.; Lacombe, B.; Bouchez, D.; Bruneau, D.; Boucherez, J.; Nicole Michaux-Ferrière, N.; Thibaud, J.B.; Sentenac, H. Identification and disruption of a plant shaker-like outward channel involved in K+ release into the xylem sap. Cell 1998, 94, 647–655. [Google Scholar] [CrossRef]
- Liu, K.; Li, L.; Luan, S. Intracellular K+ sensing of SKOR, a Shaker-type K+ channel from Arabidopsis. Plant J. 2006, 46, 260–268. [Google Scholar] [CrossRef] [PubMed]
- Zhu, J.K. Salt and drought stress signal transduction in plants. Annu. Rev. Plant Biol. 2002, 53, 247–273. [Google Scholar] [CrossRef] [PubMed]
- Munns, R.; Tester, M. Mechanisms of salinity tolerance. Annu. Rev. Plant Biol. 2008, 59, 651–681. [Google Scholar] [CrossRef] [PubMed]
- Cuin, T.A.; Bose, J.; Stefano, G.; Jha, D.; Tester, M.; Mancuso, S.; Shabala, S. Assessing the role of root plasma membrane and tonoplast Na+/H+ exchangers in salinity tolerance in wheat: In planta quantification methods. Plant Cell Environ. 2001, 34, 947–961. [Google Scholar] [CrossRef] [PubMed]
- Shi, H.Z.; Quintero, F.J.; Pardo, J.M.; Zhu, J.K. The putative plasma membrane Na+/H+ antiporter SOS1 controls long-distance Na+ transport in plants. Plant Cell 2002, 14, 465–477. [Google Scholar] [CrossRef] [PubMed]
- Qi, Z.; Spalding, E.P. Protection of plasma membrane K+ transport by the salt overly sensitive1 Na+-H+ antiporter during salinity stress. Plant Physiol. 2004, 136, 2548–2555. [Google Scholar] [CrossRef] [PubMed]
- Oh, D.H.; Lee, S.Y.; Bressan, R.A.; Yun, D.J.; Bohnert, H.J. Intracellular consequences of SOS1 deficiency during salt stress. J. Exp. Bot. 2010, 61, 1205–1213. [Google Scholar] [CrossRef] [PubMed] [Green Version]
- Wang, Q.; Guan, C.; Wang, S.M. Coordination of AtHKT1;1 and AtSOS1 facilitates Na+ and K+ homeostasis in Arabidopsis thaliana under salt stress. J. Plant Biol. 2014, 57, 282–290. [Google Scholar] [CrossRef]
- Bartels, D.; Sunkar, R. Drought and salt tolerance in plants. Crit. Rev. Plant Sci. 2005, 24, 23–58. [Google Scholar] [CrossRef]
- Barragán, V.; Leidi, E.O.; Andrés, Z.; Rubio, L.; Luca, A.D.; Fernández, J.A.; Cubero, B.; Pardo, J.M. Ion exchangers NHX1 and NHX2 mediate active potassium uptake into vacuoles to regulate cell turgor and stomatal function in Arabidopsis. Plant Cell 2012, 24, 1127–1142. [Google Scholar] [CrossRef] [PubMed]
- Bassil, E.; Tajima, H.; Liang, Y.C.; Ohto, M.; Ushijima, K.; Nakano, R.; Esumi, T.; Coku, A.; Beimonte, M.; Blumwald, E. The Arabidopsis Na+/H+ antiporters NHX1 and NHX2 control vacuolar pH and K+ homeostasis to regulate growth, flower development, and reproduction. Plant Cell 2011, 23, 3482–3497. [Google Scholar] [CrossRef] [PubMed]
- Brett, C.L.; Donowitz, M.; Rao, R. Evolutionary origins of eukaryotic sodium/proton exchangers. Am. J. Physiol. Cell Physiol. 2005, 288, 223–239. [Google Scholar] [CrossRef] [PubMed]
- Pardo, J.M.; Cubero, B.; Leidi, E.O.; Quintero, F.J. Alkali cation exchangers: Roles in cellular homeostasis and stress tolerance. J. Exp. Bot. 2006, 57, 1181–1199. [Google Scholar] [CrossRef] [PubMed]
- Rodriguez-Rosales, M.P.; Galvez, F.J.; Huertas, R.; Aranda, M.N.; Baghour, M.; Cagnac, O.; Venema, K. Plant NHX cation/proton antiporters. Plant Signal. Behav. 2009, 4, 265–276. [Google Scholar] [CrossRef] [PubMed] [Green Version]
- Bassil, E.; Ohto, M.A.; Esumi, T.; Tajima, H.; Zhu, Z.; Cagnac, O.; Belmonte, M.; Peleg, Z.; Yamaguchi, T.; Blumwald, E. The Arabidopsis intracellular Na+/H+ antiporters NHX5 and NHX6 are endosome associated and necessary for plant growth and development. Plant Cell 2011, 23, 224–239. [Google Scholar] [CrossRef] [PubMed]
- Yokoi, S.; Quintero, F.J.; Cubero, B.; Ruiz, M.T.; Bressan, R.A.; Hasegawa, P.M.; Pardo, J.M. Differential expression and function of Arabidopsis thaliana NHX Na+/H+ antiporters in the salt stress response. Plant J. 2002, 30, 529–539. [Google Scholar] [CrossRef] [PubMed]
- Aharon, G.S.; Apse, M.P.; Duan, S.L.; Hua, X.J.; Blumwald, E. Characterization of a family of vacuolar Na+/H+ antiporters in Arabidopsis thaliana. Plant Soil 2003, 253, 245–256. [Google Scholar] [CrossRef]
- Venema, K.; Quintero, F.J.; Pardo, J.M.; Donaire, J.P. The Arabidopsis Na+/H+ exchanger AtNHX1 catalyzes low affinity Na+ and K+ transport in reconstituted liposomes. J. Biol. Chem. 2002, 277, 2413–2418. [Google Scholar] [CrossRef] [PubMed]
- Yamaguchi, T.; Aharon, G.S.; Sottosanto, J.B.; Blumwald, E. Vacuolar Na+/H+ antiporter cation selectivity is regulated by calmodulin from within the vacuole in a Ca2+- and pH-dependent manner. Proc. Natl. Acad. Sci. USA 2005, 102, 16107–16112. [Google Scholar] [CrossRef] [PubMed]
- Hernández, A.; Jiang, X.; Cubero, B.; Nieto, P.M.; Bressan, R.A.; Hasegawa, P.M.; Pardo, J.M. Mutants of the Arabidopsis thaliana cation/H+ antiporter AtNHX1 conferring increased salt tolerance in yeast: The endosome/prevacuolar compartment is a target for salt toxicity. J. Biol. Chem. 2009, 284, 14276–14285. [Google Scholar]
- Blumwald, E.; Aharon, G.S.; Apse, M.P. Sodium transport in plant cells. Biochim. Biophys. Acta 2000, 1465, 140–151. [Google Scholar] [CrossRef] [Green Version]
- Guo, Q.; Wang, P.; Ma, Q.; Zhang, J.L.; Bao, A.K.; Wang, S.M. Selective transport capacity for K+ over Na+ is linked to the expression levels of PtSOS1 in halophyte Puccimellia tenuiflora. Funct. Plant Biol. 2012, 39, 1047–1057. [Google Scholar] [CrossRef]
- Olías, R.; Eljakaoui, Z.; Li, J.; De Morales, P.A.; Marín-Manzano, M.C.; Pardo, J.M.; Belver, A. The palsma membrane Na+/H+ antiporter SOS1 is essential for salt tolerance in tomato and effects the partitioning of Na+ between plant organs. Plant Cell Environ. 2009, 32, 904–916. [Google Scholar] [CrossRef] [PubMed]
- Hirsch, R.E.; Lewis, B.D.; Spalding, E.P.; Sussman, M.R. A role for the AKT1 potassium channel in plant nutrition. Science 1998, 280, 918–921. [Google Scholar] [CrossRef] [PubMed]
- Gierth, M.; Mäser, P.; Schroeder, J.I. The potassium transporter AtHAK5 functions in K+ deprivation-induced high-affinity K+ uptake and AKT1 K+ channel contribution to K+ uptake kinetics in Arabidopsis roots. Plant Physiol. 2005, 137, 1105–1114. [Google Scholar] [CrossRef] [PubMed]
- Rubio, F.; Alemán, F.; Nieves-Cordones, M.; Martinez, V. Studies on Arabidopsis athak5, atakt1 double mutants disclose the range of concentrations at which AtHAK5, AtAKT1 and unknown systems mediate K+ uptake. Physiol. Plant. 2010, 139, 220–228. [Google Scholar] [CrossRef] [PubMed]
- Rus, A.; Lee, B.; Muñoz-Mayor, A.; Sharkhuu, A.; Miura, K.; Zhu, J.K.; Bressan, R.A.; Hasegawa, P.M. AtHKT1 facilitates Na+ homeostasis and K+ nutrition in planta. Plant Physiol. 2004, 136, 2500–2511. [Google Scholar] [CrossRef] [PubMed]
- Essah, P.A.; Davenport, R.; Tester, M. Sodium influx and accumulation in Arabidopsis. Plant Physiol. 2003, 133, 307–318. [Google Scholar] [CrossRef] [PubMed]
- Wang, S.M.; Zhang, J.L.; Flowers, T.J. Low-affinity Na+ uptake in the halophyte Suaeda maritima. Plant Physiol. 2007, 145, 559–571. [Google Scholar] [CrossRef] [PubMed]
- Wang, C.M.; Zhang, J.L.; Liu, X.S.; Li, Z.; Wu, G.Q.; Cai, J.Y.; Flowers, T.J.; Wang, S.M. Puccinellia tenuiflora maintains a low Na+ level under salinity by limiting unidirectional Na+ influx resulting in a high selectivity for K+ over Na+. Plant Cell Environ. 2009, 32, 486–496. [Google Scholar] [CrossRef] [PubMed]
- Yuan, H.J.; Ma, Q.; Wu, G.Q.; Wang, P.; Hu, J.; Wang, S.M. ZxNHX controls Na+ and K+ homeostasis at the whole-plant level in Zygophyllum xanthoxylum through feedback regulation of the expression of genes involved in their transport. Ann. Bot. 2015, 115, 495–507. [Google Scholar] [CrossRef] [PubMed]
- Ma, Q.; Li, Y.X.; Yuan, H.J.; Hu, J.; Wei, L.; Bao, A.K.; Zhang, J.L.; Wang, S.M. ZxSOS1 is essential for long-distance transport and spatial distribution of Na+ and K+ in the xerophyte Zygophyllun xanthoxylum. Plant Soil 2014, 374, 661–676. [Google Scholar] [CrossRef]
- Wang, S.M.; Zhao, G.Q.; Gao, Y.S.; Tang, Z.C.; Zhang, C.L. Puccinellia tenuiflora exhibits stronger selectivity for K+ over Na+ than wheat. J. Plant Nutr. 2004, 27, 1841–1857. [Google Scholar] [CrossRef]
- Livak, K.J.; Schmittgen, T.D. Analysis of relative gene expression data using real-time quantitative PCR and the 2−∆∆Ct Method. Methods 2001, 25, 402–408. [Google Scholar] [CrossRef] [PubMed]


© 2019 by the authors. Licensee MDPI, Basel, Switzerland. This article is an open access article distributed under the terms and conditions of the Creative Commons Attribution (CC BY) license (http://creativecommons.org/licenses/by/4.0/).
Share and Cite
Wang, Q.; Guan, C.; Wang, P.; Ma, Q.; Bao, A.-K.; Zhang, J.-L.; Wang, S.-M. The Effect of AtHKT1;1 or AtSOS1 Mutation on the Expressions of Na+ or K+ Transporter Genes and Ion Homeostasis in Arabidopsis thaliana under Salt Stress. Int. J. Mol. Sci. 2019, 20, 1085. https://doi.org/10.3390/ijms20051085
Wang Q, Guan C, Wang P, Ma Q, Bao A-K, Zhang J-L, Wang S-M. The Effect of AtHKT1;1 or AtSOS1 Mutation on the Expressions of Na+ or K+ Transporter Genes and Ion Homeostasis in Arabidopsis thaliana under Salt Stress. International Journal of Molecular Sciences. 2019; 20(5):1085. https://doi.org/10.3390/ijms20051085
Chicago/Turabian StyleWang, Qian, Chao Guan, Pei Wang, Qing Ma, Ai-Ke Bao, Jin-Lin Zhang, and Suo-Min Wang. 2019. "The Effect of AtHKT1;1 or AtSOS1 Mutation on the Expressions of Na+ or K+ Transporter Genes and Ion Homeostasis in Arabidopsis thaliana under Salt Stress" International Journal of Molecular Sciences 20, no. 5: 1085. https://doi.org/10.3390/ijms20051085