Article

Identification of Candidate Ergosterol-Responsive Proteins Associated with the Plasma Membrane of Arabidopsis thaliana

Department of Biochemistry, University of Johannesburg, Auckland Park, Johannesburg 2006, South Africa
*
Author to whom correspondence should be addressed.
Int. J. Mol. Sci. 2019, 20(6), 1302; https://doi.org/10.3390/ijms20061302
Submission received: 27 January 2019 / Revised: 23 February 2019 / Accepted: 3 March 2019 / Published: 14 March 2019
(This article belongs to the Special Issue Plant Proteomic Research 2.0)

Abstract

:
The impact of fungal diseases on crop production negatively reflects on sustainable food production and overall economic health. Ergosterol is the major sterol component in fungal membranes and regarded as a general elicitor or microbe-associated molecular pattern (MAMP) molecule. Although plant responses to ergosterol have been reported, the perception mechanism is still unknown. Here, Arabidopsis thaliana protein fractions were used to identify those differentially regulated following ergosterol treatment; additionally, they were subjected to affinity-based chromatography enrichment strategies to capture and categorize ergosterol-interacting candidate proteins using liquid chromatography coupled with tandem mass spectrometry (LC-MS/MS). Mature plants were treated with 250 nM ergosterol over a 24 h period, and plasma membrane-associated fractions were isolated. In addition, ergosterol was immobilized on two different affinity-based systems to capture interacting proteins/complexes. This resulted in the identification of defense-related proteins such as chitin elicitor receptor kinase (CERK), non-race specific disease resistance/harpin-induced (NDR1/HIN1)-like protein, Ras-related proteins, aquaporins, remorin protein, leucine-rich repeat (LRR)- receptor like kinases (RLKs), G-type lectin S-receptor-like serine/threonine-protein kinase (GsSRK), and glycosylphosphatidylinositol (GPI)-anchored protein. Furthermore, the results elucidated unknown signaling responses to this MAMP, including endocytosis, and other similarities to those previously reported for bacterial flagellin, lipopolysaccharides, and fungal chitin.

1. Introduction

Plants lack an adaptive immune system and solely depend on a multi-complex innate immunity to defend themselves. The first line of defense occurs on the plant cell surface, where membrane-bound pattern recognition receptors (PRRs) recognize conserved motifs within microbes. These microbe-associated molecular patterns (MAMPs) are typically essential components for microorganism functioning and include the bacterial flagellin epitope, flg22. This MAMP is recognized by the PRR receptor, flagellin sensitive 2 (FLS2), which was proven by showing that mutated epitope residues did not lead to flagellin perception but instead, susceptibility and infection was observed [1,2]. Similarly, a lipopolysaccharide (LPS) receptor was identified in the Brassicaceae family. It was found that Arabidopsis thaliana detected LPS of Xanthomonas campestris and Pseudomonas species using a bulb-type (B-type) lectin S-domain (SD)-1 receptor like kinase (RLK) termed lipooligosaccharide-specific reduced elicitation (LORE) [3]. The recognition of MAMPs by PRRs leads to activation of the primary defense termed microbe-triggered immunity (MTI). Due to the co-evolution of both microbes and host, several organisms have the ability to suppress MTI components by releasing virulent molecules called effectors, which leads to effector-triggered susceptibility (ETS). This marks the second line of defense, known as effector-triggered immunity (ETI), where these effectors are recognized by intracellular nucleotide-binding leucine-rich repeat (NB-LRR) proteins [4,5,6]. Subsequent processes include the transcription of defense genes and expression of pathogenesis-related (PR) proteins. General cellular events associated with MTI and ETI include changes in cytoplasmic Ca2+ levels, activation of mitogen-activated protein kinase (MAPK) cascades, bursts of reactive oxygen species (ROS) and nitric oxide (NO), deposition of callose to reinforce the cell wall, production of anti-microbial compounds such as phytoalexins, and often, localized cell death [4,7,8,9,10].
Currently, crop yield and food security are global concerns due to often devastating fungal–plant interactions [11], which also impact economies, particularly those of third world countries. Fungal MAMP molecules such as chitin and β-glucan have been shown to possess a common elicitor activity in various hosts irrespective of the different molecular structures. Here, the MAMP specific to this investigation is ergosterol, which is the major sterol component of the phospholipid bilayer of fungal cell membranes and functions in membrane stability and signaling. Ergosterol is found in several pathogens such as Cladosporium fulvum and Botrytis cinerea, but surprisingly some biotrophic fungi, including the powdery mildew (Erysiphe cichoracearum) and rust (Puccinia triticina) fungi, lack ergosterol [12]. Ergosterol contains two additional double bonds when compared to cholesterol and β-sitosterol, the most abundant phytosterol that is also an analogue of cholesterol [11,13]. Even with the aforementioned similarities of ergosterol to sitosterol, it is still perceived as a “non-self” MAMP [14], as has previously been shown in plant studies. Intracellular defense occurs within minutes in response to sub-nanomolar concentrations of ergosterol in tobacco and tomato cells. Included here is an increase of cytosolic Ca2+ levels, production of ROS, ion fluxes across the plasma membrane, protein phosphorylation, and production of phytoalexins [15,16,17,18,19,20,21,22]. It has been found that inhibiting the ergosterol biosynthesis pathway in colonizing fungi not only reduces fungal growth but also alters the sterol composition [12]. According to Dohnal et al. [23], ergosterol can be used as a fungal marker to evaluate infection levels in barley and corn crops, while treatment was also found to increase the expression of genes for PR1a, PR1b, PR3Q, and PR5 [16], acidic PR proteins used as markers for systemic acquired resistance (SAR) in host plants. Additionally, ergosterol elicitation has also shown expression of proteinase inhibitors, phenylalanine-ammonia lyase and sesquiterpene cyclase [16]. Although the perception mechanism is unknown, it is hypothesized that plants may possess an ergosterol receptor/receptor complex, or ergosterol penetrates the lipid bilayer and leads to perturbations of the plant cell system due to its ability to form stable microdomains in the plasma membrane [24,25]. In this study, we describe the use of proteomic approaches to identify differentially regulated plasma membrane-associated proteins following ergosterol treatment, as well as subsequent affinity-based chromatographic strategies of the said fraction to capture and enrich ergosterol-interacting candidate proteins so as to shed light on the unknown perception mechanism(s).

2. Results

2.1. Plasma Membrane (PM)-Associated Fraction Isolation and Verification

The plasma membrane (PM) outlines the interface between the cell and extracellular environment and is also the primary unit for signal recognition and transduction. Thus, elucidating and characterizing changes in the PM-associated proteome could identify possible receptor(s) and interacting/complementary complexes that are involved in immune responses to ergosterol. A challenge faced when extracting the PM proteome is the highly hydrophobic integral proteins that have a tendency of precipitating out of solution [26]. The conventional method of isolating PM proteins is the two-phase partitioning system, which requires 100–150 g of plant material [26]. However, the small-scale procedure has been found to result in PM-associated proteins comparable to the conventional method while employing much less starting material [26] and was the method followed in this investigation. The successful isolation of the PM-associated fraction during the ergosterol-treatment time course was routinely verified using Western Blot analysis (Figure S1) and the H+-ATPase assay. Furthermore, any non-PM-associated proteins were eliminated in the sequencing data analysis, as well as non-specific interacting proteins by the inclusion of control samples where no ergosterol was immobilized to the capture resins. Figure S2 shows the different isolated fractions with differentially regulated band intensities for each lane, thus implying successful enrichment of the PM-associated fraction.

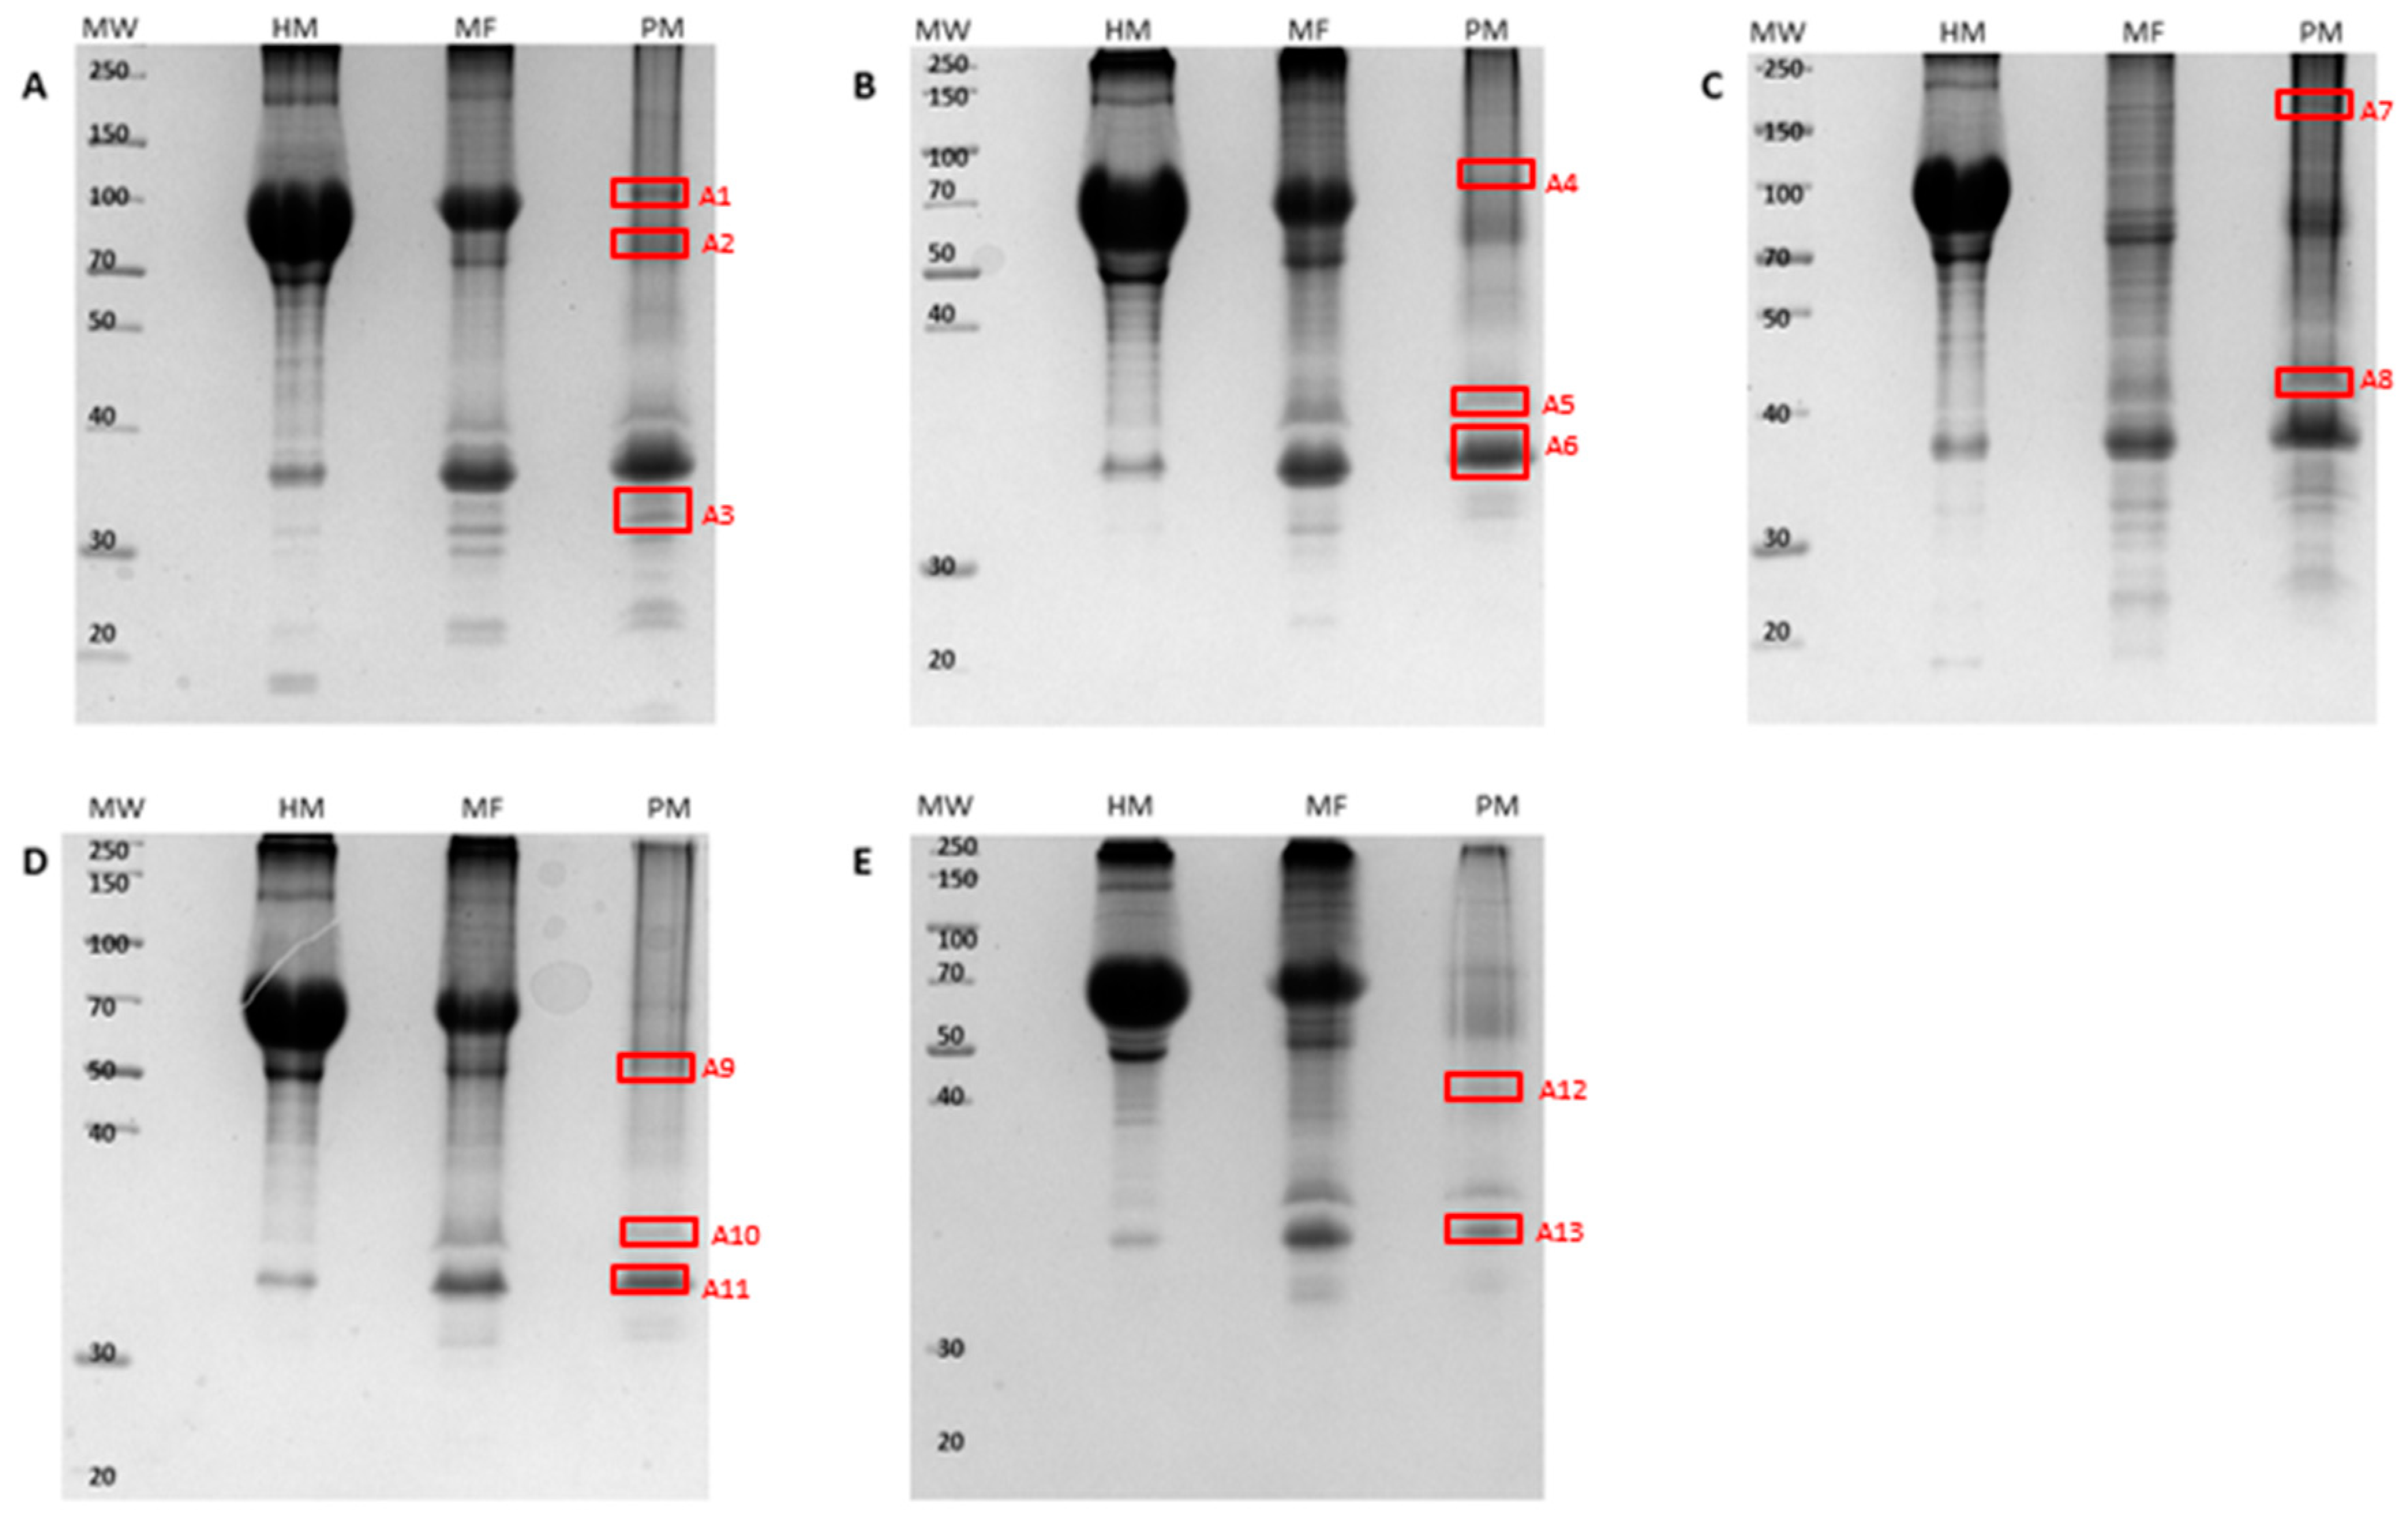
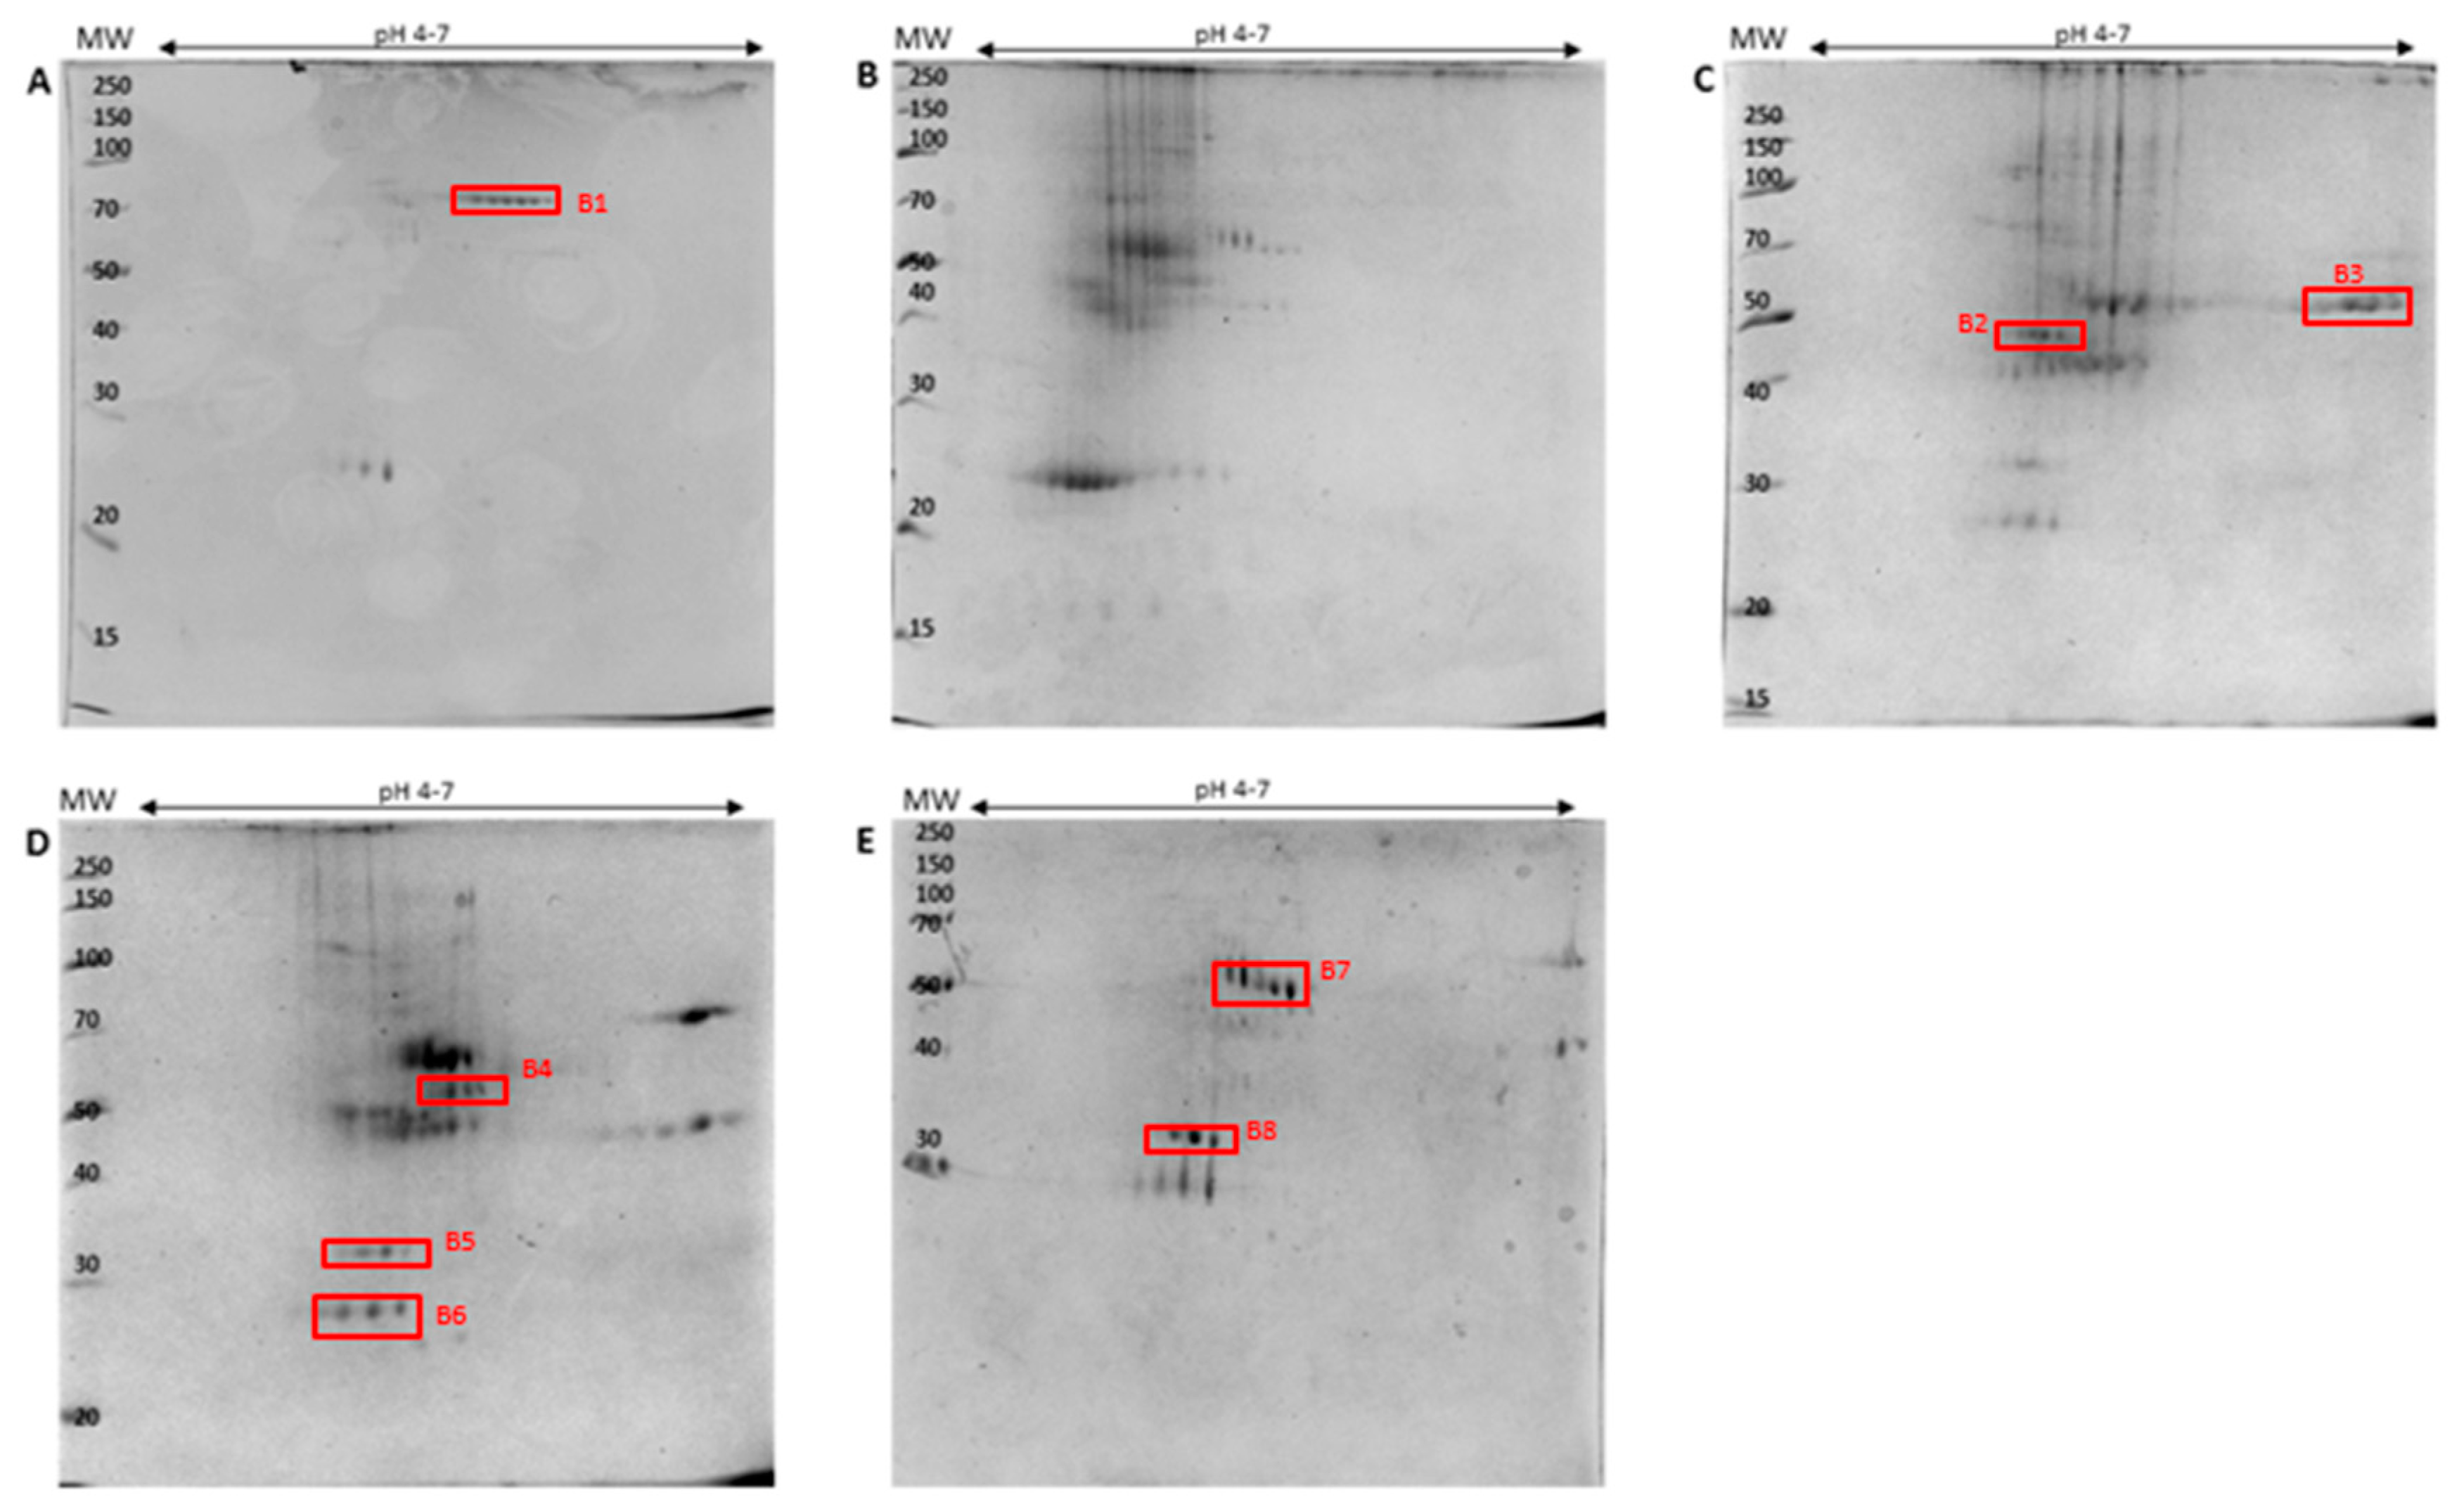
2.2. PM-Associated Ergosterol-Responsive Candidate Protein Identification

Data analysis was initially conducted on the ergosterol-induced PM-associated fractions subsequent to isolation and prior to enrichment. The results are shown for the 1D and 2D SDS-PAGE gels (Figure 1 and Figure 2) where differentially (densitometrically/electrophoretically) regulated bands/spots were selected for identification.
As previously mentioned, one band on a 1D gel may consist of multiple proteins. This emphasizes the need to identify the proteins affected/induced by ergosterol treatment and the role in perception of/response to this MAMP. Selected bands/spots from both the 1D- (Figure 1, A1–A13) and 2D SDS-PAGE (Figure 2, B1–B8) gels subsequent to ergosterol treatment were excised and prepared for liquid chromatography coupled with tandem mass spectrometry (LC-MS/MS) identification. The LC-MS/MS sequencing runs were repeated (separate experiments) for confirmation of protein lists obtained. The resulting spectra of the peptides were analyzed using the Byonic™ software (Protein Metrics, Cupertino, CA, USA). The program produces two plots, a protein score plot and mass error loadings plot (Figures S3 and S4). The protein score plot was used for the selection of proteins showing differential abundance or variable selection. This is known as the variable importance in projection (VIP) method and ranks proteins based on their contribution to the total variation of the samples. Differentially abundant proteins/peptides were selected on the VIP score where the set threshold was equal to one [27], and this value was presented as the log probability in all tables. The latter (as well as the Byonic score) determined the significance of the identified proteins. Even though these two said parameters could have been used individually, the values would have been less dependable. However, used together, they increased the significance. The dataset acquired was then normalized to the peptides of Arabidopsis proteins using the UniprotKB database. The identified A. thaliana PM-associated responsive proteins are summarized according to functional categories in Table 1 for the 1D SDS-PAGE bands and Table 2 for the 2D SDS-PAGE spots, respectively. There was better qualitative resolution for protein identification from the former to the latter. Furthermore, the differences between the theoretical and the experimental molecular weights (MW) for all proteins (low and high abundant) could be justified by the existence of structured water layers on the protein surface that affected the experimental MW determination on the SDS- PAGE [28].

2.3. Identification of PM-Associated Ergosterol-Interacting Candidate Proteins

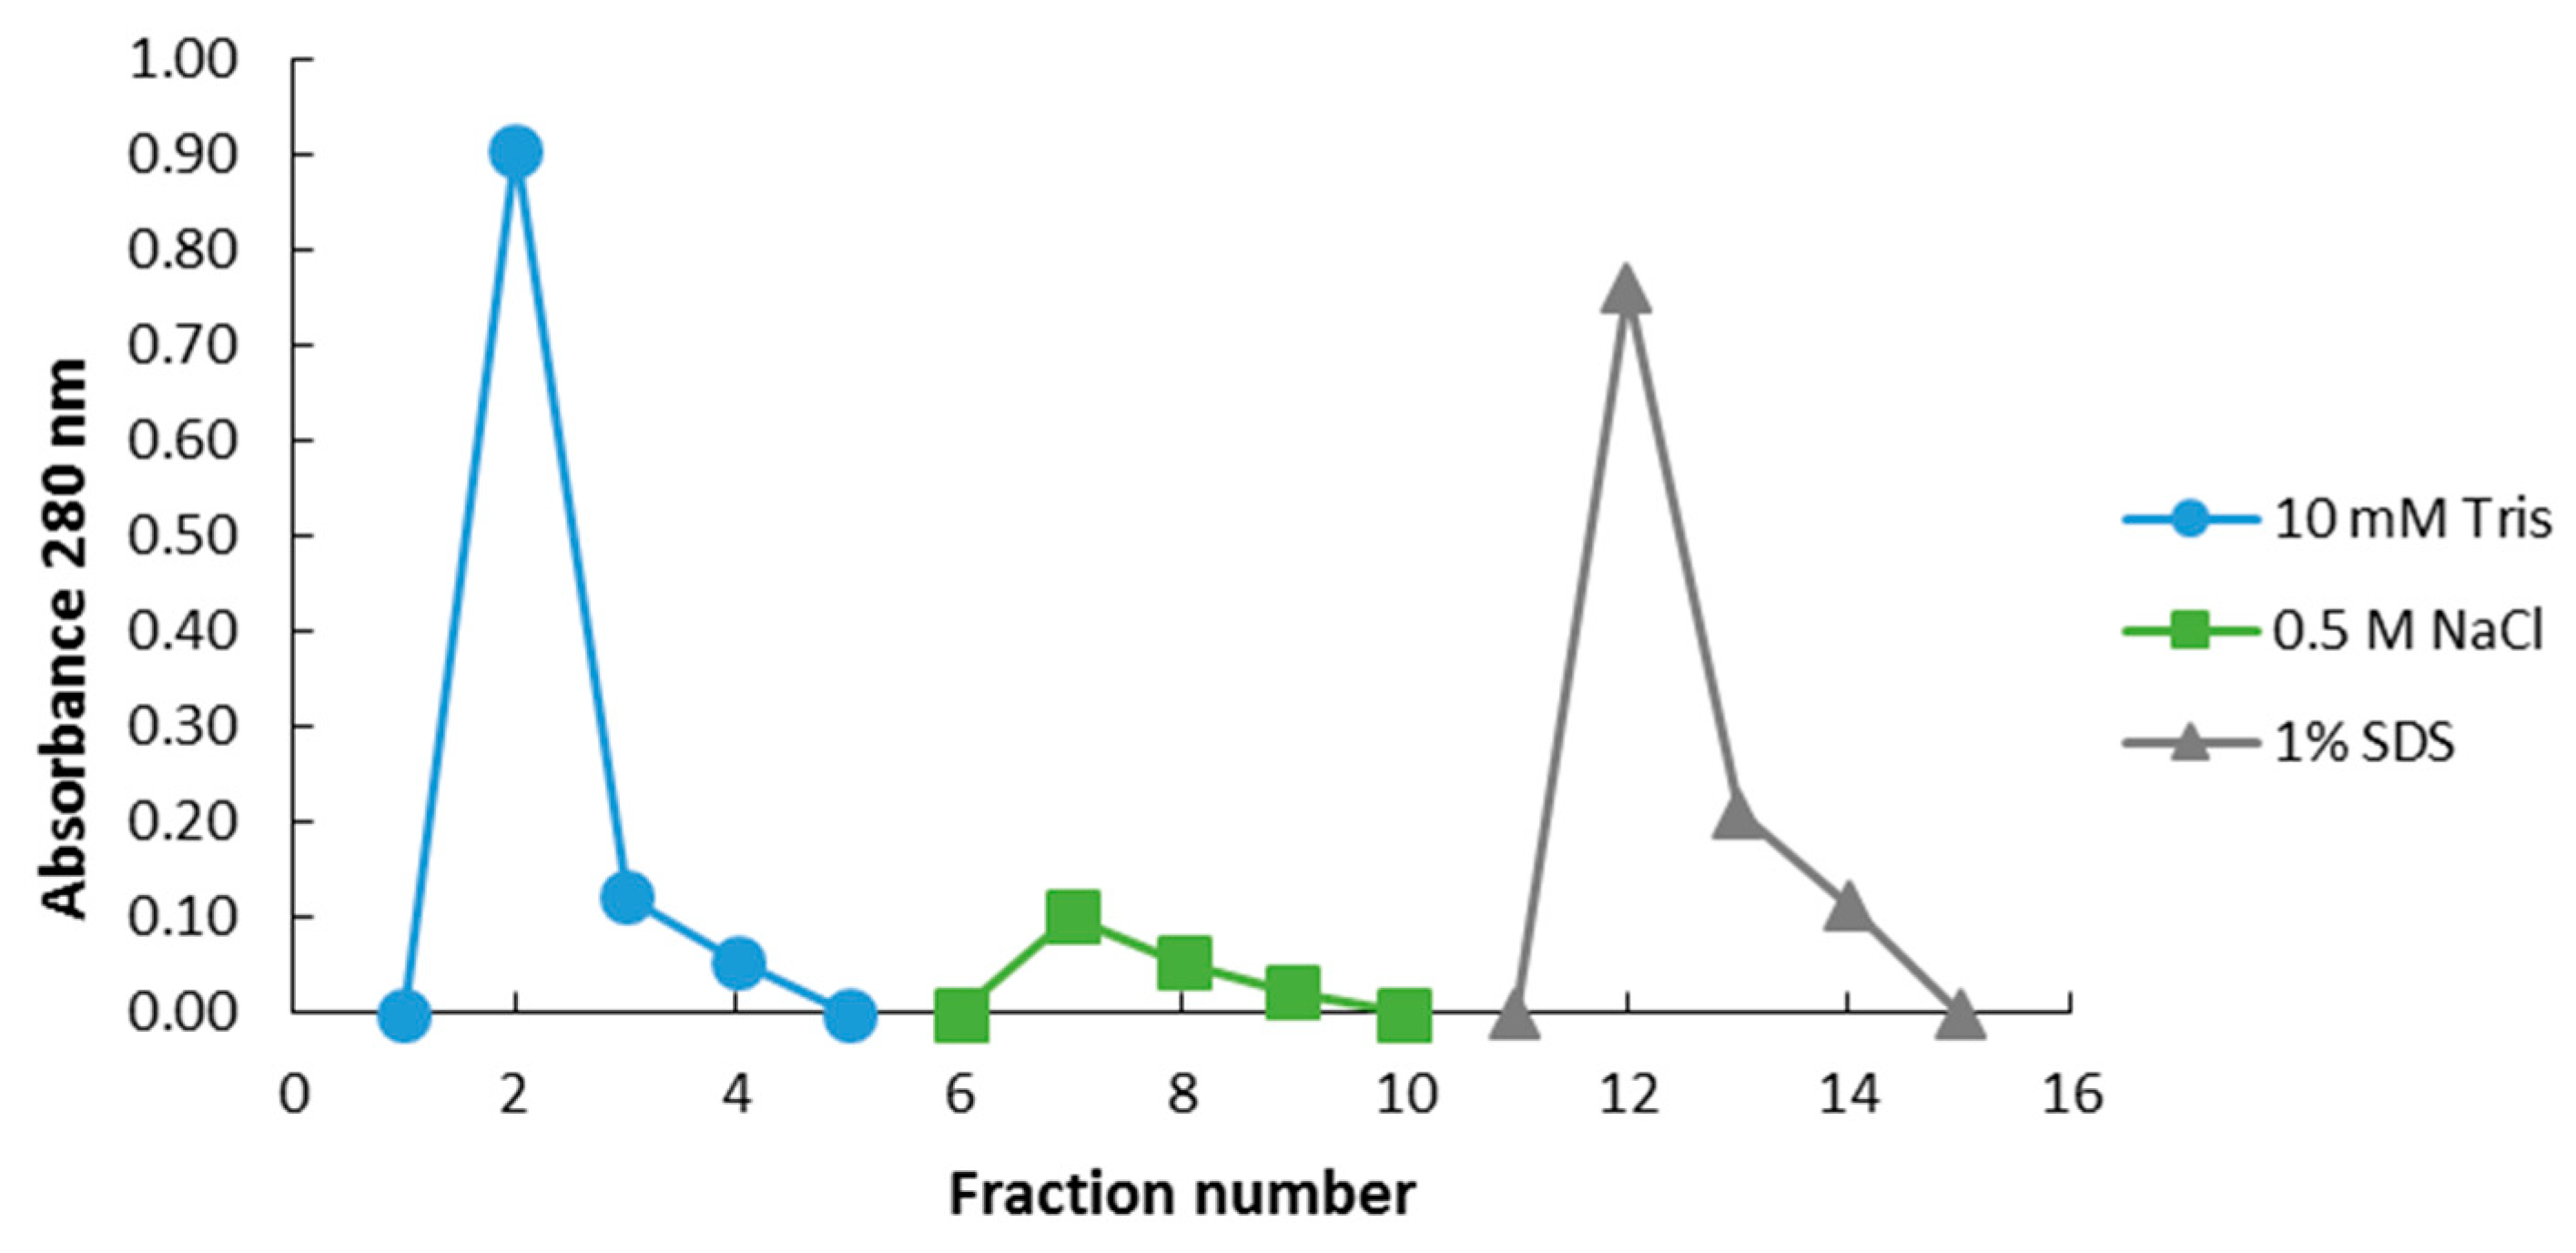
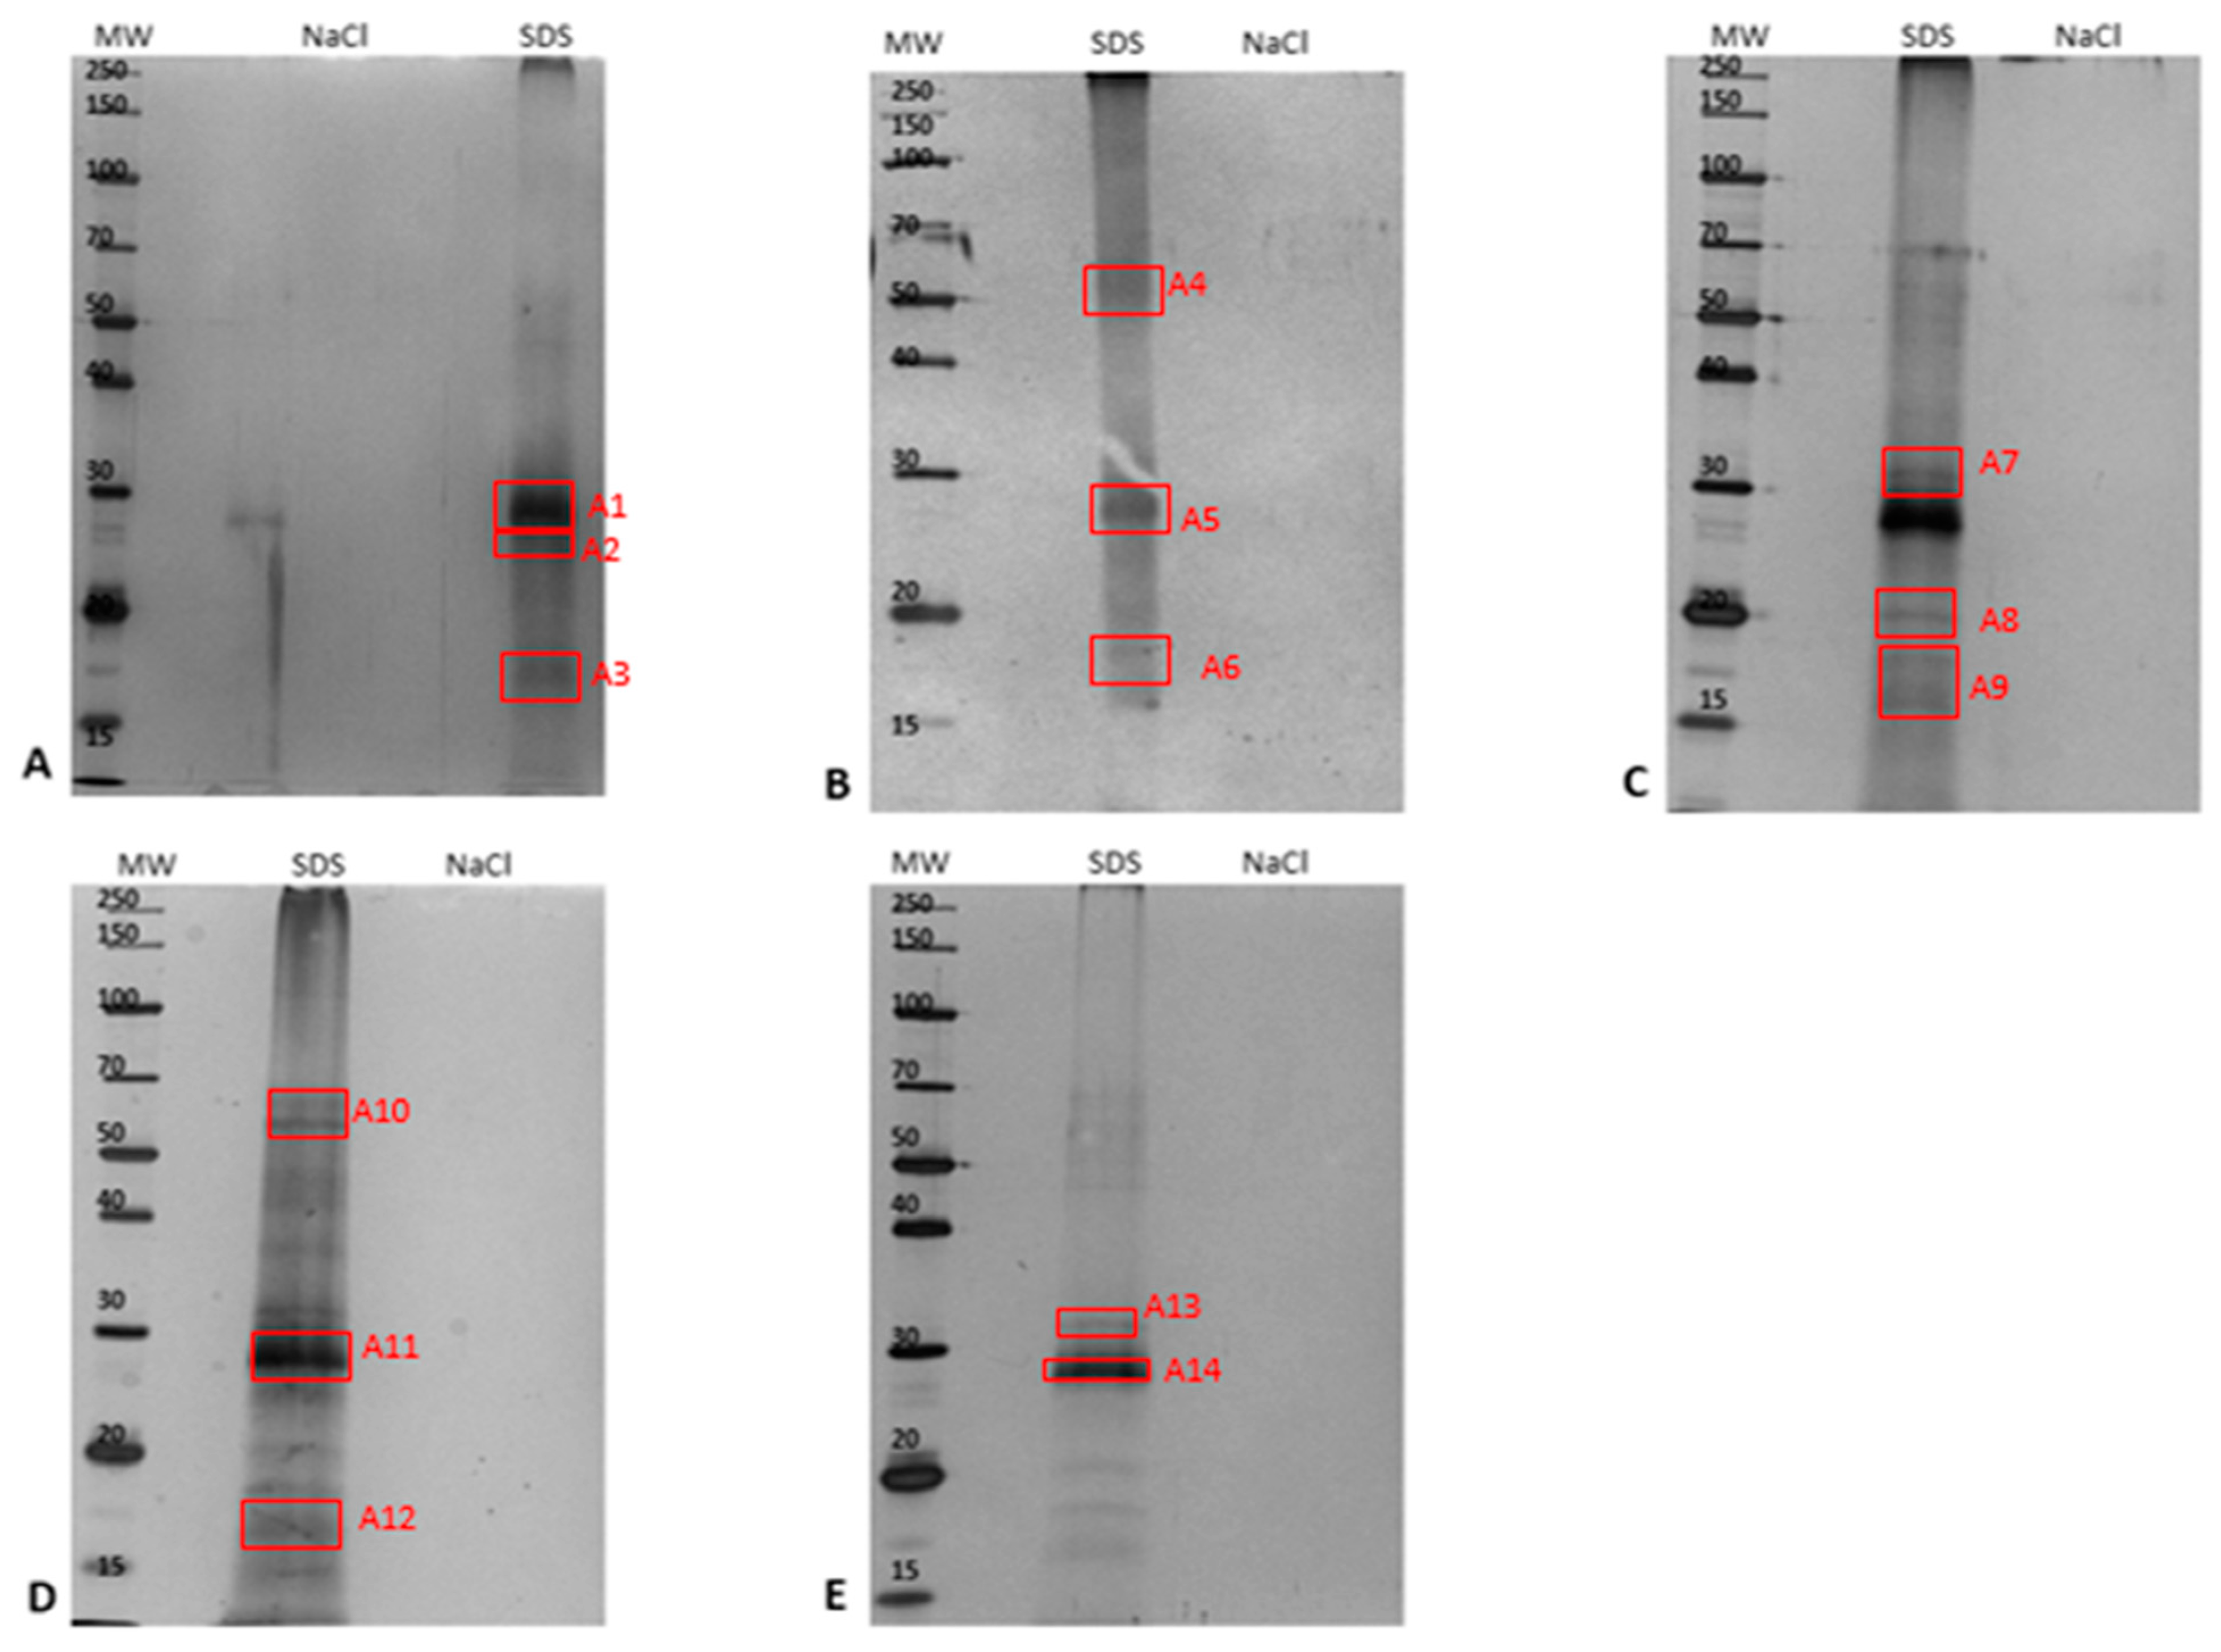
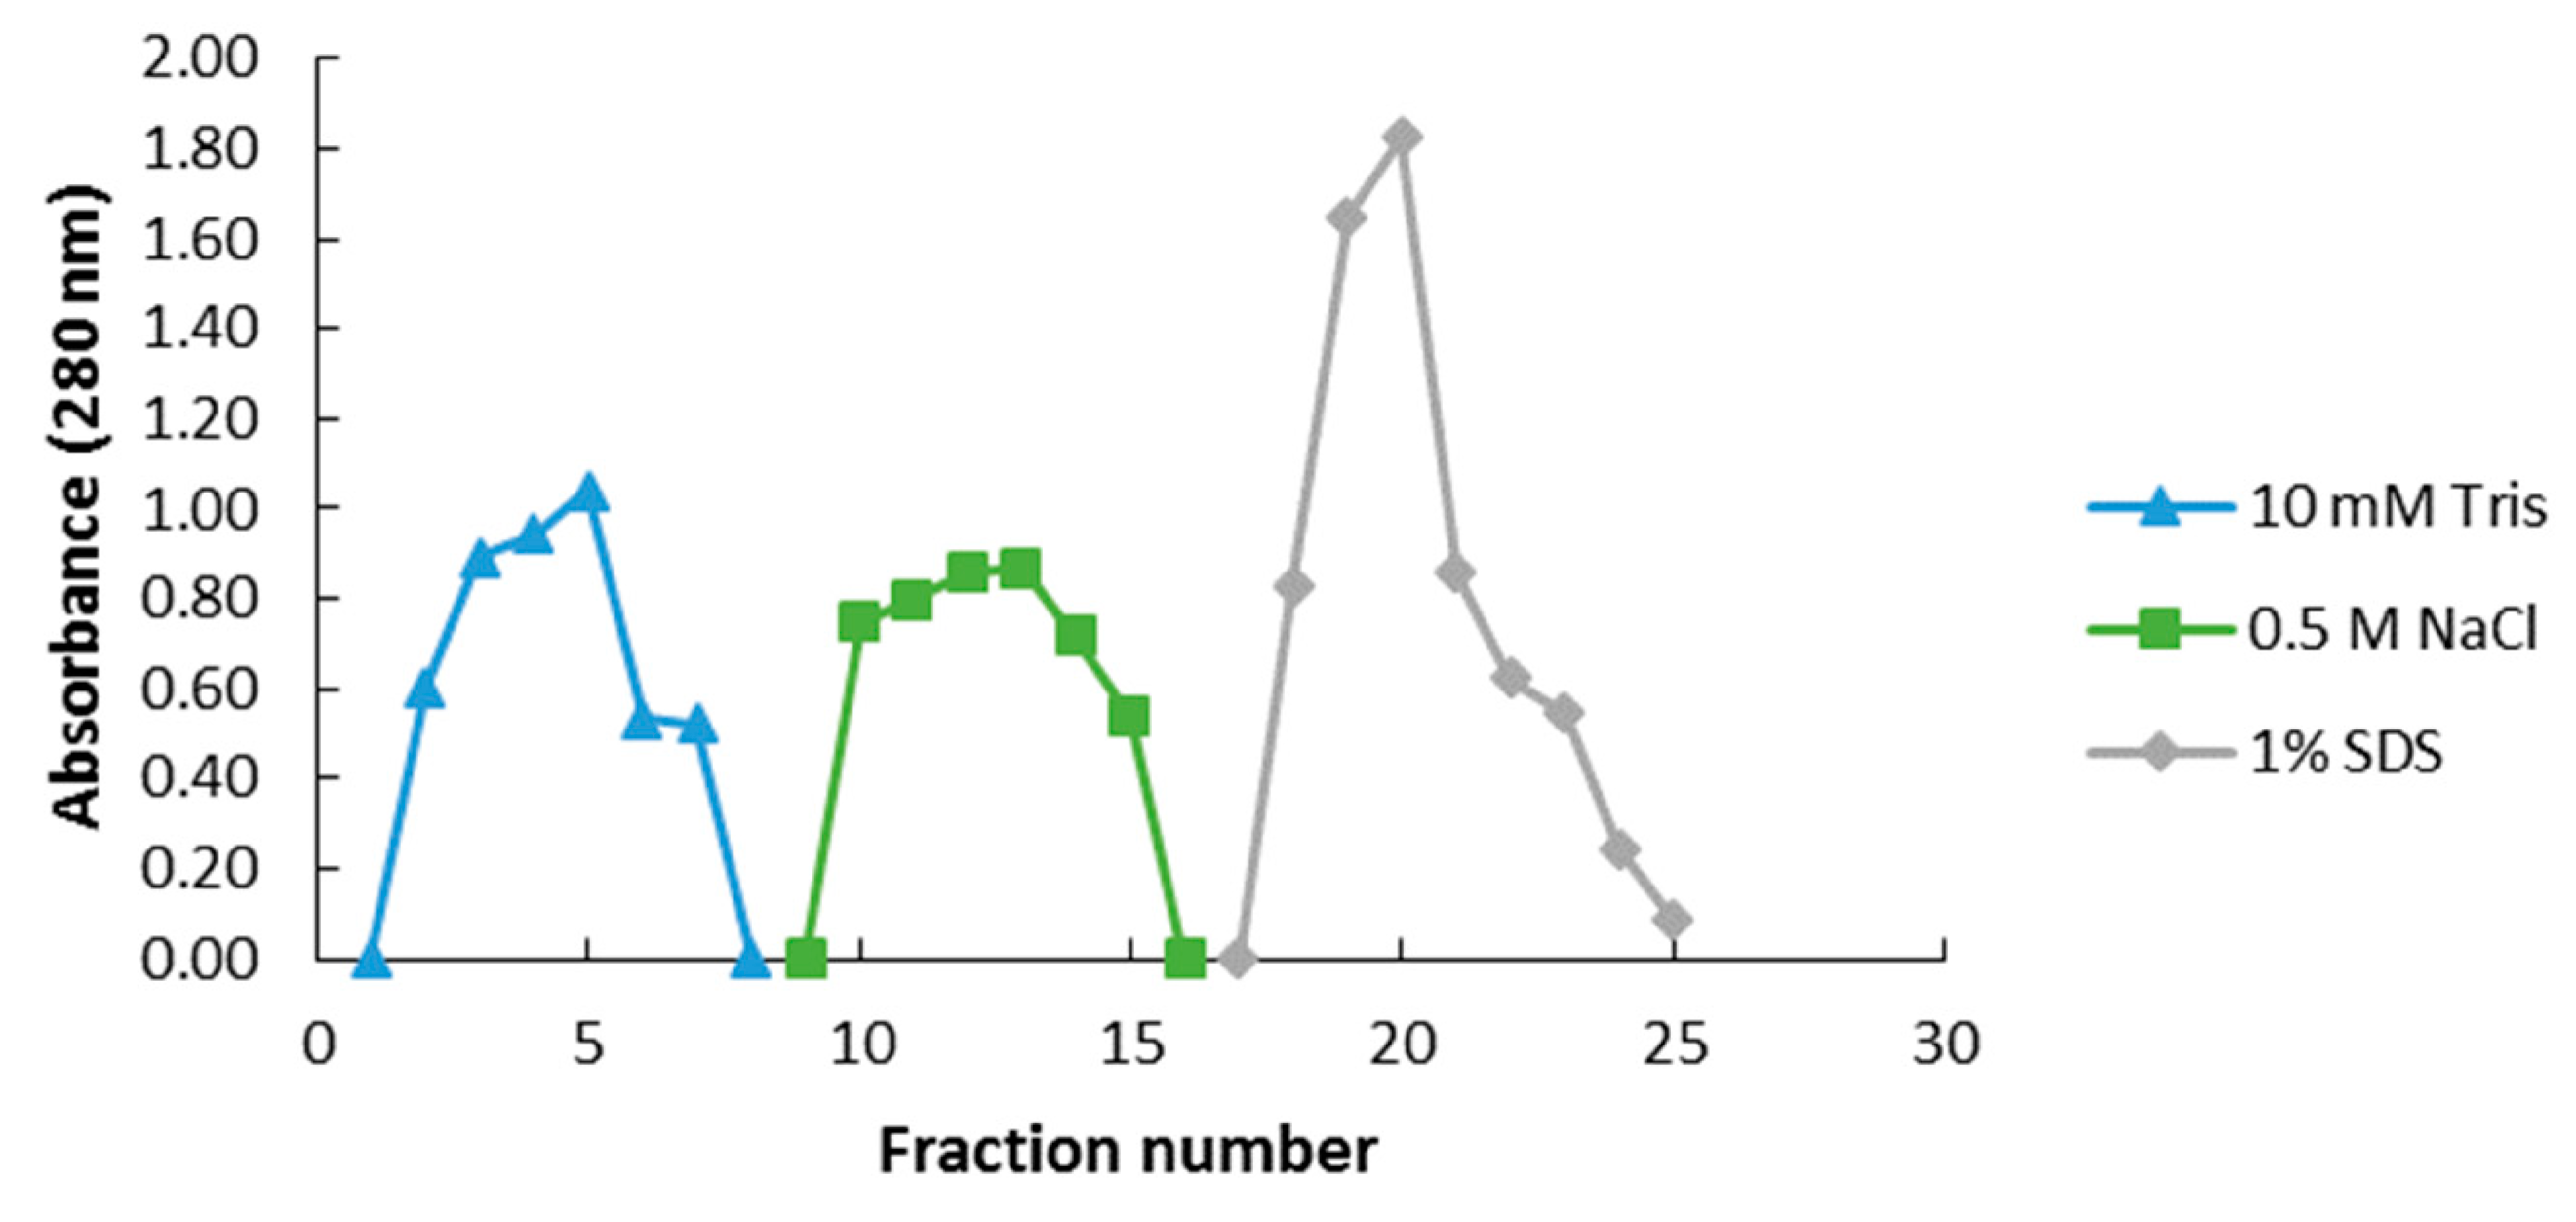
2.3.1. Epoxide Magnetic Microspheres-Based Ergosterol Immobilization

In order to capture and enrich ergosterol-interacting candidate proteins from the PM-associated leaf tissue fraction, MagResynTM magnetic microspheres were used. The binding and elution events that showed the resulting protein elution to changing in eluents is represented in Figure 3 for the PM-associated proteins following a 6 h treatment. The elution profiles for the other time points are presented in the Supplementary Data as Figures S5–S9. The NaCl and SDS fractions for each time study were analyzed by SDS-PAGE and are illustrated as Figure 4. Proteins eluted with 0.5 M NaCl were not detectable in contrast to those eluted with 1% SDS, which disrupted non-covalent interactions between native proteins and the ligand. Table 3 lists the ergosterol-interacting candidate proteins that were identified following LC-MS/MS according to functional categories, while proteins with low scores are presented in Table S1. The negative control (no ergosterol immobilized) protein list is given in Table S2.

2.3.2. EAH Sepharose 4B Immobilized with Ergosterol-Hemisuccinate

Ergosterol contains a diene group within its structure that is very reactive and requires protection by treatment with 4-phenyl-1,2,4-triazoline-3,5-dione (PTAD) prior to derivatization. Following protection, ergosterol was derivatized and validated using thin-layer chromatography (TLC) (shown in Figure S10). Figure 5 along with Figures S11–S15 show the binding events of the plasma membrane (PM)-associated fraction to the column immobilized with ergosterol-hemisuccinate. The NaCl and SDS fractions were analyzed using sodium dodecyl sulfate polyacrylamide gel electrophoresis (SDS-PAGE) and are illustrated in Figure 6. Selected bands were excised and analyzed using LC-MS/MS-based proteomics. The identified proteins are listed in Table 4, and proteins with low scores are in Table S3. The negative control (no ergosterol immobilized) protein list is presented on Table S4.

3. Discussion

3.1. Functional Classification of Identified Ergosterol-Responsive – and Interacting Candidate PM-Associated Proteins from A. thaliana Leaf Tissue

The PM is known to participate in a wide spectrum of important functions, including transport of ions across the membrane, communication with the extracellular environment, cell wall biosynthesis, and defense against invading microorganisms. These functions are achieved by transport and membrane trafficking proteins and receptor kinases [30,31,32]. As seen with most biochemical processes, proteins are not limited to one functional group, e.g., a transport protein may also be regulated during a defense response event. Such proteomic approaches (prior to enrichment and subsequent to affinity-based strategies) aimed to provide a comprehensive understanding of both ergosterol-responsive and interacting candidate proteins at the PM-localized interface, as well as those possibly associated with the PM subsequent to MAMP treatment.

3.1.1. Membrane Trafficking and Transporters

In a plant cell, responses to a MAMP occurs within minutes [33]. As mentioned, ergosterol treatment causes ion fluxes across the PM and intracellular increase of Ca2+ levels. These changes are due to transport proteins and those involved in endocytosis/exocytosis. Aquaporins, identified in Table 1, Table 3, and Table 4 (i.e., both non-enriched and enriched PM-associated fractions), are water carrier proteins identified within all the time study samples and are also considered as PM markers. The PM intrinsic proteins (PIP) were differentially regulated in the samples, likely due to a defense response, and isolated during affinity chromatography. The Arabidopsis aquaporin AtPIP1 and AtPIP2 groups are well-known to be localized in PMs and are involved in defense responses within the plant [34].
ATP-dependent binding cassette (ABC) transporters have previously been shown to be involved in various processes such as transport of phytohormones, surface lipid deposition, and pathogen response during plant-microbe interactions [35]. In this study, an ABC transporter was identified in Table 3 (enriched PM-associated fraction) following capture affinity. The G family (AtABCG) group is the largest subfamily of ABC transporters in A. thaliana, and evidence was found by Ji et al. [36] that AtABCG16 is involved in basal resistance and abscisic acid (ABA) tolerance against the virulent bacterial pathogen Pseudomonas syringae pv. tomato (Pst) DC3000. Additionally, patellin-1 (Table 1, non-enriched PM-associated fraction) is a carrier protein involved in membrane trafficking by binding to hydrophobic molecules (such as the steroid-like ergosterol) and promoting their transfer between different cellular sites [37,38]. Vilakazi et al. [39] also identified this phosphoinositide-binding protein, patellin-1, in the study of capturing LPS-binding PM-associated proteins in A. thaliana.
Lastly, clathrin-dependent membrane trafficking is critical for determining cell polarity, and clathrin light chains are predominantly localized at the PM and early endosome compartments [40]. Both light chains (CLCs) and clathrin heavy chains (CHCs), including CHC1 and CLC3, were identified in the non-enriched PM-associated fraction (Table 1 and Table 2). In this regard, Mgcina et al. [41] also speculated that the binding-site of lipopolysaccharide (LPS) as a bacterial MAMP to A. thaliana protoplasts is internalized into the cell by endocytosis, thus leading to the reduced level of receptors on the surface.

3.1.2. Signaling

Pathogens that successfully overcome the initial physical defense barrier are mostly recognized by PRR proteins on the cell membrane. Recognition at the PM is immediately transmitted internally to activate other defense factors [42]. Some of the proteins involved during basal resistance fall within the signaling category and are associated with the PM during a defense response event. Here, a GPI-anchored protein was identified in the 12 h- and 24 h-treated PM-associated samples, as listed in Table 3 of the enriched fractions. These proteins are known to exist independently in a soluble form and are also associated with the PM [43]. GPI anchoring acts as a PM targeting signal, either in a localized or a polarized manner, by transferring signals from activated transmembrane receptors to various constituents inside the cell [44]. Due to these targeting mechanisms, GPI-anchored proteins are associated with lipid rafts/microdomains [43,45,46] and, since Peskan et al. [44] found evidence for such rafting in plants, these proteins have been used as a model or marker for raft sorting [47].
A LRR protein kinase-like protein and LRR-containing protein were identified in non-enriched as well as enriched PM-associated proteins (Table 1 and Table 3). LRR-containing RLKs are well known to confer resistance to bacterial and fungal pathogens [48]. A well-studied LRR-containing receptor is the FLS2 from A. thaliana that perceives the bacterial flagellin and triggers the binding of brassinosteroid intensive 1 (BRI1)-associated kinase (BAK1) to the receptor and acts as a signal enhancer [49]. Furthermore, FLS2 is said to migrate to highly organized membrane raft compartments of the PM where interaction with BAK1 takes place, forming a heterodimer [50]. Another protein kinase identified includes the G-type lectin S-receptor-like serine/threonine-protein kinase (GsSRK) listed in Table 1 (non-enriched fraction). Sanabria et al. [51] proposed a role for S-domain RLKs in M/PAMP perception, specifically for LPS. In the study, it was shown that LPS perception transiently up-regulates the expression of a G-type lectin receptor kinase in tobacco. This was also seen in the study of LPS perception in A. thaliana by Baloyi et al. [52], as the GsSRK protein was up-regulated during the time study. Plant lectins are proteins that are known to reversibly bind carbohydrates and are assumed to play a role in plant resistance and development. It was shown by Esch and Schaffrath [53] that the lectin domain of a jacalin-related lectin protein was responsible for relocating the protein towards the site of pathogen attack, and jacalin-related lectin 35 was identified in the 2D set of proteins analyzed subsequent to isolation (Table 2). The 14-3-3-like protein, GF14 epsilon, was also identified in the non-enriched fraction (Table 1). These proteins are known to be important components in biological pathways involved in signal transduction in response to biotic and abiotic stresses. In rice, 14-3-3 proteins regulate complex defense responses and interact with cellular components; 14-3-3 genes have also been found to be expressed in response to inoculation with rice fungal pathogens, thus suggesting functions in defense signaling [54].
CERK1 is a PM protein with three LysM motifs in the extracellular domain that was identified following affinity-capture (Table 3). LysM proteins have been shown to play a vital role in basal immunity by recognizing peptidoglycan and chitin via the N-acetylglucosamine (GlcNAc) moiety [52]. The Arabidopsis CERK1 (AtCERK1) is said to function as a ligand-binding protein and as a signaling molecule with kinase activity [55]. Lastly, the binding partner of accelerated cell death (ACD) 11 was identified for the first affinity-based approach (Table 3) and is known to mediate sphingolipid metabolism and regulate programmed cell death (PCD) upon pathogen infection in plants [56]. It has also been shown that Arabidopsis ACD mutant plants displayed excessive cell death upon infection with bacterial P. syringae [57].

3.1.3. Defense responses

During the early stages of M/PTI, upon pathogen recognition, defense-related proteins are either activated, enhanced, or transcribed. Microbes can also deliver effectors into the cytosolic space of the plant cell during ETI, thus challenging the plant’s defense proteins [50]. The NDR1/HIN1-like protein 3 (NHL3), listed in the enriched fraction (Table 3), is predicted to be a membrane protein that has been shown to be triggered by avirulent Pst instead of the virulent strains. Hitherto, Varet et al. [58] reported that the expression of NHL3 is suppressed by virulent bacteria, and therefore the protein is hypothesized to participate in disease resistance. SNARE (soluble N-ethylmaleimide sensitive factor attachment protein receptors) complexes are also known to be necessary for immune responses and have been associated with targeted exocytosis of various antimicrobial compounds and proteins. Multiple SNARE complex constituents have been identified in previous studies, including the syntaxin of plants 122 (SYP122), and soluble N-ethylmaleimide-sensitive factor adaptor protein 23 (SNAP33) was identified in the 2DE samples (Table 2) in this study. These proteins were previously found to be highly enriched at the PM during an immune response [59].
Remorins, identified during the affinity-capture (Table 3), are proteins that play a role in cell-to-cell signaling and plant defense and have been shown to be associated with the PM in potato leaves. Furthermore, remorin 1.2 from tobacco (NtREM1.2) revealed primary accumulation in isolated DRMs and showed distinct localization in domains in the PM when expressed as a green fluorescent protein (GFP) fusion protein. These experiments showed that remorins are marker proteins for DRMs in plants that form higher order oligomers, impacting the binding affinity to these microdomains [46,60]. In A. thaliana, remorins are differentially phosphorylated, and this event is dependent on the presence of the NBR-LRR resistance protein RPM1. This is triggered upon perception of various M/PAMPs [61]. Within the Arabidopsis genome genes named, AtONB1, AtBON2, and AtBON3 (bonzai, also known as copine) were shown to be regulators of plant immunity. The identified ergosterol-interacting candidate BONZAI-2 (enriched fraction in Table 3) plays a role in suppressing programmed cell death and defense in plants during pathogen attack [62]. This was supported by Zhou et al. [63], where Arabidopsis and rice plants were inoculated with Pst DC3000, and the pathogen’s interaction with the plant was limited to the PM. Hypersensitive-induced response (HIR) proteins are found on the PM and interact with LRR proteins during a defense response. The A. thaliana AtHIR1, AtHIR2, AtHIR3, and AtHIR4, identified in both non-enriched and enriched fractions (Table 1, Table 2 and Table 3), are associated with the intracellular side of the PM and involved in the development of programmed cell death during pathogen attack [39]. Baloyi et al. [52] and Vilakazi et al. [39] identified HIR protein 1, HIR protein 2, HIR protein 3, and HIR protein 4 in their studies pertaining to LPS as a M/PAMP.
Lastly, plant disease resistance (R) proteins are quantitative and rate-limiting regulators. Disease resistance protein RPP8, listed in the non-enriched fraction (Table 1), has been seen to be up-regulated in response to multiple avirulent pathogens and by wounding. It is also suggested that RPP8 is connected to multiple pathways [64].

4. Materials and Methods

4.1. Plant Growth and Elicitor Treatment

For the study, A. thaliana seedlings were grown in CulterraTM Germination Mix (Culterra, Johannesburg, South Africa) soil in trays placed in a plant growth room at 20–24 °C under a 12-h light/12-h dark cycle until mature. Plants were routinely watered and fertilized with 1:300 (v/v) diluted NitrosolTM Natural (Nitrosol, Manukau City, New Zealand). Mature plants with fully developed rosettes (~2 months old) were treated with 250 nM ergosterol (Sigma, Steinheim, Germany) during the day cycle using gentle pressure infiltration into the abaxial side of the leaves. An elicitor stock solution was prepared in absolute ethanol and diluted in dH2O to a working solution containing less than 0.2% ethanol, and elicitation included a time study of 0, 6, 12, and 24 h, respectively, in accordance with related citations with untreated plants as the control. To eliminate any variation, all experiments included 3 biologicals and 3 repeats of each experiment, including sequencing. The raw data files containing the most significant proteins (Section 4.7) were merged to produce Supplementary Data Sheets 1–4 and compile Table 1, Table 2, Table 3 and Table 4.

4.2. Small-Scale Isolation of the Plasma Membrane(PM)-Associated Fraction

The isolation protocol was taken from Giannini et al. [26] and modified to optimize the yield of isolated fractions. Approximately 20 g of leaf tissue was homogenized in 60 mL homogenizing buffer containing 250 mM sucrose (Merck, Darmstadt, Germany), 3 mM ethylenediaminetetraacetic acid (EDTA) (MerckDarmstadt, Germany), 10% (v/v) glycerol, 0.5% (w/v) poly(vinylpolypyrrolidine) (PVPP) (Sigma, St. Louis, MO, USA), 2 mM phenylmethane sulfonyl fluoride (PMSF) (Boehringer Mannheim, Mannheim, Germany), 15 mM β-mercaptoethanol (Sigma, St. Louis, MO, USA), 4 mM 1,4-dithiothreitol (DTT) (Fisher Chemicals, Loughborough, UK), 250 mM potassium iodide (KI) (Saarchem, Johannesburg, South Africa), and 70 mM tris(hydroxymethyl)aminomethane (Tris) (Merck, Modderfontein, South Africa) using an Ultraturax homogenizer. Homogenates (HM) were filtered through 2 layers of miracloth (Millipore/Merck, Darmstadt, Germany) and centrifuged at 6000× g for 4 min at 4 °C using a Beckman CoulterTM AvantiTM J-20 I centrifuge. Cell debris was discarded, and the supernatants were collected and centrifuged at 13,000× g for 25 min at 4 °C. After centrifugation, the supernatants were discarded, and the pellets were resuspended in 800 µL microsomal resuspension buffer containing 250 mM sucrose, 10% (v/v) glycerol, 1 mM DTT, and 1 mM PMSF. Five hundred µL of the microsomal fraction was layered onto a sucrose gradient containing 700 µL of 25% (w/v) and 38% (w/v) sucrose each to create a discontinuous gradient in 1 mM Tris-HCl, 1 mM EDTA, and 0.1 mM DTT, pH 7.2. The gradients with the microsomal fractions were centrifuged at 13,000× g for 1 h, after which the PM-associated fraction formed an interface within the gradient and was aspirated using a pipette and transferred into a new tube. To validate the successful isolation of the said fractions, MAPK Western blot analysis (Figure S1) and plasma membrane H+-ATPase assays were routinely conducted.

4.3. Identification of PM-Associated Ergosterol-Responsive Candidate Proteins

Prior to affinity chromatography, SDS-PAGE was performed of the homogenates, microsomal, and PM-associated fractions in order to identify proteins that could be categorized as ergosterol-responsive candidates. The 12% 1D-SDS-PAGE gels were visualized using the Fairbanks staining protocol [65], and differentially (densitometrically) regulated protein bands were excised for identification. The PM-associated fractions also underwent 2D-SDS-PAGE with immobilized pH gradient (IPG) strips of narrow range (pH 4–7) in order to identify elecrophoretically distinct spots that could be responsive candidates to ergosterol treatment. Samples were prepared for the first dimension of separation with a concentration of 100 µg total protein. A final volume of 120 µL sample was prepared containing 2 µL 50% DTT, 1.3 µL ampholyte (Bio-Rad, Hercules, CA, USA), x µL sample, y µL urea buffer with trace amounts of bromophenol blue. The samples were loaded onto the Immobiline™ Reswelling Dry-strip tray, and non-linear IPG strips [pH 3–10 or 4–7, 7 cm ReadyStrip™ IPG, Bio-Rad, Hercules, CA, USA)] were gently laid on top of the sample with the gel side down. The strips with samples were overlaid with mineral oil to prevent drying, and the tray was covered with foil. The strips were left to hydrate overnight at RT. Following hydration, the strips were placed on the Etthan IPGphorII electrophoresis unit (Amersham Bioscience, Buckinghamshire ,UK) with the gel side facing up. Electrode wicks were soaked with dH2O and placed on opposite ends of the strips. Conditions for isoelectric focusing (IEF) included step 1 at 250 V for 15 min, step 2 at 4000 V for 1 h, and step 3 was 4000 V for 12,000 V/h. Once IEF was completed, strips were rinsed with dH2O to remove excess mineral oil and then with 1X tank buffer for 5 min. The strips were incubated in DTT equilibration buffer (0.8 g DTT, 6 M urea, 30% glycerol, 2% SDS, 50 mM Tris-HCl, pH 8.8) for 20 min with constant shaking. Strips were rinsed again with 1X tank buffer and then incubated in iodoacetamide (IAA) (Sigma, St. Louis, MO, USA) equilibration buffer (0.2 g IAA, 6 M urea, 30% glycerol, 2% SDS, 50 mM Tris-HCl, pH 8.8) for 20 min with constant shaking, followed by 1X tank buffer prior to loading the strip on top of a 12% resolving gel, as previously prepared. Protein spots that showed differential regulation were excised and analyzed by LC-MS.

4.4. Affinity Chromatography

4.4.1. Magnetic Epoxide Microspheres

The MagReSynTM magnetic epoxide microspheres (ReSyn Biosciences, AEC-Amersham, Midrand, South Africa) were supplied as a 20 mg/mL suspension in 20% (v/v) ethanol. The microspheres contain high functional group intensity throughout the fiber surface network, which allows a ligand (in this case, ergosterol) to react and be immobilized to the lattice by covalent bonding [66]. Microspheres were resuspended in the shipping solution, and 50 µL (±1 mg) was collected with a pipette and transferred to a new tube. The tube was placed on a magnetic separator, and once microspheres were clear, the shipping solution was discarded. Microspheres were equilibrated with three washes of 200 µL milliQ H2O. The activation solution supplied by the manufacturer consisting of 5.2 M 1,4-butanediol diglycidyl ether was diluted 4× to a working solution. Microspheres were resuspended in 500 µL activation solution and continuously agitated for 48 h at RT before removal thereof and washing of the microspheres two times with 200 µL 90% (v/v) tetrahydrofuran (THF) (Sigma, Steinheim, Germany), which was also used as the coupling buffer. Thirty mg/mL of ergosterol was prepared with 90% (v/v) coupling buffer. Five hundred µL of the ergosterol was added to the activated microspheres and continuously agitated for 48 h at 4 °C. On the magnetic separator, the unbound ergosterol was removed, and microspheres were washed three times with 200 µL coupling buffer. Epoxide residues that did not bind to the ergosterol were quenched with 500 µL ethanolamine, pH 8.5 blocking solution for 24 h at RT. The blocking agent was discarded, and 1 mg/mL (~1.25 mL) of PM-associated protein sample was added. The microspheres with the samples were incubated for 24 h at RT with constant agitation followed by removal of the liquid fraction and washing of the microspheres five times with 1 mL 10 mM Tris-HCl, pH 7.5 to remove unbound proteins. The microspheres were then washed with 1 mL 0.5 M NaCl in 10 mM Tris-HCl, pH 7.5 to remove non-covalently bound proteins. Ergosterol-interacting candidate proteins were subsequently eluted with five washes 1 mL 1% (w/v) SDS in 10 mM Tris-HCl, pH 7.5. The absorbance of the collected fractions was measured spectrophotometrically at 280 nm for monitoring absorption and desorption reactions.

4.4.2. EAH Seharose 4B

This approach required the derivatization of ergosterol to the hemisuccinate for affinity chromatographic applications, as reported by Tejada-Simon and Pestka [67]. Thirty mg/mL ergosterol was treated with 4-phenyl-1,2,3-triazoline-3,5-dione (PTAD) (Sigma, Steinheim, Germany), resulting in cyclic adducts. For the formation of the adducts to ergosterol-hemisuccinate, 2.5 mM succinic anhydride (Sigma, Steinheim, Germany) was dissolved in 800 µL pyridine (Sigma, St. Louis, MO, USA) in a reaction vessel. The ergosterol adducts were added to the mixture and refluxed for 60 min. The reaction was allowed to cool down for ±5 min before the reaction vessel was submerged in boiling water and a nitrogen steam was applied to remove pyridine. Excess succinic anhydride was removed by portioning the mixture in equal volumes of water and chloroform. The chloroform phase containing ergosterol-hemisuccinate (Erg-HS) was dried under nitrogen. To authenticate the successful derivatization of ergosterol, 30 mg/mL ergosterol and 30 mg/mL Erg-HS were separately dissolved in toluene:acetone (70:30, v/v). High-performance thin layer chromatography (HP-TLC) was conducted with a mobile phase of toluene:acetone (70:30, v/v), and plates were visualized under UV at 254 nm.
One mL of 1,6-diaminohexane (EAH) Sepharose 4B beads were swollen in 10 mL 0.5 M NaCl and washed two times with 5 mL water, pH 4.5. Erg-HS (0.05 g) was dissolved in 2 mL 50% (v/v) 1,4-dioxane (Sigma, Steinheim, Germany) and added to the beads. One-ethyl-3(3-dimethylaminopropyl)-carbodiimide (Sigma, Steinheim, Germany) was added to the beads to a final concentration of 0.13 M and manually inverted for 60 min at RT. The carbodiimide-promoted condensation reaction was then continuously inverted for 24 h at 4 °C to allow the coupling of Erg-HS to the beads. This was followed by washing with 10 mL 100% 1,4-dioxane, 10 mL 80% (v/v) ethanol, 20 mL water, and 10 mM Tris-HCl pH 7.5, respectively. Beads were transferred into a column, 1 mg/mL of the PM-associated extract was added on the resin bed, and the column was blocked for 1 h at RT to allow binding of proteins to Erg-HS. The column was then washed six times with 50 mM Tris-HCl pH 7.5 to remove all unbound proteins followed by six washes with 0.5 M NaCl in 50 mM Tris-HCl 7.5 to remove non-specifically bound proteins. Lastly, ergosterol-interacting candidate proteins were eluted with 1% (w/v) SDS in 50 mM Tris-HCl pH 8.0. The absorbance of the collected fractions was spectrophotometrically measured at 280 nm to determine the elution profile.

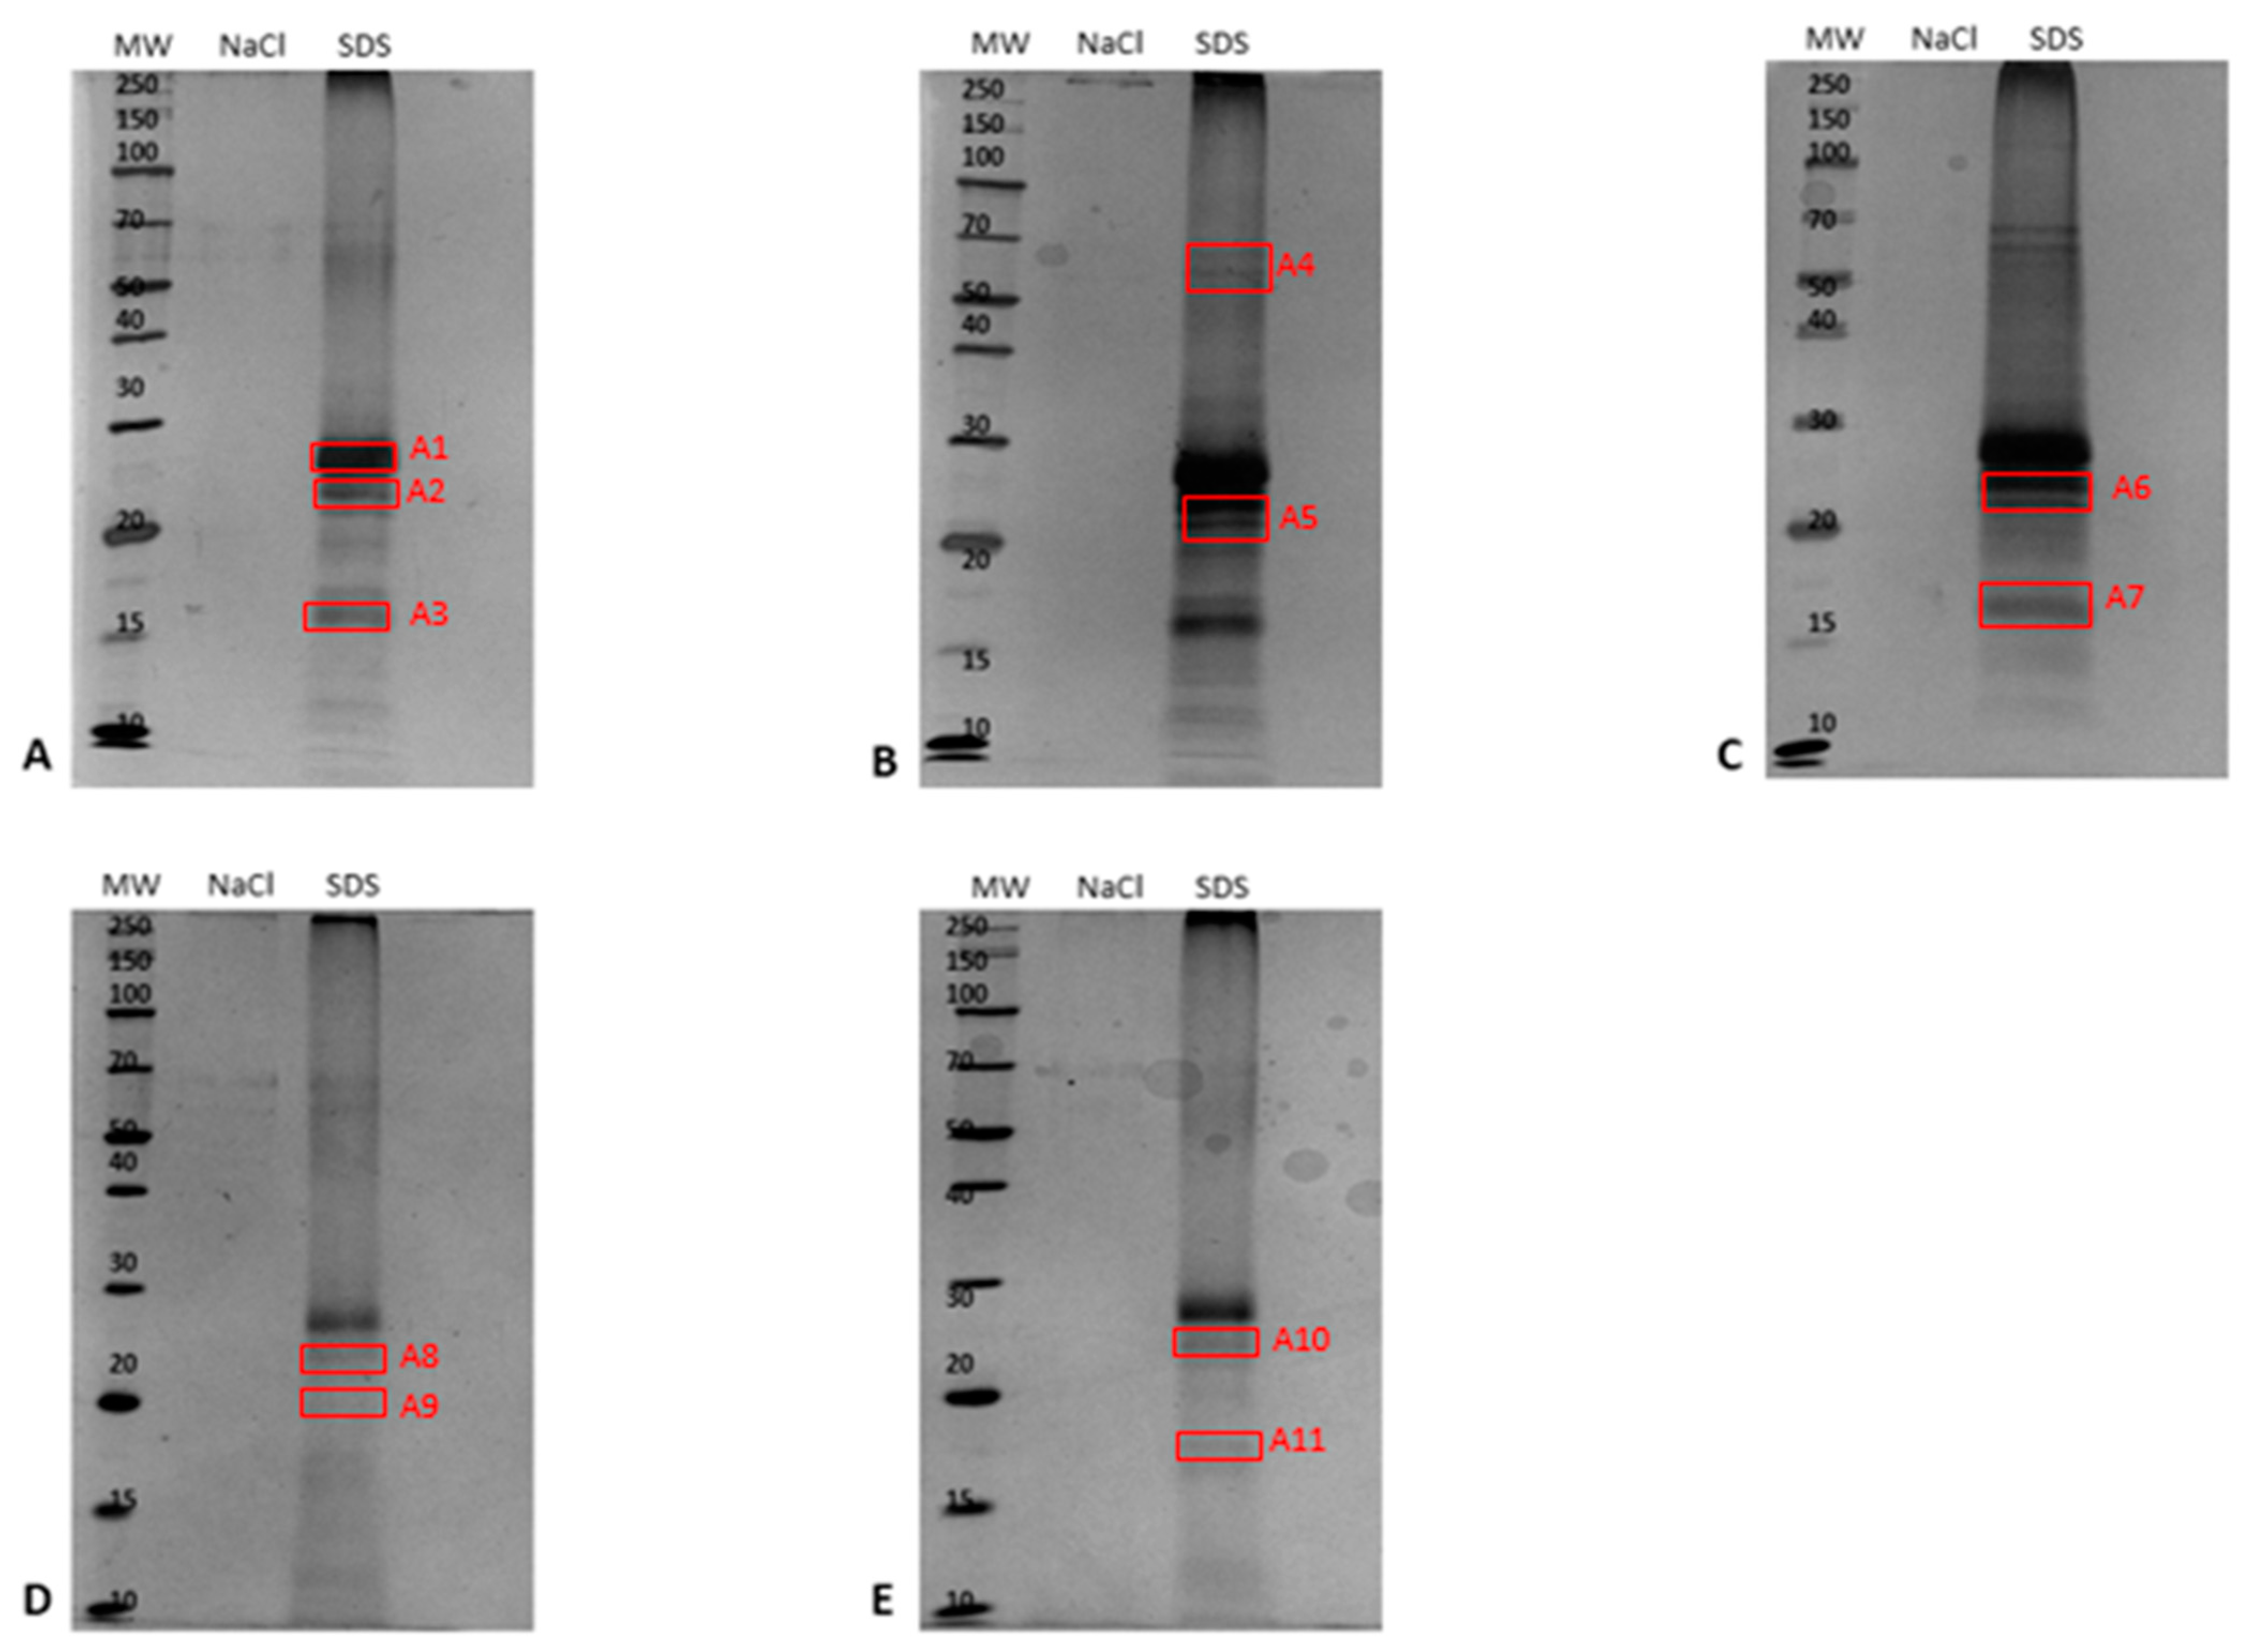
4.5. Protein Precipitation and SDS-PAGE

Proteins from the desorbed affinity fractions were precipitated with absolute acetone at a 1:2 (v/v) ratio at −20 °C overnight to remove any substances that may have interfered with SDS-PAGE and mass-spectrometry and to achieve maximum protein yield. Fractions with acetone were briefly vortexed prior to centrifugation at 13,000× g for 10 min at 4 °C, after which the supernatant was carefully discarded. Pelleted proteins were washed twice with ice cold 80% (v/v) acetone, centrifuged at 13,000× g for 10 min between each wash step, and solubilized in SDS sample buffer. SDS-PAGE was performed by resolving ergosterol-interacting candidate proteins on 12% gels using the Hoefer Scientific miniVE vertical electrophoresis system at constant voltage of 90 V for 3 h at RT (Section 4.2). Gels were stained using the silver staining protocol adapted from Switzer III et al. [68] and Blum et al. [69].

4.6. In-Gel Trypsin Digestion

Coomassie-stained gel slices were destained twice in a solution containing 100 mM ammonium bicarbonate (NH4HCO3) (Sigma, Steinheim, Germany) and 50% (v/v) acetonitrile (ACN) for 45 min at RT with constant agitation, while silver-stained gel pieces were covered with a solution of 30 mM potassium ferricyanide and 100 mM sodium thiosulfate and agitated until clear at RT. Solutions were discarded, and gel pieces were washed with milliQ H2O followed by an addition of 2 mM Tris(2-carboxyethyl) phosphine (TCEP) (Sigma, Steinheim, Germany) that was made up in 25 mM NH4HCO3 and incubated for 15 min at RT with constant agitation to reduce proteins. Excess TCEP was removed, and gel pieces were washed three times with 500 µL NH4HCO3 for 15 min. Concentrated ACN was added, and samples underwent desiccation under vacuum centrifugation. Thereafter, gel pieces were covered with sequencing grade trypsin (20 ng/µL) (Promega, Madison, WI, USA) dissolved in 50 mM NH4HCO3 and incubated on ice for 1 h. Excess trypsin solution was removed, and sufficient 50 mM NH4HCO3 was added, followed by incubation for 18 h at 37 °C. Peptides were extracted from gel pieces using 0.1% (v/v) trifluoroacetic acid (TFA) (Sigma, St. Louis, MO, USA) and incubation for 1 h at 37 °C. Peptides were then collected by centrifugation at 40× g for 5 min and dried under vacuum, followed by resuspension in 12 µL loading buffer [2% ACN, 0.1% formic acid (FA) (Sigma, St. Louis, MO, USA)] prior to analysis.

4.7. LC-MS/MS Analysis

Analysis was conducted at the Centre for Proteomics and Genomic Research (CPGR) (Cape Town, South Africa). Nano-RP LC was performed on a Dionex Ultimate 3000 nano-HPLC system coupled with a Q-Extractive Quadrupole-Orbitrap mass spectrometer (Thermo Fisher Scientific, Waltham, MA, USA) for LC-MS/MS analysis. The mobile phase solvent system employed was solvent A: water/0.1% FA and solvent B: 100% ACN/0.1% FA. Solubilized peptides were loaded onto a C18 trap column (300 µm × 5 mm × 5 µm). Separation was performed on a C18 column (75 µm × 20 cm × 1.7 µm), and a linear gradient was generated at 300 nL/min with a change of 2–60% solvent B over 52 min. The mass spectrometer was operated in positive ion mode with a capillary temperature of 320 °C. The applied electrospray voltage was 1.95 kV. Lastly, mass spectrometry was performed using data-dependent acquisition MS/MS scans with a mass range of 350–2000 m/z.

4.8. Data analysis

Data analysis was performed using the Byonic software (Protein Metrics, Cupertino, CA, USA), product version PMI-Byonic-Com: v2.6.46. The Arabidopsis UniProt Knowledgebase (UniprotKB) database [70] was used to match peptide fragments resulting from the MS/MS. Peptides were fragmented using the collision-induced dissociation (CID) low energy, and the parameters were as follows: trypsin was a C-terminal cutter end, and carbamidomethyl (C) and deamination (NQ) were set for fixed and variable modification, respectively. The precursor tolerance was 7 ppm, and the fragment tolerance was 20 ppm. Maximum number of missed cleavage was 2, and the protein false discovery rate (FDR) cut-off was 1% with the best score range of 0–1000 m/z. A target protein with a best score of >300 was considered significant.

5. Conclusions

The purpose of the study was to identify Arabidopsis PM-associated candidate proteins in the response to ergosterol treatment as well as those possibly interacting with the MAMP as ligands. A small-scale isolation protocol was used to fractionate the Arabidopsis leaf tissue and resulted in the successful isolation of said fraction for different time points. This was confirmed by identification of PM and DRM markers subsequent to LC-MS/MS-based proteomics in excised 1D- and 2D-SDS-PAGE protein bands and spots from the non-enriched fraction (i.e., responsive candidate proteins). Thereafter, enrichment of PM-associated proteins (i.e., ergosterol-interacting candidate proteins) resulted in some that had been identified in previous studies using different elicitors, such as the bacterial flg22 and LPS, as well as fungal chitin. The perception mechanism of ergosterol in Arabidopsis is still unclear, but the identified candidate proteins show that there could possibly be a receptor complex (including non-PM yet associated proteins) involved in signaling the recognition of this MAMP to the intracellular components of the plant cell, and that is similar to other reported elicitors. Additionally, the second affinity-enrichment, which was meant to reduce non-specific binding, yielded very few ergosterol-interacting PM-associated candidate proteins, and this may suggest that derivatization of ergosterol resulted in critical alterations to molecular features that could have affected the association/interaction of the MAMP molecule with proteins.
Lastly, this study is a first of its kind because affinity chromatography has not yet been employed for capturing ergosterol-interacting PM-associated candidate proteins. As previously mentioned, the PM is the recognition site of many microorganisms and associated MAMPs, therefore understanding or identifying the interface proteomic changes involved during ergosterol-induced MTI may assist in further elaborating the protein network and pathways regulated during activation of immune responses that form part of plant defense.

Supplementary Materials

Supplementary materials can be found at https://www.mdpi.com/1422-0067/20/6/1302/s1.

Author Contributions

L.P. and I.D. conceptualized and designed the research; T.K. performed the research; and L.P., I.D. and T.K. analyzed data and prepared the manuscript.

Funding

L.P. would like to acknowledge financial support received from the Faculty Research Council, University of Johannesburg. The financial assistance of the South African National Research Foundation (NRF) is also acknowledged for bursary support to T.K.

Conflicts of Interest

All the authors declare no conflict of interest.

References

  1. Gómez-Gómez, L.; Boller, T. Flagellin perception: A paradigm for innate immunity. Trends Plant Sci. 2002, 7, 251–256. [Google Scholar] [CrossRef]
  2. Jones, J.D.G.; Dangl, J.L. The plant immune system. Nature 2006, 444, 323–329. [Google Scholar] [CrossRef] [PubMed] [Green Version]
  3. Ranf, S.; Gisch, N.; Schäffer, M.; Illig, T.; Westphal, L.; Knirel, Y.A.; Sánchez-Carballo, P.M.; Zähringer, U.; Hückelhoven, R.; Lee, J.; et al. A lectin S-domain receptor kinase mediates lipopolysaccharide sensing in Arabidopsis thaliana. Nat. Immunol. 2015, 16, 426–433. [Google Scholar] [CrossRef]
  4. Erbs, G.; Molinaro, A.; Dow, J.M.; Newman, M.-A. Lipopolysaccharides and plant innate immunity. Subcell. Biochem. 2010, 53, 387–403. [Google Scholar] [CrossRef] [PubMed]
  5. Henry, G.; Thonart, P.; Ongena, M. PAMPs, MAMPs, DAMPs and others: An update on the diversity of plant immunity elicitors. Biotechnol. Agron. Soc. Environ. 2012, 16, 257–268. [Google Scholar]
  6. Fu, Z.Q.; Dong, X. Systemic acquired resistance: Turning local infection into global defense. Annu. Rev. Plant Biol. 2013, 64, 839–863. [Google Scholar] [CrossRef] [PubMed]
  7. Dodds, P.N.; Rathjen, J.P. Plant immunity: Towards an integrated view of plant-pathogen interactions. Nat. Rev. Genet. 2010, 11, 539–548. [Google Scholar] [CrossRef] [PubMed]
  8. Boyd, L.A.; Ridout, C.; O’Sullivan, D.M.; Leach, J.E.; Leung, H. Plant-pathogen interactions: Disease resistance in modern agriculture. Trends Genet. 2013, 29, 233–240. [Google Scholar] [CrossRef]
  9. De Wit, P.J.G.M. How plants recognize pathogens and defend themselves. Cell. Mol. Life Sci. 2007, 64, 2726–2732. [Google Scholar] [CrossRef] [PubMed]
  10. Pritchard, L.; Birch, P.R.J. The zig-zag model of plant-microbe interactions: Is it time to move on? Mol. Plant Pathol. 2014, 15, 865–870. [Google Scholar] [CrossRef]
  11. Klemptner, R.L.; Sherwood, J.S.; Tugizimana, F.; Dubery, I.A.; Piater, L.A. Ergosterol, an orphan fungal microbe-associated molecular pattern (MAMP). Mol. Plant Pathol. 2014, 15, 747–761. [Google Scholar] [CrossRef] [PubMed]
  12. Granado, J.; Felix, G.; Boller, T. Perception of fungal sterols in plants. Plant Physiol. 1995, 107, 485–490. [Google Scholar] [CrossRef] [PubMed]
  13. Mannock, D.A.; Lewis, R.N.A.H.; McElhaney, R.N. A calorimetric and spectroscopic comparison of the effects of ergosterol and cholesterol on the thermotropic phase behavior and organization of dipalmitoylphosphatidylcholine bilayer membranes. Biochim. Biophys. Acta 2010, 1798, 376–388. [Google Scholar] [CrossRef] [PubMed] [Green Version]
  14. Sanabria, N.M.; Huang, J.-C.; Dubery, I.A. Self/nonself perception in plants in innate immunity and defense. Self/Nonself 2010, 1, 40–54. [Google Scholar] [CrossRef] [PubMed]
  15. Kasparovsky, T.; Milat, M.-L.; Humbert, C.; Blein, J.-P.; Havel, L.; Mikes, V. Elicitation of tobacco cells with ergosterol activates a signal pathway including mobilization of internal calcium. Plant Physiol. Biochem. 2003, 41, 495–501. [Google Scholar] [CrossRef]
  16. Lochman, J.; Mikes, V. Ergosterol treatment leads to the expression of a specific set of defence-related genes in tobacco. Plant Mol. Biol. 2006, 62, 43–51. [Google Scholar] [CrossRef] [PubMed]
  17. Rossard, S.; Luini, E.; Pérault, J.-M.; Bonmort, J.; Roblin, G. Early changes in membrane permeability, production of oxidative burst and modification of PAL activity induced by ergosterol in cotyledons of Mimosa pudica. J. Exp. Bot. 2006, 57, 1245–1252. [Google Scholar] [CrossRef] [PubMed]
  18. Rossard, S.; Roblin, G.; Atanassova, R. Ergosterol triggers characteristic elicitation steps in Beta vulgaris leaf tissues. J. Exp. Bot. 2010, 61, 1807–1816. [Google Scholar] [CrossRef]
  19. Gaulin, E.; Bottin, A.; Dumas, B. Sterol biosynthesis in oomycete pathogens. Plant Signal. Behav. 2010, 5, 258–260. [Google Scholar] [CrossRef] [Green Version]
  20. Keinath, N.F.; Kierszniowska, S.; Lorek, J.; Bourdais, G.; Kessler, S.A.; Shimosato-Asano, H.; Grossniklaus, U.; Schulze, W.X.; Robatzek, S.; Panstruga, R. PAMP (pathogen-associated molecular pattern)-induced changes in plasma membrane compartmentalization reveal novel components of plant immunity. J. Biol. Chem. 2010, 285, 39140–39149. [Google Scholar] [CrossRef]
  21. Vatsa, P.; Chiltz, A.; Luini, E.; Vandelle, E.; Pugin, A.; Roblin, G. Cytosolic calcium rises and related events in ergosterol-treated Nicotiana cells. Plant Physiol. Biochem. 2011, 49, 764–773. [Google Scholar] [CrossRef]
  22. Tugizimana, F.; Steenkamp, P.A.; Piater, L.A.; Dubery, I.A. Ergosterol-induced sesquiterpenoid synthesis in tobacco cells. Molecules 2012, 17, 1698–1715. [Google Scholar] [CrossRef]
  23. Dohnal, V.; Jezkova, A.; Pavlikova, L.; Musilek, K.; Jun, D.; Kuca, K. Fluctuation in the ergosterol and deoxynivalenol content in barley and malt during malting process. Anal. Bioanal. Chem. 2010, 397, 109–114. [Google Scholar] [CrossRef] [PubMed]
  24. Amborabé, B.-E.; Rossard, S.; Pérault, J.-M.; Roblin, G. Specific perception of ergosterol by plant cells. C. R. Biol. 2003, 326, 363–370. [Google Scholar] [CrossRef]
  25. Xu, X.; Bittman, R.; Duportail, G.; Heissler, D.; Vilcheze, C.; London, E. Effect of the structure of natural sterols and sphingolipids on the formation of ordered sphingolipid/sterol domains (rafts): Comparison of cholesterol to plant, fungal, and disease-associated sterols and comparison of sphingomyelin, cerebrosides and ceramide. J. Biol. Chem. 2001, 276, 33540–33546. [Google Scholar] [CrossRef] [PubMed]
  26. Giannini, J.L.; Ruiz-Cristin, J.; Briskin, D.P. A small scale procedure for the isolation of transport competent vesicles from plant tissues. Anal. Biochem. 1988, 174, 561–567. [Google Scholar] [CrossRef]
  27. Tsolis, K.C.; Economou, A. Quantitative proteomics of the E. coli membranome. Methods Enzymol. 2017, 586, 15–36. [Google Scholar] [CrossRef] [PubMed]
  28. Fischer, H.; Polikarpov, I.; Craievich, A.F. Average protein density is a molecular-weight-dependent function. Protein Sci. 2004, 13, 2825–2828. [Google Scholar] [CrossRef]
  29. Bern, M.; Kil, Y.J. Comments on “unbiased statistical analysis for multi-stage proteomic search strategies. J. Proteome Res. 2011, 10, 2123–2127. [Google Scholar] [CrossRef]
  30. Santoni, V.; Doumas, P.; Rouquié, D.; Mansion, M.; Rabilloud, T.; Rossignol, M. Large scale characterization of plant plasma membrane proteins. Biochimie 1999, 81, 655–661. [Google Scholar] [CrossRef]
  31. Alexandersson, E.; Saalbach, G.; Christer Larsson, C.; Kjellbom, P. Arabidopsis plasma membrane proteomics identifies components of transport, signal transduction and membrane trafficking. Plant Cell Physiol. 2004, 45, 1543–1556. [Google Scholar] [CrossRef] [PubMed]
  32. Ephritikhine, G.; Ferro, M.; Rolland, N. Plant membrane proteomics. Plant Physiol. Biochem. 2004, 42, 943–962. [Google Scholar] [CrossRef]
  33. He, P.; Shan, L.; Lin, N.-C.; Martin, G.B.; Kemmerling, B.; Nürnberger, T.; Sheen, J. Specific bacterial suppressors of MAMP signaling upstream of MAPKKK in Arabidopsis innate immunity. Cell 2006, 125, 563–575. [Google Scholar] [CrossRef] [PubMed]
  34. Liu, C.; Fukumoto, T.; Matsumoto, T.; Gena, P.; Frascaria, D.; Kaneko, T.; Katsuhara, M.; Zhong, S.; Sun, X.; Zhu, Y.; et al. Aquaporin OsPIP1; promotes rice salt resistance and seed germination. Plant Physiol. Biochem. 2013, 63, 151–158. [Google Scholar] [CrossRef]
  35. Kang, J.; Park, J.; Choi, H.; Burla, B.; Kretzschmar, T.; Lee, Y.; Martinoia, E. Plant ABC transporters. Arabidopsis Book 2011, 9, e0153. [Google Scholar] [CrossRef]
  36. Ji, H.; Peng, Y.; Meckes, N.; Allen, S.; Stewart, C.N., Jr.; Traw, M.B. ATP-dependent binding cassette transporter G family member 16 increases plant tolerance to abscisic acid and assists in basal resistance against Pseudomonas syringae DC3000. Plant Physiol. 2014, 166, 879–888. [Google Scholar] [CrossRef] [PubMed]
  37. Zhang, J.; Ma, H.; Feng, J.; Zeng, L.; Wang, Z.; Chen, S. Grape berry plasma membrane proteome analysis and differential expression during ripening. J. Exp. Bot. 2008, 59, 2979–2990. [Google Scholar] [CrossRef] [PubMed]
  38. Nouri, M.-Z.; Komatsu, S. Comparative analysis of soybean plasma membrane proteins under osmotic stress using gel-based and LC MS/MS-based proteomics approaches. Proteomics 2010, 10, 1930–1945. [Google Scholar] [CrossRef]
  39. Vilakazi, C.S.; Dubery, I.A.; Piater, L.A. Identification of lipopolysaccharide-interacting plasma membrane-type proteins in Arabidopsis thaliana. Plant Physiol. Biochem. 2017, 111, 155–165. [Google Scholar] [CrossRef]
  40. Wang, C.; Yan, X.; Chen, Q.; Jiang, N.; Fu, W.; Ma, B.; Liu, J.; Li, C.; Bednarek, S.Y.; Pan, J. Clathrin light chains regulate clathrin-mediated trafficking, auxin signaling, and development in Arabidopsis. Plant Cell 2013, 25, 499–516. [Google Scholar] [CrossRef]
  41. Mgcina, L.S.; Dubery, I.A.; Piater, L.A. Comparative conventional- and quantum dot-labeling strategies for LPS binding sites detection in Arabidopsis thaliana mesophyll protoplasts. Front. Plant Sci. 2015, 6, 335. [Google Scholar] [CrossRef] [PubMed]
  42. Pandey, D.; Rajendran, S.R.C.K.; Gaur, M.; Sajeesh, P.K.; Kumar, A. Plant defense signaling and response against necrotrophic fungal pathogens. J. Plant Growth Regul. 2016, 35, 1159–1174. [Google Scholar] [CrossRef]
  43. Borner, G.H.H.; Liley, K.S.; Stevens, T.J.; Dupree, P. Identification of glycosylphosphatidylinositol-anchored proteins in Arabidopsis. A proteomic and genomic analysis. Plant Physiol. 2003, 132, 568–577. [Google Scholar] [CrossRef]
  44. Peskan, T.; Westermann, M.; Oelmüller, R. Identification of low-density Triton X-100-insoluble plasma membrane microdomains in higher plants. Eur. J. Biochem. 2000, 267, 6989–6995. [Google Scholar] [CrossRef] [PubMed] [Green Version]
  45. Borner, G.H.H.; Sherrier, D.J.; Stevens, T.J.; Arkin, I.T.; Dupree, P. Prediction of glycosylphosphatidylinositol-anchored proteins in Arabidopsis. A genomic analysis. Plant Physiol. 2002, 129, 489–499. [Google Scholar] [CrossRef]
  46. Jarsch, I.K.; Ott, T. Perspectives on remorin proteins, membrane rafts, and their role during plant-microbe interactions. Mol. Plant Microbe Interact. 2011, 24, 7–12. [Google Scholar] [CrossRef] [PubMed]
  47. Ikonen, E. Roles of lipid rafts in membrane transport. Curr. Opin. Cell Biol. 2001, 13, 470–477. [Google Scholar] [CrossRef]
  48. Sharma, M.; Pandey, G.K. Expansion and function of repeat domain proteins during stress and development in plants. Front. Plant Sci. 2015, 6, 1218. [Google Scholar] [CrossRef] [PubMed]
  49. Monaghan, J.; Zipfel, C. Plant pattern recognition receptor complexes at the plasma membrane. Curr. Opin. Cell Biol. 2012, 15, 349–357. [Google Scholar] [CrossRef]
  50. Tang, D.; Wang, G.; Zhou, J.-M. Receptor kinases in plant-pathogen interactions: More than pattern recognition. Plant Cell 2017, 29, 618–637. [Google Scholar] [CrossRef] [PubMed]
  51. Sanabria, N.M.; van Heerden, H.; Dubery, I.A. Molecular characterization and regulation of a Nicotiana tabacum S-domain receptor-like kinase gene induced during an early rapid response to lipopolysacharrides. Gene 2012, 501, 39–48. [Google Scholar] [CrossRef] [PubMed]
  52. Baloyi, N.M.; Dubery, I.A.; Piater, L.A. Proteomic analysis of Arabidopsis plasma membranes reveals lipopolysaccharide-responsive changes. Biochem. Biophys. Res. Commun. 2017, 486, 1137–1142. [Google Scholar] [CrossRef] [PubMed]
  53. Esch, L.; Schaffrath, U. An update on jacalin-related lectins and their role in plant defense. Int. J. Mol. Sci. 2017, 18, 1592. [Google Scholar] [CrossRef]
  54. Keller, C.K.; Radwan, O. The functional role of 14-3-3 proteins in plant stress interactions. i-ACES 2015, 1, 100–110. [Google Scholar]
  55. Hayafune, M.; Berisio, R.; Marchetti, R.; Silipo, A.; Kayama, M.; Desaki, Y.; Arima, S.; Squeglia, F.; Ruggiero, A.; Tokuyasu, K.; et al. Chitin-induced activation of immune signaling by the rice receptor CEBiP relies on a unique sandwich-type dimerization. Proc. Natl. Acad. Sci. USA 2014, 111, E404–E413. [Google Scholar] [CrossRef] [Green Version]
  56. Simanshu, D.K.; Zhai, X.; Munch, D.; Hofius, D.; Markham, J.E.; Bielawski, J.; Bielawska, A.; Malinina, L.; Molotkovsky, J.G.; Mundy, J.W.; et al. Arabidopsis accelerated-cell-death11, ACD11, is a ceramide-1-phosphate transfer protein and intermediary regulator of phytoceramide levels. Cell Rep. 2014, 6, 388–399. [Google Scholar] [CrossRef]
  57. Liang, H.; Yao, N.; Song, J.T.; Luo, S.; Lu, H.; Greenberg, J.T. Ceramides modulate programmed cell death in plants. Genes Dev. 2003, 17, 2636–2641. [Google Scholar] [CrossRef] [Green Version]
  58. Varet, A.; Hause, B.; Hause, G.; Scheel, D.; Lee, J. The Arabidopsis NHL3 gene encodes a plasma membrane protein and its overexpression correlates with increased resistance to Pseudomonas syringae pv. tomato DC3000. Plant Physiol. 2003, 132, 2023–2033. [Google Scholar] [CrossRef]
  59. Elmore, J.M.; Liu, J.; Smith, B.; Phinney, B.; Coaker, G. Quantitative proteomics reveals dynamic changes in the plasma membrane during Arabidopsis immune signaling. Mol. Cell. Proteom. 2012, 11, M111–014555. [Google Scholar] [CrossRef]
  60. Raffaele, S.; Bayer, E.; Lafarge, D.; Cluzet, S.; Retana, S.G.; Boubekeur, T.; Leborgne-Castel, N.; Carde, J.-P.; Lherminier, J.; Noirot, E.; et al. Remorin, a Solanaceae protein in membrane rafts and plasmodesmata, impairs Potato virus X movement. Plant Cell 2009, 21, 1541–1555. [Google Scholar] [CrossRef]
  61. Marin, M.; Ott, T. Phosphorylation of intrinsically disordered regions in remorin proteins. Front. Plant Sci. 2012, 3, 86. [Google Scholar] [CrossRef]
  62. Zou, B.; Hong, X.; Ding, Y.; Wang, X.; Liu, H.; Hua, J. Identification and analysis of copine/BONZAI proteins among evolutionarily diverse plant series. Genome 2016, 59, 565–573. [Google Scholar] [CrossRef]
  63. Zhou, L.; Cheung, M.Y.; Li, M.-W.; Fu, Y.; Sun, Z.; Sun, S.-M.; Lam, H.-M. Rice hypersensitive induced reaction protein 1 (OsHIR1) associates with plasma membrane and triggers hypersensitive cell death. BMC Plant Biol. 2010, 10, 1–10. [Google Scholar] [CrossRef]
  64. Mohr, T.J.; Mammarelia, N.D.; Hoff, T.; Woffenden, B.J.; Jelesko, J.G.; McDowell, J.M. The Arabidopsis downy mildew resistance gene RPP8 is induced by pathogens and salicylic acid and is regulated by W box cis elements. Mol. Plant Microbe Interact. 2010, 23, 1303–1315. [Google Scholar] [CrossRef]
  65. Fairbanks, G.; Steck, T.L.; Wallach, D.F.H. Electrophoretic analysis of the major polypeptides of the human erythrocyte membrane. Biochemistry 1971, 10, 2606–2617. [Google Scholar] [CrossRef]
  66. Jordaan, J.; Simpson, C.; Brady, D.; Gardiner, N.S.; Gerber, I.B. Emulsion-Derived Particles. U.S. Patent 2013149730 A1, 13 June 2013. [Google Scholar]
  67. Tejada-Simon, M.V.; Pestka, J.J. Production of polyclonal antibody against ergosterol hemisuccinate using Freund’s and Titermax adjuvants. J. Food Protect. 1998, 61, 1060–1063. [Google Scholar] [CrossRef]
  68. Switzer, R.C., III; Merril, C.R.; Shifrin, S. A highly sensitive silver stain for detecting proteins and peptides in polyacrylamide gels. Anal. Biochem. 1979, 98, 231–237. [Google Scholar] [CrossRef]
  69. Blum, H.; Beier, H.; Gross, H.J. Improved silver staining of plant proteins, RNA and DNA in polyacrylamide gels. Electrophoresis 1987, 8, 93–99. [Google Scholar] [CrossRef]
  70. UniProt Knowledgebase (UniprotKB) Database. Available online: https://www.uniprot.org/ (accessed on 2017–2018).
Figure 1. Representative 12% 1D-SDS PAGE gels stained with the Fairbanks method and showing the homogenate (HM), microsomal (MF), and plasma membrane (PM)-associated fractions subsequent to isolation. Gels represent all time point treatments with ergosterol, where A = control, B = 0 h treated, C = 6 h treated, D = 12 h treated, and E = 24 h treated. Equal volumes (20 µL) of the samples were mixed with 2X sample buffer, and electrophoresis was carried out at 90 V for 3 h. The red blocks indicate bands that were excised (A1–A13) for liquid chromatography coupled with tandem mass spectrometry (LC-MS/MS) identification.
Ijms 20 01302 g001
Figure 2. Comparative 2D-SDS-PAGE analysis for ergosterol-treated Arabidopsis thaliana PM-associated extracts. Proteins were precipitated with acetone, and 100 µg total protein was loaded onto immobilized pH gradient (IPG) strips, pH 4–7, for isoelectric focusing (IEF). The protein regulation differences are shown for A = control, and B = 0 h -, C = 6 h -, D = 12 h -, and E = 24 h-treated samples. The red blocks (B1–B8) indicate the protein spots excised for LC-MS/MS identification.
Ijms 20 01302 g002
Figure 3. Representative elution profile of binding events between ergosterol-immobilized MagResyn™ magnetic microspheres and A. thaliana PM-associated proteins at 6 h following treatment. The blue curve represents the absorbance of the flow-through (unbound) fractions eluted with 10 mM Tris-HCl, pH 7.5. The green curve is the absorbance of the weakly bound proteins removed with 0.5 M NaCl, and the grey curve represents absorbance of proteins desorbed from the column with 1% SDS solution.
Ijms 20 01302 g003
Figure 4. Comparative 12% 1D-SDS-PAGE analysis of ergosterol-interacting candidate proteins eluted with 0.5 NaCl and 1% SDS during the affinity-capture procedure using epoxide magnetic microspheres, where A = control, and B = 0 h-, C = 6 h-, D = 12 h-, and E = 24 h-treated samples. For each fraction, 20 µg total protein was loaded and electrophoresed at constant 90 V at room temperature. The red blocks (A1–A14) were excised subsequent to silver staining and analyzed using LC-MS/MS.
Ijms 20 01302 g004
Figure 5. Representative elution profile of binding events between ergosterol-hemisuccinate immobilized on EAH Sepharose 4B resin and A. thaliana PM-associated proteins for the 6 h time point. The blue curve represents the flow-through fractions removed with 10 mM Tris-HCl, pH 7.5 buffer. The green curve represents the non-specifically bound fractions removed with 0.5 M NaCl in buffer, and the grey curve represents the proteins of interest eluted with 1% SDS in buffer.
Ijms 20 01302 g005
Figure 6. Comparative 12% 1D-SDS-PAGE analysis of ergosterol-interacting candidate proteins eluted with 0.5 M NaCl and 1% SDS during the affinity-capture procedure using EAH Sepharose 4B resin, where A = control, B = 0 h-, C = 6 h-, D = 12 h-, and E = 24 h-treated samples. For each fraction, 20 µg total protein was loaded and electrophoresed at constant 90 V at room temperature. The red blocks (A1–A11) were excised subsequent to silver staining and analyzed using LC-MS/MS for protein identification.
Ijms 20 01302 g006
Table 1. LC-MS/MS identification of A. thaliana PM-associated responsive proteins from selected 1D SDS-PAGE bands of control, 0-, 6-, 12-, and 24 h fractions subsequent to ergosterol treatment and organized according to functional categories (Supplementary Data Sheet 1).
Sample No.Protein NameAccession No.Biological GO TermMolecular GO TermCalculated Mass a (M + H)Mass Error b (ppm)Byonic ™ Score c|Log Prob|d
Perception and signaling (17)
A5Calcium-dependent lipid-binding (CaLB domain) family protein At3g61050Q9LEX1Response
Signaling
DNA-binding1214.699−0.6422.18.18
A7Non-lysosomal glucosylceramidase At4g10060F4JLJ2Lipid MetabolismGlycosidase1294.627−1.9395.87.88
A10G-type lectin S-receptor-like serine/threonine-protein kinase CES101 At3g16030Q9LW83Perception ResponseTransferase1113.626−0.6350.03.23
A5Nicalin At3g44330Q9M292Signaling---1142.6420.4335.65.34
A7, A12Cysteine-rich receptor-like protein kinase 41 At4g00970O23081SignalingTransferase973.5310.3328.01.53
A3Axi 1 protein-like protein At2g44500O64884Biosynthesis MetabolismTransferase928.535−2.9289.72.72
A7Cysteine-rich receptor-like protein kinase 10 At4g23180Q8GYA4SignalingTransferase1223.6670.0285.96.63
A7PQQ_DH domain-containing protein At5g11560F4JXW9Biosynthesis---992.5411.2251.05.58
A8Probable serine/threonine-protein kinase At4g35230Q944A7DefenseTransferase1269.741−2.3236.26.31
A414-3-3-like protein GF14 epsilon At1g22300P48347SignalingProtein binding1229.580−1.5230.05.62
A9Phosphoinositide phospholipase C 2 At3g08510Q39033DefenseHydrolase996.645−0.5228.44.97
A7AMP deaminase At2g38280O80452ResponseHydrolase1123.5630.9224.04.69
A10Probable inactive leucine-rich repeat receptor-like protein kinase At3g03770Q8LFN2SignalingKinase1041.5150.4217.21.30
A13Mitogen-activated protein kinase 8 At1g18150Q9LM33SignalingKinase1028.5370.4200.28.87
A7Putative leucine-rich repeat receptor-like serine/threonine-protein kinase At2g24130Q9ZUI0SignalingTransferase1149.6262.2174.21.02
A7Leucine-rich repeat receptor-like protein kinase At2g01210Q9ZU46SignalingTransferase870.5410.1164.60.9
A7Receptor-like kinase TMK4 At3g23750Q9LK43SignalingKinase1020.5720.6121.51.15
Membrane trafficking and transport (16)
A5V-type proton ATPase subunit B2 At4g38510Q9SZN1TransportHydrolase1563.801−1.4574.59.38
A7Patellin-1 At1g72150Q56WK6GrowthLipid binding1231.689−0.7515.87.93
A3Ras-related protein RABE1c At3g46060P28186Signaling
Transport
GTPase1071.641−0.9412.58.36
A7ATPase 1, plasma membrane-type At2g18960P20649TransportTranslocase1040.5740.5401.77.98
A6Ras-related protein RABA1g At3g15060Q9LK99Signaling
Transport
GTPase1043.610−0.1384.78.14
A7Clathrin heavy chain 1 At3g11130Q0WNJ6TransportClathrin binding992.5780.5289.65.65
A3, A7Probable aquaporin PIP1-5 At4g23400Q8LAA6TransportWater transport1049.599−0.5288.96.62
A5Aquaporin PIP1-2 At2g45960Q06611TransportWater transport1033.604−0.7282.36.57
A7CSC1-like protein ERD4 At1g30360Q9C8G5TransportIon channel1251.6120.5271.57.51
A4Probable ADP, ATP carrier protein At5g56450Q9FM86TransportATP:ADP transport1021.531−0.3254.15.24
A3Ras-related protein RABA1e At4g18430O49513Signaling
Transport
GTPase1274.612−1.4240.97.40
A8Aquaporin TIP1-2 At3g26520Q41963TransportWater transport1980.0300.0239.96.69
A4, A5, A8Aquaporin PIP2-1 At3g53420P43286TransportWater transport1069.5680.2215.35.98
A5Probable aquaporin PIP2-6 At2g39010Q9ZV07TransportWater transport1311.669−0.8214.51.65
A7Exocyst complex component SEC3A At1g47550Q9SX85TransportGTP-Rho binding1015.578−1.7183.91.26
A1Aluminum-activated malate transporter 6 At2g17470Q9SHM1TransportMalate transporter1606.8322.8401.29
Defense (6)
A5Trans-cinnamate 4-monooxygenase At2g30490P92994Biosynthesis DefenseMonooygenase activity1271.721−0.3377.38.02
A9Protein BONZAI 2 At5g07300Q5S1W2ResponsePhospholipid binding1199.6630.2340.27.66
A3Temperature-induced lipocalin-1 At5g58070Q9FGT8ResponseStorage protein1110.531−0.5329.07.88
A7Disease resistance protein RPP8 At5g43470Q8W4J9DefenseATP:ADP binding1140.557−2.1267.76.39
A4Hypersensitive-induced response protein 3 At3g01290Q9SRH6Response---949.547−1.6237.05.91
A4Uncharacterized protein (LOW PSII ACCUMULATION-like protein) At4g28740F4JM22Chloroplast---995.600-0.1131.81.24
Structure (1)
A2Putative clathrin assembly protein At1g14910P94017TransportClathrin binding1314.742−1.3122.21.22
Unknown (8)
A11Triacylglycerol lipase-like 1 At1g45200Q8L7S1MetabolismHydrolase1222.622−0.2336.66.54
A11TNF receptor associated factor (TRAF)-like family protein At1g58270/F19C14_8Q9SLV3Signal transduction----1434.722−0.8286.26.92
A7Uncharacterized protein At4g16180F4JLQ2------1293.669−2.2235.35.38
A1Putative uncharacterized protein At3g19340Q8RWC3---Aminopeptidase1219.632−0.9229.55.94
A12Putative uncharacterized protein F14P22.240 At3g58650Q9M2F2Growth---472.288−1.1160.41.04
A12Putative uncharacterized protein F3A4.21 At3g50130Q9SN05------472.288−1.1160.40.92
A2Uncharacterized protein At4g38260F4JTM0------1245.520−5.2142.30.98
A2EMB|CAB72473.1 At5g22560Q9FK83------1467.7310.1133.61.21
a = the computed M + H precursor mass for the peptide spectrum matches (PSMs); b = a calculated mass error (parts per million) after correcting the observed M + H (single charged) precursor mass and the computed M + H precursor mass; c = Byonic score, and primary indicator of PSM correctness. A score of 300 is considered to be a significant hit [29]; d = the log p-value of the PSM, of which the value should be ≥ 1 for a hit to be significant. Proteins highlighted in red are known plasma membrane (PM) markers.
Table 2. LC-MS/MS identification of A. thaliana PM-associated responsive proteins from selected 2D SDS-PAGE spots of control, 0- , 6- , 12-, and 24 h fractions subsequent to ergosterol treatment and arranged according to functional categories (Supplementary Data Sheet 2).
Sample No.Protein NameAccession No.Biological GO TermMolecular GO TermCalculated Mass a (M + H)Mass Error b (ppm)Byonic ™ Score c|Log Prob| d
Perception and signaling (10)
B7Probable serine/threonine-protein kinase At4g35230Q944A7SignalingTransferase1269.7410.1480.67.29
B4At2g34560 protein (P-loop containing nucleoside triphosphate hydrolase) At2g34560B9DGC0TransportATPactivity1156.672−0.8401.38.95
B3Aspartyl aminopeptidase At5g60160/f15|12_20Q9LST0BiosynthesisMetalloaminopeptidase1148.6790.3382.08.65
B8Probable protein phosphatase 2C 20 At2g20630Q9SIU8SignalingHydrolase1288.711−0.1363.17.51
B6Abscisic acid receptor PYL1 At5g46790Q8VZS8SignalingReceptor1442.760−0.5357.29.01
B7Phosphotidylinositol 4-kinase alpha 1 At1g49340Q9SXA1SignalingKinase1964.0410.1345.56.85
B2Protein SGT1 homolog B At4g11260Q9SUT5Signaling---1435.709−1.4351.98.86
B1Fasciclin-like arabinogalactan protein 7 At2g04780Q9SJ81Biosynthesis---981.5000.9322.06.49
B21-Phosphotidylinositol-3-phosphate 5-kinase FAB1A At4g33240Q0WUR5SignalingKinase1470.816−1.8303.87.75
B8Plasma membrane-associated cation-binding protein 1 At4g20260Q96262ResponseIon binding1146.6410.0281.27.00
Membrane trafficking and transport (16)
B2V-type proton ATPase subunit B3 At1g20260Q8W4E2TransportHydrolase1563.801−1.9442.29.76
B8Alpha-soluble NSF attachment protein 2 At3g56190Q9SPE6Transport---1259.684−0.8426.38.35
B6Ras-related protein RABA1d At4g18800Q9SN35SignalingGTPase1043.6100.0414.77.96
B4, B7Patellin-2 At1g22530Q56ZI2TransportLipid-binding1520.784−0.7391.99.24
B4, B7Patellin-1 At1g72150Q56WK6TransportLipid-binding1231.689−2.0372.25.53
B2Clathrin light chain 3 At3g51890F4J5M9TransportClathrin binding855.5300.0363.44.96
B6Ras-related protein RABA5b At3g07410Q9SRS5SignalingGTPase1071.641−0.9357.38.16
B3SNAP25 homologous protein SNAP33 At5g61210Q9S7P9TransportSNAP receptor1302.715−1.3352.66.82
B1, B4, B8V-type ATPase catalytic subunit A At1g78900O23654TransportHydrolase1019.552−1.6338.65.50
B7Sugar transport protein 7 At4g02050O04249TransportTransmembrane transporter1006.4690.9338.16.27
B3Auxin transport protein BIG At3g02260Q9SRU2SignalingZinc binding589.356−1.4331.25.39
B3Protein NETWORKED 1C At4g02710Q9ZQX8---Actin binding478.2510.1311.46.18
B3ABC transporter C family member 8 At3g21250Q8LGU1TransportTranslocase530.330−0.3303.25.82
B8Syntaxin-71 At3g09740Q9SF29TransportSNAP receptor1081.6360.7299.77.30
B4, B7Flotillin-like protein 1 At5g25250Q501E6Transport---1526.909−1.8273.66.93
Defense (9)
B2, B4, B7Jacalin-related lectin 35 At3g16470O04309Perception
Response
Carbohydrate binding1469.763−2.5518.79.21
B6Aluminium induced protein with YGL and LRDR motifs At5g19140Q94BR2------1439.738−1.6420.48.77
B6, B8At3g11930 protein (Adenine nucleotide alpha hydrolases-like) At3g11930B9DG73---Hydrolase1189.631−2.2380.68.02
B4Callose synthase 9 At3g07160Q9SFU6Biosynthesis
Defense
Transferase557.402−0.9334.82.44
B8Hypersensitive-induced response protein 4 At5g51570Q9FHM7Defense
Signaling
---1466.7641.7345.68.36
B8Binding partner of ACD (accelerated cell death)11 1 At5g16840Q9LFD5SignalingRNA-binding1132.621−1.0332.17.69
B5, B8Hypersensitive-induced response protein 2 At1g69840Q9CAR7Defense
Signaling
Kinase binding871.500−1.3327.24.57
B6Dessication responsive protein At2g21620Q94II5---Hydrolase980.614−0.8293.56.84
B8Hypersensitive-induced response protein 1 At5g62740Q9FM19Defense
Signaling
Kinase-binding949.547−0.5281.67.29
a = the computed M + H precursor mass for the peptide spectrum matches (PSMs); b = a calculated mass error (parts per million) after correcting the observed M + H (single charged) precursor mass and the computed M + H precursor mass; c = Byonic score, and primary indicator of PSM correctness. A score of 300 is considered to be a significant hit [29]; d = the log p-value of the PSM, of which the value should be ≥ 1 for a hit to be significant. Proteins highlighted in red are known PM markers.
Table 3. LC-MS/MS identification of A. thaliana PM-associated candidate proteins interacting with ergosterol immobilized on epoxide magnetic microspheres for control, 0-, 6-, 12-, and 24 h subsequent to treatment and listed according to functional categories (Supplementary Data Sheet 3).
Sample No.Protein NameAccession No.Biological GO TermMolecular GO TermCalculated Mass a (M + H)Mass Error b (ppm)Byonic™ Score c|Log Prob|d
Signaling
A12Uncharacterized glycosylphophatidylinositol (GPI)-anchored protein At5g19250P59833------1910.898−3.1464.48.69
A13Binding partner of ACD (accelerated cell death)11 1 At5g16840Q9LFD5Signaling
Response
RNA-binding1132.621−1.0428.48.21
A4Probable inactive receptor kinase At3g02880Q9M8T0ResponseReceptor1426.706−3.0392.26.99
A13Uncharacterized GPI-anchored protein At5g19250P59833------1910.898−3.5388.27.32
A11Leucine-rich repeat-containing protein At5g07910Q8RWI2Response---1269.727−0.5336.87.18
A4Probable inactive receptor kinase At5g16590Q9FMD7ResponseReceptor2127.170−1.5324.58.27
A11Leucine-rich repeat protein kinase-like protein At1g10850Q940B9Signaling
Response
Kinase984.5841.0322.06.56
A11, A14Chitin elicitor receptor kinase 1 At3g21630A8R7E6Perception
Signaling
Kinase1132.596−0.6313.86.87
Membrane trafficking and transport
A1, A5Aquaporin PIP2-7 At4g35100P93004TransportWater channel1312.653−1.4541.67.44
A1Aquaporin PIP1-2 At2g45960Q06611TransportWater channel1017.548−0.3509.06.59
A1Aquaporin PIP2-1 At3g53420P43286TransportWater channel2000.996−1.2473.210.44
A1Probable aquaporin PIP1-5 At4g23400Q8LAA6TransportWater channel1230.632−1.1464.39.05
A8Plasma membrane-associated cation-binding protein 1 At4g20260Q96262ResponseIon-binding1425.711−2.6418.88.56
A4ATPase 2, plasma membrane-type At4g30190P19456TransportTranslocase1040.574−0.2412.07.60
A6At2g34250 protein At2g34250O80774TransportProtein transport1164.601−2.0408.26.50
A1Ras-related protein RABE1c At3g46060P28186Signaling GTPase1071.641−0.7394.88.40
A9, A12CASP-like protein 1D1 At4g15610Q9FE29------1127.657−0.3389.49.41
A11Plasma membrane ATPase At4g30190F4JPJ7TransportTranslocase1040.574−0.2381.38.04
A11ATPase 5, plasma membrane-type At2g24520Q9SJB3TransportTranslocase1040.5740.0362.87.00
A11Fasciclin-like arabinogalactan protein 8 At2g45470O22126------967.484−0.8348.87.71
A11Patellin-1 At1g72150Q56WK6TransportLipid-binding1078.589−1.2326.87.67
A1F-box/LRR-repeat protein At3g60040Q8GWI2Response---784.529−0.3309.11.05
A9ABC transporter G family member 41 At4g15215Q7PC83TransportATP-binding543.386−0.9301.84.38
A6CSC1-like protein ERD4 At1g30360Q9C8G5TransportIon channel1583.8502.7301.47.40
Defense response
A5Hypersensitive-induced response protein 3 At3g01290Q9SRH6Defense
Signaling
Response
---1519.775−1.6489.08.32
A6Syntaxin-121 At3g11820Q9ZSD4DefenseSNAP receptor1329.701−1.4439.97.40
A10NDR1/HIN1-like protein 3 At5g06320Q9FNH6Defense---1496.843−1.8394.38.73
A10Protein BONZAI 2 At5g07300Q5S1W2DefensePhospholipid-binding1060.6150.0372.47.25
A11, A14Remorin At2g45820O80837------617.409−1.8358.24.82
A11, A14Blue copper protein At5g20230Q07488TransportElectron transfer1425.664−0.4337.89.34
Unknown
A11At1g55160/T7N22.11 At1g55160Q9C542------1174.631−0.2384.78.38
A11At3g08600/F17014_7 At3g08600Q9C9Z6------903.453−0.2352.47.93
A14Expressed protein At2g18690Q9ZV49------1115.606−1.0319.26.03
a = the computed M + H precursor mass for the peptide spectrum matches (PSMs); b = a calculated mass error (parts per million) after correcting the observed M + H (single charged) precursor mass and the computed M + H precursor mass; c = Byonic score, primary indicator of PSM correctness. Score of 300 is considered to be a significant hit [29]; d = the log p-value of the PSM, which the value should be ≥ 1 for hit to be significant.
Table 4. LC-MS/MS identification of A. thaliana PM-associated candidate proteins interacting with ergosterol-hemisuccinate immobilized on EAH Sepharose 4B resin for the time study (Supplementary Data Sheet 4).
Sample No.Protein NameAccession No.Biological GO TermMolecular GO TermCalculated Mass a (M + H)Mass Error b (ppm)Byonic™ Score c|Log Prob|d
A7Ras-related protein RABG1 At5g39620Q948K6SignalingGTP-binding1071.6410.0515.006.92
A4Aquaporin PIP1-2 At2g45960Q06611TransportWater channel1033.604−1.2336.36.55
A101-Phosphotidylinositol-3-phosphate-5-kinase FAB1B At3g14270Q9LUM0---Kinase956.480−0.5328.46.19
A6Ras-related protein RABE1c At3g46060P28186SignalingGTP-binding1164.5900.6319.26.34
A1Aquaporin PIP2-1 At3g53420P43286TransportWater channel1069.5680.4284.55.82
a = the computed M + H precursor mass for the peptide spectrum matches (PSMs); b = a calculated mass error (parts per million) after correcting the observed M + H (single charged) precursor mass and the computed M + H precursor mass; c = Byonic score, primary indicator of PSM correctness. Score of 300 is considered to be a significant hit [29]; d = the log p-value of the PSM, which the value should be ≥ 1 for hit to be significant.

