Article

Transcriptional Regulation Factors of the Human Mitochondrial Aspartate/Glutamate Carrier Gene, Isoform 2 (SLC25A13): USF1 as Basal Factor and FOXA2 as Activator in Liver Cells

by
Paolo Convertini
1,2,
Simona Todisco
1,
Francesco De Santis
2,
Ilaria Pappalardo
1,
Dominga Iacobazzi
3,
Maria Antonietta Castiglione Morelli
1,
Yvonne N. Fondufe-Mittendorf
4,
Giuseppe Martelli
1,
Ferdinando Palmieri
2 and
Vittoria Infantino
1,2,*
1
Department of Science, University of Basilicata, 85100 Potenza, Italy
2
Department of Biosciences, Biotechnologies and Biopharmaceutics, University of Bari, 70125 Bari, Italy
3
Bristol Heart Institute, Bristol Medical School, University of Bristol, Bristol BS2 8HW, UK
4
Department of Molecular and Cellular Biochemistry, University of Kentucky, Lexington, KY 40536, USA
*
Author to whom correspondence should be addressed.
Int. J. Mol. Sci. 2019, 20(8), 1888; https://doi.org/10.3390/ijms20081888
Submission received: 30 March 2019 / Revised: 12 April 2019 / Accepted: 14 April 2019 / Published: 16 April 2019
(This article belongs to the Special Issue Amino Acids Transport and Metabolism 2.0)

Abstract

:
Mitochondrial carriers catalyse the translocation of numerous metabolites across the inner mitochondrial membrane, playing a key role in different cell functions. For this reason, mitochondrial carrier gene expression needs tight regulation. The human SLC25A13 gene, encoding for the mitochondrial aspartate/glutamate carrier isoform 2 (AGC2), catalyses the electrogenic exchange of aspartate for glutamate plus a proton, thus taking part in many metabolic processes including the malate-aspartate shuttle. By the luciferase (LUC) activity of promoter deletion constructs we identified the putative promoter region, comprising the proximal promoter (−442 bp/−19 bp), as well as an enhancer region (−968 bp/−768 bp). Furthermore, with different approaches, such as in silico promoter analysis, gene silencing and chromatin immunoprecipitation, we identified two transcription factors responsible for SLC25A13 transcriptional regulation: FOXA2 and USF1. USF1 acts as a positive transcription factor which binds to the basal promoter thus ensuring SLC25A13 gene expression in a wide range of tissues. The role of FOXA2 is different, working as an activator in hepatic cells. As a tumour suppressor, FOXA2 could be responsible for SLC25A13 high expression levels in liver and its downregulation in hepatocellular carcinoma (HCC).

Graphical Abstract

1. Introduction

The human aspartate/glutamate carrier isoform 2 (AGC2), encoded by the SLC25A13 gene, is a member of the mitochondrial carrier family [1,2]. This family of transporters translocates a variety of metabolites across the mitochondrial membrane, thus linking biological and metabolic processes occurring in both mitochondria and cytosol [3,4]. Humans possess another isoform of the aspartate-glutamate carrier, AGC1, which is encoded by the SLC25A12 gene.
Both AGC1 and AGC2 exhibit a high substrate specificity for aspartate and glutamate and catalyse an electrogenic exchange of intramitochondrial aspartate- for external glutamate plus a proton [5]. AGCs are essential for the malate/aspartate shuttle, which transfers the reducing equivalents of NADH plus H+ from cytosol to mitochondria [6] and is vital for aerobic glycolysis and alcohol metabolism, as well as for the supply of aspartate from the mitochondria to the cytosol, which is necessary for urea synthesis, purine and pyrimidine synthesis, protein synthesis and gluconeogenesis from lactate [7], especially in cells with negligible capacity for taking up aspartate from the blood, such as hepatocytes and neurons. Furthermore, the activity of AGCs in transfected mammalian cells is regulated by cytosolic Ca2+ reacting with AGCs on the external side of the mitochondrial membrane [8,9]. Thus AGCs, like the ATP-Mg/phosphate carriers [10,11,12,13], consist of two domains: the C-terminal domain containing all the sequence features of the mitochondrial carrier family members and the N-terminal domain protruding outside the mitochondrial matrix and containing EF (helix-loop-helix family)-hand Ca2+-binding motifs [5]. In spite of their common features, AGCs differ in their tissue-expression pattern—AGC1 is expressed at high levels only in heart, brain and skeletal muscle and AGC2 in many tissues and abundantly in the liver [14,15]. Furthermore, several studies highlighted distinctive functions of AGCs in normal and pathological conditions, which are largely but not completely explained by their different tissue expression. Mutations in SLC25A12 are responsible for a disease characterized by developmental delay, epilepsy, hypotonia, hypomyelinization and decreased N-acetylaspartate in brain [16,17], whereas mutations in SLC25A13 result in type II citrullinemia, which manifests with a dislike for carbohydrates, the inability to consume alcohol, citrullinemia and hyperammonemia leading to encephalopathy and neuropsyachiatric symptoms [18,19,20]. In particular, a specific involvement of AGC1 in hepatocellular carcinoma (HCC) and N-acetylaspartate synthesis in mice lacking AGC1 has been reported [21,22].
Due to the relevance of the mitochondrial carrier family members in metabolism, their activity must be regulated in different tissues and under various physiological and pathological conditions. It is not surprising, therefore, that the molecular mechanisms involved in gene expression regulation of several mitochondrial carriers, as well as the changes of their gene expression occurring during cell differentiation or in different tissues, diseases and cancer, have been thoroughly studied [23,24,25,26,27,28,29,30,31]. For example, it has been shown that in neuronal cells the gene expression of SLC25A12 is primarily activated by the transcription factor CREB (cAMP response element binding protein), upregulated in neuronal differentiation and downregulated in neuroinflammation [32]. Furthermore, histone acetylation switches on SLC25A12 gene in HCC cells [22]. In contrast, the molecular mechanisms regulating SLC25A13 (AGC2) gene expression and its transcriptional control are still completely unknown.
In this work, we have investigated the transcriptional regulation of SLC25A13 and identified two transcriptional factors, USF1 and FOXA2, that act as positive regulators of the SLC25A13 gene expression. In particular, we have shown that FOXA2 works as a transcriptional activator and this might be a possible mechanism responsible for SLC25A13 high expression levels in liver and downregulation in HCC as well as its expression pattern in different tissues.

2. Results

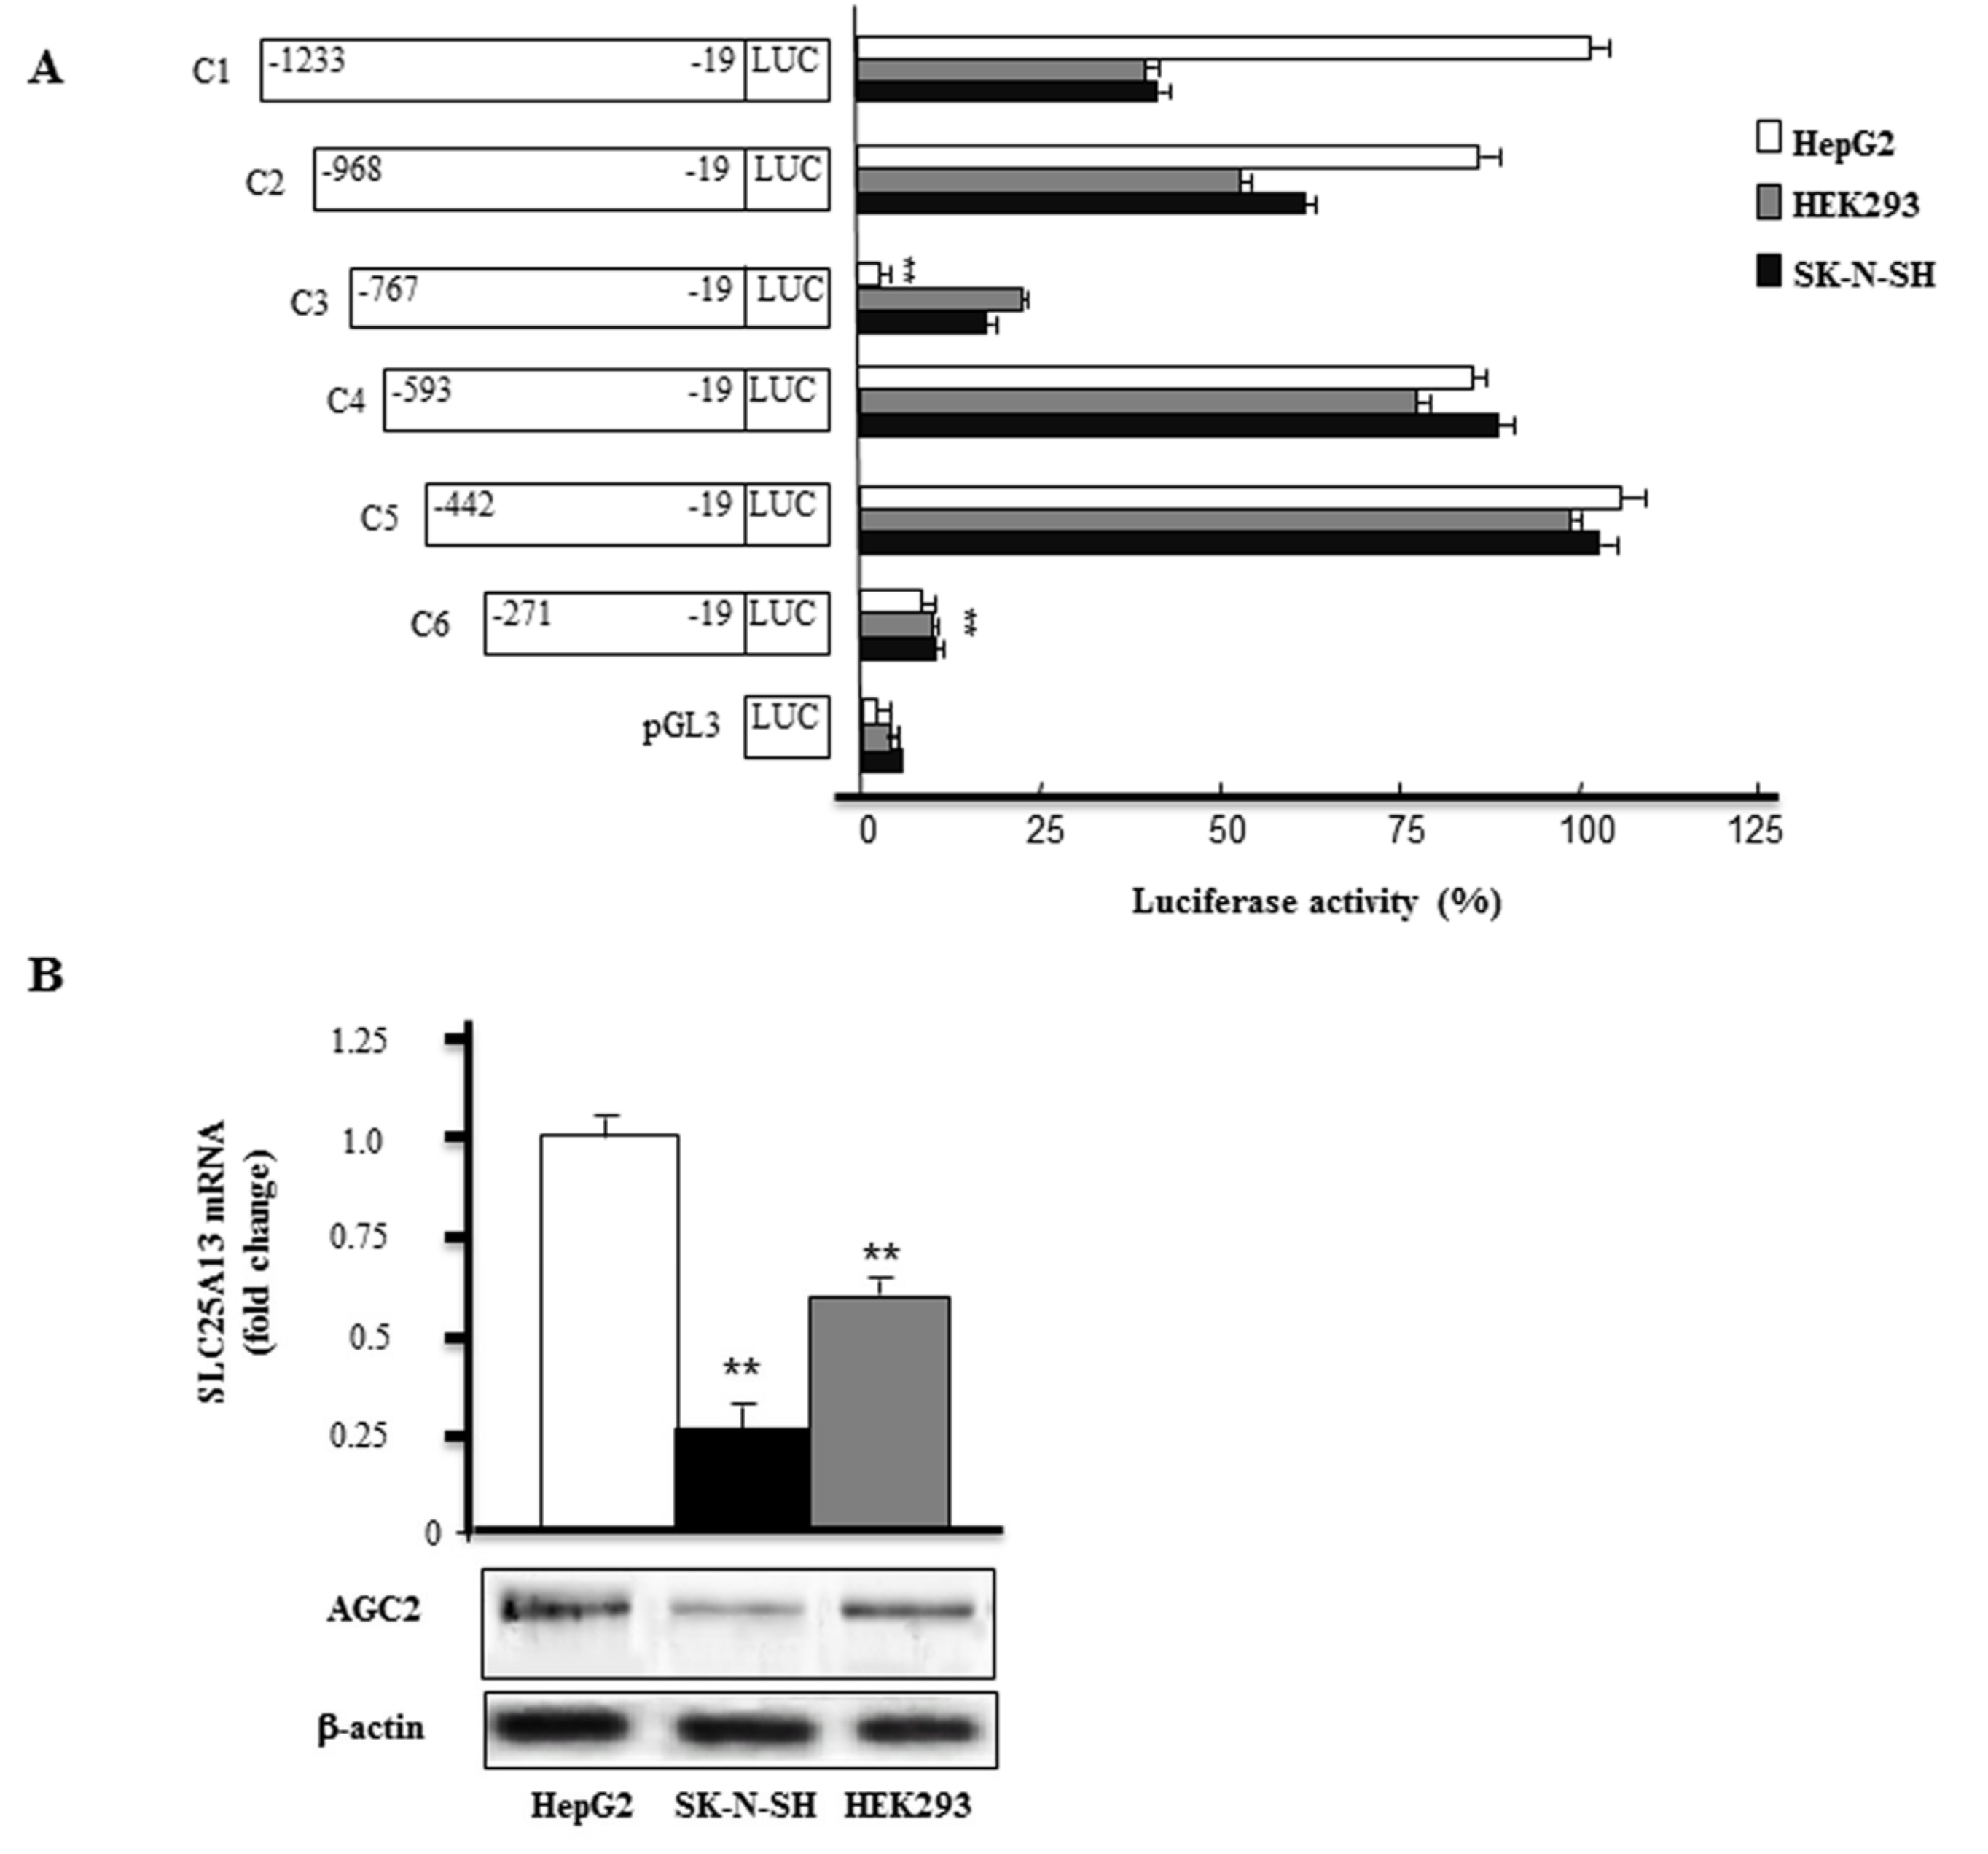
2.1. Screening of SLC25A13 Gene Promoter Activity

To analyse the promoter activity of the 5′-flanking region of the human SLC25A13 gene, various truncated versions of its promoter (from −1223 to −19 bp) were amplified and cloned into the luciferase (LUC) reporter vector pGL3 basic. These constructs were transfected into HepG2, SK-N-SH and HEK293 cell lines to determine the sequence elements required for SLC25A13 promoter activity. The results represented in Figure 1A show that the removal of the nucleotides from −968 to −768 bp (C3) displayed inhibited promoter activity though at varying levels. For instance, a reduction of luciferase activity of about 95% in HepG2 and about 25% in SK-N-SH and HEK293 cells, respectively, was found transfecting construct C3 compared to that of construct C1 transfected in HepG2 cells set to 100% (Figure 1A).
In all cell lines, deletion from −767 to −594 bp (C4) almost restored SLC25A13 gene promoter activity that was further increased with the deletion of −593 to −443 bp (C5). Finally, deletion from −442 to −272 bp (C6) led to a drop in luciferase activity (Figure 1A) in HepG2 as well as in SK-N-SH and HEK293 cells. Because the luciferase activity driven by C5 is the highest within the deletion constructs and goes down significantly in all tested cell lines when driven by C6, we consider the region up to −272 bp as the proximal promoter containing regulatory elements able to drive the basal promoter activity of the human SLC25A13 gene. In summary, we identified an activation domain in HepG2 cells (−968/−768 bp) and found that the −442/−272 bp fragment upstream transcription starting site contains a minimal promoter working in different cell lines.
Next, we performed an in silico analysis of the 1200 bp of the human SLC25A13 promoter region. This analysis revealed the lack of typical TATA box and the presence of a CCAAT box (−225/−229), the initiator element (INR) at −58/−51 bp, a downstream core promoter element (DPE) at −40/−35 bp, a canonical E-box (CACGTG) at –416/−411 bp as well as a number of putative cis-regulatory elements for several transcriptional factors. In addition, we measured SLC25A13 mRNA and AGC2 protein basal levels with real-time polymerase chain reaction (PCR) and Western-blot analysis, respectively, in HepG2, SK-N-SH and HEK293 cell lines. Figure 1B shows that HepG2 cells had the highest levels of AGC2 expression while SK-N-SH cells the lowest levels. Given that HepG2 cells showed the strongest promoter activity together with the highest endogenous expression of the SK-N-SH gene, we used these cells for further investigations about the molecular mechanisms involved in SLC25A13 gene expression regulation.

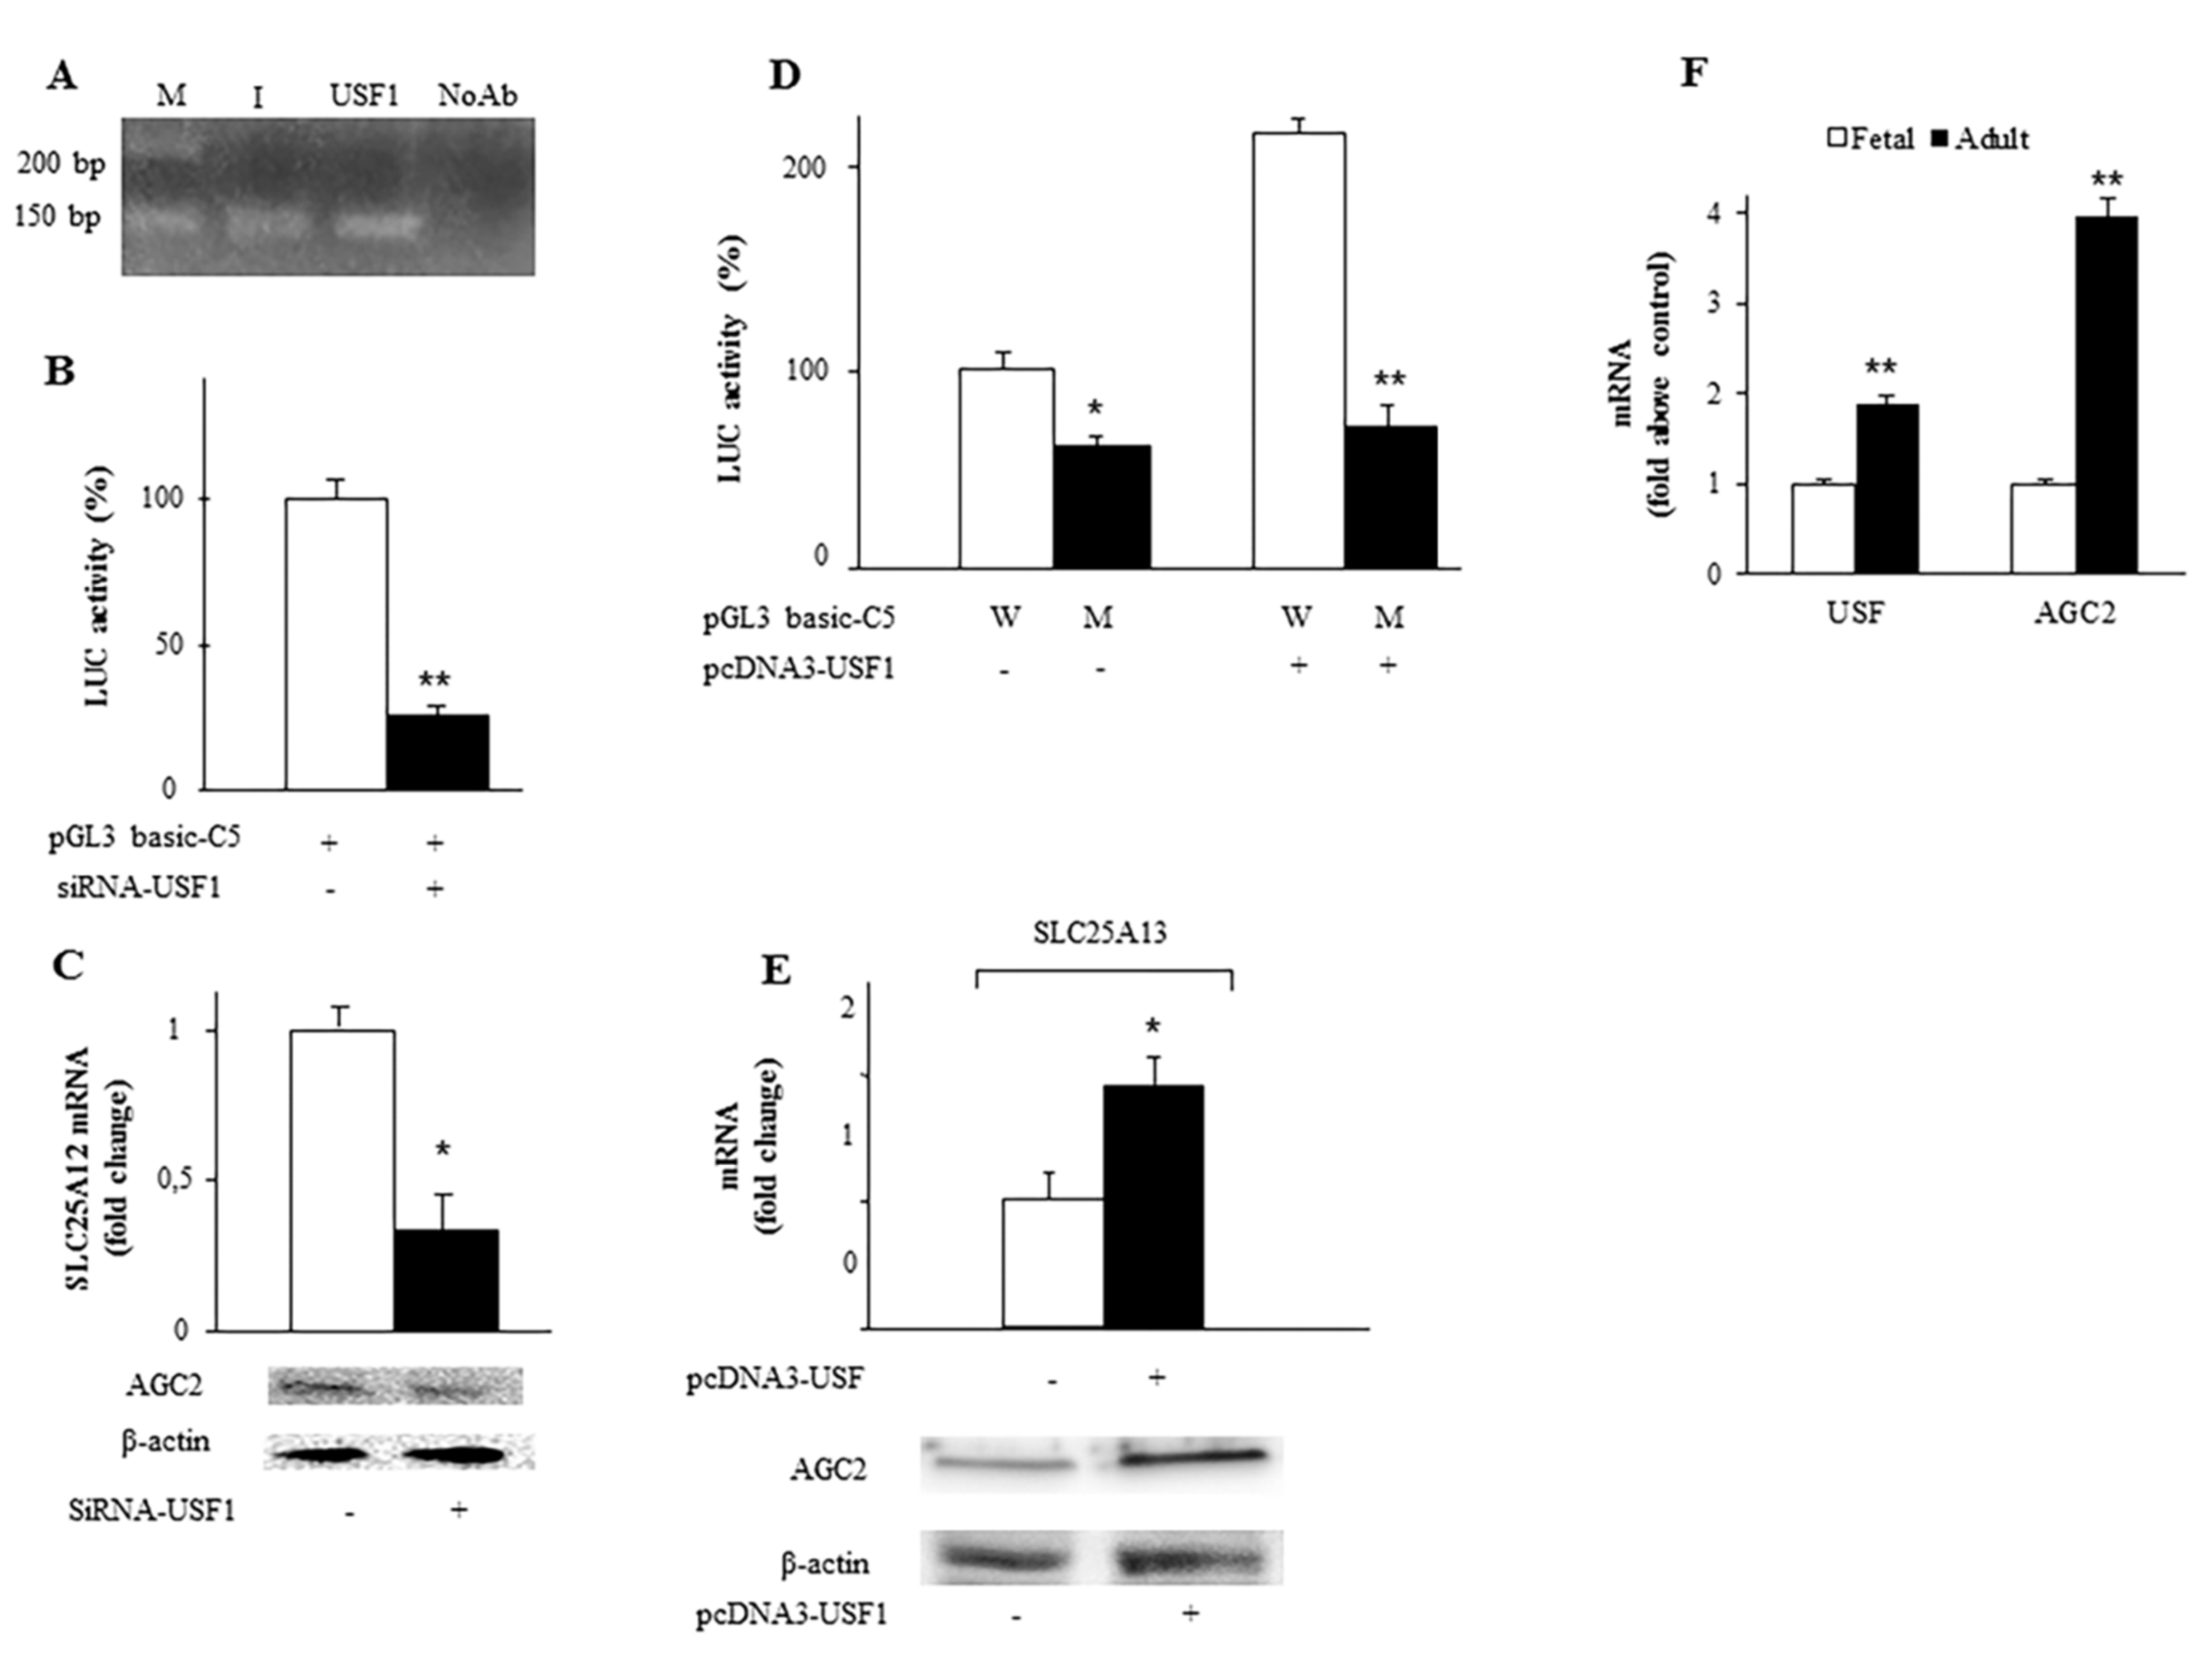
2.2. Identification and Functionality of the USF1 Cis-Element in SLC25A13 Gene Promoter

Given that the E-box motif usually interacts with the USF (Upstream Stimulating Factor) [33] in genes lacking TATA box [34], we checked for the contribution of E-box and USF in regulating SLC25A13 gene expression. To this aim, different experiments were performed. First, we carried out a ChIP-qPCR (chromatin immunoprecipitation-PCR) analysis on chromatin extracted from HepG2 cells by using anti-USF1 antibody. As shown in Figure 2A, USF1 was bound to −498/−343 bp region of the SLC25A13 promoter. Without the anti-USF1 antibody addition, no immunoprecipitation was observed (Figure 2A, lane NoAb). Second, gene silencing experiments using siRNA targeting the human USF1 showed that luciferase activity, as well as AGC2 transcript and protein levels, were reduced as compared to those in the control cells (Figure 2B,C). Third, HepG2 cells were transfected with pGL3basic-C5 construct in the presence or absence of pcDNA3 vector containing the USF coding sequence. As shown in Figure 2D, luciferase activity was significantly enhanced in cells transfected with pGL3basic-C5 and pcDNA3-USF1 compared to cells transfected with pGL3basic-C5 alone. By contrast, no increase in luciferase activity was observed in cells transfected with the pGL3basic-C5 containing the mutated USF binding site (M), with or without the pcDNA3-USF1 expression vector (Figure 2D). Consistently, USF1 induced an increase of SLC25A13 mRNA and AGC2 protein (Figure 2E). Fourth, we performed gel-shift experiments by using wild-type and mutated E-box (−419/−409 bp) responsive element to support the presence—in this region of the SLC25A13 gene promoter—of an active cis-element bound by HepG2 nuclear extracts (Supplementary Figure S1). These results clearly show that USF1 binds to the −419/−409 bp region of the human SLC25A13 promoter probably working as an ubiquitous transcriptional factor.
Del Arco et al. showed that AGC2 was differently expressed during differentiation in rat liver [15]. Because USF1 is involved in transcription in development [33] we asked whether USF1 plays a role in AGC2 expression during liver development. For this, we measured the RNA levels of USF1 and AGC2 genes in foetal and adult liver cells (Figure 2F). Figure 2F shows a 1- and 3- fold overexpression of USF1 and AGC2 mRNAs, respectively, in adult compared to foetal liver tissue (set to 100%). These data suggest that USF1 could control SLC25A13 gene expression during differentiation of liver cells.

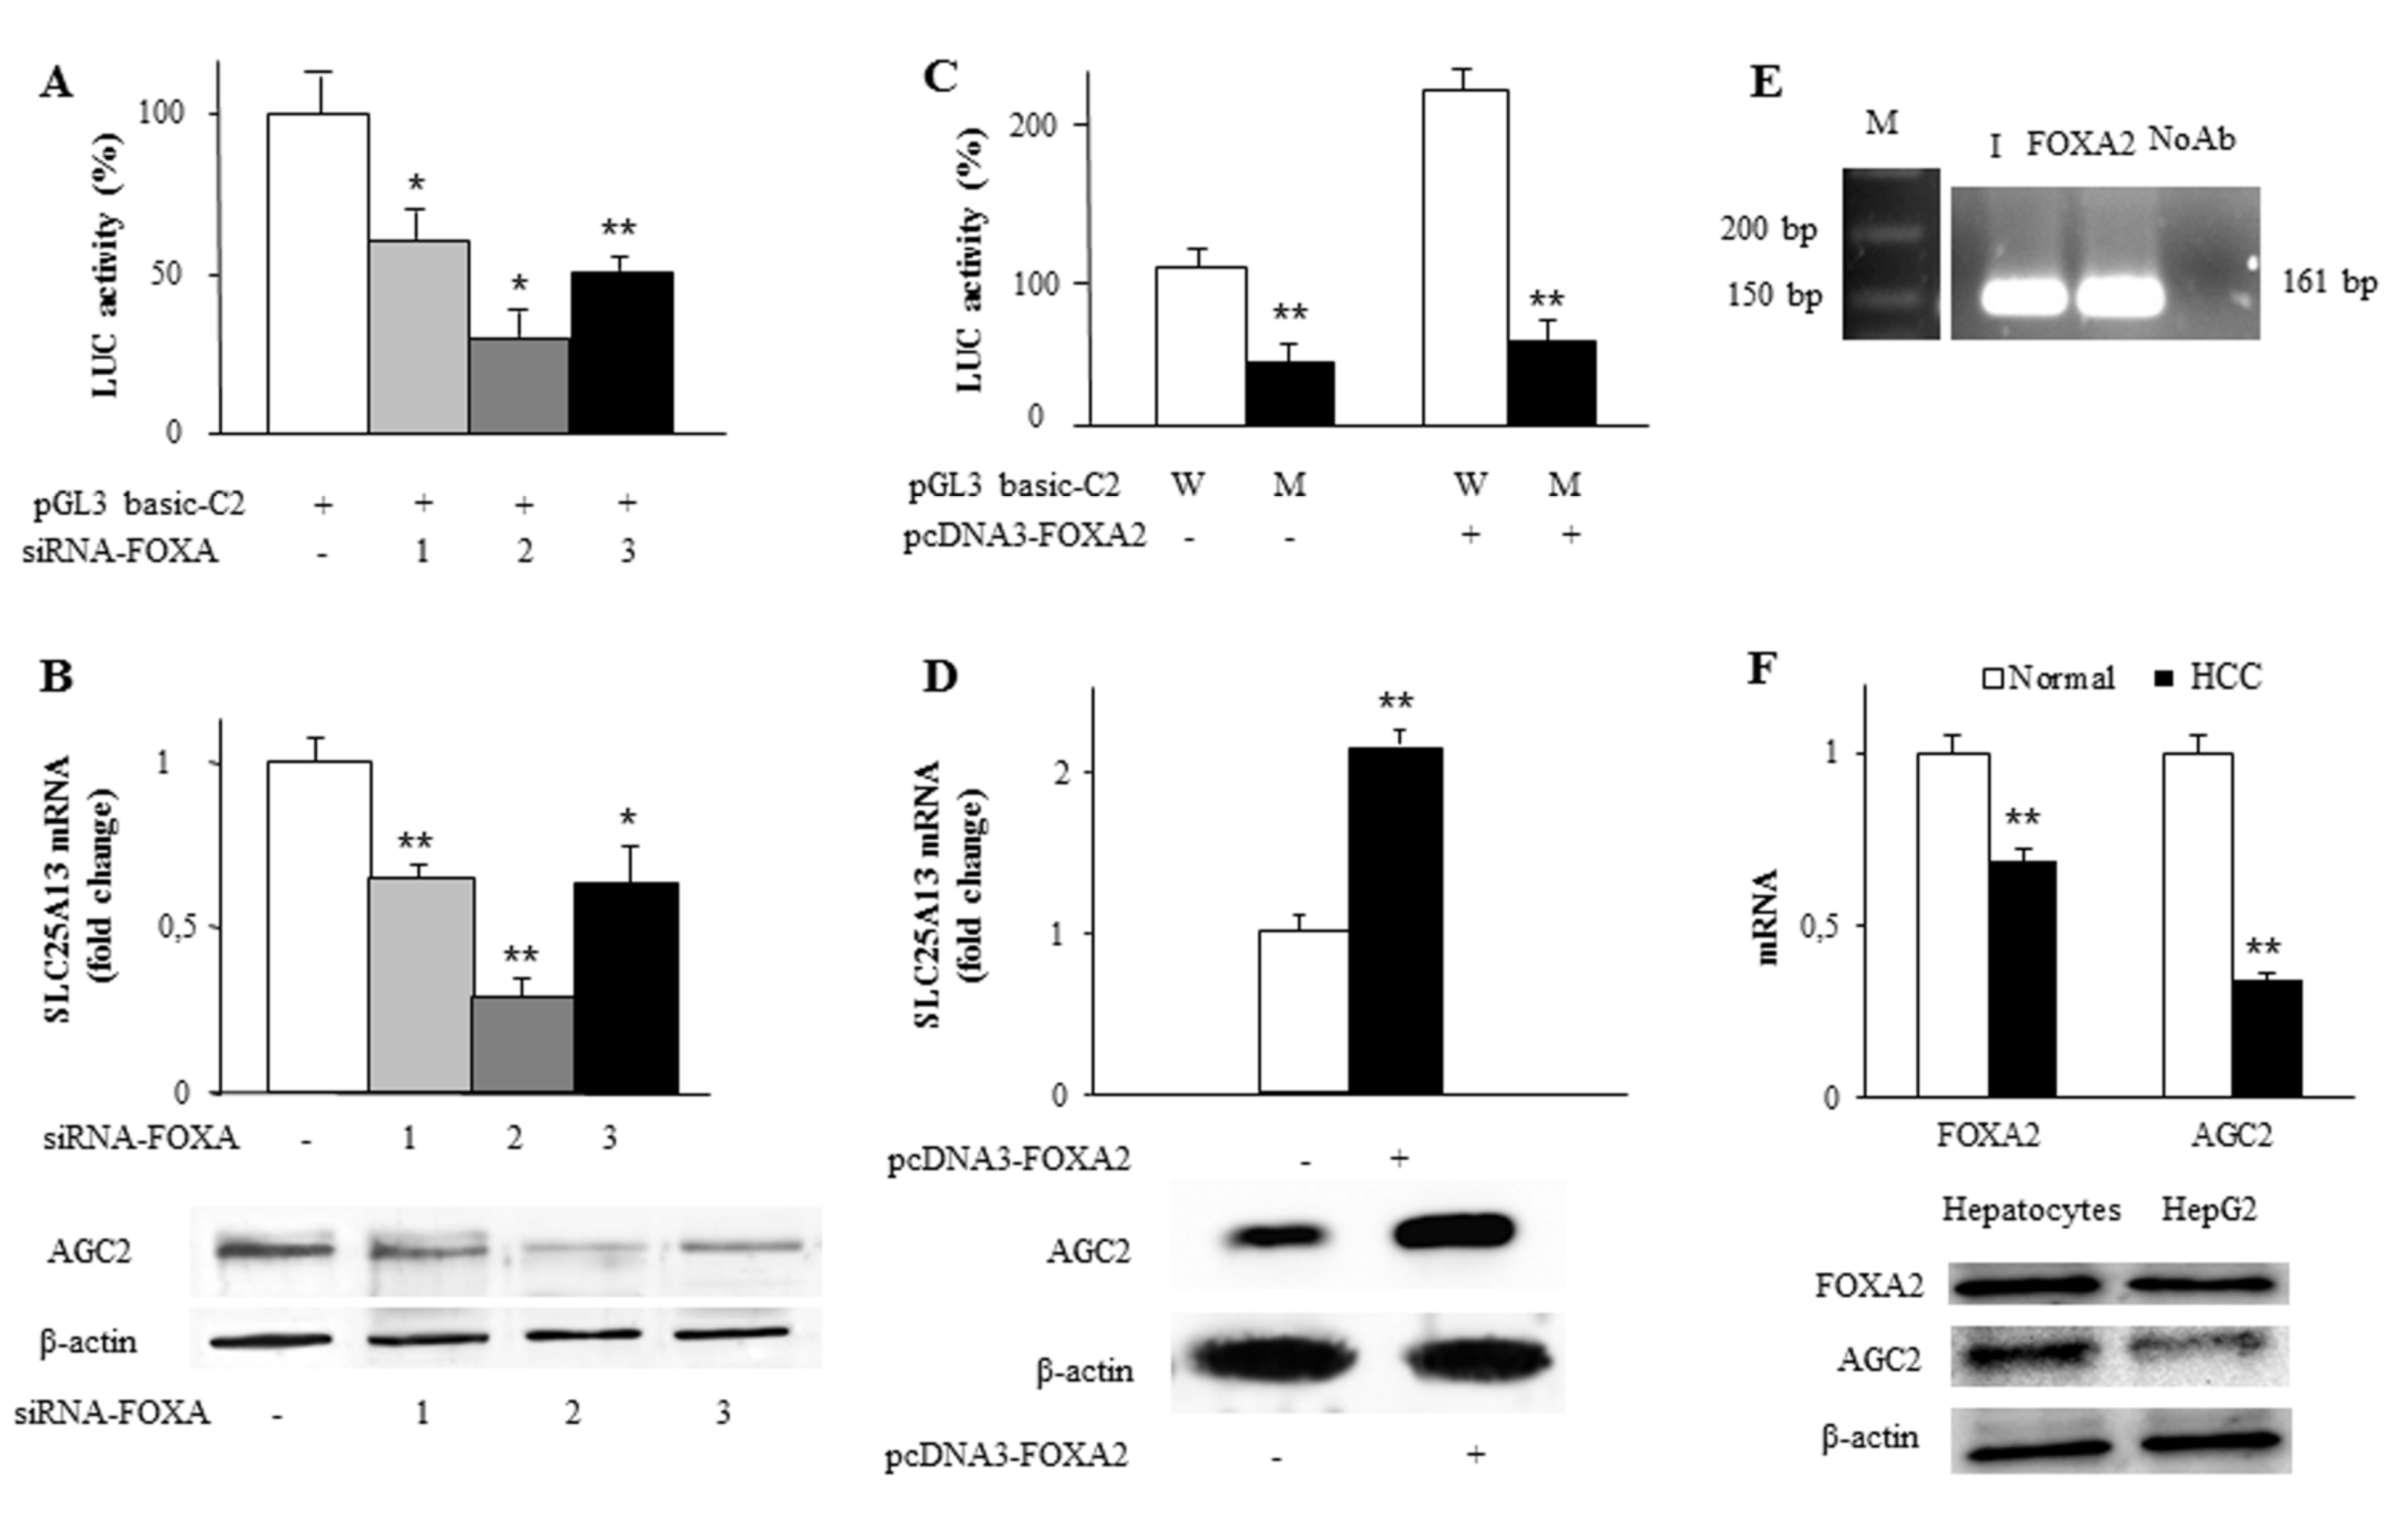
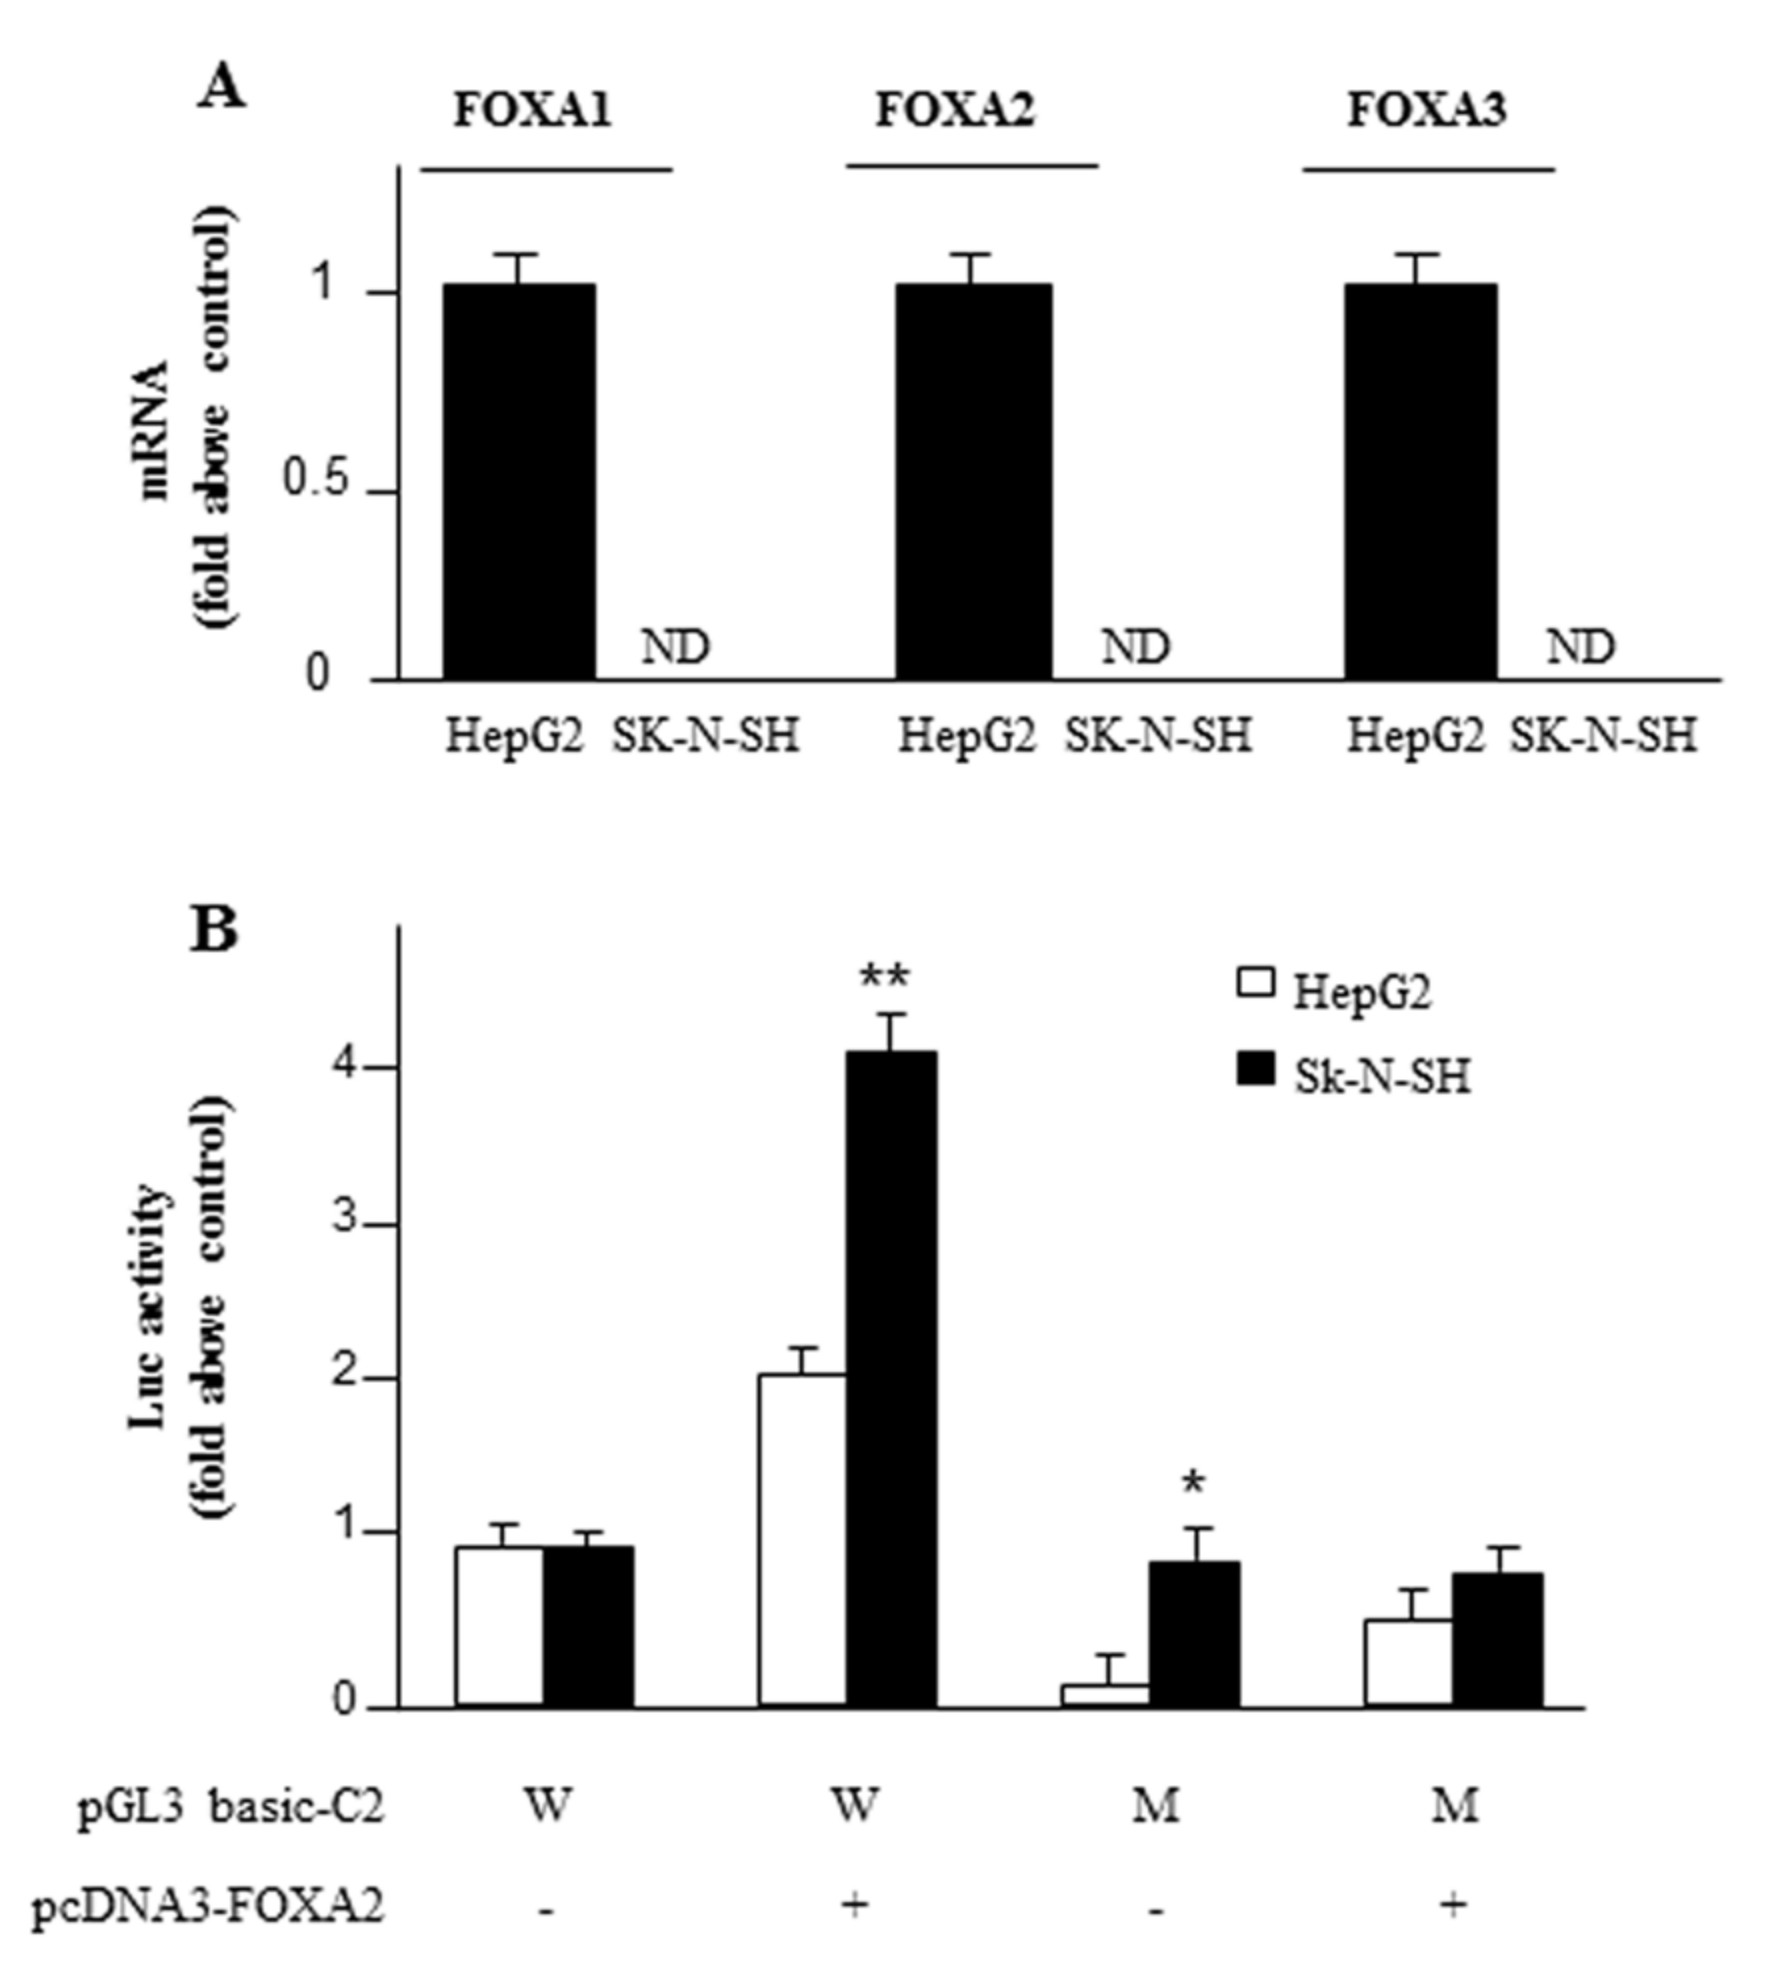
2.3. Identification and Functionality of the FOXA2 Cis-Element in SLC25A13 Gene Promoter

The construct C2, showing a high luciferase activity in HepG2 cells, contained a FOXA transcription factor element at −928/−918 bp. Since FOXA transcription factors are actively involved in the control of hepatic and pancreatic gene expression and metabolism [35], we focused our investigation on FOXA as a positive regulatory factor of SLC25A13 gene expression. Firstly, HepG2 cells were transfected with siRNA targeting not only FOXA2 but also FOXA1 and FOXA3—the other members of FOXA family [36]—having tested that their silencing efficiency was of about 74%, 70% and 77%, respectively (Supplementary Figure S2). Seventy-two hours after transfection, the luciferase activity was reduced by about 40%, 70% and 50% in HepG2 cells transfected with siFOXA1, siFOXA2 and siFOXA3, respectively, as compared to control cells (Figure 3A). Consistently, when FOXA genes were silenced, both AGC2 transcript and protein levels were reduced in knockdown cells compared to wild-type HepG2 cells (Figure 3B). Given that FOXA2 gene silencing had the biggest impact on both SLC25A13 gene promoter activity and ACG2 gene expression than the other FOXA genes, we focused our further analyses on this isoform. HepG2 cells were transfected with C2 construct in the presence or absence of pcDNA3 vector containing FOXA2 coding sequence (pcDNA3-FOXA2) and the relative luciferase activity was measured. Reporter activity was enhanced by about 100% in cells transfected with pGL3basic-C2 and pcDNA3-FOXA2 compared to cells transfected with pGL3basic-C2 alone (Figure 3C). In contrast, the luciferase activity was strongly reduced in HepG2 transfected with the mutated FOXA binding site (M) promoter-LUC vector, with or without the pcDNA3-FOXA2 expression vector (Figure 3C). Consistently, SLC25A13 mRNA and AGC2 protein significantly increased in HepG2 transfected with pcDNA3-FOXA2 (Figure 3D). Furthermore, electrophoretic mobility shift (EMSA) assay with wild-type and mutated FOXA responsive element further confirmed the specificity of DNA-binding to FOXA2 as a supershift was observed when a specific antibody against FOXA2 was used (Supplementary Figure S3). In addition, FOXA2 binding to the endogenous SLC25A13 gene promoter was confirmed using the ChIP-qPCR assay. Figure 3E shows that chromatin extracted from HepG2 cells was immunoprecipitated by using a specific anti-FOXA2 antibody. These results clearly demonstrate that AGC2 expression is mainly affected by FOXA2 and the other isoforms exert a lower effect. Finally, we found a strong binding of FOXA2 transcription factor to −928/−918 bp region of the human SLC25A13 required for SLC25A13 gene activation (results not shown). All together these findings strengthen the link between SLC25A13 and FOXA2 expression patterns and suggest FOXA2 to be a transcriptional factor responsible for SLC25A13 upregulation in liver.
Interestingly, Wang et al. [37] reported a low expression of FOXA2 in hepatocellular carcinoma. Since HepG2 are hepatocarcinoma cells we wondered whether the SLC25A13 gene was also under-expressed in cancer. To this end, we measured expression levels of both FOXA2 and AGC2 in normal and hepatocellular carcinoma (HCC) cells. Figure 3F reveals a significant decrease in FOXA2 and AGC2 RNAs by about 30% and 65%, respectively, in cancer cells compared to normal cells. In HepG2 cells FOXA2 and AGC2 levels were also decreased as compared to normal liver cells.

2.4. Exogenous FOXA2 Induces Transcription of SLC25A13 in SK-N-SH Cells

To further confirm the specificity of FOXA2 as an activator of the SLC25A13 gene we overexpressed FOXA2 in SK-N-SH. First, we checked that none of the FOXA family isoforms (FOXA1, FOXA2 and FOXA3) were present in SK-N-SH. Indeed, real-time PCR performed on mRNA extracted from SK-N-SH cells showed the absence of FOXA1, FOXA2 and FOXA3 transcription factors (Figure 4A). In these experiments, HepG2 cells were taken as the reference for each isoform. Second, upon expression of FOXA2 in SK-N-SH, the luciferase activity—relative to the SLC25A13 gene promoter—increased by four times compared to the cells transfected with pGL3-basic alone (Figure 4B). This effect was abolished using the construct harbouring a mutated FOXA2 responsive element (Figure 4B). These findings clearly indicate that FOXA2 works as a strong activator of SLC25A13 gene expression in various cell lines.

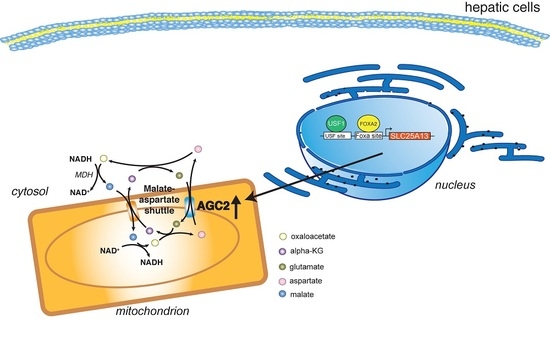
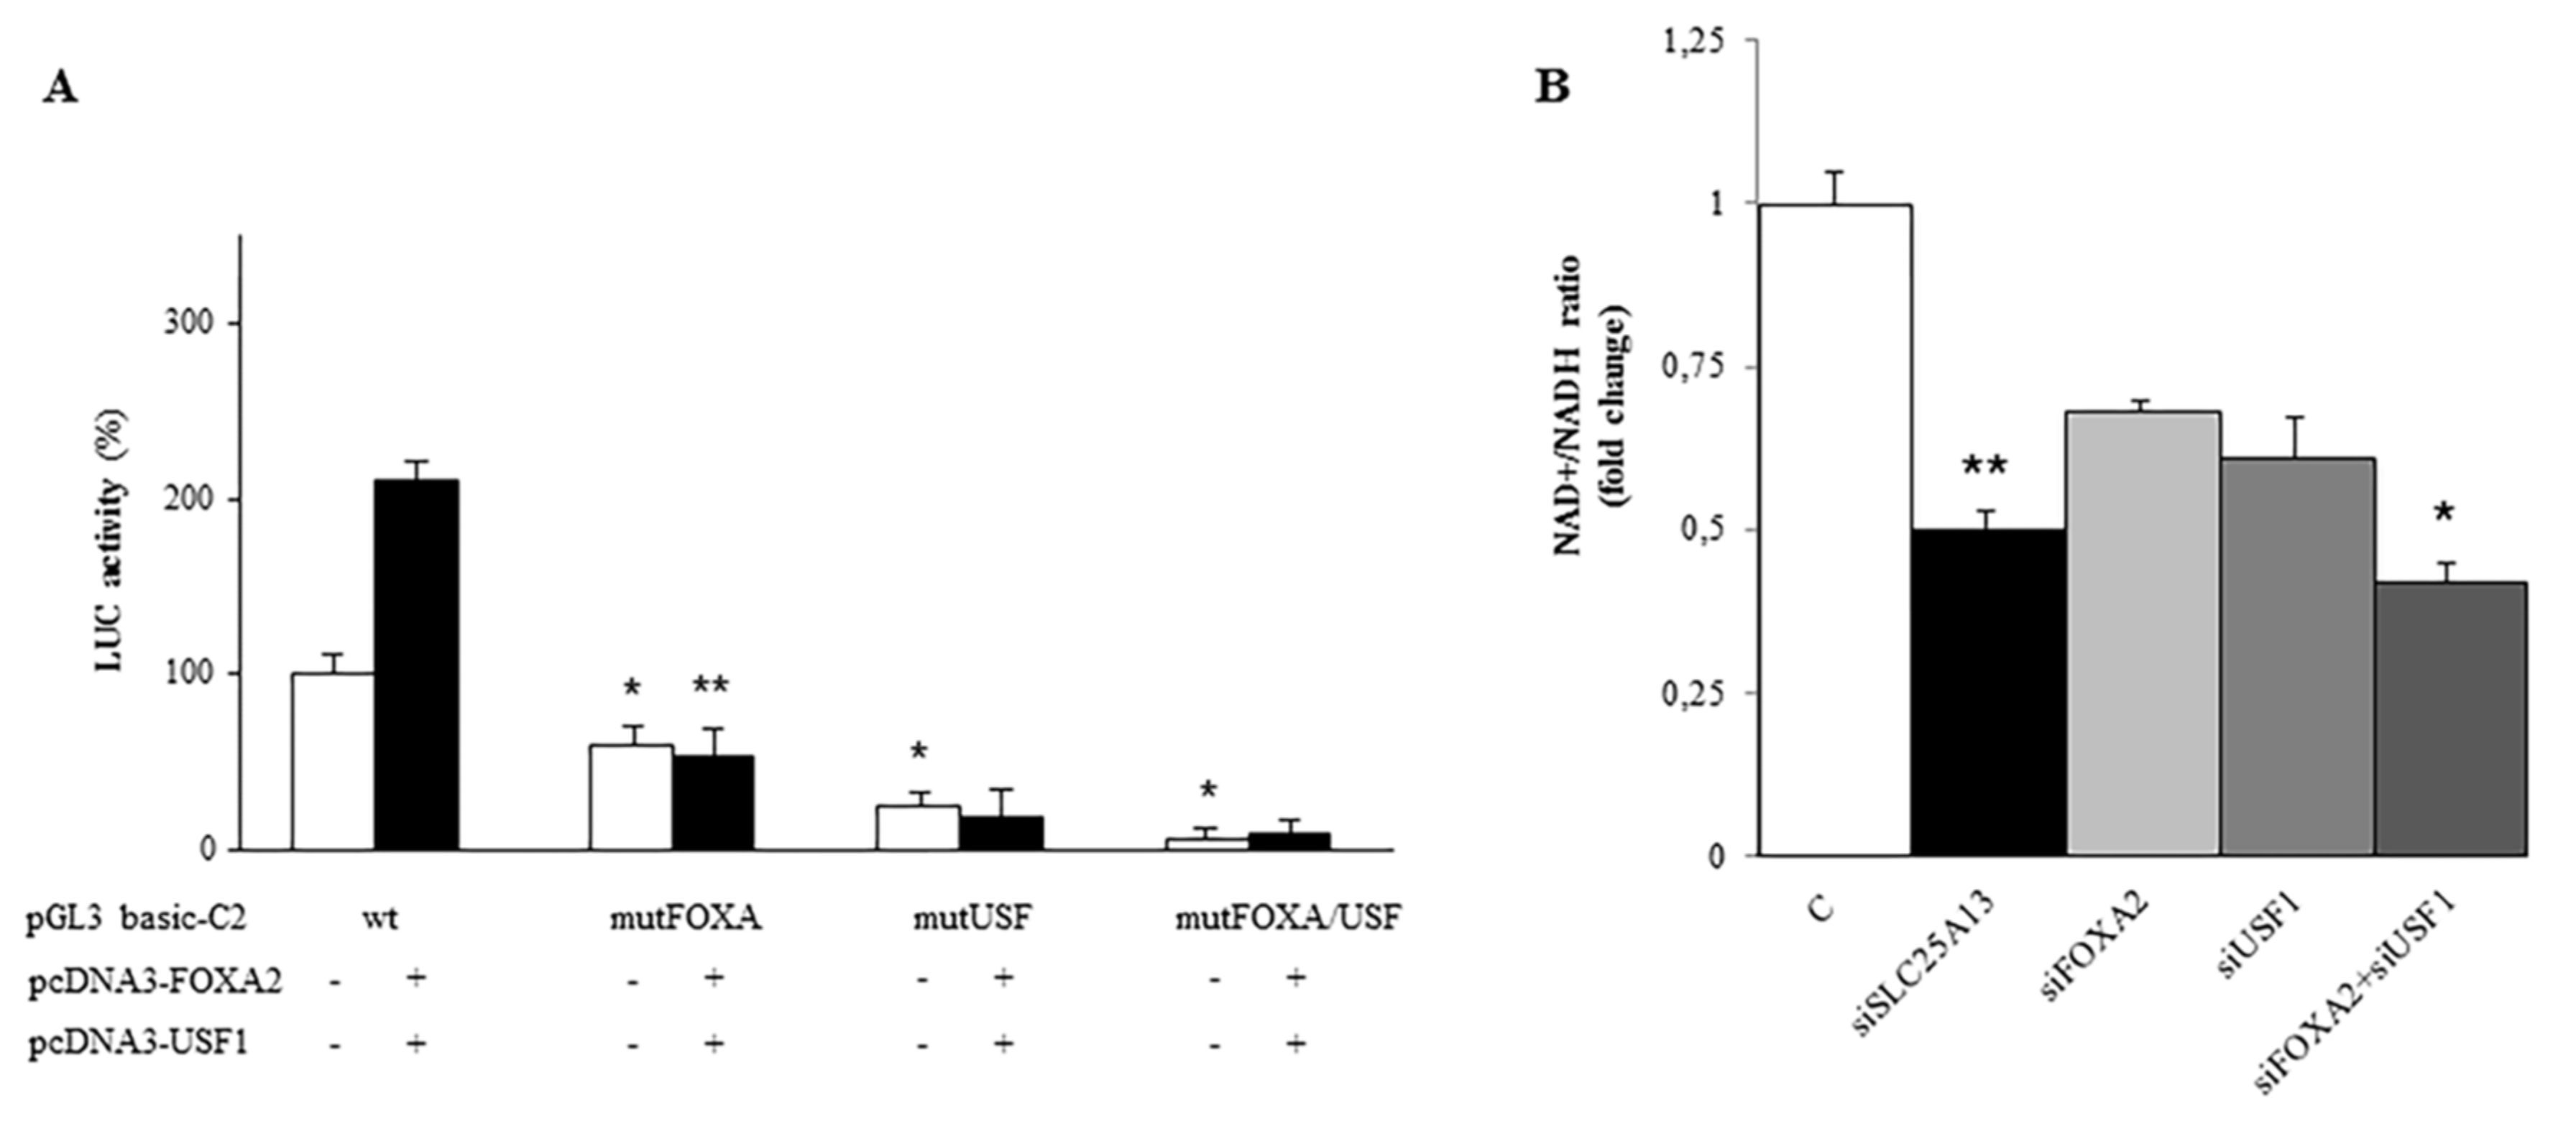
2.5. Synergy between FOXA2 and USF1 in Regulating SLC25A13 Gene Expression and AGC2 Function

The results presented above indicate a primary role for FOXA2 and USF1 transcription factors in the regulation of SLC25A13 gene expression. We therefore wondered if FOXA2 and USF1 interplay in activating SLC25A13 transcription and in turn regulating AGC2 function. To this end, we transfected HepG2 cells with C2 construct—containing binding sites for both FOXA2 and USF1 factors—wild-type or mutated in FOXA or UFS sites alone or together and measured LUC activity under each condition. SLC25A13 promoter activity strongly decreased when a single site was mutated and was almost absent in the presence of a double mutation (Figure 5A, white bars). When C2 construct was transfected together with pcDNA3-FOXA2 and pcDNA3-USF1, we observed a great increase of LUC activity by about 100% (Figure 5A wt, black bars). This effect was abolished in the presence of a single mutation at level of FOXA or USF binding site (Figure 5A mutFOXA or mutUSF black bars). Thus, a single mutation in one of these binding sites is enough to completely abolish SLC25A13 promoter activity. These results support a collaborative interplay of both FOXA2 and USF1 in driving high levels of SLC25A13 gene expression.
Next, we investigated the effect of FOXA2 and USF1 on AGC2 activity. As AGC2 is an essential component of the malate/aspartate shuttle which transfers the reducing equivalents of NADH plus H+ from cytosol to mitochondria [6], we measured the NAD+/NADH ratio in HepG2 cells transfected with siRNA against FOXA1 and USF1 alone or in combination. As a control, we silenced SLC25A13 and observed a significant decrease in NAD+/NADH ratio by about 50% in agreement with the role of AGC2 in regulating NADH redox status (Figure 5B). When FOXA2 or USF1 genes were silenced we also obtained a great reduction in NAD+/NADH ratio; this reduction was even greater in the presence of FOXA2/USF1 double gene silencing (Figure 5B). These findings suggest a role for FOXA2 and USF1 as regulators of AGC2 activity thus implying their control of the NADH redox status.

3. Discussion

The physiological role of AGC2 and its different tissue distribution (particularly high in liver) suggest that its expression might be regulated at a transcriptional level in a specific tissue and cell-type manner. In order to elucidate human SLC25A13 gene regulation we focused our investigation on the 1233 bp upstream of the ATG codon, where we identified the SLC25A13 promoter region. The basal promoter activity of SLC25A13 is contained in a 442 bp fragment upstream of the transcriptional start site, as confirmed by the reduction of luciferase activity when this region was deleted from the experimental constructs employed in HepG2, SK-N-SH and HEK293 cell lines. The SLC25A13 promoter structure is interesting as both INR and E-box (CACGTG) sequences interact with HLH transcription factors, such as USFs, in TATA-less and pyrimidine-rich promoter [38,39]. Consistent with this promoter model structure, our findings show a functional binding of USF1 to the E-box both in-vivo and in EMSA experiments. Interestingly, the USF binding site is present in both human and rat mitochondrial aspartate/glutamate carrier isoform 2 gene promoters. The USFs bHLH-leucine zipper transcription factors are ubiquitously expressed and act as key regulatory factors of the transcriptional machinery mediating recruitment of chromatin remodelling enzymes, interacting with co-activators and members of the pre-initiation complex [40]. Given that an E-box motif binding USF1 is located in the region corresponding to the basal promoter activity, it is likely that the USF1 factor is involved in the initial steps of SLC25A13 gene transcription, such as the pre-initiation complex. However, USF1 could also be involved in coordinating the regulation of lipid and glucose metabolism by a mechanism not yet understood. USF1 is decreased by fasting and increased by refeeding [41]. In culture cells, high extracellular glucose levels enhance USF1 expression [42,43,44,45]. Increase of USF expression in glucose treated cells is consistent with the role of AGC2 in glycolysis because, as component of the malate/aspartate shuttle, AGC2 transfers the reducing equivalents of NADH plus H+ from cytosol to mitochondria [6]. Furthermore, our data also show differential expression of SLC25A13 in foetal (low) and adult (high) cells in parallel with differential expression USF. It might be speculated that increasing expression of USF in adult cells compared to foetal cells also affects AGC2 expression.
It is known that USFs work in tandem with general or specific transcription factors, including FOXAs [46,47]. By means of different approaches including ChIP, gene silencing and in silico analysis we identified the promoter sequence located at −928 bp to −918 bp as the binding site for FOXA2. Indeed, also other FOXA family members (FOXA1 and FOXA3) affect the SLC25A13 gene expression, although to lower extent than FOXA2. The FOXA subfamily of winged helix/forkhead box (Fox) transcription factors is involved in the regulation and differentiation of metabolic tissues, such as liver, pancreas and adipose tissue, acting as factors, the binding to promoters of which enables chromatin access to other tissue-specific transcription factors [48]. In particular, FOXA2 is essential for glucose and lipid homeostasis [49,50]. In fact, several genes encoding hepatic enzymes involved in metabolism during fasting and energy deprivation contain FOXA2-binding sites [51,52,53]. Examples include the gluconeogenic enzymes phosphoenopyruvate carboxychinase (PepCk) [54], glucose-6-phosphatase (G6pc) [55] and tyrosine aminotransferase (Tat) [56], as well as enzymes of lipid catabolism, such as carnitine palmitoyltransferase 1, carnitine acylcarnitine translocase, hydroxyacyl-CoA dehydrogenase and lipoprotein lipase and of ketogenesis, such as 3-hydroxy-3-methylglutaryl-CoA synthase 1 [24,50]. Our results further suggest that FOXA2 does not contribute to SLC25A13 gene expression in some non-hepatic cells, such as SK-N-SH cells. This contention is supported by the experimental observations reported in this study and in particular by the lack of FOXA transcription factors in SK-N-SH cells and by the very high increase in gene reporter activity obtained by FOXA2 overexpression in these cells. Therefore, this study may explain at the molecular level, at least in part, the differences in AGC2 expression levels between liver and other tissues [57]. Interestingly, we also detected the presence of FOXA2 binding site in the rat (Rattus Norvegicus) slc25a13 gene promoter and its absence in the AGC1/SLC25A12 gene promoter. Furthermore, identification of FOXA2 as specific enhancing protein might be useful as therapeutic target to increase the expression of AGC2 in patients with type II citrullinemia showing a mild phenotype, as reported for other mitochondrial carrier deficiencies [58].
In the light of our findings, it is clear that USF1 and FOXA2 are positively regulators of SLC25A13 gene expression. It is likely that both factors interact each other as cotransfection of a FOXA2 binding site mutated version with both USF1 and FOXA2 transcription factors causes no increase of SLC25A13 promoter activity. Noteworthy, USF1 and FOXA2 single or double gene silencing significantly reduces the NAD+/NADH ratio, that is, negatively affects AGC2 function by regulating its transcription. Obviously, it cannot be excluded that other co-factors and transcription factor-binding sites participate in the regulation of the SLC25A13 gene expression, beyond the central role played by FOXA2 and USF1.
This study sheds some light on the mechanisms underlying the SLC25A13 gene expression which result to be very different than those controlling SLC25A12 at least in hepatocarcinoma. AGC2 (at the level of mRNA and protein) is significantly downregulated in liver cancer cells, whereas AGC1 is upregulated by an epigenetic mechanism consisting in histone hyperacetylation [22]. Our findings demonstrate that FOXA2 downregulates SLC25A13 expression and function, in agreement with the reported role of FOXA2 as tumour suppressor in HCC [59,60]. In this regard, Oncomine (https://www.oncomine.org) database used for an in-depth analysis of SLC25A13 and FOXA2 mRNA levels reveal a strong downregulation of both genes in different types of tumours (Affimetrix Human Genome HT U133A Array, Human Genome U133A 2.0 Array) when compared to normal tissues [61,62,63]. So, it can be hypothesized that FOXA2 gene expression decreases in HCC and in turn reduces SLC25A13 transcription levels.
The reasons for SLCA25A13 downregulation in HCC are not clear. However, it appears that AGC2 is not essential for cancer cells’ proliferation as SLCA25A13 gene silencing does not affect HCC cell proliferation [22]. On the contrary, SLCA25A12 gene silencing significantly affects liver cancer cell growth and migration suggesting a specific role for AGC1 in HCC [22]. Thus, it is likely that both AGC1 and AGC2 are implicated in the malate/aspartate shuttle but AGC1 plays also a more specific role in the biosynthesis of nucleotides [22]. As cancer cells rely on lactate dehydrogenase and cytosolic malate dehydrogenase 1 in regenerating cytosolic NAD+ [64], a downregulation of SLC25A13 does not compromise HCC cell survival. Moreover, preliminary quantification data by NMR in SLC25A13 silenced HCC cells indicate a decrease of glutamate levels compared to control cells (data not shown), suggesting that SLC25A13 gene silencing induces the conversion of glutamate in α-ketoglutarate via mitochondrial glutamate dehydrogenase (GDH) thus sustaining TCA cycle.
In conclusion, we have characterized the promoter of the human SLC25A13 gene and have demonstrated, for the first time, that the transcriptional factors FOXA2 and USF1 are involved in the positive regulation of SLC25A13 gene transcription. Furthermore, we have shown that FOXA2 works as an enhancing factor and this is most likely the mechanism responsible for SLC25A13 high expression levels in liver and its downregulation in HCC.

4. Materials and Methods

4.1. Construction of Plasmids.

Progressive deletion fragments of the −1233/−19 bp region of the AGC2 gene promoter, with or without mutations in FOXA or USF binding sites, were obtained by PCR. They were cloned into the pGL3 basic-LUC vector upstream of the LUC gene coding sequence (Promega Madison, WI, USA). FOXA2 (pcDNA3-FOXA2) and USF1 (pcDNAs-USF1) expression vectors were obtained by cloning the human FOXA2 cDNA (Accession No. NM_004496.2) and the human USF1 cDNA (Accession number NM_007122), respectively, into the pcDNA3.1 vector (Thermo Fisher Scientific, San Jose, CA, USA).
The sequences of primers used to generate the mutated FOXA and USF sequences of the SLC25A13 gene in the −932/−909 bp and −424/−404 bp regions, respectively, are shown in Table 1.

4.2. Cell Culture, RNA Interference and Transient Transfection.

HepG2 and HEK293 cells (Sigma–Aldrich, St Louis, MO, USA) were maintained in high glucose DMEM (Dulbecco’s modified Eagle’s medium) containing 10% (v/v) fetal bovine serum, 2 mM L-glutamine, 100 U penicillin and 100 lg/mL streptomycin at 37 °C in 5% CO2. SK-NSH cells (ICLC, Interlab Cell Line Collection) were grown in RPMI 1640 medium (Roswell Park Memorial Institute) at 37 °C in 5% CO2. Primary human hepatocytes were grown in a hepatocyte culture medium according to the manufacturer’s instructions (Lonza, Walkersville, MD, USA). Transient transfection was performed as reported [65] using 0.5 μg of pGL3 basic-LUC vector containing the full-length −1233/−19 bp region of the AGC2 gene promoter or deletion fragments of this region and 10 ng of pRL-CMV (Promega) to normalize the extent of transfection. Transfected cells were assayed for LUC activity using the Dual-Luciferase® Reporter Assay System (Promega). The luminescence was measured using GloMax plate reader (Promega).
For USF1 and FOXA2 overexpression, HepG2 cells were transfected using 0.5 μg of pcDNA3–USF1 or pcDNA3-FOXA2 vector or both. In RNA interference experiments, the specific pre-designed small interfering RNAs (siRNAs) targeting human FOXA1 (s6689, Thermo Fisher Scientific), FOXA2 (s6691, Thermo Fisher Scientific) and FOXA3 (s6693, Thermo Fisher Scientific) were transfected in HepG2 cells using siPORT NeoFX Transfection Agent (Thermo Fisher Scientific). A siRNA (Cat. No. C6A-0126, Thermo Fisher Scientific) with no significant similarity to human, mouse or rat gene sequences was used as negative control.

4.3. Reverse Transcriptase-PCR and Real-Time PCR

Total RNA was extracted from 1 × 10⁶ HepG2, HEK293 and SK-N-SH cells or purchased HCC cells (Rockville, MD, USA); normal adult and foetal liver RNAs were purchased from Origene (Rockville, MD, USA); and reverse transcription was performed as reported [66]. Real-time PCR was conducted as previously described [67]. Assay-on-demand for human AGC2 (Hs00185185_m1), human FOXA1 (Hs00293689_s1), human FOXA2 (Hs00232764_m1), human FOXA3 (Hs00270130_m1) and human β-actin (4326315E) were purchased from Thermo Fisher Scientific. All transcript levels were normalized against the β-actin expression levels. To this end, the difference between β-actin Ct value and the target gene Ct value was used to generate a ΔCt value. ΔΔCt was calculated by subtracting the mean value of ΔCt of the control from ΔCt value. Finally, fold changes in each gene expression were calculated via the comparative 2−ΔΔCt method using the formula: 2−ΔΔCt = ΔCtBS patient − ΔCtcontrol.

4.4. Western Blotting

Western blot analysis was performed as reported previously [68]. Briefly, proteins were electroblotted onto nitrocellulose membranes (Bio-Rad, Hercules, CA, USA) and treated with anti-AGC2 (sc-100937, Santa Cruz Biotechnology, Santa Cruz, CA) or anti-β-actin (sc-47778, Santa Cruz Biotechnology) antibody. The immunoreactions were detected by the Immobilon western ECL system (Millipore, Burlington, MA, USA). Immunolabeled protein bands were analysed by densitometry using ImageJ quantitative software (NIH, Bethesda, MD, USA) and normalized to β-actin levels.

4.5. Chromatin Immunoprecipitation

ChIP experiments were performed as previously reported [69]. Briefly, 2 × 10⁷ of HepG2 cells were fixed by 1% formaldehyde at 37 °C for 10 min; afterwards, the cells were lysed and sheared by sonication in a 1% SDS lysis buffer to generate cellular chromatin fragments of 400–500 bp. The chromatin was immunoprecipitated for 14–16 h at 4 °C using specific antibodies to FOXA2 (sc-6554X, Santa Cruz Biotechnology) and to USF1 (sc-229X Santa Cruz Biotechnology). After reverse cross-linking, chromatin immunoprecipitates were purified, then 2 µL of each sample was analysed by PCR (35 cycles) using a forward FOXA2 primer (5′-CCTGATCACCACTGTCTTAT-3′) and a reverse primer (5′-CCGGGTCAAAAGACTTCC-3′) suitable to amplify the −1040/−864 bp region of the SLC25A13 promoter and a forward USF1 primer (5′-CCTCAGGTGACGGGCTTG-3′) and a reverse primer (5′-GTGATCCAGCGGCCTCTG-3′) suitable to amplify the −498/−343 bp region of the SLC25A13 promoter.

4.6. Intracellular NAD+/NADH Quantification

NAD+/NADH ratio was determined by using a NAD/NAD Quantification Kit (Sigma–Aldrich) according to the manufacturer’s instructions. Briefly, HepG2 cells were seeded in 24-well plates and gene silencing experiments were carried out as described above. Wells were washed once with ice cold PBS. For each assay a pellet from 2 x10⁵ cells obtained by centrifuging at 2000 rpm for 5 min was used. Afterwards, cells were lysed in NADH/NAD Extraction Buffer by freeze/thawing for 2 cycles of 20 min on dry ice followed by 10 min at room temperature. Then samples were centrifuged at 13,000 rpm for 10 min to remove insoluble material. Part of the cell lysate was incubated at 60 °C for 30 min to produces NADH. Enzyme mix cycling buffer and developer were added according to the manufacturer’s protocol. Plates were incubated for 3 h and absorbance was read at 450 nm using the GloMax plate reader (Promega).

4.7. Statistical Analysis

Results are presented as means ± S.D. of, at least, four independent experiments. Differences between means of samples were compared using the one-way ANOVA test. Subsequently, where indicated, the Student’s t-test was used as a post hoc test to compare differences between means of samples and relative controls. A 5% or 1% significance level and 95% (*) or 99% (**), respectively, confidence intervals were used in the statistical analysis.

Supplementary Materials

Supplementary materials can be found at https://www.mdpi.com/1422-0067/20/8/1888/s1.

Author Contributions

Conceived and designed the experiments: P.C., F.P. and V.I. Performed the experiments: P.C., S.T., F.D.S., I.P., M.A.C.M., D.I. Performed in silico analysis: Y.N.F.M., I.P. and G.M. Analyzed the data: P.C., S.T. and F.D.S. Contributed reagents and materials: S.T., F.P. and V.I. Wrote the paper: P.C., S.T., Y.N.F.M., F.P. and V.I.

Funding

This research was supported by Grants from University of Basilicata to VI (grant number 3010101) and to ST (grant number 102050101), University of Bari (grant number 00405815).

Conflicts of Interest

The authors declare no conflict of interest.

References

  1. Palmieri, F. The mitochondrial transporter family slc25: Identification, properties and physiopathology. Mol. Aspects Med. 2013, 34, 465–484. [Google Scholar] [CrossRef]
  2. Palmieri, F. Mitochondrial transporters of the slc25 family and associated diseases: A review. J. Inherit. Metab. Dis. 2014, 37, 565–575. [Google Scholar] [CrossRef]
  3. Palmieri, F.; Pierri, C.L. Mitochondrial metabolite transport. Essays Biochem. 2010, 47, 37–52. [Google Scholar] [CrossRef] [PubMed] [Green Version]
  4. Palmieri, F.; Monne, M. Discoveries, metabolic roles and diseases of mitochondrial carriers: A review. Biochim. Biophys. Acta 2016, 1863, 2362–2378. [Google Scholar] [CrossRef]
  5. Palmieri, L.; Pardo, B.; Lasorsa, F.M.; del Arco, A.; Kobayashi, K.; Iijima, M.; Runswick, M.J.; Walker, J.E.; Saheki, T.; Satrustegui, J.; et al. Citrin and aralar1 are Ca(2+)-stimulated aspartate/glutamate transporters in mitochondria. EMBO J. 2001, 20, 5060–5069. [Google Scholar] [CrossRef]
  6. Indiveri, C.; Kramer, R.; Palmieri, F. Reconstitution of the malate/aspartate shuttle from mitochondria. J. Biol. Chem. 1987, 262, 15979–15983. [Google Scholar] [PubMed]
  7. Palmieri, F. The mitochondrial transporter family (slc25): Physiological and pathological implications. Pflugers Arch. 2004, 447, 689–709. [Google Scholar] [CrossRef]
  8. Lasorsa, F.M.; Pinton, P.; Palmieri, L.; Fiermonte, G.; Rizzuto, R.; Palmieri, F. Recombinant expression of the Ca(2+)-sensitive aspartate/glutamate carrier increases mitochondrial ATP production in agonist-stimulated Chinese hamster ovary cells. J. Biol. Chem. 2003, 278, 38686–38692. [Google Scholar] [CrossRef] [PubMed]
  9. Thangaratnarajah, C.; Ruprecht, J.J.; Kunji, E.R. Calcium-induced conformational changes of the regulatory domain of human mitochondrial aspartate/glutamate carriers. Nat. Commun. 2014, 5, 5491. [Google Scholar] [CrossRef] [PubMed] [Green Version]
  10. Fiermonte, G.; De Leonardis, F.; Todisco, S.; Palmieri, L.; Lasorsa, F.M.; Palmieri, F. Identification of the mitochondrial atp-mg/pi transporter. Bacterial expression, reconstitution, functional characterization and tissue distribution. J. Biol. Chem. 2004, 279, 30722–30730. [Google Scholar] [CrossRef]
  11. Cavero, S.; Traba, J.; Del Arco, A.; Satrustegui, J. The calcium-dependent atp-mg/pi mitochondrial carrier is a target of glucose-induced calcium signalling in saccharomyces cerevisiae. Biochem. J. 2005, 392, 537–544. [Google Scholar] [CrossRef] [PubMed]
  12. Monne, M.; Miniero, D.V.; Obata, T.; Daddabbo, L.; Palmieri, L.; Vozza, A.; Nicolardi, M.C.; Fernie, A.R.; Palmieri, F. Functional characterization and organ distribution of three mitochondrial atp-mg/pi carriers in arabidopsis thaliana. Biochim. Biophys. Acta 2015, 1847, 1220–1230. [Google Scholar] [CrossRef] [PubMed]
  13. Monne, M.; Daddabbo, L.; Giannossa, L.C.; Nicolardi, M.C.; Palmieri, L.; Miniero, D.V.; Mangone, A.; Palmieri, F. Mitochondrial atp-mg/phosphate carriers transport divalent inorganic cations in complex with atp. J. Bioenerg. Biomembr. 2017, 49, 369–380. [Google Scholar] [CrossRef]
  14. Iijima, M.; Jalil, A.; Begum, L.; Yasuda, T.; Yamaguchi, N.; Xian Li, M.; Kawada, N.; Endou, H.; Kobayashi, K.; Saheki, T. Pathogenesis of adult-onset type ii citrullinemia caused by deficiency of citrin, a mitochondrial solute carrier protein: Tissue and subcellular localization of citrin. Adv. Enzyme Regul. 2001, 41, 325–342. [Google Scholar] [CrossRef]
  15. Del Arco, A.; Morcillo, J.; Martinez-Morales, J.R.; Galian, C.; Martos, V.; Bovolenta, P.; Satrustegui, J. Expression of the aspartate/glutamate mitochondrial carriers aralar1 and citrin during development and in adult rat tissues. Eur. J. Biochem. 2002, 269, 3313–3320. [Google Scholar] [CrossRef] [Green Version]
  16. Wibom, R.; Lasorsa, F.M.; Tohonen, V.; Barbaro, M.; Sterky, F.H.; Kucinski, T.; Naess, K.; Jonsson, M.; Pierri, C.L.; Palmieri, F.; et al. Agc1 deficiency associated with global cerebral hypomyelination. N. Engl. J. Med. 2009, 361, 489–495. [Google Scholar] [CrossRef] [PubMed]
  17. Falk, M.J.; Li, D.; Gai, X.; McCormick, E.; Place, E.; Lasorsa, F.M.; Otieno, F.G.; Hou, C.; Kim, C.E.; Abdel-Magid, N.; et al. Agc1 deficiency causes infantile epilepsy, abnormal myelination and reduced n-acetylaspartate. JIMD Rep. 2014, 14, 77–85. [Google Scholar] [PubMed]
  18. Saheki, T.; Kobayashi, K.; Iijima, M.; Horiuchi, M.; Begum, L.; Jalil, M.A.; Li, M.X.; Lu, Y.B.; Ushikai, M.; Tabata, A.; et al. Adult-onset type ii citrullinemia and idiopathic neonatal hepatitis caused by citrin deficiency: Involvement of the aspartate glutamate carrier for urea synthesis and maintenance of the urea cycle. Mol. Genet. Metab. 2004, 81 (Suppl. 1), S20–S26. [Google Scholar] [CrossRef] [PubMed]
  19. Kobayashi, K.; Bang Lu, Y.; Xian Li, M.; Nishi, I.; Hsiao, K.J.; Choeh, K.; Yang, Y.; Hwu, W.L.; Reichardt, J.K.; Palmieri, F.; et al. Screening of nine slc25a13 mutations: Their frequency in patients with citrin deficiency and high carrier rates in asian populations. Mol. Genet. Metab. 2003, 80, 356–359. [Google Scholar] [CrossRef]
  20. Fiermonte, G.; Soon, D.; Chaudhuri, A.; Paradies, E.; Lee, P.J.; Krywawych, S.; Palmieri, F.; Lachmann, R.H. An adult with type 2 citrullinemia presenting in Europe. N. Engl. J. Med. 2008, 358, 1408–1409. [Google Scholar] [CrossRef]
  21. Jalil, M.A.; Begum, L.; Contreras, L.; Pardo, B.; Iijima, M.; Li, M.X.; Ramos, M.; Marmol, P.; Horiuchi, M.; Shimotsu, K.; et al. Reduced n-acetylaspartate levels in mice lacking aralar, a brain- and muscle-type mitochondrial aspartate-glutamate carrier. J. Biol. Chem. 2005, 280, 31333–31339. [Google Scholar] [CrossRef]
  22. Infantino, V.; Dituri, F.; Convertini, P.; Santarsiero, A.; Palmieri, F.; Todisco, S.; Mancarella, S.; Giannelli, G.; Iacobazzi, V. Epigenetic upregulation and functional role of the mitochondrial aspartate/glutamate carrier isoform 1 in hepatocellular carcinoma. Biochim. Biophys. Acta Mol. Basis Dis. 2019, 1865, 38–47. [Google Scholar] [CrossRef] [PubMed]
  23. Iacobazzi, V.; Infantino, V.; Costanzo, P.; Izzo, P.; Palmieri, F. Functional analysis of the promoter of the mitochondrial phosphate carrier human gene: Identification of activator and repressor elements and their transcription factors. Biochem. J. 2005, 391, 613–621. [Google Scholar] [CrossRef] [PubMed]
  24. Convertini, P.; Infantino, V.; Bisaccia, F.; Palmieri, F.; Iacobazzi, V. Role of foxa and sp1 in mitochondrial acylcarnitine carrier gene expression in different cell lines. Biochem. Biophys. Res. Commun. 2011, 404, 376–381. [Google Scholar] [CrossRef] [PubMed]
  25. Infantino, V.; Iacobazzi, V.; Menga, A.; Avantaggiati, M.L.; Palmieri, F. A key role of the mitochondrial citrate carrier (slc25a1) in tnfalpha- and ifngamma-triggered inflammation. Biochim. Biophys. Acta 2014, 1839, 1217–1225. [Google Scholar] [CrossRef] [PubMed]
  26. Infantino, V.; Convertini, P.; Cucci, L.; Panaro, M.A.; Di Noia, M.A.; Calvello, R.; Palmieri, F.; Iacobazzi, V. The mitochondrial citrate carrier: A new player in inflammation. Biochem. J. 2011, 438, 433–436. [Google Scholar] [CrossRef]
  27. Convertini, P.; Menga, A.; Andria, G.; Scala, I.; Santarsiero, A.; Castiglione Morelli, M.A.; Iacobazzi, V.; Infantino, V. The contribution of the citrate pathway to oxidative stress in down syndrome. Immunology 2016, 149, 423–431. [Google Scholar] [CrossRef] [PubMed]
  28. Menga, A.; Palmieri, E.M.; Cianciulli, A.; Infantino, V.; Mazzone, M.; Scilimati, A.; Palmieri, F.; Castegna, A.; Iacobazzi, V. Slc25a26 overexpression impairs cell function via mtdna hypermethylation and rewiring of methyl metabolism. FEBS J. 2017, 284, 967–984. [Google Scholar] [CrossRef]
  29. Fiore, C.; Trezeguet, V.; Le Saux, A.; Roux, P.; Schwimmer, C.; Dianoux, A.C.; Noel, F.; Lauquin, G.J.; Brandolin, G.; Vignais, P.V. The mitochondrial adp/atp carrier: Structural, physiological and pathological aspects. Biochimie 1998, 80, 137–150. [Google Scholar] [CrossRef]
  30. Dolce, V.; Scarcia, P.; Iacopetta, D.; Palmieri, F. A fourth adp/atp carrier isoform in man: Identification, bacterial expression, functional characterization and tissue distribution. FEBS Lett. 2005, 579, 633–637. [Google Scholar] [CrossRef]
  31. Villarroya, F.; Peyrou, M.; Giralt, M. Transcriptional regulation of the uncoupling protein-1 gene. Biochimie 2017, 134, 86–92. [Google Scholar] [CrossRef] [PubMed]
  32. Menga, A.; Iacobazzi, V.; Infantino, V.; Avantaggiati, M.L.; Palmieri, F. The mitochondrial aspartate/glutamate carrier isoform 1 gene expression is regulated by creb in neuronal cells. Int. J. Biochem. Cell Biol. 2015, 60, 157–166. [Google Scholar] [CrossRef]
  33. Anantharaman, A.; Lin, I.J.; Barrow, J.; Liang, S.Y.; Masannat, J.; Strouboulis, J.; Huang, S.; Bungert, J. Role of helix-loop-helix proteins during differentiation of erythroid cells. Mol. Cell. Biol. 2011, 31, 1332–1343. [Google Scholar] [CrossRef]
  34. Li, N.; Seetharam, B. A 69-base pair fragment derived from human transcobalamin ii promoter is sufficient for high bidirectional activity in the absence of a tata box and an initiator element in transfected cells. Role of an e box in transcriptional activity. J. Biol. Chem. 1998, 273, 28170–28177. [Google Scholar] [CrossRef] [PubMed]
  35. Kaestner, K.H. The hepatocyte nuclear factor 3 (hnf3 or foxa) family in metabolism. Trends Endocrinol. Metab. 2000, 11, 281–285. [Google Scholar] [CrossRef]
  36. Monaghan, A.P.; Kaestner, K.H.; Grau, E.; Schutz, G. Postimplantation expression patterns indicate a role for the mouse forkhead/hnf-3 alpha, beta and gamma genes in determination of the definitive endoderm, chordamesoderm and neuroectoderm. Development 1993, 119, 567–578. [Google Scholar] [PubMed]
  37. Wang, J.; Zhu, C.P.; Hu, P.F.; Qian, H.; Ning, B.F.; Zhang, Q.; Chen, F.; Liu, J.; Shi, B.; Zhang, X.; et al. Foxa2 suppresses the metastasis of hepatocellular carcinoma partially through matrix metalloproteinase-9 inhibition. Carcinogenesis 2014, 35, 2576–2583. [Google Scholar] [CrossRef]
  38. Kadesch, T. Consequences of heteromeric interactions among helix-loop-helix proteins. Cell Growth Differ. 1993, 4, 49–55. [Google Scholar]
  39. Roy, A.L.; Meisterernst, M.; Pognonec, P.; Roeder, R.G. Cooperative interaction of an initiator-binding transcription initiation factor and the helix-loop-helix activator usf. Nature 1991, 354, 245–248. [Google Scholar] [CrossRef]
  40. Corre, S.; Galibert, M.D. USF as a key regulatory element of gene expression. Med. Sci. 2006, 22, 62–67. [Google Scholar]
  41. Van Deursen, D.; van Leeuwen, M.; Vaulont, S.; Jansen, H.; Verhoeven, A.J. Upstream stimulatory factors 1 and 2 activate the human hepatic lipase promoter via e-box dependent and independent mechanisms. Biochim. Biophys. Acta 2009, 1791, 229–237. [Google Scholar] [CrossRef] [PubMed]
  42. Bidder, M.; Shao, J.S.; Charlton-Kachigian, N.; Loewy, A.P.; Semenkovich, C.F.; Towler, D.A. Osteopontin transcription in aortic vascular smooth muscle cells is controlled by glucose-regulated upstream stimulatory factor and activator protein-1 activities. J. Biol. Chem. 2002, 277, 44485–44496. [Google Scholar] [CrossRef] [PubMed]
  43. Weigert, C.; Brodbeck, K.; Sawadogo, M.; Haring, H.U.; Schleicher, E.D. Upstream stimulatory factor (usf) proteins induce human tgf-beta1 gene activation via the glucose-response element-1013/-1002 in mesangial cells: Up-regulation of usf activity by the hexosamine biosynthetic pathway. J. Biol. Chem. 2004, 279, 15908–15915. [Google Scholar] [CrossRef] [PubMed]
  44. Wang, S.; Skorczewski, J.; Feng, X.; Mei, L.; Murphy-Ullrich, J.E. Glucose up-regulates thrombospondin 1 gene transcription and transforming growth factor-beta activity through antagonism of cgmp-dependent protein kinase repression via upstream stimulatory factor 2. J. Biol. Chem. 2004, 279, 34311–34322. [Google Scholar] [CrossRef] [PubMed]
  45. Shi, L.; Liu, S.; Nikolic, D.; Wang, S. High glucose levels upregulate upstream stimulatory factor 2 gene transcription in mesangial cells. J. Cell. Biochem. 2008, 103, 1952–1961. [Google Scholar] [CrossRef] [PubMed]
  46. Sawadogo, M. Multiple forms of the human gene-specific transcription factor usf. Ii. DNA binding properties and transcriptional activity of the purified hela usf. J. Biol. Chem. 1988, 263, 11994–12001. [Google Scholar] [PubMed]
  47. Ferre-D’Amare, A.R.; Pognonec, P.; Roeder, R.G.; Burley, S.K. Structure and function of the b/hlh/z domain of usf. EMBO J. 1994, 13, 180–189. [Google Scholar] [CrossRef] [PubMed]
  48. Friedman, J.R.; Kaestner, K.H. The foxa family of transcription factors in development and metabolism. Cell. Mol. Life Sci. 2006, 63, 2317–2328. [Google Scholar] [CrossRef]
  49. Kaestner, K.H.; Hiemisch, H.; Luckow, B.; Schutz, G. The hnf-3 gene family of transcription factors in mice: Gene structure, cdna sequence and mrna distribution. Genomics 1994, 20, 377–385. [Google Scholar] [CrossRef]
  50. Wolfrum, C.; Asilmaz, E.; Luca, E.; Friedman, J.M.; Stoffel, M. Foxa2 regulates lipid metabolism and ketogenesis in the liver during fasting and in diabetes. Nature 2004, 432, 1027–1032. [Google Scholar] [CrossRef]
  51. Wolfrum, C.; Shih, D.Q.; Kuwajima, S.; Norris, A.W.; Kahn, C.R.; Stoffel, M. Role of foxa-2 in adipocyte metabolism and differentiation. J. Clin. Investig. 2003, 112, 345–356. [Google Scholar] [CrossRef] [PubMed]
  52. Zhang, L.; Rubins, N.E.; Ahima, R.S.; Greenbaum, L.E.; Kaestner, K.H. Foxa2 integrates the transcriptional response of the hepatocyte to fasting. Cell Metab. 2005, 2, 141–148. [Google Scholar] [CrossRef] [Green Version]
  53. Le Lay, J.; Kaestner, K.H. The fox genes in the liver: From organogenesis to functional integration. Physiol. Rev. 2010, 90, 1–22. [Google Scholar] [CrossRef] [PubMed]
  54. Kim, J.Y.; Kim, H.J.; Kim, K.T.; Park, Y.Y.; Seong, H.A.; Park, K.C.; Lee, I.K.; Ha, H.; Shong, M.; Park, S.C.; et al. Orphan nuclear receptor small heterodimer partner represses hepatocyte nuclear factor 3/foxa transactivation via inhibition of its DNA binding. Mol. Endocrinol. 2004, 18, 2880–2894. [Google Scholar] [CrossRef]
  55. Yalley, A.; Schill, D.; Hatta, M.; Johnson, N.; Cirillo, L.A. Loss of interdependent binding by the foxo1 and foxa1/a2 forkhead transcription factors culminates in perturbation of active chromatin marks and binding of transcriptional regulators at insulin-sensitive genes. J. Biol. Chem. 2016, 291, 8848–8861. [Google Scholar] [CrossRef]
  56. Bryzgalov, L.O.; Ershov, N.I.; Ilnitskaya, S.I. Foxa transcription factors determine the amplitude of glucocorticoid induction of tyrosine aminotransferase in mice. Bull. Exp. Biol. Med. 2007, 144, 722–724. [Google Scholar] [CrossRef] [PubMed]
  57. Huizing, M.; Ruitenbeek, W.; van den Heuvel, L.P.; Dolce, V.; Iacobazzi, V.; Smeitink, J.A.; Palmieri, F.; Trijbels, J.M. Human mitochondrial transmembrane metabolite carriers: Tissue distribution and its implication for mitochondrial disorders. J. Bioenerg. Biomembr. 1998, 30, 277–284. [Google Scholar] [CrossRef]
  58. Iacobazzi, V.; Convertini, P.; Infantino, V.; Scarcia, P.; Todisco, S.; Palmieri, F. Statins, fibrates and retinoic acid upregulate mitochondrial acylcarnitine carrier gene expression. Biochem. Biophys. Res. Commun. 2009, 388, 643–647. [Google Scholar] [CrossRef]
  59. Liu, M.; Lee, D.F.; Chen, C.T.; Yen, C.J.; Li, L.Y.; Lee, H.J.; Chang, C.J.; Chang, W.C.; Hsu, J.M.; Kuo, H.P.; et al. Ikkalpha activation of notch links tumorigenesis via foxa2 suppression. Mol. Cell 2012, 45, 171–184. [Google Scholar] [CrossRef]
  60. Vorvis, C.; Hatziapostolou, M.; Mahurkar-Joshi, S.; Koutsioumpa, M.; Williams, J.; Donahue, T.R.; Poultsides, G.A.; Eibl, G.; Iliopoulos, D. Transcriptomic and crispr/cas9 technologies reveal foxa2 as a tumor suppressor gene in pancreatic cancer. Am. J. Physiol. Gastrointest. Liver Physiol. 2016, 310, G1124–G1137. [Google Scholar] [CrossRef]
  61. Chen, X.; Cheung, S.T.; So, S.; Fan, S.T.; Barry, C.; Higgins, J.; Lai, K.M.; Ji, J.; Dudoit, S.; Ng, I.O.; et al. Gene expression patterns in human liver cancers. Mol. Biol. Cell 2002, 13, 1929–1939. [Google Scholar] [CrossRef] [PubMed]
  62. Mas, V.R.; Maluf, D.G.; Archer, K.J.; Yanek, K.; Kong, X.; Kulik, L.; Freise, C.E.; Olthoff, K.M.; Ghobrial, R.M.; McIver, P.; et al. Genes involved in viral carcinogenesis and tumor initiation in hepatitis C virus-induced hepatocellular carcinoma. Mol. Med. 2009, 15, 85–94. [Google Scholar] [CrossRef] [PubMed]
  63. Roessler, S.; Jia, H.L.; Budhu, A.; Forgues, M.; Ye, Q.H.; Lee, J.S.; Thorgeirsson, S.S.; Sun, Z.; Tang, Z.Y.; Qin, L.X.; et al. A unique metastasis gene signature enables prediction of tumor relapse in early-stage hepatocellular carcinoma patients. Cancer Res. 2010, 70, 10202–10212. [Google Scholar] [CrossRef] [PubMed]
  64. Hanse, E.A.; Ruan, C.; Kachman, M.; Wang, D.; Lowman, X.H.; Kelekar, A. Cytosolic malate dehydrogenase activity helps support glycolysis in actively proliferating cells and cancer. Oncogene 2017, 36, 3915–3924. [Google Scholar] [CrossRef] [PubMed] [Green Version]
  65. Infantino, V.; Iacobazzi, V.; De Santis, F.; Mastrapasqua, M.; Palmieri, F. Transcription of the mitochondrial citrate carrier gene: Role of srebp-1, upregulation by insulin and downregulation by pufa. Biochem. Biophys. Res. Commun. 2007, 356, 249–254. [Google Scholar] [CrossRef] [PubMed]
  66. Santarsiero, A.; Leccese, P.; Convertini, P.; Padula, A.; Abriola, P.; D’Angelo, S.; Bisaccia, F.; Infantino, V. New insights into behcet’s syndrome metabolic reprogramming: Citrate pathway dysregulation. Mediators Inflamm. 2018, 2018, 1419352. [Google Scholar] [CrossRef]
  67. Infantino, V.; Iacobazzi, V.; Palmieri, F.; Menga, A. Atp-citrate lyase is essential for macrophage inflammatory response. Biochem. Biophys. Res. Commun. 2013, 440, 105–111. [Google Scholar] [CrossRef]
  68. Convertini, P.; Tramutola, F.; Iacobazzi, V.; Lupattelli, P.; Chiummiento, L.; Infantino, V. Permethylated anigopreissin a inhibits human hepatoma cell proliferation by mitochondria-induced apoptosis. Chem. Biol. Interact. 2015, 237, 1–8. [Google Scholar] [CrossRef]
  69. Iacobazzi, V.; Infantino, V.; Palmieri, F. Epigenetic mechanisms and sp1 regulate mitochondrial citrate carrier gene expression. Biochem. Biophys. Res. Commun. 2008, 376, 15–20. [Google Scholar] [CrossRef]
Figure 1. (A) Deletion analysis of the 5′-flanking region of the human SLC25A13 gene. The deletion mutants named C1-C6 were cloned into the pGL3 basic-LUC vector and tested for LUC activity in transfected HepG2, HEK293 and SK-N-SH cells. pGL3 indicates the pGL3 basic-LUC vector alone. Numbering indicates the extent of fragments, while bars indicate LUC activity. The values of construct C1 transfected in HepG2 cells were set to 100%. Means ± SD of three duplicate independent experiments are shown. (B) Total RNAs extracted from HepG2, HEK293 and SK-N-SH cells were used to quantify SLC25A13 mRNA by real-time polymerase chain reaction (PCR). Means ± S.D. of four replicate independent real-time PCR experiments are shown. Where indicated, differences between samples and control were significant (**p < 0.01). AGC2 and β-actin proteins of HepG2, HEK293 and SK-N-SH cells were immunodecorated with specific antibodies. The Western blot analysis is representative of three independent experiments with similar results.
Ijms 20 01888 g001
Figure 2. Effect of USF1 on SLC25A13 gene expression. (A) ChIP-qPCR assay shows the amplification bands of PCR using the specific primers suitable to amplify the −498/−343 bp region of the SLC25A13 gene promoter. M: Marker, lane I: Input, lane USF1: amplification PCR band after ChIP with specific antibody for human USF1, lane NoAb: without the anti-USF1 antibody addition. (B) Luciferase activity was measured in HepG2 cells co-transfected with C5 construct (−442/−19 of the SLC25A13 gene promoter) and siRNA targeting human USF1 (+, black bar) or control siRNA (-, white bar). (C) Total RNA extracted from HepG2 cells treated without (white bar) or with (black bar) siRNA against human USF1 was used to quantify SLC25A13 mRNA by real-time PCR. Immunodecoration was performed with specific antibodies for AGC2 and β-actin proteins in HepG2 cells treated under the conditions described. (D) Luciferase activity of HepG2cells co-transfected with pGL3 basic-LUC vector containing the −442/−19 SLC25A13 promoter region wild-type (W) or mutated (M) in USF1 site and pcDNA3-USF1 (+: black bar) or empty pcDNA3 (-: white bar). (E) Total RNA extracted from HepG2 cells transfected with pcDNA3-USF1 (+) or empty pcDNA3 (-) was used to quantify SLC25A13 mRNA by real-time PCR. AGC2 and β-actin of HepG2 cells transfected with pc-DNA3-USF1 (+) or empty pcDNA3 (-) were immunodecorated with anti-AGC2 and anti-β-actin antibodies. (F) Total RNA from liver foetal cells (white bar) and adult (black bar) was used to quantify USF1 and SLC25A13 mRNAs by real-time PCR. For panels (BF), means ± SD of three duplicate independent experiments are shown; all differences between samples and relative controls were significant (*p < 0.05 or **p < 0.01 one-way ANOVA followed by Student’s t-test).
Ijms 20 01888 g002
Figure 3. Effect of FOXA2 on SLC25A13 gene expression. (A) HepG2 cells co-transfected with pGL3 basic-LUC vector containing the −968/−19 SLC25A13 gene promoter region and siRNA targeting human FOXA1, FOXA2 and FOXA3 or with control siRNA (-: white bar) were assayed for LUC activity. (B) Total RNA extracted from HepG2 cells transfected with siRNA targeting human FOXA1, FOXA2 and FOXA3 or with control siRNA (-: white bar) was used to quantify SLC25A13 mRNA by real-time PCR. AGC2 and β-actin proteins of transfected HepG2 cells were immunodecorated with specific antibodies. (C) HepG2 cells co-transfected with pGL3 basic-LUC vector containing the wild-type (W: white bar) or mutated (M: black bars) −968/−19 SLC25A13 gene promoter region wild- type and with pcDNA3-FOXA2 (+) or empty pcDNA3 (-) were assayed for LUC activity. (D) Total RNA extracted from HepG2 cells transfected with pcDNA3-FOXA2 (black bar) or empty pcDNA3 (white bar) was used to quantify SLC25A13 mRNA by real-time PCR. AGC2 and β-actin of transfected HepG2 cells were immunodecorated with specific antibodies. (E) ChIP-qPCR assay of FOXA2 binding to the endogenous SLC25A13 gene promoter shows the −1040/−864 bp region amplification band. M: Marker, lane I: Input, lane FOXA2: amplification PCR band after ChIP with a specific antibody for human FOXA2, lane NoAb: without the anti-FOXA2 antibody addition. (F) Total RNA extracted from normal (white bar) and hepatocellular carcinoma (HCC) (black bar) cells was used to quantify FOXA2 and SLC25A13 mRNAs by real-time PCR. FOXA2, AGC2 and β-actin proteins of primary hepatocytes and HepG2 cells were immunodecorated with specific antibodies. In (AD) and (F) panels, means ± SD of three duplicate independent experiments are shown; all differences between samples and relative controls were significant (*p < 0.05 or **p < 0.01 one-way ANOVA followed by Student’s-t-test).
Ijms 20 01888 g003
Figure 4. Activation of SLC25A13 gene by FOXA2. (A) FOXA1, FOXA2 and FOXA3 mRNA levels in HepG2 and SK-N-SH cells. (B) HepG2 and SK-N-SH cells co-transfected with pGL3 basic-LUC vector containing C2 construct (968/−19 of the SLC25A13 gene promoter region) wild-type (W) or mutated (M) in FOXA2 binding site and with pcDNA3-FOXA2 (+: black bars) or empty pcDNA3 (-: white bar) were assayed for LUC activity. Where indicated, differences between samples and relative controls were significant (*p < 0.05 or **p < 0.01 one-way ANOVA followed by Student’s t-test).
Ijms 20 01888 g004
Figure 5. (A) Synergy between FOXA2 and USF1. HepG2 cells co-transfected with pGL3 basic-LUC vector containing C2 construct (−968/−19 of the SLC25A13 gene promoter region) wild-type (wt) or mutated (mutFOXA, mut USF and mut FOXA/USF) in combination with pcDNA3-FOXA2 and pcDNA3-USF1 (+: black bars) or empty pcDNA3 (-: white bars) were assayed for LUC activity. (B) FOXA2 and USF1 effect on AGC2 activity. Quantification of the NAD+/NADH ratio in HepG2 cells transfected with siRNA against FOXA1 and USF1 alone or in combination. siRNA against SLC25A13 was used as control. Where indicated, differences between samples and relative controls were significant (*p < 0.05 or **p < 0.01 one-way ANOVA followed by Student’s t-test).
Ijms 20 01888 g005
Table 1. List of primers used to generate the mutated FOXA and USF binding sequences.
NameSequence
wtFOXA5′-TGCTTGTTTATTTATTTTAGTAGG-3′
mutFOXA5′-TGCTTGGGGAGGGATGGTAGTAGG-3′
wtUSF5′-GCGGGGTCACGTGTCCCTGT-3′
mutUSF5′-GCGGGGTACCTGTTCCCTGT-3′
* Mutated nucleotides are underlined.

