Improved HPLC Conditions to Determine Eumelanin and Pheomelanin Contents in Biological Samples Using an Ion Pair Reagent


Abstract
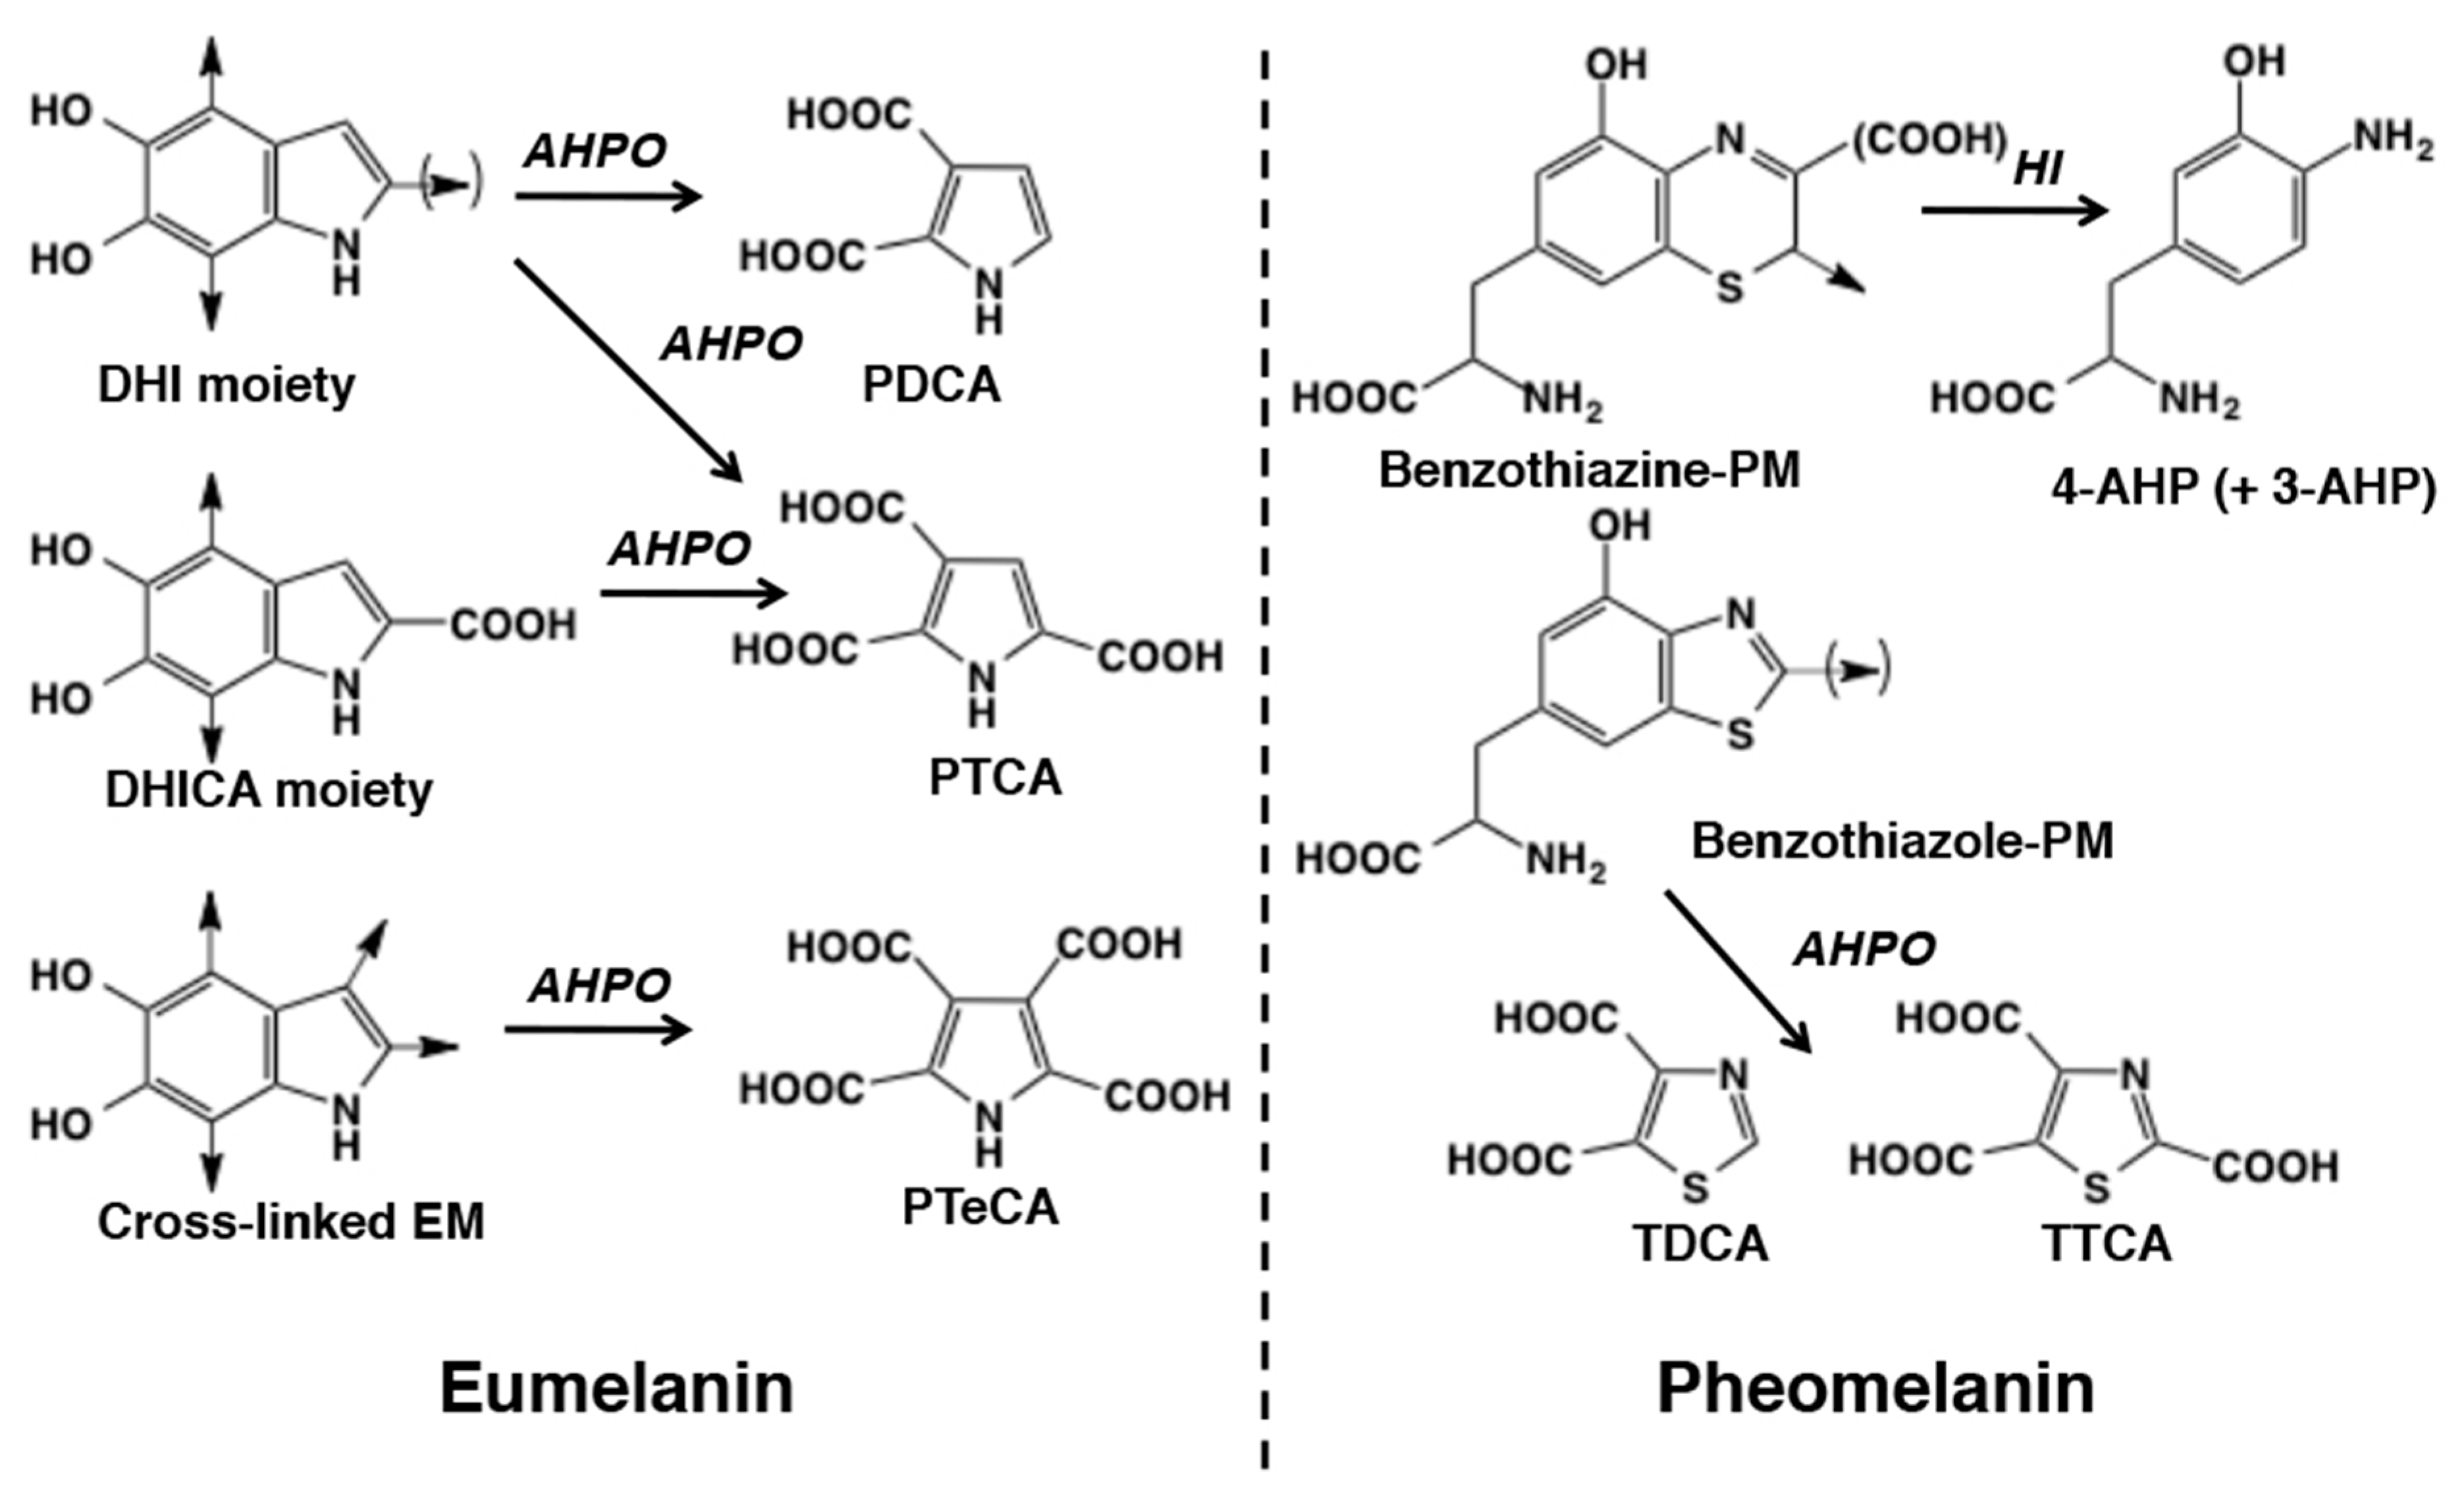
:1. Introduction
2. Results
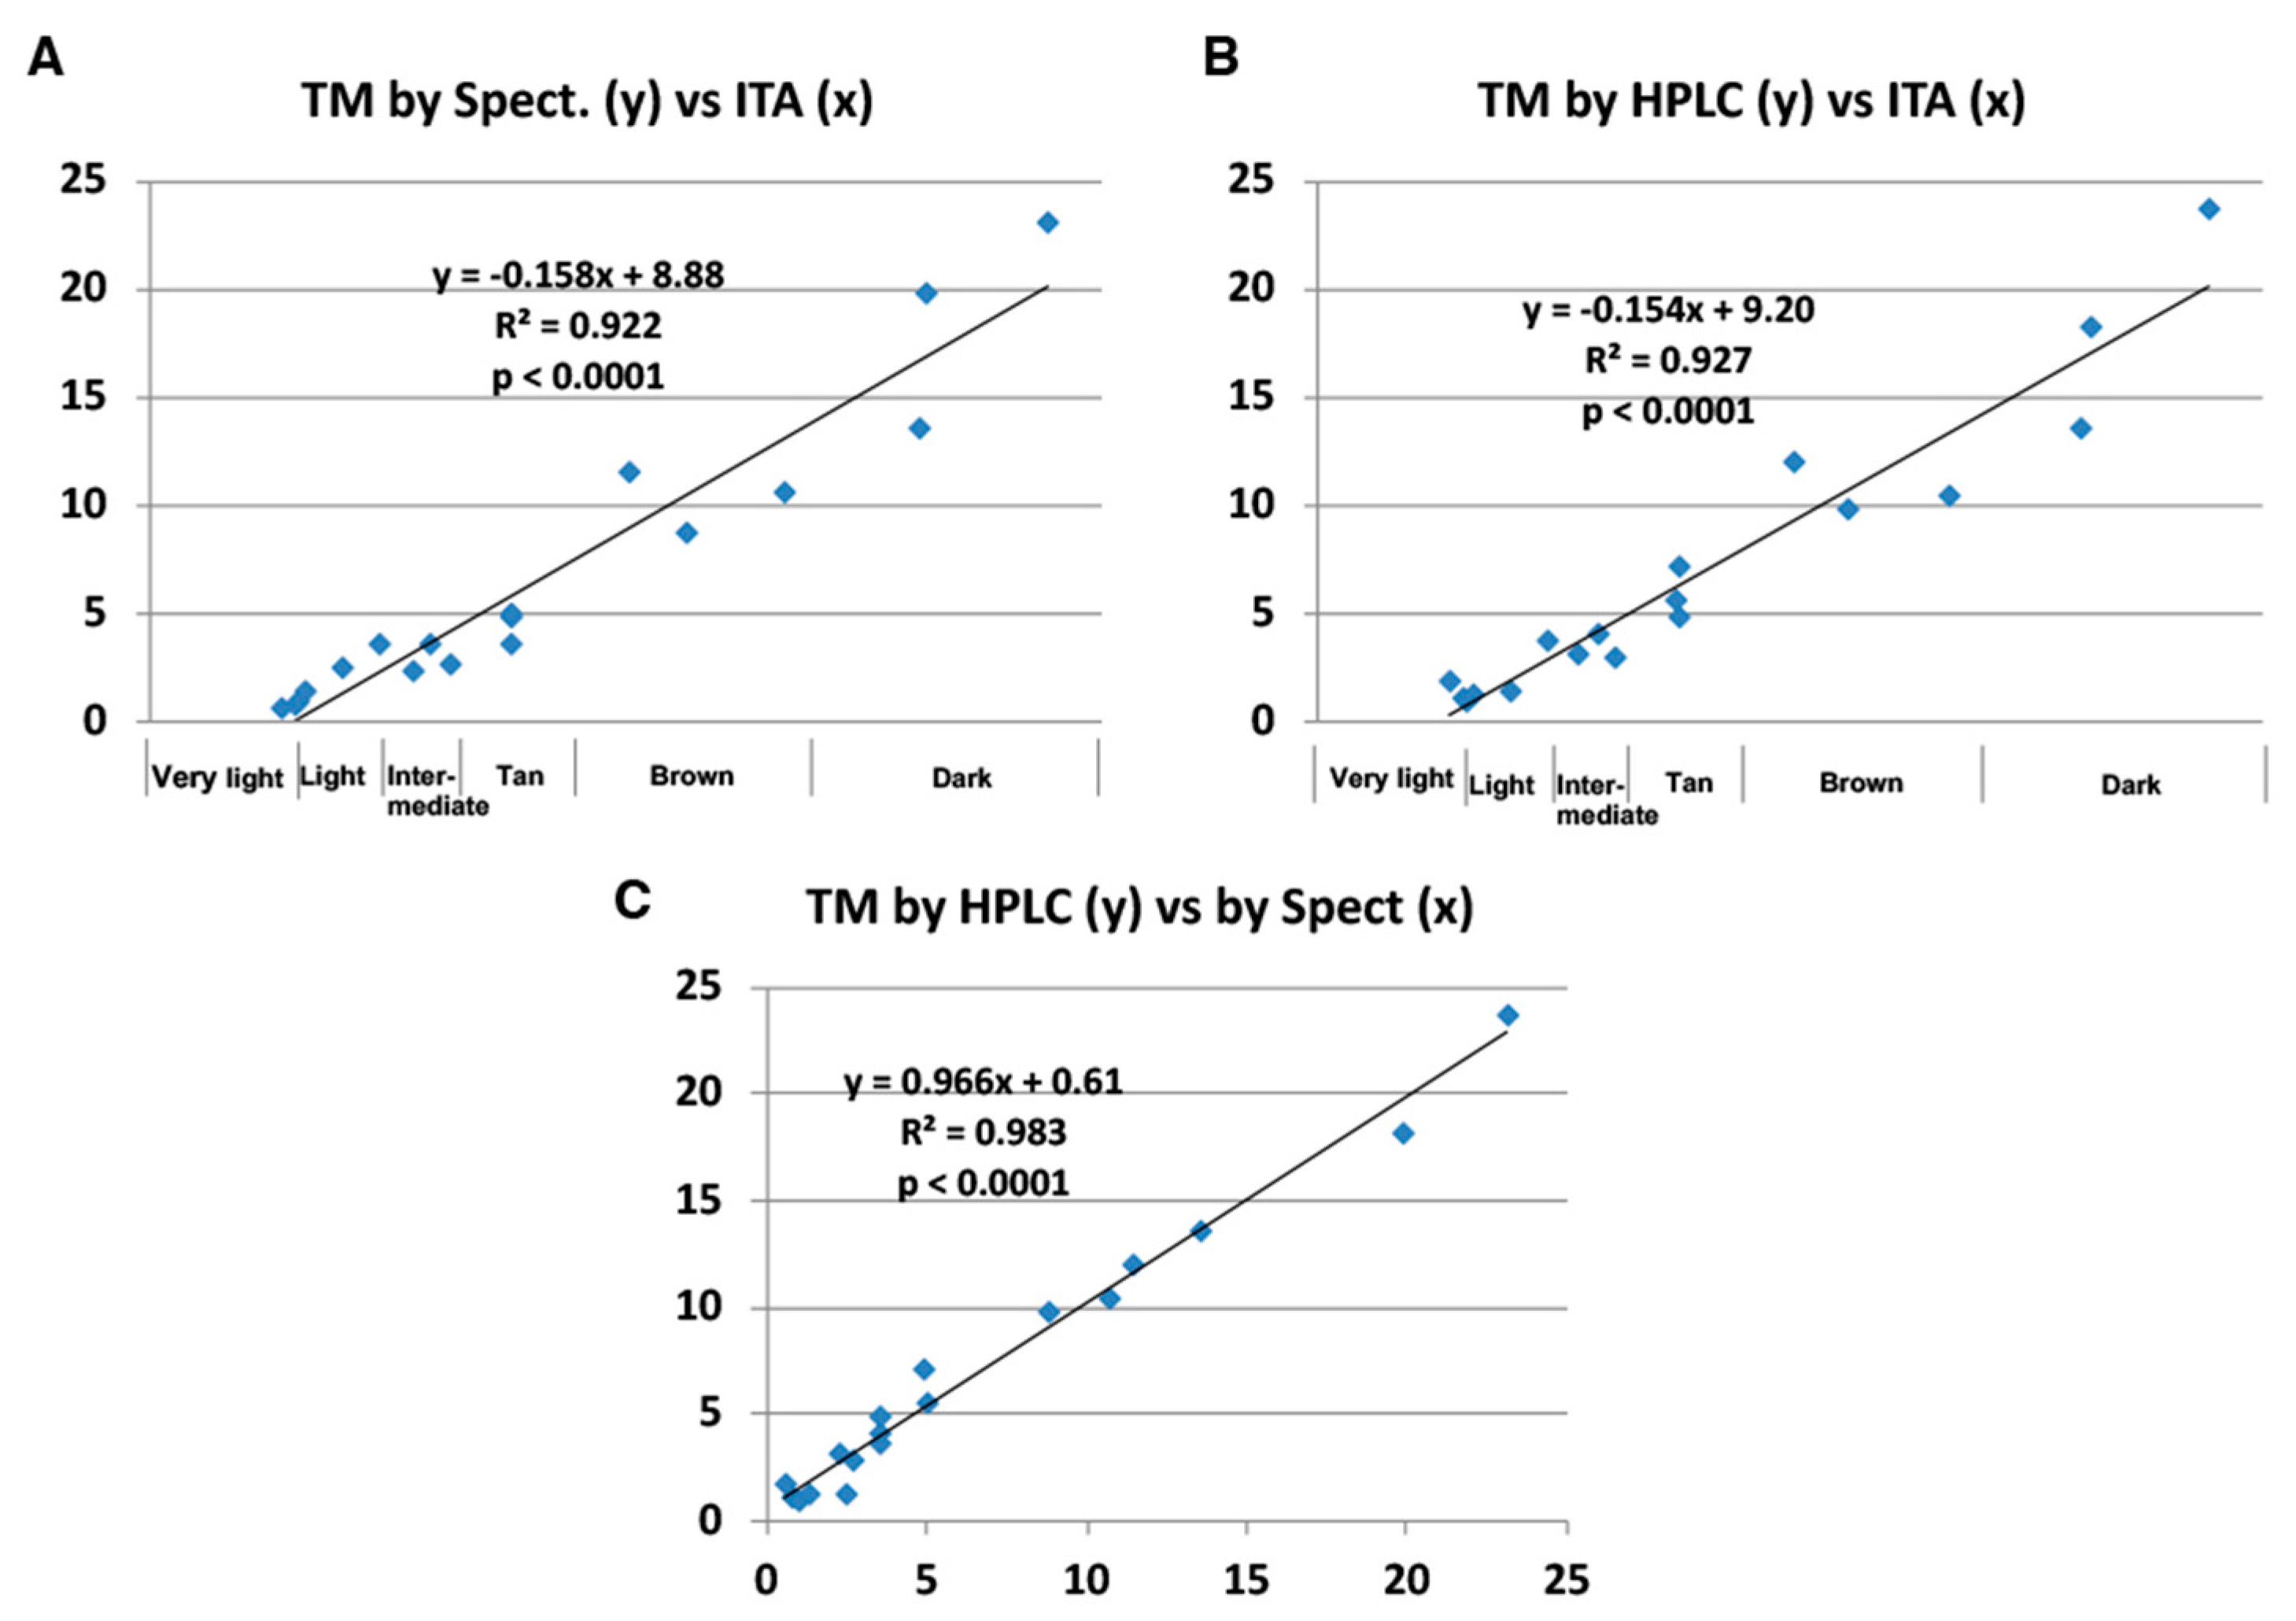
2.1. Evaluation of the Improved HPLC Conditions
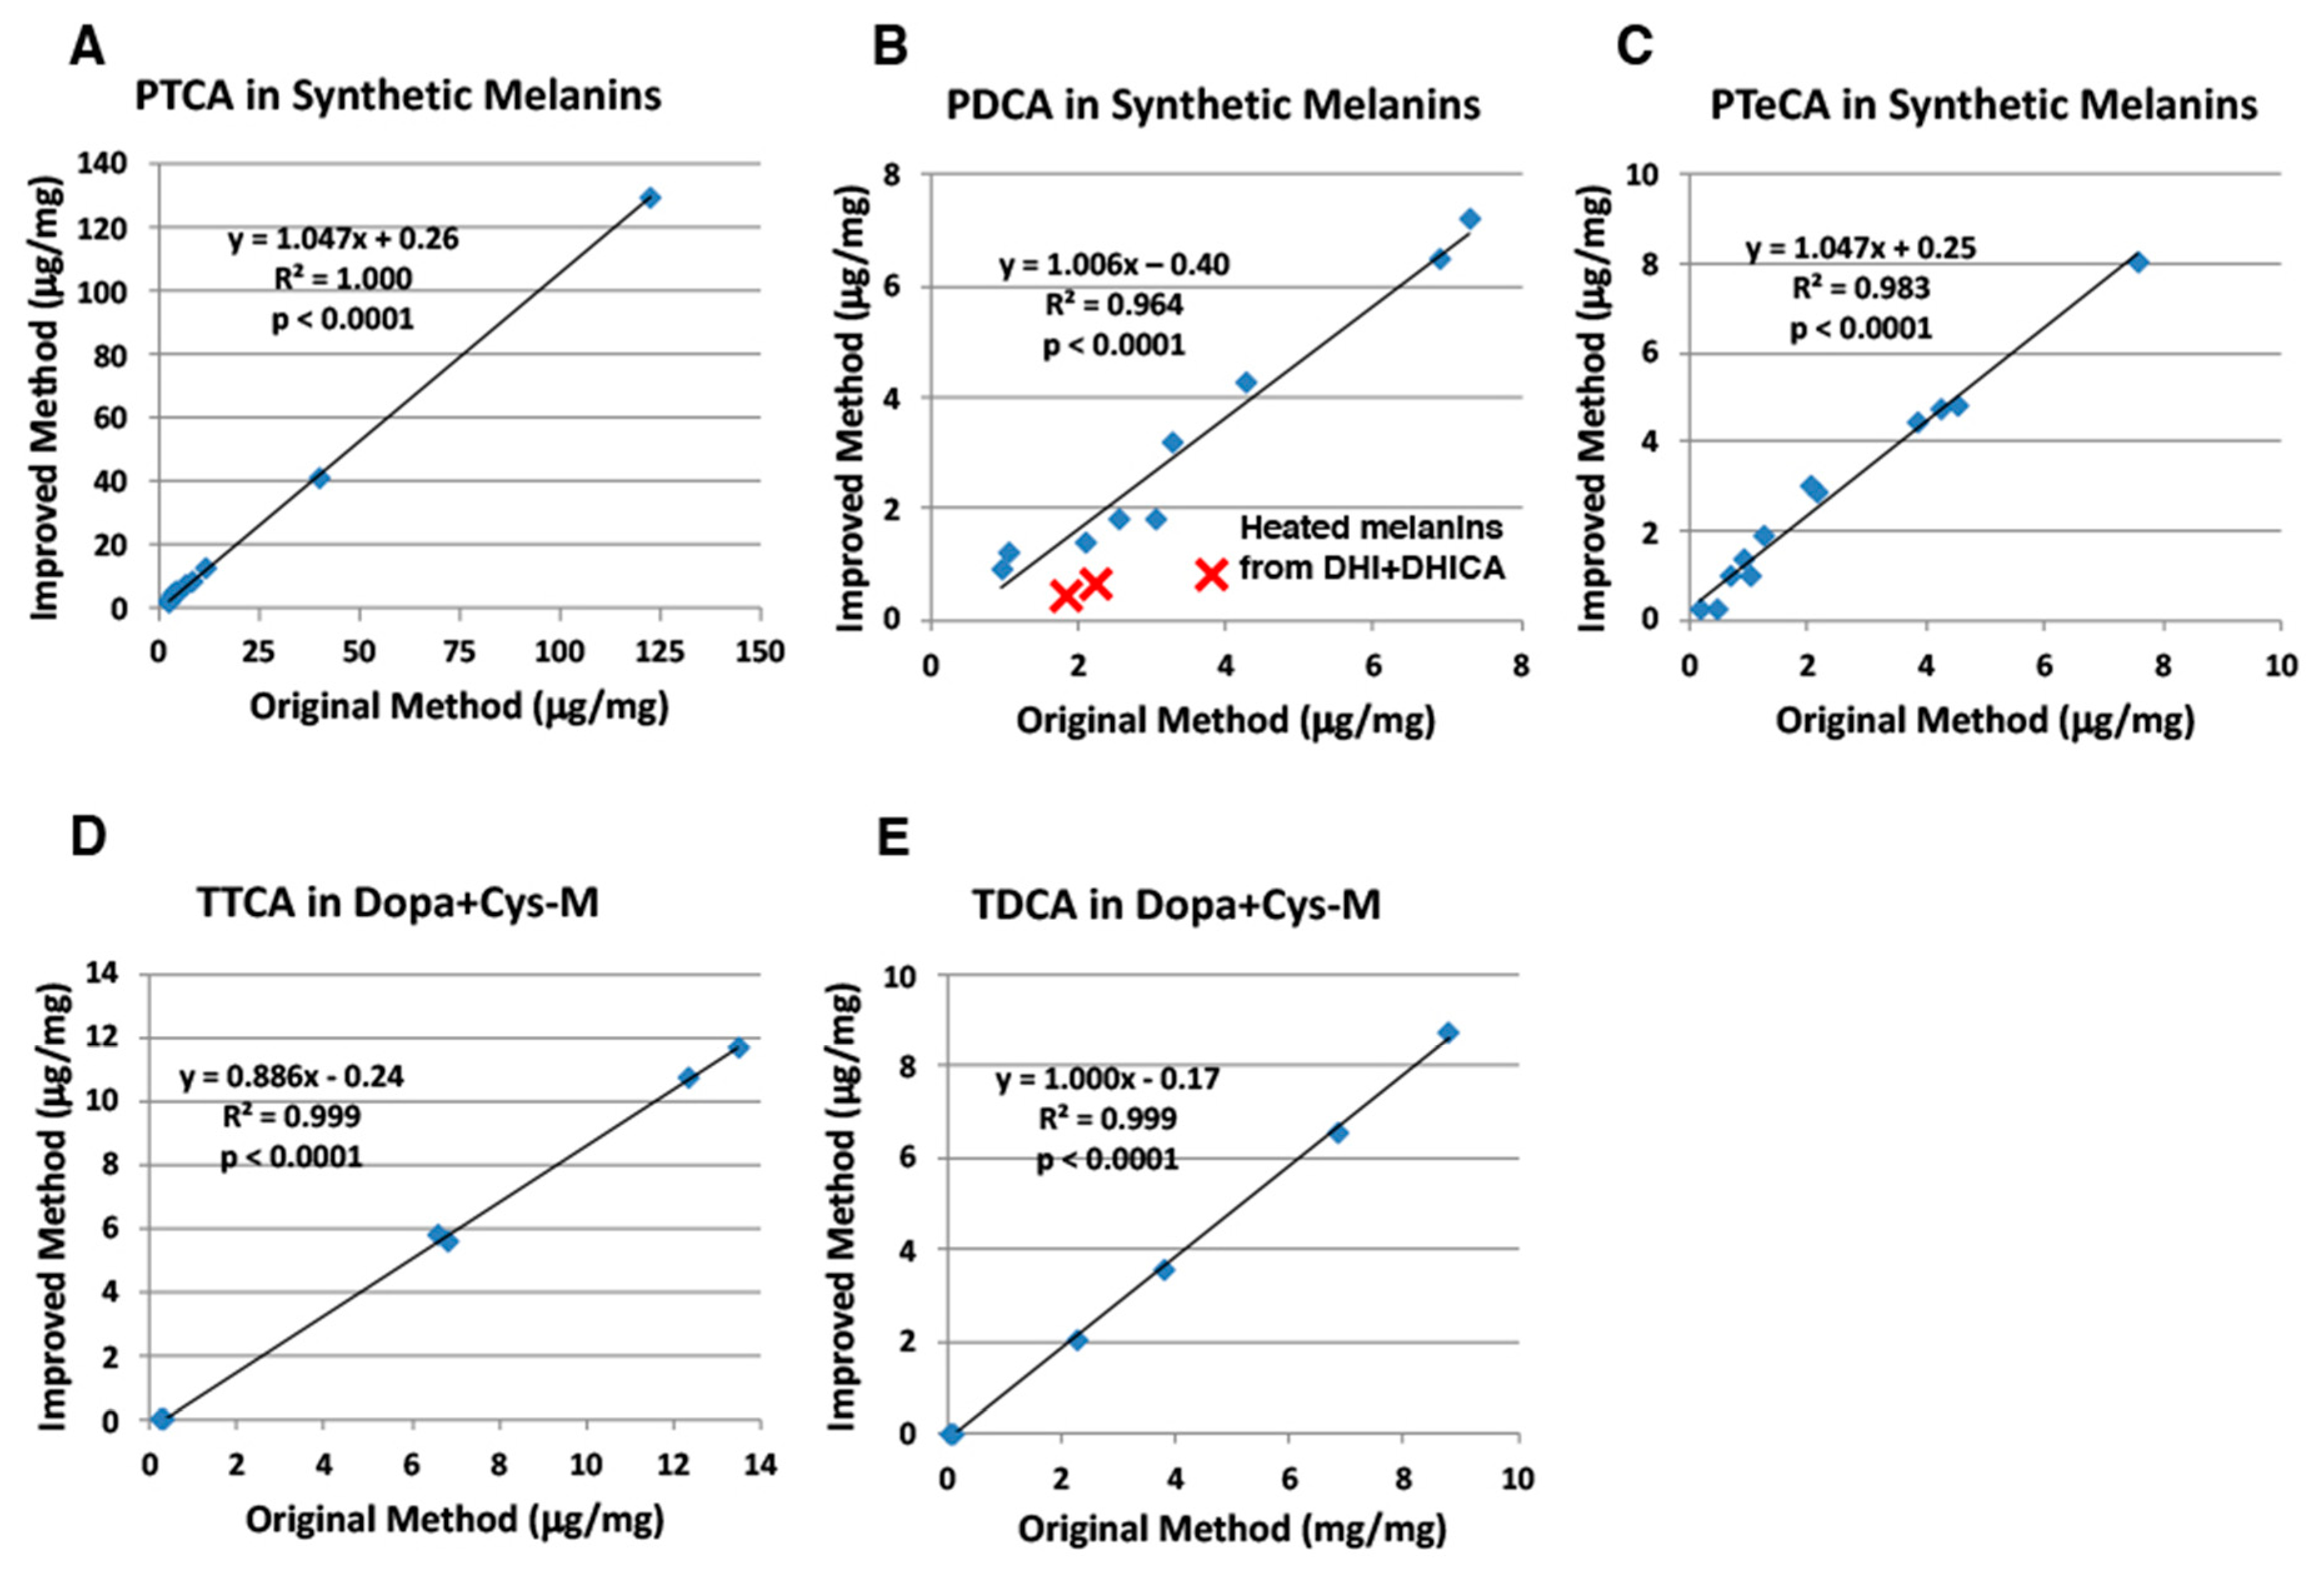
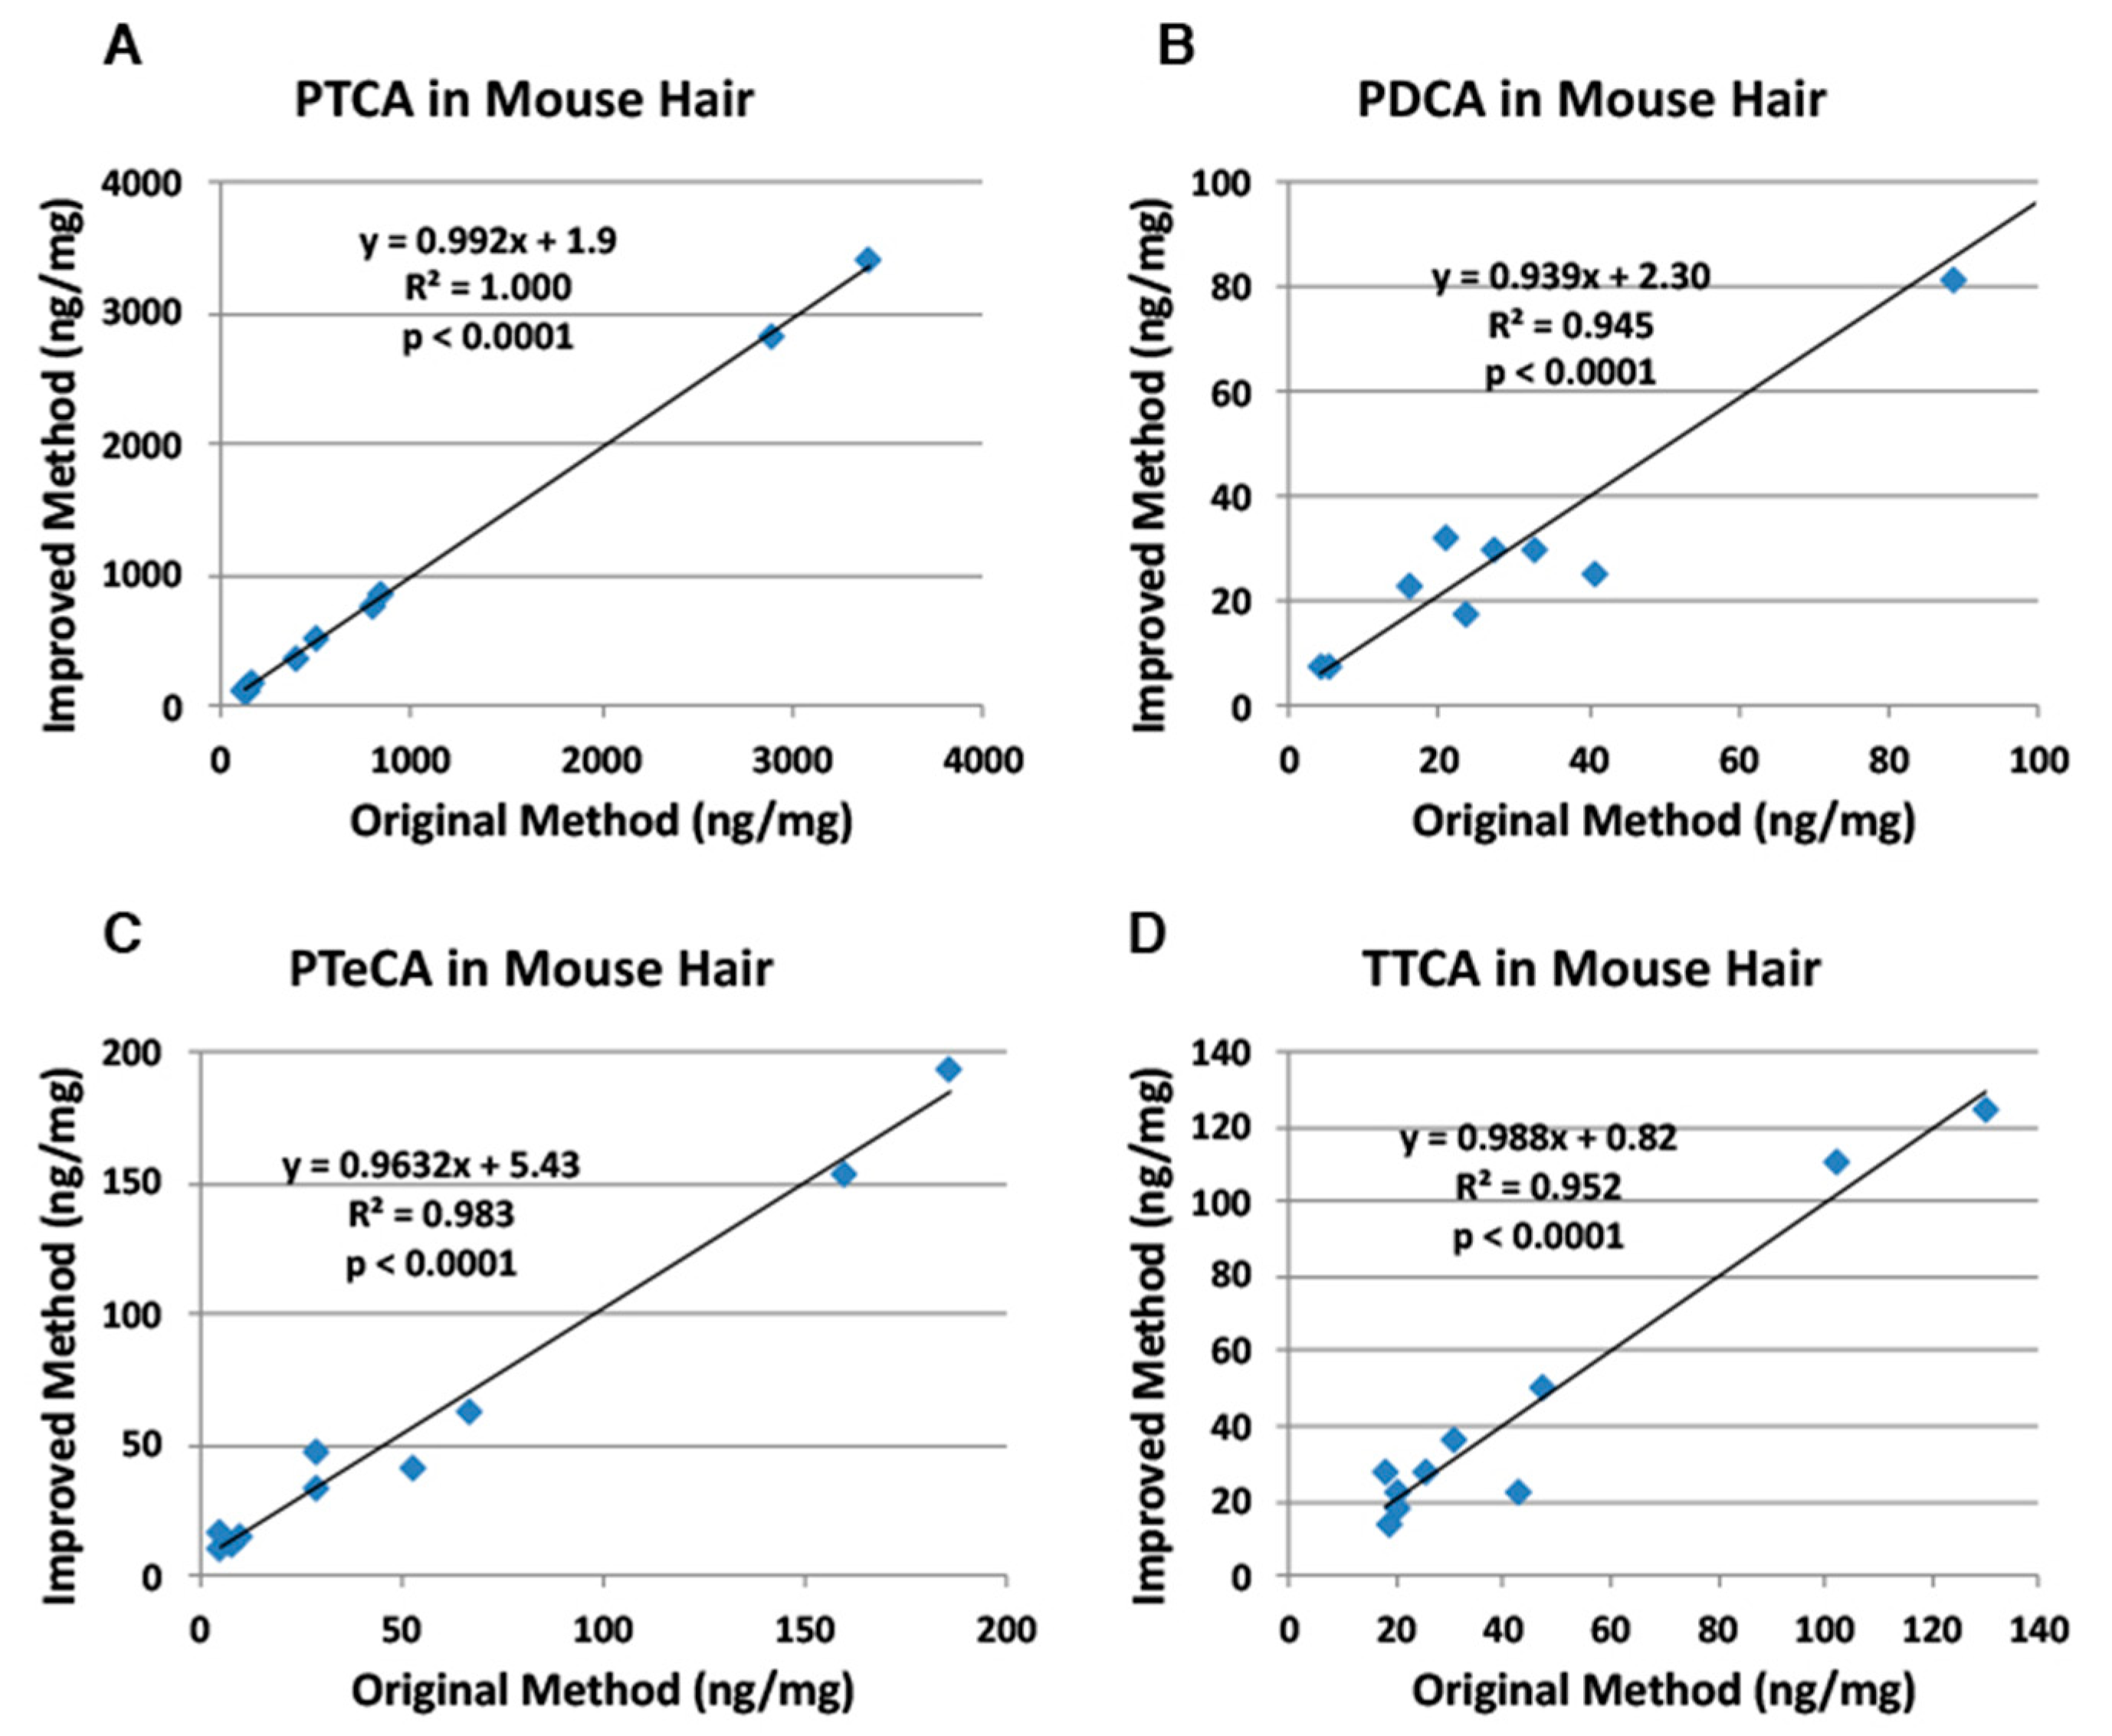
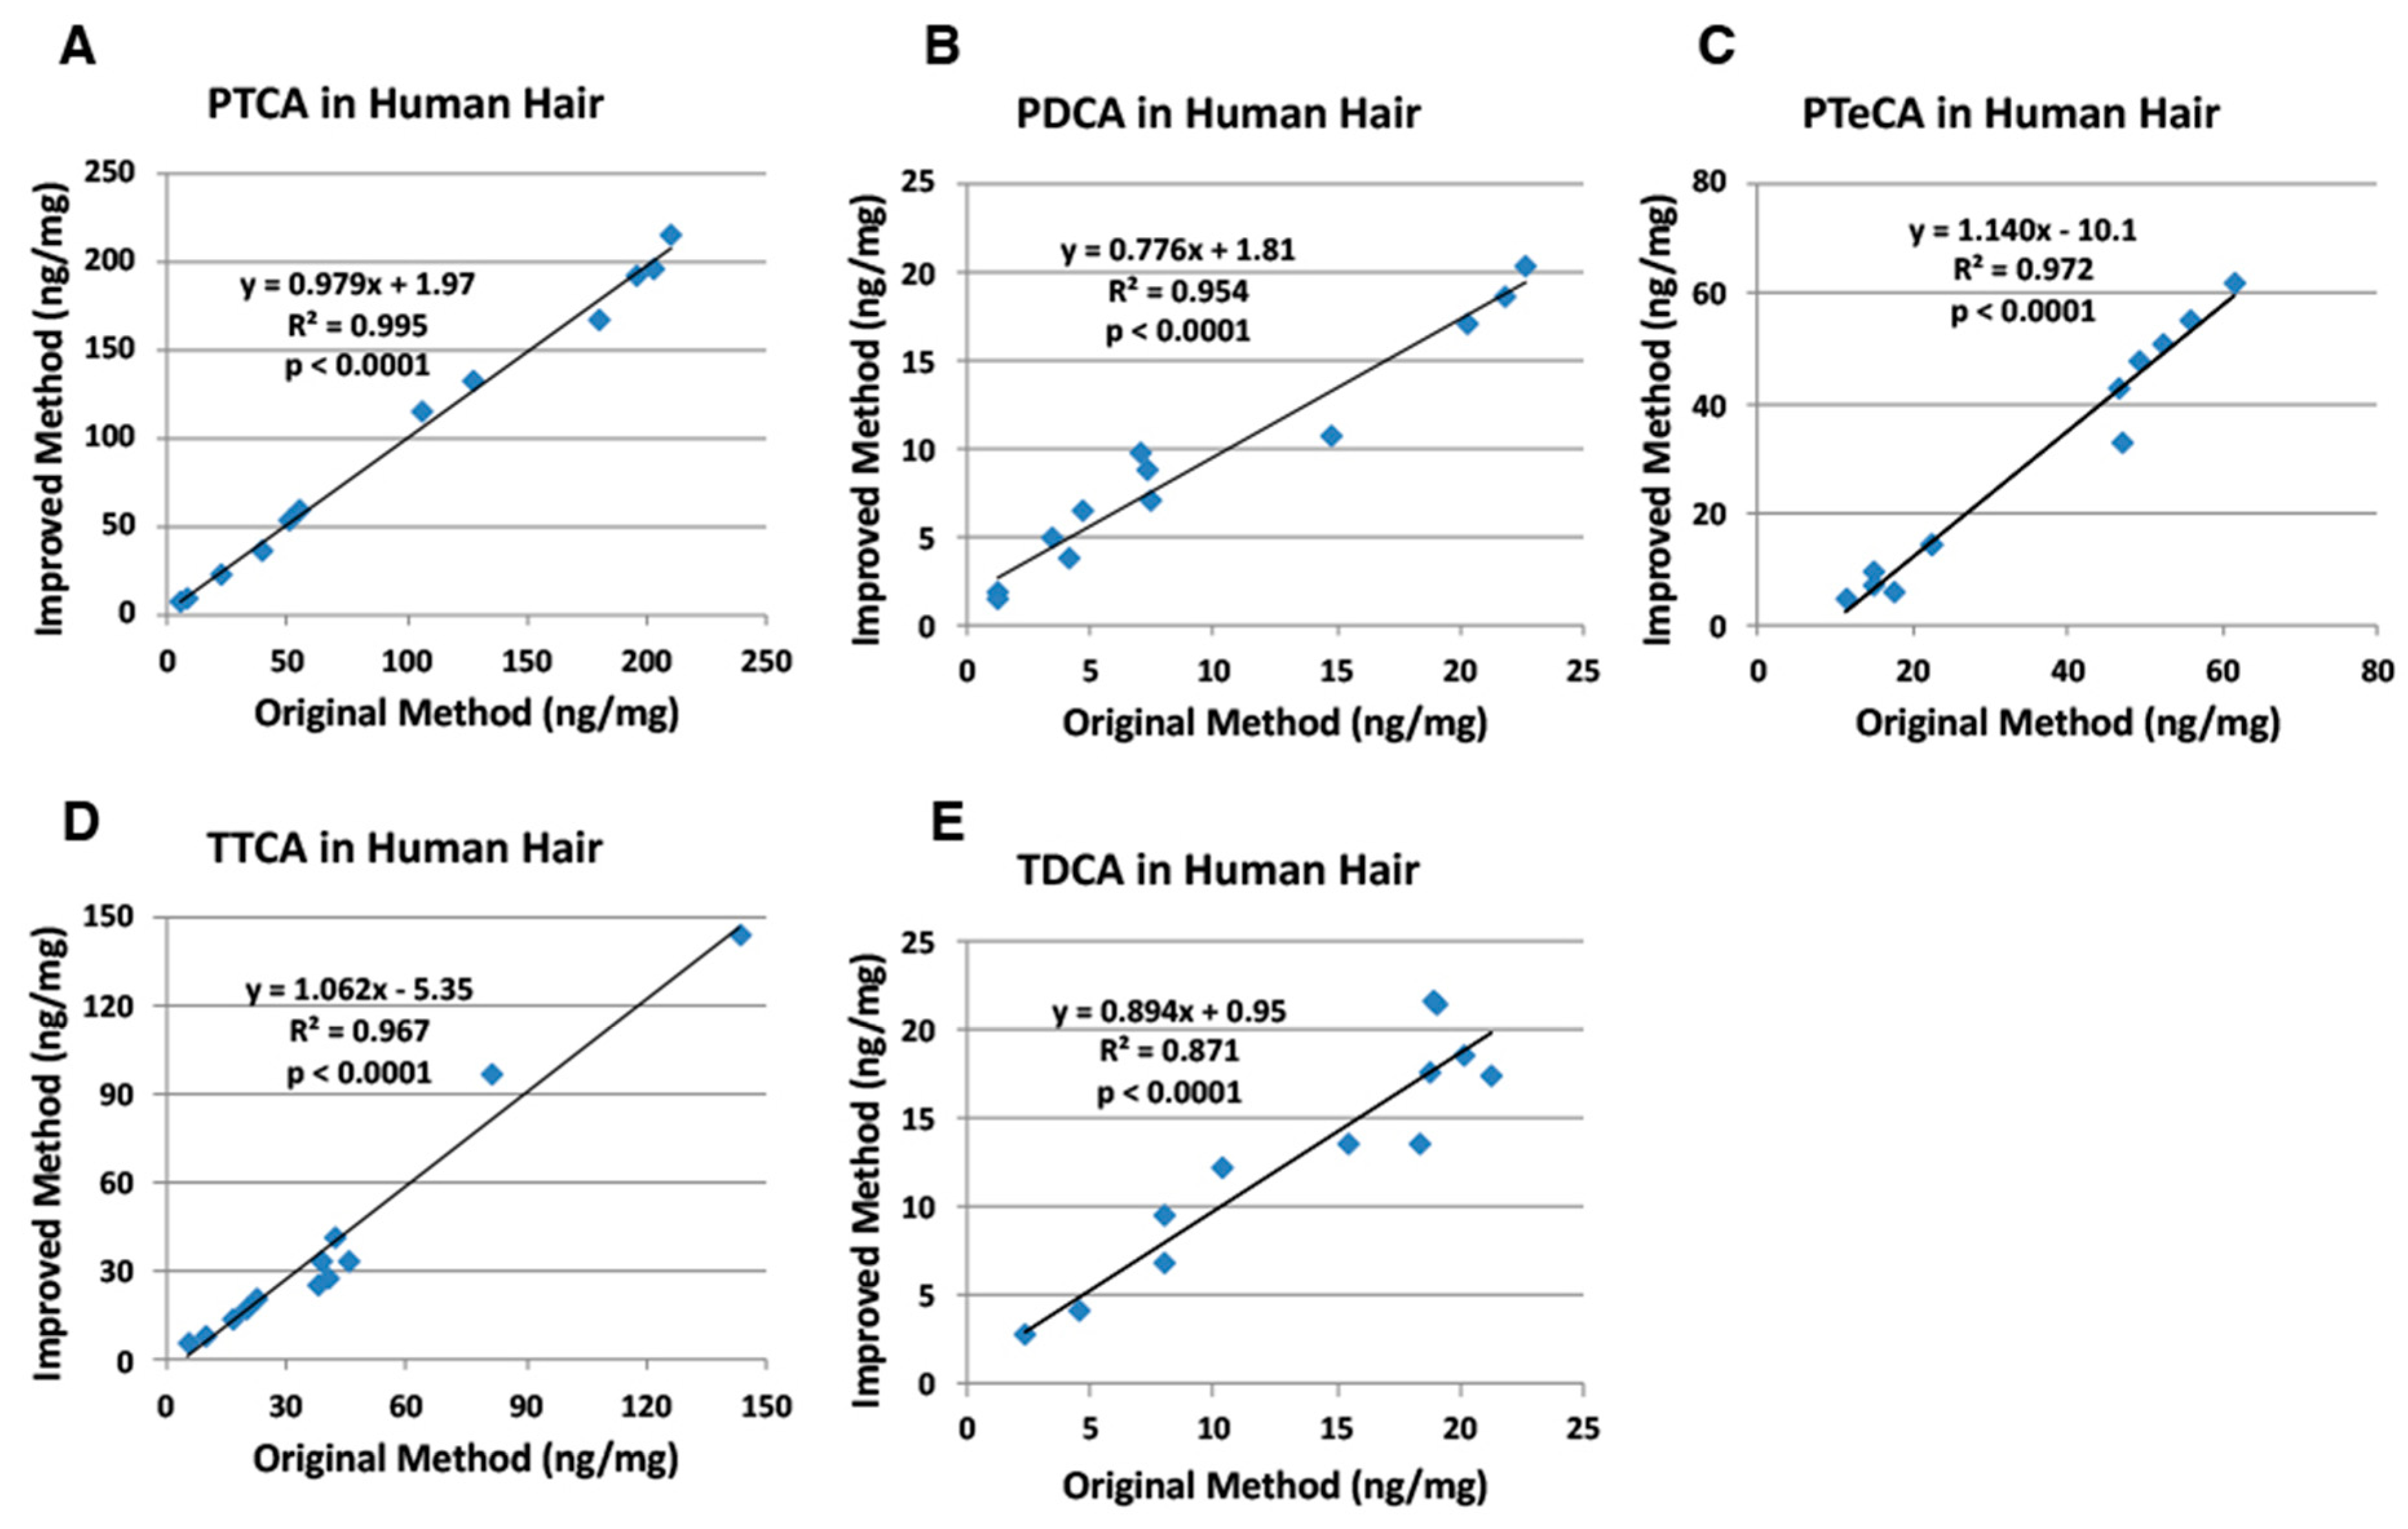
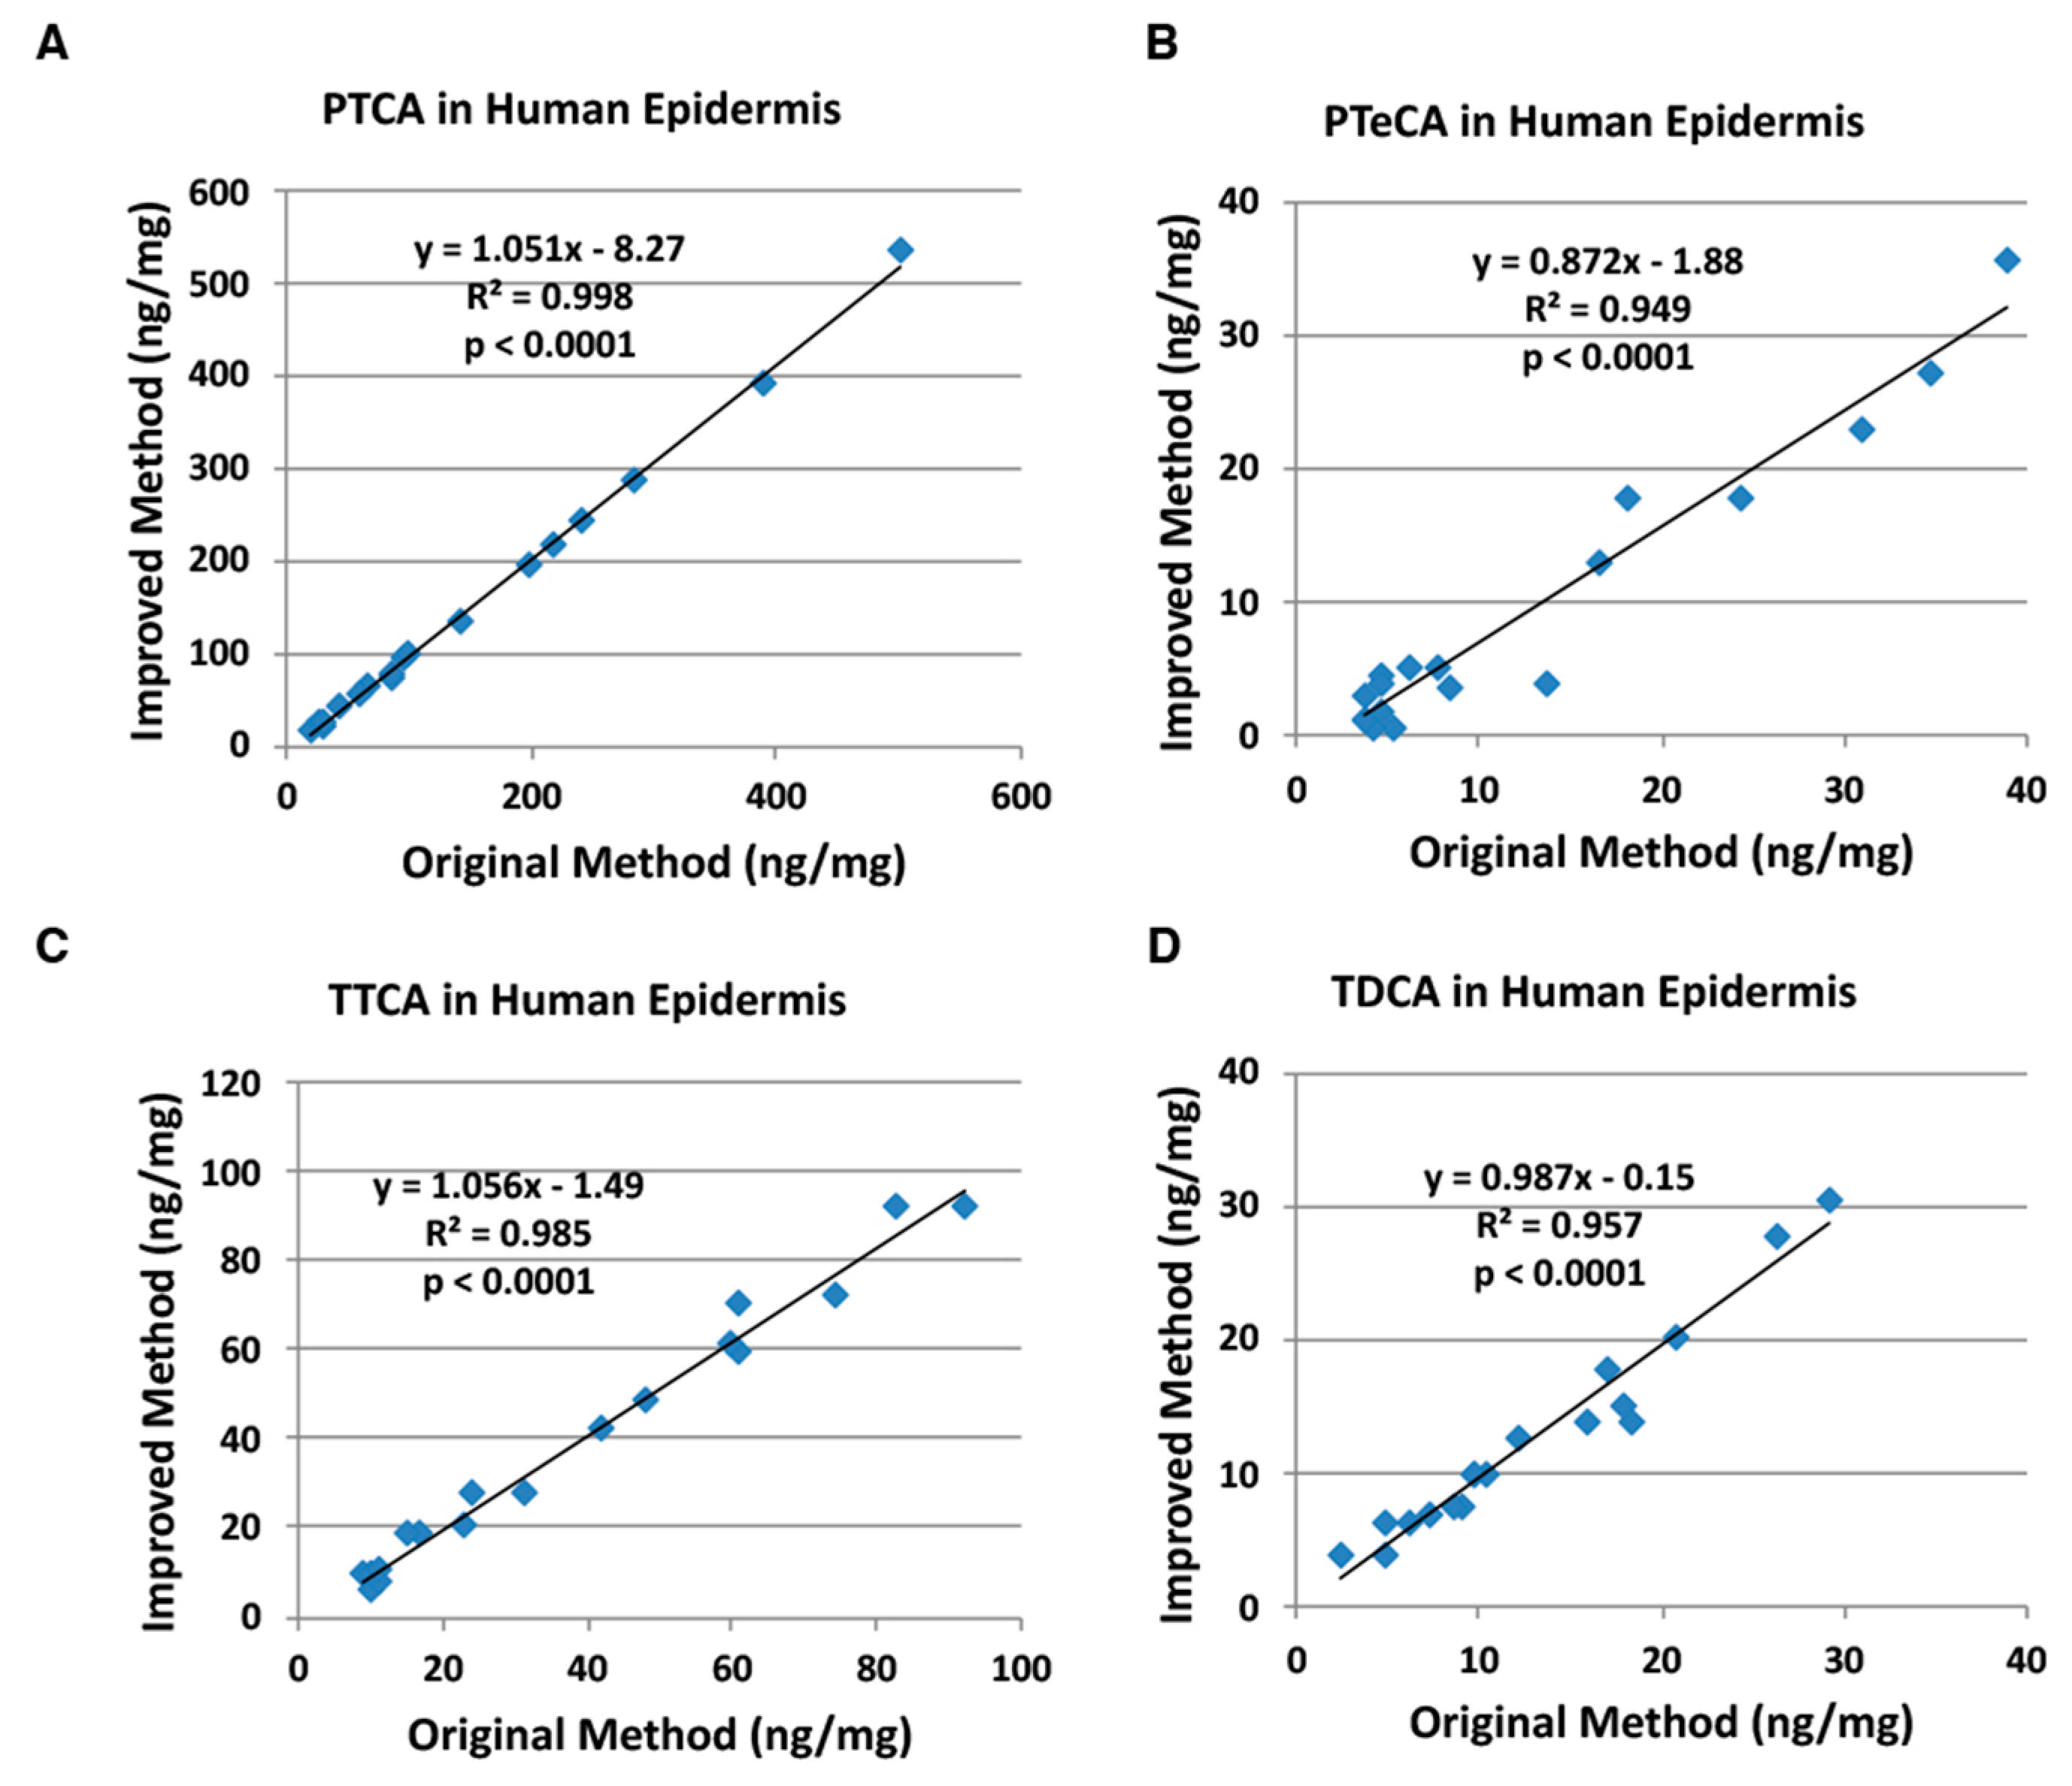
2.2. Correlation of the Improved HPLC Conditions with the Original HPLC Conditions
3. Discussion
4. Materials and Methods
4.1. Materials
4.2. HPLC Conditions
4.3. Melanin Analyses
4.4. Statistical Analyses
5. Conclusions
Supplementary Materials
Author Contributions
Funding
Conflicts of Interest
Abbreviations
| A500 | Absorbance at the wavelength of 500 nm |
| A650 | Absorbance at the wavelength of 650 nm |
| AHPO | Alkaline hydrogen peroxide oxidation |
| 3-AHP | 3-Amino-4-hydroxyphenylalanine |
| 4-AHP | 4-Amino-3-hydroxyphenylalanine |
| AU | Arbitrary unit |
| DHI | 5,6-Dihydroxyindole |
| DHICA | 5,6-Dihydroxyindole-2-carboxylic acid |
| H2O2 | Hydrogen peroxide |
| HI | Hydroiodic acid |
| HPLC | High performance liquid chromatography |
| ITA | Individual Typology Angle |
| LOD | Limits of detection |
| LOQ | Limits of quantification |
| PDCA | Pyrrole-2,3-dicarboxylic acid |
| PTCA | Pyrrole-2,3,5-tricarboxylic acid |
| PTeCA | Pyrrole-2,3,4,5-tetracarboxylic acid |
| TDCA | Thiazole-4,5-dicarboxylic acid |
| TBA+Br− | Tetra n-butylammonium bromide |
| TM | Total melanin |
| TTCA | Thiazole-2,4,5-tricarboxylic acid |
References
- D’Ischia, M.; Wakamatsu, K.; Cicoira, F.; di Mauro, E.; Garcia-Borron, J.C.; Commo, S.; Galván, I.; Ghanem, G.; Koike, K.; Meredith, P.; et al. Melanins and melanogenesis: From pigment cells to human health and technological applications. Pigment Cell Melanoma Res. 2015, 28, 520–544. [Google Scholar] [CrossRef] [Green Version]
- Ito, S.; Wakamatsu, K. Chemistry of mixed melanogenesis–pivotal roles of dopaquinone. Photochem. Photobiol. 2008, 84, 582–592. [Google Scholar] [CrossRef]
- D’Ischia, M.; Wakamatsu, K.; Napolitano, A.; Briganti, S.; Garcia-Borron, J.; Kovacs, D.; Meredith, P.; Pezzella, A.; Picardo, M.; Sarna, T.; et al. Melanins and melanogenesis: Methods, standards, protocols. Pigment Cell Melanoma Res. 2013, 26, 616–633. [Google Scholar] [CrossRef] [PubMed]
- Szewczyk, G.; Zadlo, A.; Sarna, M.; Ito, S.; Wakamatsu, K.; Sarna, T. Aerobic photoreactivity of synthetic eumelanins and pheomelanins: Generation of singlet oxygen and superoxide anion. Pigment Cell Melanoma Res. 2016, 29, 669–678. [Google Scholar] [CrossRef] [PubMed]
- Ito, S.; Wakamatsu, K.; Sarna, T. Photodegradation of eumelanin and pheomelanin and its pathophysiological implications. Photochem. Photobiol. 2018, 94, 409–420. [Google Scholar] [CrossRef] [Green Version]
- Wakamatsu, K.; Ito, S. Advanced chemical methods in melanin determination. Pigment Cell Res. 2002, 15, 174–183. [Google Scholar] [CrossRef]
- Ito, S.; Nakanishi, Y.; Valenzuela, R.K.; Brilliant, M.H.; Kolbe, L.; Wakamatsu, K. Usefulness of alkaline hydrogen peroxide oxidation to analyze eumelanin and pheomelanin in various tissue samples: Application to chemical analysis of human hair melanins. Pigment Cell Melanoma Res. 2011, 24, 605–613. [Google Scholar] [CrossRef] [PubMed]
- Del Bino, S.; Ito, S.; Sok, J.; Nakanishi, Y.; Bastien, P.; Wakamatsu, K.; Bernerd, F. Chemical analysis of constitutive pigmentation of human epidermis reveals constant eumelanin to pheomelanin ratio. Pigment Cell Melanoma Res. 2015, 28, 707–717. [Google Scholar] [CrossRef] [PubMed]
- Ito, S.; Fujita, K. Microanalysis of eumelanin and pheomelanin in hair and melanomas by chemical degradation and liquid chromatography. Anal. Biochem. 1985, 881, 527–536. [Google Scholar] [CrossRef]
- Ito, S. Reexamination of the structure of eumelanin. Biochim. Biophys. Acta 1986, 883, 155–161. [Google Scholar] [CrossRef]
- Wakamatsu, K.; Ito, S.; Rees, J.L. The usefulness of 4-amino-3-hydroxyphenylalanine as a specific marker of pheomelanin. Pigment Cell Res. 2002, 15, 225–232. [Google Scholar] [CrossRef] [PubMed]
- Wakamatsu, K.; Ohtara, K.; Ito, S. Chemical analysis of late stages of pheomelanogenesis: Conversion of dihydrobenzothiazine to a benzothiazole structure. Pigment Cell Melanoma Res. 2009, 22, 474–486. [Google Scholar] [CrossRef]
- Ito, S.; Wakamatsu, K.; Glass, K.; Simon, J.D. High-performance liquid chromatography estimation of cross-linking of dihydroxyindole moiety in eumelanin. Anal. Biochem. 2013, 434, 221–225. [Google Scholar] [CrossRef] [PubMed]
- Glass, K.; Ito, S.; Wilby, P.R.; Sota, T.; Nakamura, A.; Bowers, C.R.; Vinther, J.V.; Dutta, S.; Summons, R.; Briggs, D.E.G.; et al. Direct chemical evidence for eumelanin pigment from the Jurassic period. Proc. Natl. Acad. Sci. USA 2012, 109, 10218–10223. [Google Scholar] [CrossRef] [Green Version]
- Rossei, V.; McNamara, M.E.; Webb, S.; Ito, S.; Wakamatsu, K. Melanosome geometry and trace element chemistry reveal soft tissue anatomy in fossil vertebrates. Proc. Natl. Acad. Sci. USA 2019, 116, 17880–17889. [Google Scholar] [CrossRef] [Green Version]
- Lindgren, J.; Nilsson, D.E.; Sjövall, P.; Jarenmark, M.; Ito, S.; Wakamatsu, K.; Schultz, B.P.; Sylvestersen, R.L.; Madsen, H.; LaFountain, J.R., Jr.; et al. Fossil insect eyes shed light on the arthropod pigment screen and trilobite optics. Nature 2019, 573, 122–125. [Google Scholar] [CrossRef] [PubMed]
- Tavazzi, B.; Lazzarino, G.; Leone, P.; Amorini, A.M.; Bellna, F.; Janson, C.G.; Di Pietro, V.; Ceccarelli, L.; Donzelli, S.; Francis, J.S.; et al. Simultaneous high performance liquid chromatographic separation of purines, pyrimidines, N-acetylated amino acids, and dicarboxylic acids for the chemical diagnosis of inborn errors of metabolism. Clin. Biochem. 2005, 38, 997–1008. [Google Scholar] [CrossRef]
- Nuta, K.; Okumura, H.; Hatani, A.; Torii, K.; Wakamatsu, K.; Ito, S. Analysis of eumelanin and pheomelanin by ion-pair high performance liquid chromatography. J. Soc. Cosmet. Chem. Jpn. 2013, 47, 221–225. (In Japanese) [Google Scholar] [CrossRef] [Green Version]
- Matsunaka, H.; Yamamoto, Y.; Furukawa, F. Non-invasive quantification of melanin in the stratum corneum: A novel indicator of skin lesions in pigmentation diseases. Skin Res. Tech. 2017, 23, 104–111. [Google Scholar] [CrossRef] [Green Version]
- Rioux, B.; Rouanet, J.; Akil, H.; Besse, S.; Debiton, E.; Bouchon, B.; Degoul, F.; Quintana, M. Determination of eumelanin and pheomelanin in melanomas using solid-phase extraction and high performance liquid chromatography-diode array detection (HPLC-DAD) analysis. J. Chromatogr. B Anal. Technol. Biomed. Life Sci. 2019, 1113, 60–68. [Google Scholar] [CrossRef]
- Ito, S.; Miyake, S.; Maruyama, S.; Suzuki, I.; Commo, S.; Nakanishi, Y.; Wakamatsu, K. Acid hydrolysis reveals a low but constant level of pheomelanin in human black to brown hair. Pigment Cell Melanoma Res. 2018, 31, 393–403. [Google Scholar] [CrossRef]
- Hirobe, T. How are proliferation and differentiation of melanocytes regulated? Pigment Cell Melanoma Res. 2011, 24, 462–478. [Google Scholar] [CrossRef]
- Del Bino, S.; Sok, J.; Bessac, E.; Bernard, F. Relationship between skin response to ultraviolet exposure and skin color type. Pigment Cell Res. 2006, 19, 606–614. [Google Scholar] [CrossRef]
- Ly, B.C.K.; Dyer, E.B.; Feig, J.L.; Chien, A.L.; Del Bino, S. Research techniques made simple: Cutaneous colorimetry: A reliable technique for objective skin color measurement. J. Investig. Dermatol. 2020, 140, 3–12. [Google Scholar] [CrossRef] [PubMed] [Green Version]
- Ozeki, H.; Ito, S.; Wakamatsu, K.; Thody, A.J. Spectrophotometric characterization of eumelanin and pheomelanin in hair. Pigment Cell Res. 1996, 9, 315–320. [Google Scholar] [CrossRef] [PubMed]
- Affenzeller, S.; Frauendorf, H.; Licha, T.; Jackson, D.J.; Wolkenstein, K. Quantitation of eumelanin and pheomelanin markers in diverse biological samples by HPLC-UV-MS following solid-phase extraction. PLoS ONE 2019, 14, e0223552. [Google Scholar] [CrossRef] [PubMed]
- Lerche, C.M.; Olsen, P.; Nissen, C.V.; Philipsen, P.A.; Wulf, H.C. A novel LC-MS/MS method to quantify eumelanin and pheomelanin and their relation to UVR sensitivity-A study on human skin biopsies. Pigment Cell Melanoma Res. 2019, 32, 809–816. [Google Scholar] [CrossRef]


| Marker | Linearity Range (ng/mL) | Regression Equation | Correlation (R2) | LOD (ng/mL) | LOQ (ng/mL) |
|---|---|---|---|---|---|
| PTCA | 12.5–1000 | y = 15.29x + 0.9 | 1.0000 | 11.1 | 33.7 |
| PDCA | 12.5–1000 | y = 15.76x + 8.1 | 1.0000 | 12.3 | 37.2 |
| TTCA | 12.5–1000 | y = 4.06x + 13.1 | 1.0000 | 5.17 | 15.7 |
| TDCA | 12.5–1000 | y = 6.28x + 8.7 | 1.0000 | 11.5 | 34.7 |
| PTeCA | 25–2000 | y = 6.85x − 5.2 | 0.9997 | 45.7 | 139 |
| Hair | PTCA | PDCA | PTeCA | TTCA | TDCA |
|---|---|---|---|---|---|
| Black | 205 ± 4.4 (2.1%) | 19.2 ± 0.60 (3.2%) | 82.0 ± 3.6 (4.4%) | 43.4 ± 0.94 (2.2%) | 19.4 ± 1.9 (9.7%) |
| Red | 23.4 ± 1.2 (5.2%) | 10.7 ± 0.52 (4.8%) | 12.9 ± 1.6 (12.4%) | 169 ± 6.7 (4.0%) | 26.7 ± 0.86 (3.2%) |
| Hair | PTCA | PDCA | PTeCA | TTCA | TDCA |
|---|---|---|---|---|---|
| Red | 103.0 ± 2.5% | 106.8 ± 1.6% | 95.6 ± 7.6% | 89.6 ± 4.5% | 96.3 ± 4.7% |
© 2020 by the authors. Licensee MDPI, Basel, Switzerland. This article is an open access article distributed under the terms and conditions of the Creative Commons Attribution (CC BY) license (http://creativecommons.org/licenses/by/4.0/).
Share and Cite
Ito, S.; Del Bino, S.; Hirobe, T.; Wakamatsu, K. Improved HPLC Conditions to Determine Eumelanin and Pheomelanin Contents in Biological Samples Using an Ion Pair Reagent. Int. J. Mol. Sci. 2020, 21, 5134. https://doi.org/10.3390/ijms21145134
Ito S, Del Bino S, Hirobe T, Wakamatsu K. Improved HPLC Conditions to Determine Eumelanin and Pheomelanin Contents in Biological Samples Using an Ion Pair Reagent. International Journal of Molecular Sciences. 2020; 21(14):5134. https://doi.org/10.3390/ijms21145134
Chicago/Turabian StyleIto, Shosuke, Sandra Del Bino, Tomohisa Hirobe, and Kazumasa Wakamatsu. 2020. "Improved HPLC Conditions to Determine Eumelanin and Pheomelanin Contents in Biological Samples Using an Ion Pair Reagent" International Journal of Molecular Sciences 21, no. 14: 5134. https://doi.org/10.3390/ijms21145134