Article

DNA Methylome Distinguishes Head and Neck Cancer from Potentially Malignant Oral Lesions and Healthy Oral Mucosa

1
Division of Molecular Medicine, Ruđer Bošković Institute, 10000 Zagreb, Croatia
2
Department of Maxillofacial Surgery, School of Medicine, Clinical Hospital Dubrava, University of Zagreb, 10000 Zagreb, Croatia
3
Department of Oral Medicine, School of Dental Medicine, University of Zagreb, 10000 Zagreb, Croatia
4
ARGO Open Lab Platform for Genome sequencing, AREA Science Park, Padriciano, 99, 34149 Trieste, Italy
*
Authors to whom correspondence should be addressed.
Int. J. Mol. Sci. 2020, 21(18), 6853; https://doi.org/10.3390/ijms21186853
Submission received: 7 July 2020 / Revised: 14 September 2020 / Accepted: 15 September 2020 / Published: 18 September 2020

Abstract

:
There is a strong need to find new, good biomarkers of head and neck squamous cell carcinoma (HNSCC) because of the bad prognoses and high mortality rates. The aim of this study was to identify the potential biomarkers in HNSCC that have differences in their DNA methylome and potentially premalignant oral lesions, in comparison to healthy oral mucosa. In this study, 32 oral samples were tested: nine healthy oral mucosae, 13 HNSCC, and 10 oral lesions for DNA methylation by the Infinium MethylationEPIC BeadChip. Our findings showed that a panel of genes significantly hypermethylated in their promoters or specific sites in HNSCC samples in comparison to healthy oral samples, which are mainly oncogenes, receptor, and transcription factor genes, or genes included in cell cycle, transformation, apoptosis, and autophagy. A group of hypomethylated genes in HNSCC, in comparison to healthy oral mucosa, are mainly involved in the host immune response and transcriptional regulation. The results also showed significant differences in gene methylation between HNSCC and potentially premalignant oral lesions, as well as differently methylated genes that discriminate between oral lesions and healthy mucosa. The given methylation panels point to novel potential biomarkers for early diagnostics of HNSCC, as well as potentially premalignant oral lesions.

1. Introduction

Head and neck squamous cell carcinoma (HNSCC), which encompasses tumors of the oral and nasal cavities, paranasal sinuses, pharynx, and larynx, is the 6th most frequent malignancy in the world, with over 650,000 new cases diagnosed each year [1]. Although the overall survival of patients with oral cancer has improved during the past 20 years, it has only improved marginally; mainly due to the advanced clinical stage at diagnosis and the high rates of treatment failure associated with this advanced disease [2].
The most important risk factors identified so far for HNSCC are excessive tobacco [3,4] and alcohol consumption [5,6,7], together with high-risk types of human papillomavirus (HPV) [8,9,10]. Although the global incidence of HNSCC is declining, the incidence of HPV related HNSCC, especially oropharyngeal and oral squamous cell carcinoma (OPSCC and OSCC, respectively) is rapidly increasing over the last few decades [11]. Recent findings emphasize the importance of epigenetic changes, such as DNA methylation and alterations including micro RNAs (miRNA), in HNSCC progression and implicate the very role of tobacco and alcohol [12], as well as HPV [13] in those changes.
The HNSCCs are one of the cancer types with the worst prognosis and with a high mortality of patients, hence, there is a strong need to find new biomarkers of this disease [14,15]. The most appropriate biomarkers would be those pointing out changes on the cellular level before carcinoma can be detected or even before carcinoma occurrence. The epigenetic biomarkers, such as methylated genes could efficiently point to changes before cancers can be clinically detected and help us better understand tumorigenesis and hopefully improve cancer treatment and prevention [16,17]. Some of these potential biomarkers could also differentiate between the groups of potentially premalignant oral lesions that show possible premalignant transformation, such as oral lichen planus (OLP) and oral lichenoid lesions (OLL), whose treatment is different from each other despite their high clinical and histopathological similarities [18,19,20]. Namely, OLP is a chronic immunological mucocutaneous disorder of unknown etiology, while OLL is usually of known etiology, being a lichenoid contact stomatitis [21].
DNA methylation is the most studied epigenetic change in human diseases, especially cancer because it is apparently stable under most storage conditions, even as histological preparations [22]. Altered DNA methylation is one of the possible factors associated even with the HNSCC development. The focus of this study was to explore DNA methylation changes that are significantly deregulated in HNSCC samples, particularly OPSCC and OSCC, and potentially premalignant oral lesions (such as OLP and OLL) in comparison to healthy oral mucosa. Identifying DNA methylome differences by means of the Infinium MethylationEPIC BeadChip array (Illumina, San Diego, California, United States) on the level of methylated genes, gene promoters, and individual 5′-cytosine-phosphate-guanine-3′ (CpG) sites between HNSCC, potentially premalignant oral lesions, and healthy oral mucosa enables us to suggest novel potential biomarkers for the identification of HNSCC and potentially premalignant oral lesions.

2. Results

2.1. HPV Status

HPV DNA was found in nine of 32 samples, of which are five cancer samples, three potentially premalignant oral lesions samples, and one control sample (healthy mucosa) (Figure S1). HPV 16 was found in all five HPV positive cancer samples. HPV 58 was found in one OLP sample positive, while undetermined HPV types were found in one OLP, one OLL, and one control sample.

2.2. Overall DNA Methylation Findings

After pre-processing, normalization, and batch correction of Infinium MethylationEPIC BeadChip data in ChAMP, 679,851 probes were retained for analysis by the RnBeads package. The inclusion criteria was the value of the mean difference across all sites in a region (mean.mean.diff; MMD), the highest and the lowest values from the Illumina assay data. The cut-off values were: FDR adjusted p-value ≤ 0.05 and mean methylation difference ≥ |0.2|. For every set of data, the list of first 15 genes, the best significantly differentiated between groups of samples in methylation, i.e., hyper- or hypomethylated, is presented (the mean methylation difference was ≥ |0.44|). The whole list of genes, besides a large number of defined genes includes not annotated (NA) genes, pseudogenes, and RNA genes (could be provided upon request).
Within the exploratory analysis, the principal component analysis (PCA) showed that all samples clustered within three distinct clusters: Cancer, lesions, and controls (Figure 1). One healthy oral mucosa sample of 32 oral samples analyzed by the Infinium MethylationEPIC BeadChip was automatically excluded during filtering and normalization steps (Figure 1, Figure 2 and Figure 3, and Figure S1).
The unsupervised hierarchical clustering analysis based on all investigated methylation sites across the genome and all methylation values showed good clustering of cancer samples on one side, however control samples and potentially premalignant oral lesions were clustered together on the other side (Figure 2A). The situation was similar when visualizing only the top 1000 most variable positions (Figure 2B). As expected, global cancer hypomethylation can be seen in both figures as more CpG sites exhibit lower methylation values in cancer cluster. The heatmap representation of samples clustering for the top fifteen hypermethylated and the top fifteen hypomethylated CpG gene sites in cancer tissue compared to control healthy tissue also showed good clustering of cancer samples on one side and control samples on the other, while most of the potentially premalignant oral lesions were clustered between those two groups (Figure 3).

2.3. Differentially Methylated Gene Promoters in HNSCC Tissue Compared to Control Tissue

The top fifteen genes significantly hypermethylated in their promoters in cancer tissues in comparison to healthy tissues are: GPRC5D, TMPRSS11B, PIAS2, ARG1, SRPK2, AADACL2, RGPD4, SPRR3, DEGS1, TXNDC8, SH3TC1, ZPLD1, FBXO2, ATG16L1, and GRHL1 (Table 1). The FDR adjusted p-value was < 0.05 and the difference in the average methylation value between 0.78 and 0.44. The hypermethylated genes are mostly involved in different cellular enzymatic reactions and autophagy.
The top fifteen genes that were significantly hypomethylated in their promoters in cancer tissues in comparison to healthy tissues are: TRBC2, DGAT2, ALG1L, PDE4D, TRDC, DNAJC6, IGKV3-20, TMEM150B, LAIR2, UBQLN3, ANKFN1, MS4A1, CCT8L2, SPOCK1, and IGHV4-39 (Table 2). The FDR adjusted p-value was < 0.05 and the difference in the average methylation value between −0.80 and −0.61. The hypomethylated genes are mainly involved in the immune response.

2.4. Differentially Methylated CPG Sites in HNSCC Tissue Compared to Control Tissue

From the complete list of differentially methylated CpG sites, only those falling within or near defined genes were selected, while all other sites for which the biologic relevance could not be evaluated were excluded (Figure 3). Thus, the top fifteen significantly hypermethylated sites in cancer tissues in comparison to healthy tissues are: LMBR1L, CDH1, EIF6, C16orf70, ETNK2, C11orf73, ADARB2, GAB1, ITPR3, WDR61, PGAP2, DDX10, DGKH, RAB40C, and BEAN1 genes (Table 3). The FDR adjusted p-value was < 0.05 and the difference between mean methylation values across sites between 0.93 and 0.89. The hypermethylated genes are mostly involved in translation processes and cellular growth, transformation, and proliferation.
The top fifteen genes significantly hypomethylated on different sites across the genome (5′UTR, 3′UTR, TSS1500, TSS200, 1st exon, exon body) in cancer tissues in comparison to healthy tissues are: ATXN1, PPP2R2C, CCR6, RAB37, DUSP27, ZNF521, SLC6A17, SPIN1, CXCR1, SPTBN1, NBAS, NRG3, COL5A1, CDX1, and BATF3 (Table 4). The FDR adjusted p-value was < 0.05 and the difference between mean methylation values across sites between −0.96 and −0.89. The hypomethylated genes are mostly involved in transcriptional and immune regulation.

2.5. Aberrant Methylation in Potentially Premalignant Oral Lesions

The aberrant methylation in gene promoters and CpG sites within defined genes in HNSCC tissue compared to potentially premalignant oral lesions, OLP and OLL, and in oral lesions compared to healthy tissue are shown in Table 1, Table 2, Table 3, and Table 4, respectively.
The top fifteen genes significantly hypermethylated in their promoters that could distinguish HNSCC from potentially premalignant oral lesions are: RAD51B, BARX2, SLC5A10/FAM83G, NINL, NSMCE2, PGAP2, INO80C, IL34, ZNF516, GFOD2, PARD3, MCEE, POLM, ASPG, and TBC1D2 (Table 1). The top fifteen genes significantly hypomethylated in their promoters in HNSCC compared to potentially premalignant oral lesions are: ART4, EPB41L3, ESRRG, ENPP1, GNG7, PAPSS2, NGEF, HIPK4, GPR158, GSG1L, SMPD3, GDF2, RERE, CDH13, and HS3ST4 (Table 2).
The top fifteen genes significantly hypermethylated (SLC5A10, TBC1D2, SH3BP5L, VANGL1, DLEC1, TGOLN2, CTBP2, PPP1CB, VPS52, MEPCE, HDAC4, ARAP1, TCF20, NDUFS7, and GATAD2A) and the top fifteen genes significantly hypomethylated in their promoters (ART4, ENPP1, GNG7, PKD1L3, PLXNC1, CAMK2B, CACNA1S, SCGB1D1, VPS13D, DLGAP4, LRP1B, COL2A1, SLC24A3, TBC1D8, and ABCC8) that could distinguish potentially premalignant oral lesions from healthy oral mucosa are shown in Table 1 and Table 2. The top fifteen genes significantly hypermethylated (GRIP1, MTMR10, RBM47, MPHOSPH9, FOXK1, SNX3, CIT, ZBTB38, DRD3, SPPL3, ZNF407, ADAMTSL1, GNAT3, L3MBTL3, and EEPD1) and the top fifteen genes significantly hypomethylated (PHACTR1, MARCH8, PPP1R1B, HDAC4, IL22RA2, CAMKK2, INPP5D, CSGALNACT1, GTDC1, IGSF3, HELZ, DEFA4, AK5, LHFPL2, and STK10) on different sites across the genome in potentially premalignant oral lesions in comparison to healthy oral mucosa are shown in Table 3 and Table 4.

2.6. Validation Panel

Pyrosequencing was performed on a subset of samples tested by the Infinium MethylationEPIC BeadChip array (Illumina) for four gene promoters, namely SPRR3, FBXO2 (hypermethylated in HNSCC tissue vs. control healthy tissue; Table 1), TRDC and LAIR2 (hypomethylated in HNSCC tissue vs. control healthy tissue; Table 2) tested on four cancer samples and four control samples, each. The selection criteria were the role of these genes in biological processes as well as the findings in previous studies. SPRR3 (Small Proline Rich Protein 3) and FBXO2 (F-Box Protein 2) being largely investigated; SPRR3 is involved in cornification, epidermis development, squamous cell differentiation, and peptide cross linking [23], while FBXO2 is involved in the negative regulation of cell proliferation, cellular protein modification, and protein ubiquitination [24]. In addition, the hypomethylated genes in cancer are mostly involved in the immune response; TRDC (T Cell Receptor Delta Constant) being involved in recognizing foreign antigens, which have been processed as small peptides and bound to major histocompatibility complex (MHC) molecules at the surface of antigen presenting cells [25]. LAIR-2 (Leukocyte Associated Immunoglobulin Like Receptor 2) related pathways belong to the innate immune system, and class I MHC mediated antigen processing, and presentation and immunoregulatory interactions [25].
For pyrosequencing validation, six amplifying PCR reactions (SPRR3-1, SPRR3-2, TRDC-1, TRDC-2, LAIR2-1, LAIR2-2, FBXO2-1) with six sequencing primers have been performed to cover four CpG sites for SPRR3, four CpGs for FBXO2, two CpGs for TRDC, and five CpGs for LAIR2 gene. The overall pyrosequencing data for tested CpGs were in agreement with the methylation array data (Figure S2). However, statistical significance was only reached between HNSCC and the control samples in CpG1 and CpG3 of SPRR3 gene (p = 0.01 in both cases) and CpG1 of FBXO2 gene (p = 0.01).

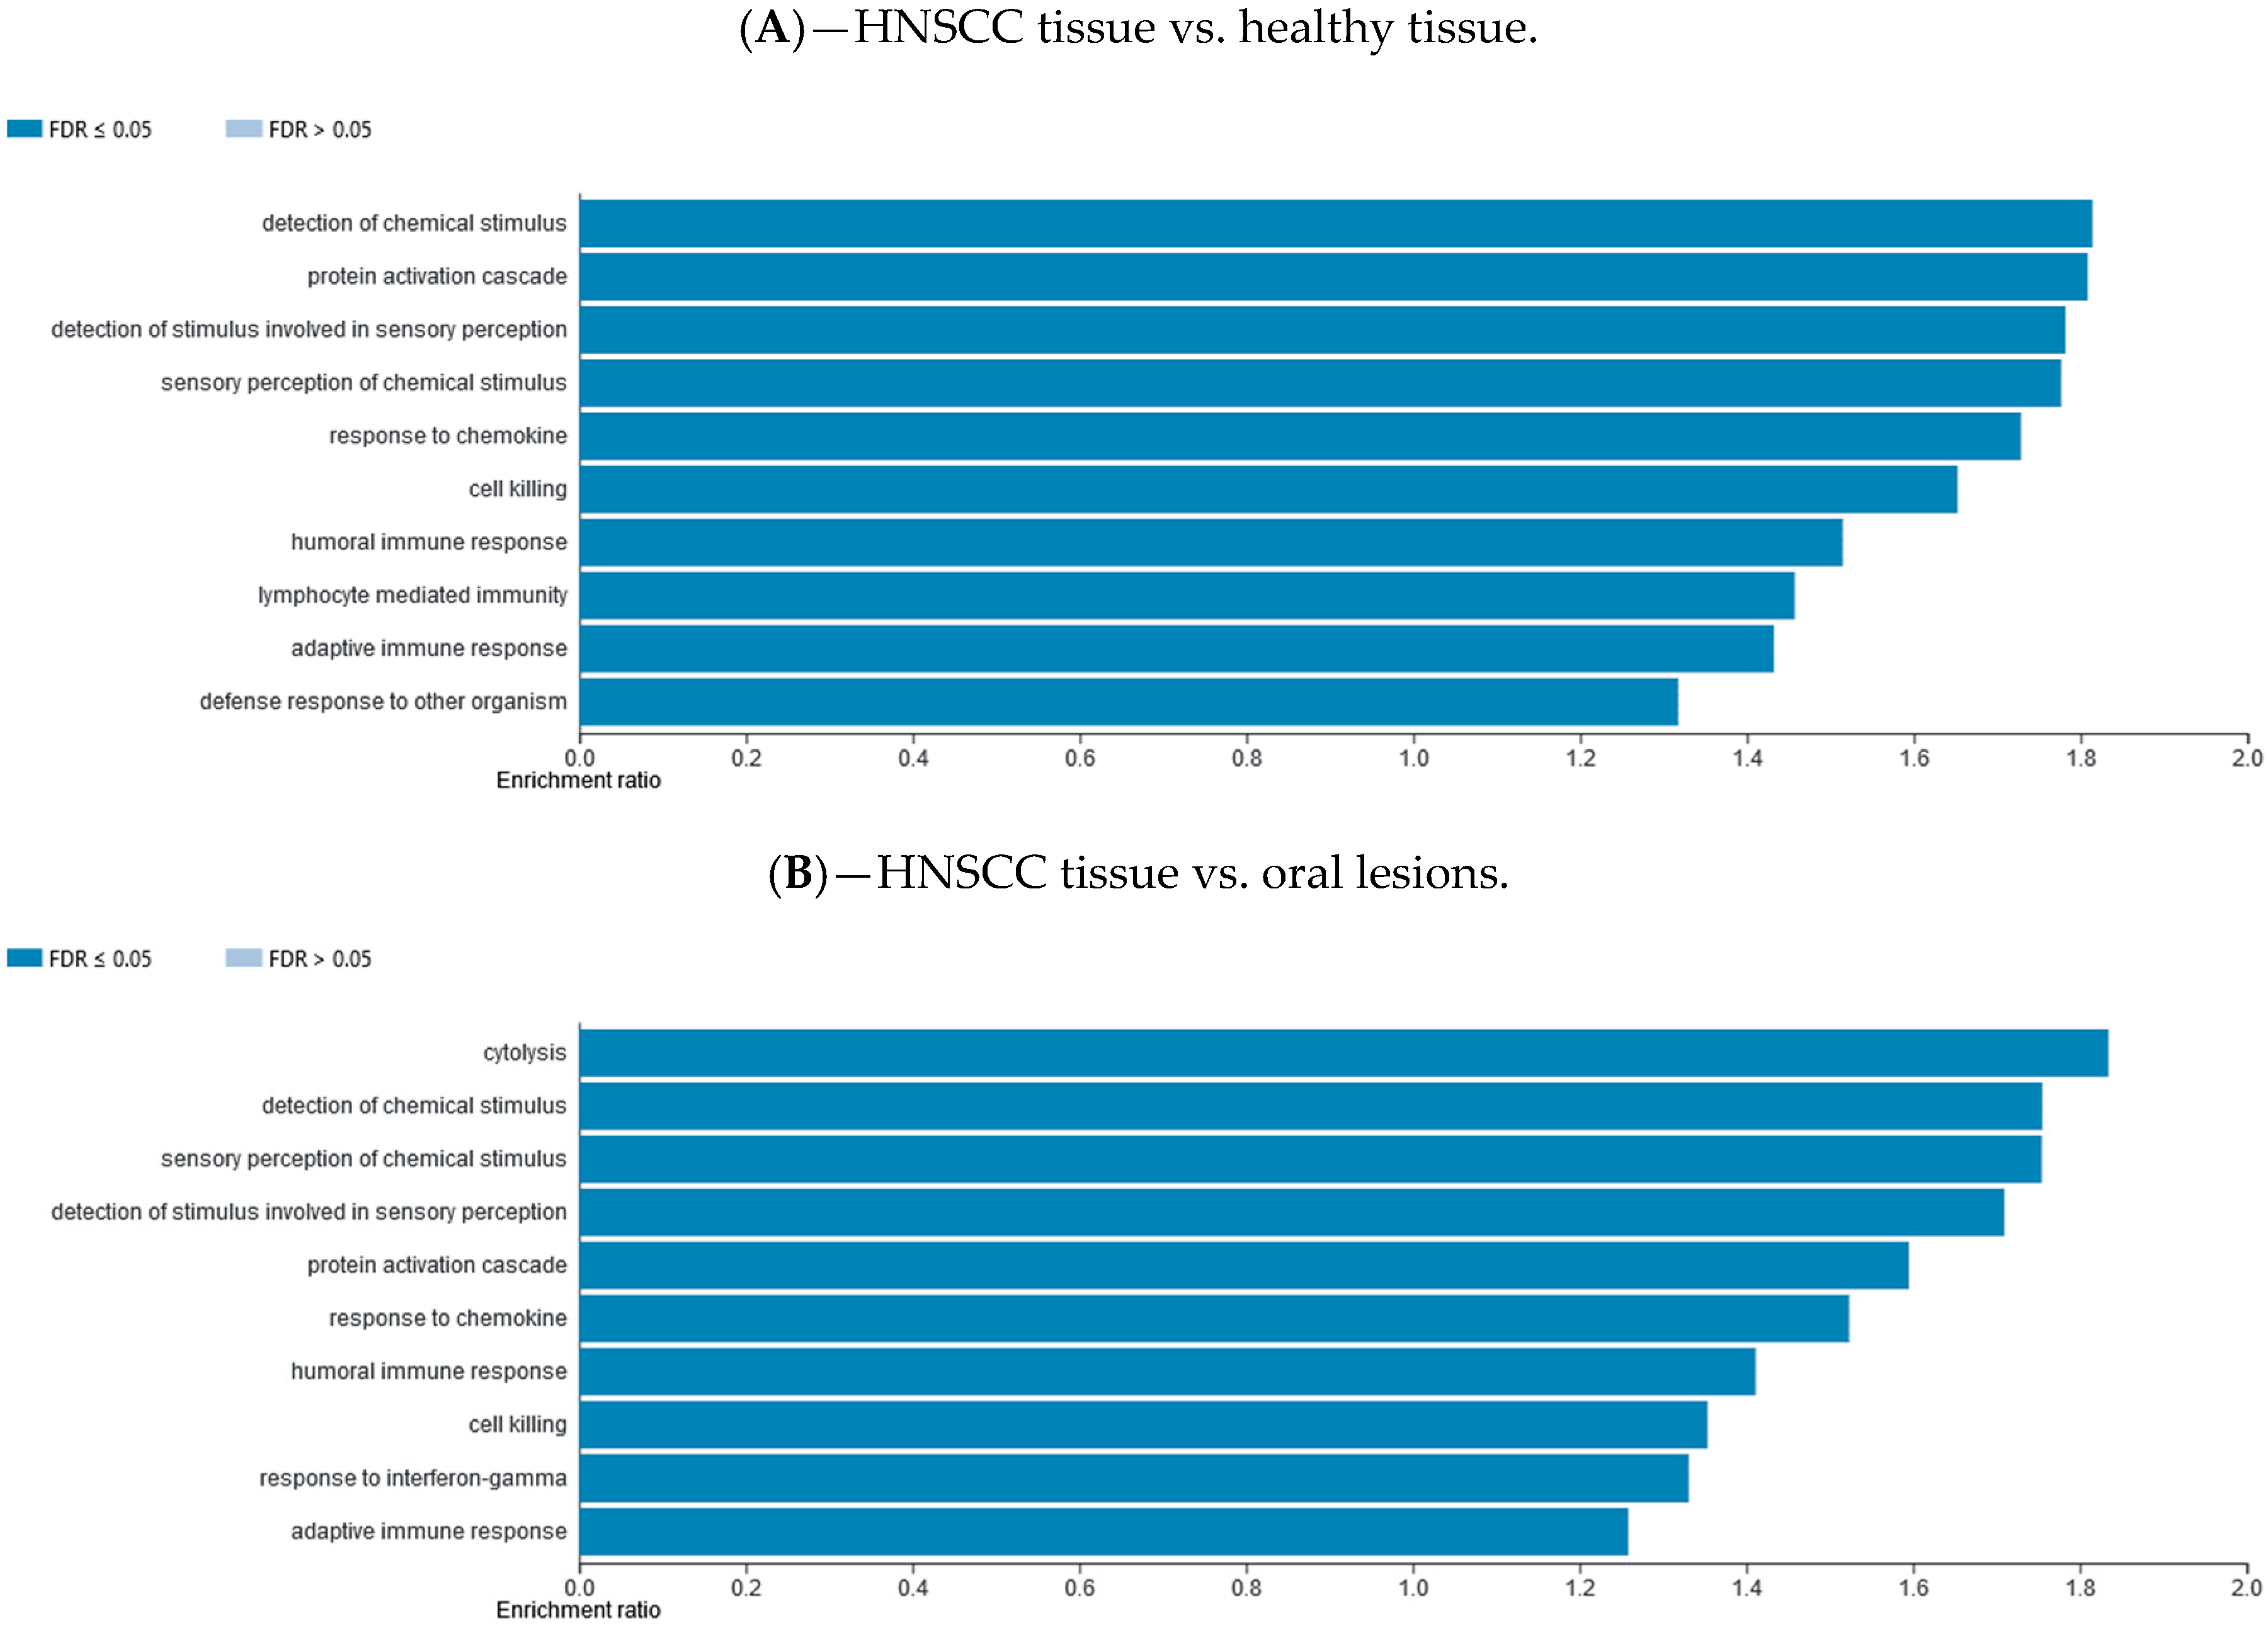
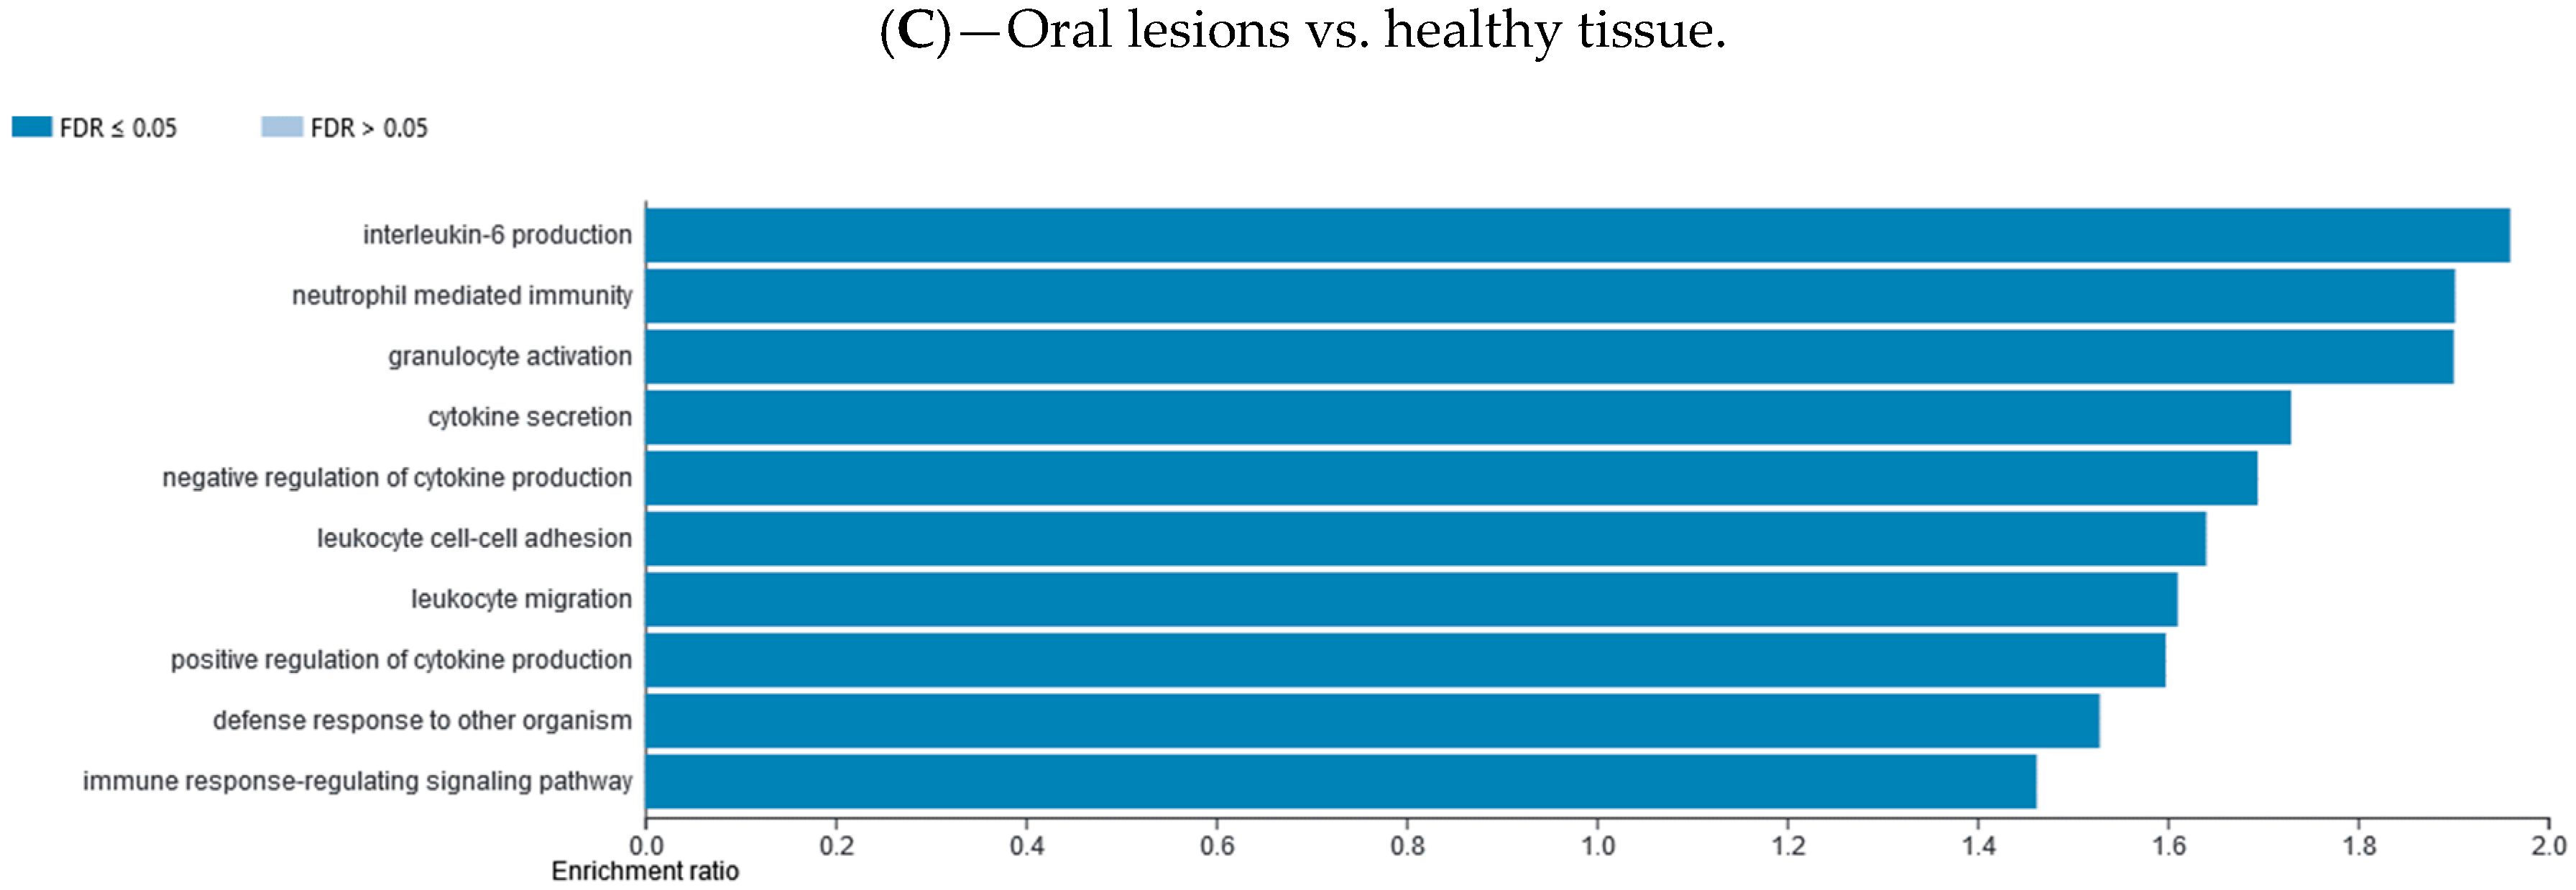
2.7. Gene Set Enrichment Data

Differentially methylated gene promotor regions were analyzed using the WebGestalt functional enrichment analysis web tool to determine whether the affected genes are enriched for specific sets of functions or pathways. Methylation data were explored with two different analysis approaches available, over-representation enrichment analysis (ORA) and gene set enrichment analysis (GSEA). The ORA of gene ontology (GO) data (biological processes) for consistently hypomethylated gene promoters and/or CpG sites in one group of samples vs. the other group are presented in Figure 4. The ORA of GO data (biological processes) for consistently hypermethylated gene promoters and/or CpG sites in one group of samples vs. the other group are presented in Supplementary Materials file (Figure S8). The top 10 GO categories are presented. The ORA analysis of KEGG pathway for hypomethylated and hypermethylated gene promoters and/or CpG sites in one group of samples vs. the other group are presented in Supplementary Materials file (Figures S7 and S9, respectively). The top 10 KEGG categories are presented. The GSEA analysis of GO biological processes for hypomethylated and hypermethylated gene promoters and/or CpG sites in one group of samples vs. the other group are presented in Supplementary Materials file (Figures S10 and S12, respectively). The GSEA analysis of KEGG pathway for hypomethylated and hypermethylated gene promoters and/or CpG sites in one group of samples vs. the other group are presented in Supplementary Materials file (Figures S11 and S13, respectively).

2.8. External Database Validation

Our gene promoters’ methylation findings were compared to TCGA Illumina HISeq RNAseq data of TCGA-HNSC project. The RNAseq estimation of expression for the top fifteen hypermethylated and top fifteen hypomethylated gene promoters in our results were visualized in Wanderer, an interactive viewer. The TCGA dataset included 497 tumor and 43 normal tissue samples. There was a good agreement between our gene promoters’ methylation data and the gene expression data (Table S1, Figures S3–S6). Out of the total of top fifteen hypermethylated gene promoters in our study, ten were found to be either under-expressed or hypermethylated in TCGA cancer cases, as expected, while one had no measurable expression and only a single CpG site in Illumina 450K DNA methylation array. From the top fifteen hypomethylated gene promoters in our study, twelve were also found to be either over-expressed or hypomethylated in TCGA data, with the remaining three lacking annotated data or probes in Illumina 450K DNA methylation array.

3. Discussion

The aim of this study was to investigate DNA methylome in HNSCC and potentially premalignant oral lesions, as well as in healthy oral tissue, and to identify the best genes that are differentially methylated in gene promoters or specific sites among those groups of samples. We found that components of different cellular pathways are differently methylated in HNSCC in comparison to healthy oral tissue as well as potentially premalignant oral lesions.
Surprisingly, we could not observe any grouping of samples in accordance with their HPV status, thus subsequent analysis focused only on the sample origin. The lack of HPV specific differences could possibly be explained by a limited number of HPV positive samples (nine of 32). Furthermore, HPV is known to be more associated with oropharyngeal tumors than oral cavity cancerogenesis [26]. Another possible explanation is the particularity of the Croatian population where smoking and drinking are almost equally present in HPV positive and HPV negative OPSCC patients shown in our previous study [27]. On the other hand, the study of Lechner et al. with Infinium HumanMethylation450 BeadChips (Illumina) showed unsupervised clustering over the methylation variable positions of samples in accordance with the HPV status. Nevertheless, they showed that HPV positive tumors are heterogeneous, which led to the identification of a candidate CpG island methylator phenotype in a sub-group of HPV positive tumors [28].
Herein, the top fifteen genes with a significant promoter hypermethylation in cancer tissues in comparison to control healthy tissues, named GPRC5D, TMPRSS11B, PIAS2, ARG1, SRPK2, AADACL2, RGPD4, SPRR3, DEGS1, TXNDC8, SH3TC1, ZPLD1, FBXO2, ATG16L1, and GRHL1 are mostly involved in different cellular enzymatic reactions and in autophagy (Table 1). For example, the expression of SPRR3 (Small Proline Rich Protein 3) was found to be associated with tumor cell proliferation and invasion in glioblastoma multiforme. Liu et al. (2013) found, contrary to our findings, that SPRR3 hypomethylation was associated with the clinical outcome in glioblastoma multiforme patients [29]. In an anatomically more similar context, SPRR3 was frequently downregulated in OPSCC where it probably suppresses tumorigenicity [30]. In our study, we selected the promoter of the SPRR3 and FBXO2 genes for validation by pyrosequencing and found that both methods agree on the direction of methylation deregulation, which is hypermethylation of the gene promotor.
The top fifteen genes in cancer tissues that were found in this study to be significantly hypomethylated in their promoters in comparison to control healthy tissues (TRBC2, DGAT2, ALG1L, PDE4D, TRDC, DNAJC6, IGKV3-20, TMEM150B, LAIR2, UBQLN3, ANKFN1, MS4A1, CCT8L2, SPOCK1, and IGHV4-39) are mainly involved in the immune response, i.e., IGHV4-39 (antigen recognition gene), IGKV3-20 (immunoglobulin receptor binding gene), LAIR2 (innate immune response gene), MS4A1 (differentiation of B cells gene), TRBC2 and TRDC (both T cell receptor genes). Indeed, the HNSCC are known for their immune-suppressive character allowing tumor evasion and escape from the immune surveillance, which probably can be associated with the methylation of immune-response related genes [31]. Here again, from the list of genes with hypomethylated promoters we selected LAIR2 and TRDC for validation and, as expected, both gave comparable results on pyrosequencing.
The top fifteen significantly hypermethylated genes, named LMBR1L, CDH1, EIF6, C16orf70, ETNK2, C11orf73, ADARB2, GAB1, ITPR3, WDR61, PGAP2, DDX10, DGKH, RAB40C, and BEAN1 on different gene sites (mostly in 5′UTR and body) in cancer tissues in comparison to control healthy oral tissues are mostly involved in translational processes and cellular growth, along with transformation and proliferation. Among them, CDH1, ETNK2, ADARB2, and RAB40C are found to be aberrantly methylated in different cancers [32,33,34,35]. For instance, altered methylation levels of CDH1 (Cadherin 1), whose loss contributes to cancer progression by increasing proliferation, invasion, and/or metastasis are recorded in oral cavity [32], oral [36], and in cervical cancer [37]. The study of Strzelczyk et al. [32] reported a significantly higher methylation level of CDH1 in tumor tissues compared to surgical margins (57% vs. 25% p < 0.001) in patients with oral cavity cancer. The meta-analysis of the gene promoter hypermethylation in oral cancer, that included 29 studies of which 13 were about CDH1 methylation, showed a significant correlation of CDH1 hypermethylation with oral cancer risk [36]. Moreover, in the meta-analysis of Liu et al. [37] on patients with cervical carcinoma, CDH1 promoter methylation was significantly higher in cancer than in cervical intraepithelial neoplasia lesions and healthy cervical tissues.
The first fifteen genes that were significantly hypomethylated on different sites across the genome in cancer tissues in comparison to control healthy tissues, named ATXN1, PPP2R2C, CCR6, RAB37, DUSP27, ZNF521, SLC6A17, SPIN1, CXCR1, SPTBN1, NBAS, NRG3, COL5A1, CDX1, and BATF3 are mostly involved in transcriptional and immune regulation. Among this group of genes, aberrantly methylated in other human cancers were CCR6 in oral cancer [38] and chronic lymphocytic leukemia [39], RAB37 in lung cancer [40], ZNF521 in breast cancer [41], and CDX1 in gastric cancer [42], esophageal SCC [43], and in colon cancer [44]. The genes involved in the immune regulation could belong to the tumor-infiltrating immune cells or tumor-infiltrating lymphocytes, which are often associated with better clinical outcomes. Thus, the aberrantly methylated gene CCR6 (C-C Motif Chemokine Receptor 6), which regulates the migration and recruitment of dendritic and T cells during inflammatory and immunological responses, was also found in human OSCC [38]. Lee et al. [38] concluded that hypomethylation of this gene may play an important role in the recruitment or retention of CCR6+ Treg cells into the OSCC inflammatory microenvironment at the early stage of tumor progression. In addition, a genome-wide DNA methylation analysis of chronic lymphocytic leukemia patients in comparison to healthy donors identified the differently methylated CCR6 gene, among other immune regulatory genes [39]. In addition, in their study, Kim et al. presented that the majority of hypomethylated gene sets identified across multiple cancer (breast, lung cancer, colorectal, myeloma, glioblastoma, ovarian, kidney and stomach cancer) studies were immune-related, suggesting DNA methylation-driven cancer cell invasion and tumorigenesis across various types of cancer [45].
The external validation of our top thirty differentially methylated gene promoters in HNSCC vs. control tissue with gene expression data in human cancer through Wanderer, an interactive viewer, gave a very good agreement. In summary, the majority of hypermethylated gene promoters in HNSCC in our study (10 of 15) were found to be either under-expressed or hypermethylated in TCGA cancer cases. In addition, from the top 15 hypomethlylated gene promoters in our study, 12 were also found to be either over-expressed or hypomethylated in TCGA data.
Of particular interest in the HNSCC diagnostic, clinical prognosis and/or risk assessment could be the methylation of CDH1, which was also previously described as a possible biomarker for the early detection and treatment of HNSCC [32,36,46,47]. We also validated the CDH1 gene promoter in the same groups of cancer samples and healthy controls by Methylation-Specific PCR (MSP), and the findings are in concordance with the Infinium MethylationEPIC BeadChip array findings (data not presented). The majority of HNSCC samples (85%) were methylated in the CDH1 gene promoter by MSP, while only 21% of healthy control samples were methylated in the same gene promoter. In this study, we found the CDH1 gene to be significantly hypermethylated on specific sites in the genome (body) on a high second place in cancer tissues in comparison to control tissues. The same gene (CDH1) is also among the top fifteen genes that are significantly hypermethylated on different sites across the genome in cancer tissues compared to lesions. The CDH1 gene encodes E-cadherin, a classical cadherin of the cadherin superfamily that is involved in mechanisms regulating cell-cell adhesions, mobility, and proliferation of epithelial cells. It is recognized as a tumor suppressor gene; the loss of function of this gene is thought to contribute to cancer progression by increasing proliferation, invasion, and/or metastasis [25]. Hence, we showed herein that hypermethylation on specific CpGs within the CDH1 gene could be a good biomarker of HNC and a possible option to distinguish HNSCC from potentially premalignant oral lesions and from healthy oral mucosa as well.
Two other genes that are present in the top fifteen most significantly hypermethylated in gene promoter regions in cancer tissues compared to lesions, and in lesions compared to control healthy tissues are the SLC5A10 (Solute Carrier Family 5 Member 10) and the TBC1D2 (TBC1 Domain Family Member 2) gene. The SLC5A10 gene is a member of the sodium/glucose transporter family, while the TBC1D2 gene acts as GTPase-activating protein for RAB7A, involved in cadherin degradation and cell-cell adhesion. Notably, two out of the three genes, whose hypermethylation may be of particular importance in HNSCC diagnostic, CDH1 and TBC1D2, are involved in cadherin regulation of cell-cell adhesion. Suppression of cadherins in HNSCC leads to cells escaping from the contact-dependent growth, which develop a migratory phenotype with low differentiation stage, suggesting that cadherins contribute to the transformation steps [48]. The two genes from the group, SLC5A10 and TBC1D2, could also be considered as possible good methylation biomarkers to distinguish oral potentially premalignant lesions from healthy oral tissue.
Unexpectedly, the overlap of significant findings on the CpG site and gene promoter levels in the whole study was non-existent, probably because most of the top-rated promoters included only one or rarely few sites in the analysis. Further, there is no evidence in the literature on this issue to conform or refute these observations.
Using the WebGestalt functional enrichment analysis web tool we assessed gene enrichment for specific sets of functions or pathways and networking. Indeed, the over-representation enrichment analysis (ORA) of GO non-redundant biological processes for differentially methylated gene promoters presented an implication of mostly immune response and cellular defense response pathways, as well as cell-cell adhesion.
The current study is the first to implement the Infinium MethylationEPIC BeadChip assay on a well-defined set of clinical samples encompassing the whole possible spectrum from healthy tissue to cancer. To our knowledge, this is the first such study focused on HNSCC, oral lesions, and healthy tissue together. In addition, the power of the study relies on prospectively collected fresh samples with minimum delays between sample collection and processing. However, for that reason the limitation of the study might be the possibility that infiltrating immune cells could be present in tumor tissues. Indeed, we performed the analysis of tumor purity by leukocytes unmethylation for the purity (LUMP) method [49] and assessed the variability of the tissue cellular composition (Figure S14): Different amounts of infiltrating immune cells for every group of samples, with a significantly lower proportion (p < 0.05) of the same in a healthy oral tissue (20%) than in HNSCC (56%) and lesions’ samples (65%). In addition, one of the strengths of this study was the simultaneous microarray testing in the same analysis of different tissues, cancer, oral lesions, and healthy tissue. On the other hand, the study was limited by anatomical differences in the sample material, namely both healthy and potentially premalignant oral lesions samples were mostly derived from the oral cavity, where potentially premalignant oral lesions usually originate, while cancer samples included both oral, and oropharyngeal cancer. Another possible limitation was the age of participants as cancer usually develops later in life, while the average age of controls and patients with potentially premalignant oral lesions was lower (43 vs. 53 years). We attempted to adjust for this by including age as a covariate. For the future study, we plan to collect also the healthy oral mucosa from the same patient to investigate possible differences. Overall, our study has demonstrated a significant overlap with current knowledge, which together with successful validation of the data by pyrosequencing confirms the reliability of the underlying data and strengthens its results.

4. Materials and Methods

4.1. Study Group

Healthy oral mucosa samples were collected from healthy subjects in the School of Dental Medicine, University of Zagreb, Croatia, during a regular process of teeth extraction from 2010 to 2017. Oral samples of potentially premalignant oral lesions, OLP and OLL, were taken cytologically in the School of Dental Medicine, University of Zagreb, Croatia, from 2008 to 2016. HNSCC samples were collected in the Clinical Hospital Dubrava, Zagreb, Croatia, from 2014 to 2018. The study group comprised 32 oral samples: nine healthy oral mucosa, 10 potentially premalignant oral lesions (eight OLP and two OLL), and 13 HNSCC (six oropharyngeal cancers and seven oral cancers). The median age among patients with HNSCC was 57 years, while amongst patients with potentially premalignant oral lesions and control healthy mucosa was slightly lower, 43 and 53 years, respectively. There were 10 men and three women with HNSCC, four men and six women with potentially premalignant oral lesions, and four men and five women with healthy oral mucosa and without drinking and smoking history. Fresh samples were collected with the cytobrush, stored in appropriate buffers for further analysis, HPV testing, and DNA methylation analysis.

4.2. DNA Preparation

The extracted DNA from oral specimens was processed without initial knowledge of patients’ data. DNA was isolated using the BioRobot EZ1 (Qiagen, Hilden, Germany) system according to the manufacturer’s instructions. After DNA extraction, the purified DNA was dissolved in 50–100 μL of tri-distillate sterile water and stored at −20 °C until further analysis. The quality and integrity of the samples were evaluated on a NanoPhotometer (Implen GmbH, München, Germany), and samples with the ratio A260/280 between 1.7–1.9 were included in the study [50].

4.3. HPV Detection and Typing

HPV testing is previously described [51,52]. Briefly, three sets of consensus primers for HPV detection were used: PGMY09/PGMY11, L1C1/L1C2-1/L1C2-2, and GP5+/GP6+. The quality of the isolated DNA was confirmed by amplification of the β-globin gene using PC04/GH20 primers in a multiplex polymerase chain reaction (PCR) with PGMY primers. Type-specific (TS) primers for HPV types 6/11, 16, 18, 31, 33, 45, 52, and 58 were used for HPV typing according to Milutin-Gasperov et al. [51]. Aliquots of each PCR product (10 μL) were analyzed by a 2% agarose gel electrophoresis and stained with Midori Green Advance dye. The amplified products were visualized by UV irradiation of the gels using the UVItec Cambridge (Alliance 4.7) imaging system. HPV positive samples that were not positive for TS-PCR but positive for consensus primer amplification were defined as undetermined HPV type.

4.4. Methylation Array Analysis

The Infinium MethylationEPIC BeadChip array (Illumina), which integrates a total of 863,904 CpG loci, together with 2932 non-CpG loci and 59 single nucleotide polymorphisms (SNPs), superseded the HM450 array, while still containing more than 90% of the original HM450 probes. Additional probes included in the new version of the array greatly increased the power of this microarray to study enhancer/regulatory regions [53]. Briefly, approximately 1–2 µg of DNA from cancer and oral samples were modified with sodium bisulfite using the EZ DNA Methylation Kit (Zymo Research, Irvine, CA, USA) and then purified according to the manufacturer’s instructions. After bisulfite treatment, 180–200 ng DNA was subjected to the whole genome amplification (WGA) and enzymatic digestion with the Infinium MethylationEPIC BeadChip kit reagents. The hybridization of the samples on the BeadChips and washing procedures followed the standard manufacturer’s protocol. The iScan System (Illumina) was used to read the BeadChips.

4.5. Data Processing and Statistical Analysis

Raw data obtained by iScan readout was imported to and analyzed within R using ChAMP (version 2.9.10) [54] and RnBeads packages (version 1.10.7; integrated software package for the analysis and interpretation of DNA methylation data) [55]. Briefly, data were imported to the Chip Analysis Methylation Pipeline (ChAMP) pre-processed, and normalized with the Peak Based Correction (PBC) method [56]. Subsequently, the Combat method [57] within ChAMP was used to adjust for batch effects. The resulting normalized and batch-corrected rnb.set was imported to the RnBeads package for subsequent exploratory and differential methylation analysis and customized visualization. RnBeads uses the limma normalization method (linear models for microarray data) [58] for differential methylation assessment between pairs of groups and herein the calculations were performed while adjusting for patient age and gender as covariates. In addition to analyzing differential methylation between groups on the individual CpG site level, all analyses were performed on the predefined gene and promoter levels by selecting appropriate region.types options within the RnBeads package.

4.6. Differentially Methylated Gene Promoters and Individual CPG Sites

The resulting differentially methylated promoter or CpG site lists were further filtered by selecting only promoters or sites with false discovery rate (FDR) adjusted p-values ≤ 0.05 and mean methylation difference ≥ |0.2|. For the top 15 candidates presented in Table 1, Table 2, Table 3 and Table 4, a more stringent differential methylation value of ≥ |0.44| is presented (between cancer and control healthy tissues, cancer and potentially premalignant oral lesions, and potentially premalignant oral lesions and control healthy tissues). The filtered tables contain the information on chromosome locations, and relation to any nearby CpG islands. Promoter level data additionally contains information about the number of included CpG sites and average GC content for the region.

4.7. Validation of Methylation by Pyrosequencing

Pyrosequencing assays were developed for the following genes: SPRR3, FBXO2, TRDC, and LAIR2. The PCR and sequencing primers were designed using the PyroMark Assay Design software, version 2.0.1.15 (Qiagen) to assess individual CpG sites of depicted genes from the Infinium MethylationEPIC BeadChip array analysis. All primers were purchased from Macrogen (Macrogen, Seoul, South Korea). The primer sequences, amplicon sizes, and the optimal annealing temperatures are indicated in Table S1. The analysis was performed on four control healthy and four HNSCC tissues (two HPV positive and two HPV negative), which were already tested by the Infinium MethylationEPIC BeadChip array. Briefly, approximately 500 ng of extracted DNA was used for the bisulfite treatment performed with the EZ DNA Methylation Kit, according to the instructions by the manufacturer, and eluted in a 20 µL elution buffer (Zymo Research). The PCR reactions were performed according to the PyroMark PCR protocol (Qiagen) in a total volume of 30 µL. Briefly, 0.10 µmol/L of each primer, 1.5 mM MgCl2, PyroMark PCR Master mix (Qiagen), Coral Load (Qiagen), and 50 ng of bisulfite treated template DNA were added to the PCR reaction and performed in a thermocycler (Veriti, 96 Well Thermal Cycler, Applied Biosystems, Foster City, California, USA). The program was as follows: Initial denaturation of 1 min at 95 °C, followed by 45 cycles of 30 s denaturation at 95 °C, specific annealing temperature for each primer pair (Table S1) for 30 s, and extension for 30 s at 72 °C with the final extension for 10 min at 72 °C. Pyrosequencing was performed using a PyroMark Q24 Reagent Kit and a PyroMark Q24 system (Qiagen) as described previously by Mikeska et al. [59]. The nucleotide addition order was optimized by the PyroMark Q24 Software (Qiagen) and the results were automatically analyzed using the same software. The percentage of methylation for each CpG island between the two sample groups (cancer vs. controls) was compared and p-values were determined using the t-test.

4.8. Gene Set Enrichment Analysis

The list of differentially methylated gene promotor regions was assessed to determine whether the affected genes are enriched for specific sets of functions or pathways. However, for the analysis, only those regions with assigned RefGene names indicating nearby or overlapping genes were selected. To make the analysis more stringent, only promotors with at least two CpG sites were included. The analysis was done using the WebGestalt functional enrichment analysis web tool [60]. Methylation data were explored with two different analysis approaches available, over-representation enrichment analysis (ORA) and gene set enrichment analysis (GSEA). For the ORA and GSEA analysis, the gene ontology—biological process (no-redundant) and KEGG (Kyoto Encyclopedia of Genes and Genomes) pathway databases were chosen. For ORA, the reference gene set was set to the whole genome, since many differentially methylated regions were related to miRNA and other non-coding sequences. For GSEA, gene promotors were ranked according to the Log2 of the mean difference and this data were supplied in addition to the gene symbol.

4.9. External Validation of Differentially Methylated Gene Promoters

Our gene promoters’ methylation findings were compared to Illumina HISeq RNAseq data of the TCGA-HNSC project through Wanderer (http://maplab.imppc.org/wanderer/), an interactive viewer to explore DNA methylation and gene expression data in human cancer [61]. The RNAseq estimation of expression for the top fifteen hypermethylated and top fifteen hypomethylated gene promoters in our results were visualized in Wanderer. The TCGA dataset included 497 tumor and 43 normal tissue samples. In the cases where the direction of expression change did not correspond with our methylation change, we visualized complementary TCGA in Illumina 450K DNA methylation array results for the same genes.

4.10. Ethics Approval and Consent to Participate

This study was approved by the Ethical Board of the Ruđer Bošković Institute (18 June 2014), the Ethical Board of the Clinical Hospital Dubrava (10 June 2014), and the School of Dental Medicine (10 June 2014), University of Zagreb. The study is in line with the Helsinki Declaration (adopted by the 18th WMA General Assembly, Helsinki, Finland, June 1964; amended by the 29th WMA General Assembly, Tokyo, Japan, October 1975; 35th WMA General Assembly, Venice, Italy, October 1983; 41st WMA General Assembly, Hong Kong, September 1989; 48th WMA General Assembly, Somerset West, Republic of South Africa, October 1996, and the 52nd WMA General Assembly, Edinburgh, Scotland, October 2000) An informed consent to participate in the study was obtained from each participant.

5. Conclusions

The presented methylation clustering shows that the potentially premalignant oral lesions (OLL and OLP) are more closely related to healthy mucosa than to the HNSCC although differences between groups exist. The identified panels of hypermethylated and hypomethylated genes, which differentiate the HNSCC samples from oral potentially premalignant lesions and healthy mucosa could clinically be a useful tool for early cancer diagnosis and prognosis. Specific genes that could be considered as HNSCC DNA methylation biomarkers belong to the group of receptor genes, transcription factors, genes involved in adhesion and transport reactions, as well as genes related to the immune response. Thus, the HNSCC hypermethylated CDH1 gene, involved in cell-cell adhesion, could be considered as a good biomarker for distinguishing cancer tissues from potentially premalignant oral lesions and from healthy oral mucosa. In addition, hypermethylated gene promoters of SLC5A10, involved in transport, and TBC1D2, involved in cell-cell adhesion, could be also good biomarkers for distinguishing HNSCC from lesions, as well as potentially premalignant oral lesions from healthy oral tissues.

Supplementary Materials

Supplementary materials can be found at https://www.mdpi.com/1422-0067/21/18/6853/s1.

Author Contributions

M.G. and N.M.G. designed the study; N.M.G. was responsible for the methylation analyses and wrote the manuscript; I.S. did the bioinformatic analyses and contributed to the writing of the manuscript; K.B. was a major contributor for samples processing, HPV testing, and pyrosequencing analyses; E.D. and M.M.-S. were responsible for samples collection and patient data processing; D.L. did the interpretation of Illumina iScan data; S.D.M. performed the Illumina chip analyses; M.G. conceived the study, ensured funding, and revised the manuscript. All authors have read and approved the final version of the manuscript.

Funding

This study was supported by funds from the Croatian Science Foundation (grant code IP-2013-11-4758; Epigenetic changes in head and neck squamous cell carcinoma—Epic-HNSCC), which had no influence on the content of the manuscript. The authors have no other relevant affiliations or financial involvement with any organization or entity with a financial interest in or financial conflict with the subject matter or materials discussed in the manuscript apart from those disclosed.

Acknowledgments

The authors are thankful to the clinicians that were involved in the collection of tissue samples. The authors are also grateful to Jasminka Golubić Talić for her technical assistance, and to Nino Sinčić and Jure Krasić for enabling the pyrosequencing analysis. Special thanks to Nathaniel Edward Bennett Saidu for manuscript editing and critical review of the study.

Conflicts of Interest

The authors have no conflict of interest to declare.

Abbreviations

comb.p.adj.fdrFDR adjusted combined p-value;
CpG5′-cytosine-phosphate-guanine-3′
FDRfalse discovery rate
GSEAgene set enrichment analysis
HNSCChead and neck squamous cell carcinoma
HPVhuman papillomavirus
KEGGKyoto encyclopedia of genes and genomes
limmalinear models for microarray data
mean.mean.diffvalue of the mean difference across all sites in a region
miRNAmicro ribonucleic acids
NAnot annotated; NTA, network topology-based analysis
OLLoral lichenoid lesions
OLPoral lichen planus
OPSCCoropharyngeal squamous cell carcinoma
ORAover-representation enrichment analysis
OSCCoral squamous cell carcinoma
PCAprincipal component analysis
PCRpolymerase chain reaction
RnBeadsintegrated software package for the analysis and interpretation of DNA methylation data
SNPssingle nucleotide polymorphisms
TCGAThe Cancer Genome Atlas
TStype-specific

References

  1. International Agency for Research on Cancer, Global Cancer Observatory. 2012. Available online: http://globocan.iarc.fr/Default.aspx (accessed on 13 June 2018).
  2. Arantes, L.M.R.B.; De Carvalho, A.C.; Melendez, M.E.; Carvalho, A.L. Serum, plasma and saliva biomarkers for head and neck cancer. Expert Rev. Mol. Diagn. 2017, 18, 85–112. [Google Scholar] [CrossRef]
  3. Alexandrov, L.B.; Ju, Y.S.; Haase, K.; Van Loo, P.; Martincorena, I.; Nik-Zainal, S.; Totoki, Y.; Fujimoto, A.; Nakagawa, H.; Shibata, T.; et al. Mutational signatures associated with tobacco smoking in human cancer. Science 2016, 354, 618–622. [Google Scholar] [CrossRef] [Green Version]
  4. Burris, J.L.; Studts, J.L.; DeRosa, A.; Ostroff, J.S. Systematic Review of Tobacco Use after Lung or Head/Neck Cancer Diagnosis: Results and Recommendations for Future Research. Cancer Epidemiol. Biomark. Prev. 2015, 24, 1450–1461. [Google Scholar] [CrossRef] [PubMed] [Green Version]
  5. Kawakita, D.; Matsuo, K. Alcohol and head and neck cancer. Cancer Metastasis Rev. 2017, 36, 425–434. [Google Scholar] [CrossRef] [PubMed]
  6. Hashibe, M.; Brennan, P.; Benhamou, S.; Castellsagué, X.; Chen, C.; Curado, M.P.; Maso, L.D.; Daudt, A.W.; Fabianova, E.; Wunsch-Filho, V.; et al. Alcohol Drinking in Never Users of Tobacco, Cigarette Smoking in Never Drinkers, and the Risk of Head and Neck Cancer: Pooled Analysis in the International Head and Neck Cancer Epidemiology Consortium. J. Natl. Cancer Inst. 2007, 99, 777–789. [Google Scholar] [CrossRef] [PubMed]
  7. Hashibe, M.; Brennan, P.; Chuang, S.-C.; Boccia, S.; Castellsagué, X.; Chen, C.; Curado, M.P.; Maso, L.D.; Daudt, A.W.; Fabianova, E.; et al. Interaction between tobacco and alcohol use and the risk of head and neck cancer: Pooled analysis in the International Head and Neck Cancer Epidemiology Consortium. Cancer Epidemiol. Biomark. Prev. 2009, 18, 541–550. [Google Scholar] [CrossRef] [PubMed] [Green Version]
  8. Marur, S.; D’Souza, G.; Westra, W.H.; Forastiere, A.A. HPV-associated head and neck cancer: A virus-related cancer epidemic. Lancet Oncol. 2010, 11, 781–789. [Google Scholar] [CrossRef] [Green Version]
  9. D’Souza, G.; Dempsey, A. The role of HPV in head and neck cancer and review of the HPV vaccine. Prev. Med. 2011, 53, S5–S11. [Google Scholar] [CrossRef] [Green Version]
  10. Kobayashi, K.; Hisamatsu, K.; Suzui, N.; Hara, A.; Tomita, H.; Miyazaki, T. A Review of HPV-Related Head and Neck Cancer. J. Clin. Med. 2018, 7, 241. [Google Scholar] [CrossRef] [Green Version]
  11. Shah, A.; Malik, A.; Garg, A.; Mair, M.; Nair, S.; Chaturvedi, P. Oral sex and human papilloma virus-related head and neck squamous cell cancer: A review of the literature. Postgrad. Med J. 2017, 93, 704–709. [Google Scholar] [CrossRef]
  12. Ghantous, Y.; Schussel, J.L.; Brait, M. Tobacco and alcohol-induced epigenetic changes in oral carcinoma. Curr. Opin. Oncol. 2018, 30, 152–158. [Google Scholar] [CrossRef] [PubMed]
  13. Wilson, G.A.; Lechner, M.; Köferle, A.; Carén, H.; Butcher, L.M.; Feber, A.; Fenton, T.R.; Jay, A.; Boshoff, C.; Beck, S. Integrated virus-host methylome analysis in head and neck squamous cell carcinoma. Epigenetics 2013, 8, 953–961. [Google Scholar] [CrossRef] [PubMed] [Green Version]
  14. Sanderson, R.J.; Ironside, J.A.D.; Wei, W.I. Squamous cell carcinomas of the head and neck * Commentary: Head and neck carcinomas in the developing world. BMJ 2002, 325, 822–827. [Google Scholar] [CrossRef] [Green Version]
  15. Langevin, S.M.; Kuhnell, D.; Niu, L.; Biesiada, J.; Leung, Y.-K.; Deka, R.; Chen, A.; Medvedovic, M.; Kelsey, K.T.; Kasper, S.; et al. Comprehensive mapping of the methylation landscape of 16 CpG-dense regions in oral and pharyngeal squamous cell carcinoma. Epigenomics 2019, 11, 987–1002. [Google Scholar] [CrossRef]
  16. Jones, P.A.; Baylin, S.B. The fundamental role of epigenetic events in cancer. Nat. Rev. Genet. 2002, 3, 415–428. [Google Scholar] [CrossRef] [PubMed]
  17. Herceg, Z.; Hainaut, P. Genetic and epigenetic alterations as biomarkers for cancer detection, diagnosis and prognosis. Mol. Oncol. 2007, 1, 26–41. [Google Scholar] [CrossRef] [Green Version]
  18. Van Der Meij, E.; Mast, H.; Van Der Waal, I. The possible premalignant character of oral lichen planus and oral lichenoid lesions: A prospective five-year follow-up study of 192 patients. Oral Oncol. 2007, 43, 742–748. [Google Scholar] [CrossRef]
  19. Casparis, S.; Borm, J.M.; Tektas, S.; Kamarashev, J.; Locher, M.; Damerau, G.; Grätz, K.W.; Stadlinger, B. Oral lichen planus (OLP), oral lichenoid lesions (OLL), oral dysplasia, and oral cancer: Retrospective analysis of clinicopathological data from 2002–2011. Oral Maxillofac. Surg. 2014, 19, 149–156. [Google Scholar] [CrossRef]
  20. Patel, P.S.; Dudhia, B.B.; Dudhia, S.B.; Jani, Y.V. Oral lichen planus to oral lichenoid lesions: Evolution or revolution. J. Oral Maxillofac. Pathol. 2015, 19, 364–370. [Google Scholar] [CrossRef]
  21. Stipetić, M.M.; Sabol, I.; Kranjčić, J.; Knežević, M.; Grce, M. Human Papillomavirus in the Lesions of the Oral Mucosa According to Topography. PLoS ONE 2013, 8, e69736. [Google Scholar] [CrossRef] [Green Version]
  22. Ambrosi, C.; Manzo, M.; Baubec, T. Dynamics and Context-Dependent Roles of DNA Methylation. J. Mol. Boil. 2017, 429, 1459–1475. [Google Scholar] [CrossRef] [PubMed]
  23. Chen, B.-S. Decreased expression of SPRR3 in Chinese human oesophageal cancer. Carcinogenesis 2000, 21, 2147–2150. [Google Scholar] [CrossRef] [PubMed] [Green Version]
  24. Zhang, H.-J.; Tian, J.; Qi, X.-K.; Xiang, T.; He, G.-P.; Zhang, H.; Yu, X.; Zhang, X.; Zhao, B.; Feng, Q.-S.; et al. Epstein-Barr virus activates F-box protein FBXO2 to limit viral infectivity by targeting glycoprotein B for degradation. PLoS Pathog. 2018, 14, e1007208. [Google Scholar] [CrossRef] [PubMed]
  25. Gene Cards—The Human Genes Gene Database. Available online: https://www.genecards.org/ (accessed on 22 August 2018).
  26. Taberna, M.; Mena, M.; Pavón, M.A.; Alemany, L.; Gillison, M.L.; Mesía, R. Human papillomavirus-related oropharyngeal cancer. Ann. Oncol. 2017, 28, 2386–2398. [Google Scholar] [CrossRef]
  27. Božinović, K.; Sabol, I.; Rakusic, Z.; Jakovčević, A.; Šekerija, M.; Lukinović, J.; Prgomet, D.; Grce, M. HPV-driven oropharyngeal squamous cell cancer in Croatia—Demography and survival. PLoS ONE 2019, 14, e0211577. [Google Scholar] [CrossRef] [Green Version]
  28. Lechner, M.; Fenton, T.R.; West, J.; Wilson, G.A.; Feber, A.; Henderson, S.; Thirlwell, C.; Dibra, H.K.; Jay, A.; Butcher, L.M.; et al. Identification and functional validation of HPV-mediated hypermethylation in head and neck squamous cell carcinoma. Genome Med. 2013, 5, 15. [Google Scholar] [CrossRef] [Green Version]
  29. Liu, Q.; Zhang, C.; Ma, G.; Zhang, Q. Expression of SPRR3 is associated with tumor cell proliferation and invasion in glioblastoma multiforme. Oncol. Lett. 2013, 7, 427–432. [Google Scholar] [CrossRef] [Green Version]
  30. Zhang, Y.; Feng, Y.-B.; Shen, X.-M.; Chen, B.-S.; Du, X.-L.; Luo, M.-L.; Cai, Y.; Han, Y.-L.; Xu, X.; Zhan, Q.-M.; et al. Exogenous expression of Esophagin/SPRR3 attenuates the tumorigenicity of esophageal squamous cell carcinoma cellsviapromoting apoptosis. Int. J. Cancer 2007, 122, 260–266. [Google Scholar] [CrossRef]
  31. Solomon, B.; Young, R.J.; Rischin, D. Head and neck squamous cell carcinoma: Genomics and emerging biomarkers for immunomodulatory cancer treatments. Semin. Cancer Boil. 2018, 52. [Google Scholar] [CrossRef]
  32. Strzelczyk, J.K.; Krakowczyk, Ł.; Owczarek, A.J. Aberrant DNA methylation of the p16, APC, MGMT, TIMP3 and CDH1 gene promoters in tumours and the surgical margins of patients with oral cavity cancer. J. Cancer 2018, 9, 1896–1904. [Google Scholar] [CrossRef] [Green Version]
  33. Kim, J.-S.; Kim, S.Y.; Lee, M.; Kim, S.H.; Kim, S.-M.; Kim, E.J. Radioresistance in a human laryngeal squamous cell carcinoma cell line is associated with DNA methylation changes and topoisomerase II α. Cancer Boil. Ther. 2015, 16, 558–566. [Google Scholar] [CrossRef] [PubMed] [Green Version]
  34. Gentilini, D.; Scala, S.; Gaudenzi, G.; Garagnani, P.; Capri, M.; Cescon, M.; Grazi, G.L.; Bacalini, M.G.; Pisoni, S.; Dicitore, A.; et al. Epigenome-wide association study in hepatocellular carcinoma: Identification of stochastic epigenetic mutations through an innovative statistical approach. Oncotarget 2017, 8, 41890–41902. [Google Scholar] [CrossRef] [PubMed] [Green Version]
  35. Paz, N.; Levanon, E.Y.; Amariglio, N.; Heimberger, A.B.; Ram, Z.; Constantini, S.; Barbash, Z.S.; Adamsky, K.; Safran, M.; Hirschberg, A.; et al. Altered adenosine-to-inosine RNA editing in human cancer. Genome Res. 2007, 17, 1586–1595. [Google Scholar] [CrossRef] [PubMed] [Green Version]
  36. Wen, G.; Wang, H.; Zhong, Z. Associations of RASSF1A, RARβ, and CDH1 promoter hypermethylation with oral cancer risk. Medicine (Baltimore) 2018, 97, e9971. [Google Scholar] [CrossRef]
  37. Liu, G. CDH1promoter methylation in patients with cervical carcinoma: A systematic meta-analysis with trial sequential analysis. Futur. Oncol. 2018, 14, 51–63. [Google Scholar] [CrossRef]
  38. Lee, J.-J.; Kao, K.-C.; Chiu, Y.-L.; Jung, C.-J.; Liu, C.-J.; Cheng, S.-J.; Chang, Y.-L.; Ko, J.-Y.; Chia, J.-S. Enrichment of Human CCR6+ Regulatory T Cells with Superior Suppressive Activity in Oral Cancer. J. Immunol. 2017, 199, 467–476. [Google Scholar] [CrossRef] [Green Version]
  39. Wu, J.; Xu, X.; Lee, E.-J.; Shull, A.Y.; Pei, L.; Awan, F.; Wang, X.; Choi, J.-H.; Deng, L.; Xin, H.-B.; et al. Phenotypic alteration of CD8+ T cells in chronic lymphocytic leukemia is associated with epigenetic reprogramming. Oncotarget 2016, 7, 40558–40570. [Google Scholar] [CrossRef]
  40. Wu, C.-Y.; Tseng, R.-C.; Hsu, H.-S.; Wang, Y.-C.; Hsu, M.-T. Frequent down-regulation of hRAB37 in metastatic tumor by genetic and epigenetic mechanisms in lung cancer. Lung Cancer 2009, 63, 360–367. [Google Scholar] [CrossRef]
  41. Bond, H.M.; Scicchitano, S.; Chiarella, E.; Amodio, N.; Lucchino, V.; Aloisio, A.; Montalcini, Y.; Mesuraca, M.; Morrone, G. ZNF423: A New Player in Estrogen Receptor-Positive Breast Cancer. Front. Endocrinol. 2018, 9. [Google Scholar] [CrossRef] [Green Version]
  42. Rivas-Ortiz, C.I.; Lopez-Vidal, Y.; Arredondo-Hernandez, L.J.R.; Castillo-Rojas, G. Genetic Alterations in Gastric Cancer Associated with Helicobacter pylori Infection. Front. Med. 2017, 4. [Google Scholar] [CrossRef] [Green Version]
  43. Chen, C.; Peng, H.; Huang, X.; Zhao, M.; Li, Z.; Yin, N.; Wang, X.; Yu, F.; Yin, B.; Yuan, Y.; et al. Genome-wide profiling of DNA methylation and gene expression in esophageal squamous cell carcinoma. Oncotarget 2015, 7, 4507–4521. [Google Scholar] [CrossRef] [PubMed] [Green Version]
  44. Hatano, Y.; Semi, K.; Hashimoto, K.; Lee, M.S.; Hirata, A.; Tomita, H.; Kuno, T.; Takamatsu, M.; Aoki, K.; Taketo, M.M.; et al. Reducing DNA methylation suppresses colon carcinogenesis by inducing tumor cell differentiation. Carcinogenesis 2015, 36, 719–729. [Google Scholar] [CrossRef] [PubMed] [Green Version]
  45. Kim, J.H.; Karnovsky, A.; Mahavisno, V.; Weymouth, T.; Pande, M.; Dolinoy, D.C.; Rozek, L.S.; Sartor, M.A. LRpath analysis reveals common pathways dysregulated via DNA methylation across cancer types. BMC Genom. 2012, 13, 526. [Google Scholar] [CrossRef] [PubMed] [Green Version]
  46. Mielcarek-Kuchta, D.; Paluszczak, J.; Seget, M.; Kiwerska, K.; Biczysko, W.; Szyfter, K.; Szyfter, W. Prognostic factors in oral and oropharyngeal cancer based on ultrastructural analysis and DNA methylation of the tumor and surgical margin. Tumor Boil. 2014, 35, 7441–7449. [Google Scholar] [CrossRef] [PubMed]
  47. Juodzbalys, G.; Kasradze, D.; Cicciù, M.; Sudeikis, A.; Banys, L.; Galindo-Moreno, P.; Guobis, Z. Modern molecular biomarkers of head and neck cancer. Part I. Epigenetic diagnostics and prognostics: Systematic review. Cancer Biomark. 2017, 17, 487–502. [Google Scholar] [CrossRef] [PubMed]
  48. Wong, T.-S.; Gao, W.; Chan, J.Y.-W. Interactions between E-Cadherin and MicroRNA Deregulation in Head and Neck Cancers: The Potential Interplay. BioMed Res. Int. 2014, 2014, 1–8. [Google Scholar] [CrossRef]
  49. Aran, D.; Sirota, M.; Butte, A.J. Systematic pan-cancer analysis of tumour purity. Nat. Commun. 2015, 6, 8971. [Google Scholar] [CrossRef] [Green Version]
  50. Manos, M.M.; Ting, Y.; Wright, D.K.; Levwis, A.J.; Broker, T.R.; Wolinsky, S.M. The use of polymerase chain reaction amplification for the detection of genital human papillomaviruses. U Cancer Cells. 1989, 7, 209–214. [Google Scholar]
  51. Gašperov, N.M.; Sabol, I.; Halec, G.; Matovina, M.; Grce, M. Retrospective study of the prevalence of high-risk human papillomaviruses among Croatian women. Coll. Antropol. 2007, 31, doi. [Google Scholar]
  52. Gasperov, N.M.; Sabol, I.; Planinić, P.; Grubisic, G.; Fistonić, I.; Corusić, A.; Grce, M. Methylated Host Cell Gene Promoters and Human Papillomavirus Type 16 and 18 Predicting Cervical Lesions and Cancer. PLoS ONE 2015, 10, e0129452. [Google Scholar] [CrossRef] [Green Version]
  53. Pidsley, R.; Zotenko, E.; Peters, T.J.; Lawrence, M.G.; Risbridger, G.P.; Molloy, P.L.; Van Dijk, S.J.; Muhlhausler, B.; Stirzaker, C.; Clark, S.J. Critical evaluation of the Illumina MethylationEPIC BeadChip microarray for whole-genome DNA methylation profiling. Genome Boil. 2016, 17, 208. [Google Scholar] [CrossRef] [PubMed] [Green Version]
  54. Morris, T.J.; Butcher, L.M.; Feber, A.; Teschendorff, A.E.; Chakravarthy, A.R.; Wojdacz, T.K.; Beck, S. ChAMP: 450k Chip Analysis Methylation Pipeline. Bioinformatics 2013, 30, 428–430. [Google Scholar] [CrossRef] [PubMed]
  55. Assenov, Y.; Müller, F.; Lutsik, P.; Walter, J.; Lengauer, T.; Bock, C. Comprehensive analysis of DNA methylation data with RnBeads. Nat. Methods 2014, 11, 1138–1140. [Google Scholar] [CrossRef] [PubMed] [Green Version]
  56. Dedeurwaerder‡, S.; Defrance, M.; Calonne, E.; Denis, H.; Sotiriou, C.; Fuks, F. Evaluation of the Infinium Methylation 450K technology. Epigenomics 2011, 3, 771–784. [Google Scholar] [CrossRef] [Green Version]
  57. Johnson, W.E.; Li, C.; Rabinovic, A. Adjusting batch effects in microarray expression data using empirical Bayes methods. Biostatistics 2006, 8, 118–127. [Google Scholar] [CrossRef]
  58. Smyth, G.K.; Michaud, J.; Scott, H. Use of within-array replicate spots for assessing differential expression in microarray experiments. Bioinformatics 2005, 21, 2067–2075. [Google Scholar] [CrossRef]
  59. Mikeska, T.; Felsberg, J.; Hewitt, C.A.; Dobrovic, A. Analysing DNA Methylation Using Bisulphite Pyrosequencing. In Advanced Structural Safety Studies; Springer Science and Business Media LLC: Berlin, Germany, 2011; Volume 791, pp. 33–53. [Google Scholar]
  60. Liao, Y.; Wang, J.; Jaehnig, E.J.; Shi, Z.; Zhang, B. WebGestalt 2019: Gene set analysis toolkit with revamped UIs and APIs. Nucleic Acids Res. 2019, 47, W199–W205. [Google Scholar] [CrossRef] [Green Version]
  61. Díez-Villanueva, A.; Mallona, I.; Peinado, M.A. Wanderer, an interactive viewer to explore DNA methylation and gene expression data in human cancer. Epigenetics Chromatin 2015, 8, 22. [Google Scholar] [CrossRef] [Green Version]
Figure 1. Infinium MethylationEPIC BeadChip findings: Samples grouping by the principal component. Green: Head and neck squamous cell carcinoma (HNSCC) samples, oropharyngeal cancer (n = 6) and oral cancer (n = 7), orange: Oral lesions, OLP (n = 8) and OLL (n = 2), violet: Healthy oral mucosa (n = 8).
Ijms 21 06853 g001
Figure 2. Infinium MethylationEPIC BeadChip findings: Hierarchical clustering of samples based on all methylation values. (A) The heatmap displays methylation percentiles per sample. (B) The heatmap displays only selected sites/regions with the highest variance across all samples. Green: HNSCC samples, oropharyngeal cancer (n = 6) and oral cancer (n = 7), orange: Oral lesions, OLP (n = 8) and OLL (n = 2), violet: Healthy oral mucosa (n = 8).
Ijms 21 06853 g002
Figure 3. Infinium MethylationEPIC BeadChip findings: Heatmap representation of samples clustering for the top fifteen hypermethylated (blue) and top fifteen hypomethylated (red) CpG sites in cancer tissue compared to control healthy tissue (according to the methylation difference value; Table 3 and Table 4). Left side (green): HNSCC samples (n = 13; kbd10–kbd11); right side (violet): Healthy oral mucosa (n = 8; 2010-804, 2017-1237–2017-1227, 2017-1236, 2010-823); middle (orange): Oral lesions (n = 10; 2010-786–2010-865, 2010-777, 2014-1003, 2009-757, 2010-784).
Ijms 21 06853 g003
Figure 4. Over-representation enrichment analysis (ORA) of gene ontology (GO), biological processes, for consistently hypomethylated gene promoters and/or CpG sites in (A) HNSCC tissue compared to control healthy tissue, (B) HNSCC tissue compared to potentially premalignant oral lesions, and (C) potentially premalignant oral lesions compared to control healthy tissue. The top 10 categories are shown; the fold discovery rate (FDR) adjusted significance (colored bar) is in each shown case ≤0.05.
Ijms 21 06853 g004aIjms 21 06853 g004b
Table 1. Hypermethylated gene promoter methylation in HNSCC tissue compared to control healthy tissue and potentially premalignant oral lesions, and in potentially premalignant oral lesions compared to control healthy tissue. The list is merged of top fifteen differentially methylated genes according to the extent of methylation difference value.
Gene NameFunctionMMD *p-Value **
HNSCC Tissue vs. Healthy Tissue
GPRC5DG protein-coupled receptor0.786.49 × 10−7
TMPRSS11BTransmembrane protease0.762.04 × 10−8
PIAS2Sumoylation0.661.22 × 10−6
ARG1Arginase activity0.642.50 × 10−7
SRPK2Protein kinase0.621.30 × 10−6
AADACL2Hydrolase activity0.597.38 × 10−7
RGPD4RNA transport0.584.71 × 10−6
SPRR3Structural molecule activity0.532.44 × 10−7
DEGS1Desaturase activity0.492.04 × 10−8
TXNDC8Oxidoreductase activity0.481.15 × 10−5
SH3TC1Myelination0.472.05 × 10−6
ZPLD1Cerebral malformations0.476.17 × 10−6
FBXO2Ubiquitination0.460.000236
ATG16L1Autophagy0.460.000306
GRHL1Transcription factor0.445.12 × 10−7
HNSCC Tissue vs. Oral Lesions
RAD51BRAD51 Paralog B0.852.53 × 108
BARX2BARX Homeobox 20.813.94 × 108
SLC5A10;FAM83GSolute Carrier Family 5 Member 100.782.58 × 108
NINLNinein Like0.773.96 × 108
NSMCE2NSE2/MMS21 Homolog, SMC5-SMC6 Complex SUMO Ligase0.766.36 × 107
PGAP2Post-GPI Attachment to Proteins 20.759.48 × 108
INO80CINO80 Complex Subunit C0.741.96 × 109
IL34Interleukin 340.742.20 × 109
ZNF516Zinc Finger Protein 5160.734.90 × 108
GFOD2Glucose-Fructose Oxidoreductase Domain Containing 20.731.36 × 107
PARD3Par-3 Family Cell Polarity Regulator0.731.36 × 107
MCEEMethylmalonyl-CoA Epimerase0.722.89 × 108
POLMDNA Polymerase Mu0.723.93 × 107
ASPGAsparaginase0.714.43 × 108
TBC1D2TBC1 Domain Family Member 20.713.74 × 107
Oral Lesions vs. Healthy Tissue
SLC5A10;FAM83GSolute Carrier Family 5 Member 100.782.58 × 108
TBC1D2TBC1 Domain Family Member 20.713.74 × 107
SH3BP5LSH3 Binding Domain Protein 5 Like0.702.68 × 107
VANGL1VANGL Planar Cell Polarity Protein 10.696.49 × 107
DLEC1Deleted in Lung And Esophageal Cancer 10.613.84 × 106
TGOLN2Trans-Golgi Network Protein 20.613.79 × 107
CTBP2C-Terminal Binding Protein 20.594.99 × 106
PPP1CBProtein Phosphatase 1 Catalytic Subunit Beta0.562.20 × 106
VPS52VPS52, GARP Complex Subunit0.538.05 × 106
MEPCEMethylphosphate Capping Enzyme0.522.89 × 107
HDAC4Histone Deacetylase 40.516.47 × 106
ARAP1ArfGAP with RhoGAP Domain, Ankyrin Repeat, and PH Domain 10.504.77 × 107
TCF20Transcription Factor 200.494.14 × 105
NDUFS7NADH:Ubiquinone Oxidoreductase Core Subunit S70.490.00017
GATAD2AGATA Zinc Finger Domain Containing 2A0.473.58 × 108
* Mean difference (MD) across all sites in a region (mean.mean.diff); ** false discovery rate (FDR) adjustment combined p-value (comb.p.adj.fdr).
Table 2. Hypomethylated gene promoter methylation in HNSCC tissue compared to control healthy tissue and potentially premalignant oral lesions, and in potentially premalignant oral lesions compared to control healthy tissue. The list is merged of top fifteen differentially methylated genes according to the extent of methylation difference value.
Gene NameFunctionMMD *p-Value **
HNSCC Tissue vs. Healthy Tissue
TRBC2T cell receptor−0.802.48 × 10−7
DGAT2Acyltransferase activity−0.702.48 × 10−7
ALG1LTransferase activity−0.703.29 × 10−5
PDE4DEnzyme binding−0.681.06 × 10−5
TRDCT cell receptor−0.671.46 × 10−5
DNAJC6Phosphatase activity−0.671.63 × 10−6
IGKV3-20Immunoglobulin receptor binding−0.661.71 × 10−5
TMEM150BTransmembrane protein−0.668.13 × 10−5
LAIR2Innate immune response−0.651.81 × 10−5
UBQLN3Protein degradation−0.642.57 × 10−6
ANKFN1Not known−0.641.71 × 10−7
MS4A1Differentiation of B-cells−0.633.80 × 10−5
CCT8L2Channel activity−0.623.59 × 10−6
SPOCK1Not known−0.615.06 × 10−5
IGHV4-39Antigen recognition−0.619.44 × 10−7
HNSCC Tissue vs. Oral Lesions
ART4ADP-Ribosyltransferase 4 (Dombrock Blood Group)−0.887.92 × 1011
EPB41L3Erythrocyte Membrane Protein Band 4.1 Like 3−0.876.18 × 1011
ESRRGEstrogen Related Receptor Gamma−0.868.51 × 109
ENPP1Ectonucleotide Pyrophosphatase/Phosphodiesterase 1−0.861.26 × 109
GNG7G Protein Subunit Gamma 7−0.864.75 × 109
PAPSS23′-Phosphoadenosine 5′-Phosphosulfate Synthase 2−0.854.10 × 109
NGEFNeuronal Guanine Nucleotide Exchange Factor−0.841.87 × 109
HIPK4Homeodomain Interacting Protein Kinase 4−0.846.69 × 109
GPR158G Protein-Coupled Receptor 158−0.839.82 × 1010
GSG1LGSG1 Like−0.831.04 × 108
SMPD3Sphingomyelin Phosphodiesterase 3−0.831.64 × 108
GDF2Growth Differentiation Factor 2−0.835.15 × 1010
REREArginine-Glutamic Acid Dipeptide Repeats−0.822.19 × 108
CDH13Cadherin 13−0.821.81 × 1010
HS3ST4Heparan Sulfate-Glucosamine 3-Sulfotransferase 4−0.821.02 × 108
Oral Lesions vs. Healthy Tissue
ART4ADP-Ribosyltransferase 4 (Dombrock Blood Group)−0.887.92 × 10−11
ENPP1Ectonucleotide Pyrophosphatase/Phosphodiesterase 1−0.861.26 × 10−9
GNG7G Protein Subunit Gamma 7−0.864.75 × 10−9
PKD1L3Polycystin 1 Like 3, Transient Receptor Potential Channel Interacting−0.812.20 × 10−9
PLXNC1Plexin C1−0.811.41 × 10−9
CAMK2BCalcium/Calmodulin Dependent Protein Kinase II Beta−0.791.05 × 10−8
CACNA1SCalcium Voltage–Gated Channel Subunit Alpha1 S−0.788.18 × 10−9
SCGB1D1Secretoglobin Family 1D Member 1−0.782.34 × 10−7
VPS13DVacuolar Protein Sorting 13 Homolog D−0.766.12 × 10−8
DLGAP4DLG Associated Protein 4−0.766.37 × 10−9
LRP1BLDL Receptor Related Protein 1B−0.761.12 × 10−9
COL2A1Collagen Type II Alpha 1 Chain−0.751.30 × 10−8
SLC24A3Solute Carrier Family 24 Member 3−0.743.07 × 10−9
TBC1D8TBC1 Domain Family Member 8−0.741.84 × 10−8
ABCC8ATP Binding Cassette Subfamily C Member 8−0.733.58 × 10−9
* Mean difference (MD) across all sites in a region (mean.mean.diff); ** false discovery rate (FDR) adjustment combined p-value (comb.p.adj.fdr).
Table 3. Hypermethylated 5′-cytosine-phosphate-guanine-3′ (CpG) sites methylation in HNSCC tissue compared to control healthy tissue and potentially premalignant oral lesions, and in potentially premalignant oral lesions compared to control healthy tissue. The list is merged of top fifteen differentially methylated genes according to the extent of methylation difference value.
Gene NameFunctioncg PositionMMD *p-Value **
HNSCC Tissue vs. Healthy Tissue
LMBR1LProbable receptorcg123485190.934.59 × 10−8
CDH1Adhesions, mobility, and proliferationcg082858620.923.49 × 10−8
EIF6Initiation of translationcg099576660.921.96 × 10−8
C16orf70Not knowncg036649010.923.48 × 10−8
ETNK2Transferase and kinase activitycg121424970.925.33 × 10−8
C11orf73Cellular response to heat stresscg234505860.915.01 × 10−9
ADARB2RNA editingcg265695900.912.10 × 10−8
GAB1Cellular growth, transformation, and apoptosiscg230204140.912.83 × 10−8
ITPR3Metabolism and growthcg058764960.916.35 × 10−8
WDR61Transcriptional regulationcg123397900.904.35 × 10−8
PGAP2Protein transportcg011568760.901.24 × 10−8
DDX10RNA helicasecg185855580.906.14 × 10−9
DGKHKinase activitycg228997500.901.09 × 10−7
RAB40COncogenecg017709480.892.00 × 10−8
BEAN1Not knowncg194711560.895.59 × 10−8
HNSCC Tissue vs. Oral Lesions
EIF6Eukaryotic Translation Initiation Factor 6cg099576660.915.68 × 1010
KANSL1KAT8 Regulatory NSL Complex Subunit 1cg072816490.911.43 × 109
DDX10DEAD–Box Helicase 10cg185855580.893.58 × 1010
AP2A1Adaptor Related Protein Complex 2 Alpha 1 Subunitcg089691480.898.97 × 1010
RAB40CRAB40C, Member RAS Oncogene Familycg017709480.891.84 × 109
GAB1GRB2 Associated Binding Protein 1cg230204140.885.30 × 109
ERGIC1Endoplasmic Reticulum-Golgi Intermediate Compartment 1cg077690060.881.25 × 109
SNX14Sorting Nexin 14cg037769050.883.20 × 109
PIGUPhosphatidylinositol Glycan Anchor Biosynthesis Class Ucg094500870.881.22 × 1010
ARAP1ArfGAP with RhoGAP Domain, Ankyrin Repeat, and PH Domain 1cg090107910.871.56 × 109
LMTK2Lemur Tyrosine Kinase 2cg059419250.872.59 × 109
BEAN1Brain Expressed Associated with NEDD4 1cg194711560.876.96 × 109
AP1S3Adaptor Related Protein Complex 1 Sigma 3 Subunitcg256669450.871.66 × 109
CDH1Cadherin 1cg082858620.872.28 × 108
RYBPRING1 and YY1 Binding Proteincg080863850.863.11 × 1010
Oral Lesions vs. Healthy Tissue
GRIP1Glutamate Receptor Interacting Protein 1cg094145350.680.000679
MTMR10Myotubularin Related Protein 10cg254301750.660.000585
RBM47RNA Binding Motif Protein 47cg112687020.660.000636
MPHOSPH9M–Phase Phosphoprotein 9cg021321910.650.001055
FOXK1Forkhead Box K1cg160264750.640.000765
SNX3Sorting Nexin 3cg144529520.640.000825
CITCitron Rho-Interacting Serine/Threonine Kinasecg036018950.630.000866
ZBTB38Zinc Finger and BTB Domain Containing 38cg133184100.630.001548
DRD3Dopamine Receptor D3cg222538170.630.001115
SPPL3Signal Peptide Peptidase Like 3cg113305120.630.001072
ZNF407Zinc Finger Protein 407cg238631840.630.000942
ADAMTSL1ADAMTS Like 1cg126999840.620.000767
GNAT3G Protein Subunit Alpha Transducin 3cg101683610.620.000936
L3MBTL3L3MBTL3, Histone Methyl-Lysine Binding Proteincg221623570.620.001083
EEPD1Endonuclease/Exonuclease/Phosphatase Family Domain Containing 1cg063878700.610.001083
* Mean difference (MD) across all sites in a region (mean.mean.diff); ** false discovery rate (FDR) adjustment combined p-value (comb.p.adj.fdr).
Table 4. Hypomethylated CpG sites methylation in HNSCC tissue compared to control healthy tissue and potentially premalignant oral lesions, and in potentially premalignant oral lesions compared to control healthy tissue. The list is merged of top fifteen differentially methylated genes according to the extent of methylation difference value.
Gene NameFunctioncg PositionMMD *p-Value **
HNSCC Tissue vs. Healthy Tissue
ATXN1Not knowncg07713291−0.962.97 × 10−9
PPP2R2CCell growthcg05805165−0.931.22 × 10−8
CCR6Immune regulationcg05094429−0.921.08 × 10−7
RAB37Oncogenecg25267982−0.921.29 × 10−8
DUSP27Phosphatase activitycg23713934−0.911.94 × 10−7
ZNF521Transcription factorcg21830945−0.917.58 × 10−8
SLC6A17Transportercg12072789−0.907.38 × 10−8
SPIN1Methylated histone bindingcg13554018−0.901.63 × 10−8
CXCR1Receptorcg13519373−0.901.22 × 10−8
SPTBN1Cell shapecg06149826−0.896.91 × 10−9
NBASGolgi to ER transportcg27424261−0.895.31 × 10−7
NRG3Ligandcg10656958−0.899.45 × 10−8
COL5A1Forming collagencg26087052−0.893.96 × 10−8
CDX1Transcriptional regulationcg12473781−0.895.77 × 10−8
BATF3Transcriptional regulationcg03219362−0.892.10 × 10−8
HNSCC Tissue vs. Oral Lesions
FAM69AFamily with Sequence Similarity 69 Member Acg22727960−0.937.05 × 10−11
ATP6V0A1ATPase H+ Transporting V0 Subunit A1cg19022525−0.929.01 × 10−11
LBPLipopolysaccharide Binding Proteincg18979491−0.923.02 × 10−10
WDR25WD Repeat Domain 25cg24211276−0.916.22 × 10−11
SH3RF3SH3 Domain Containing Ring Finger 3cg27294813−0.911.01 × 10−9
NINJ2Ninjurin 2cg05534515−0.912.74 × 10−12
RAB37RAB37, Member RAS Oncogene Familycg25267982−0.901.17 × 10−9
CXCR1C-X-C Motif Chemokine Receptor 1cg13519373−0.901.76 × 10−10
SPTBNSpectrin Beta, Non–Erythrocytic 1cg06149826−0.901.54 × 10−10
RHOHRas Homolog Family Member Hcg15729055−0.901.90 × 10−9
GRIK5Glutamate Ionotropic Receptor Kainate Type Subunit 5cg03100024−0.902.47 × 10−9
KLRD1Killer Cell Lectin Like Receptor D1cg05377120−0.906.88 × 10−9
TENM2Teneurin Transmembrane Protein 2cg26758826−0.893.56 × 10−11
FAM69AFamily with Sequence Similarity 69 Member Acg05172999−0.893.14 × 10−10
ITKIL2 Inducible T Cell Kinasecg12250498−0.893.46 × 10−10
Oral Lesions vs. Healthy Tissue
PHACTR1Phosphatase and Actin Regulator 1cg02381687−0.800.000673
MARCH8Membrane Associated Ring-CH-Type Finger 8cg26841425−0.800.000585
PPP1R1BProtein Phosphatase 1 Regulatory Inhibitor Subunit 1Bcg03104421−0.790.000585
HDAC4Histone Deacetylase 4cg21190228−0.790.00057
IL22RA2Interleukin 22 Receptor Subunit Alpha 2cg23507945−0.790.001772
CAMKK2Calcium/Calmodulin Dependent Protein Kinase Kinase 2cg03391567−0.780.000679
INPP5DInositol Polyphosphate-5-Phosphatase Dcg22666015−0.780.000709
CSGALNACT1Chondroitin Sulfate N–Acetylgalactosaminyltransferase 1cg24423468−0.770.001266
GTDC1Glycosyltransferase Like Domain Containing 1cg19251811−0.770.000676
IGSF3Immunoglobulin Superfamily Member 3cg13004173−0.770.000585
HELZHelicase with Zinc Fingercg15015109−0.760.000772
DEFA4Defensin Alpha 4cg06617936−0.760.000678
AK5Adenylate Kinase 5cg21487631−0.760.000681
LHFPL2LHFPL Tetraspan Subfamily Member 2cg20879720−0.760.000981
STK10Serine/Threonine Kinase 10cg22406187−0.760.000765
* Mean difference (MD) across all sites in a region (mean.mean.diff); ** false discovery rate (FDR) adjustment combined p-value (comb.p.adj.fdr).

