Acute Systemic Inflammatory Response Alters Transcription Profile of Genes Related to Immune Response and Ca2+ Homeostasis in Hippocampus; Relevance to Neurodegenerative Disorders


Abstract
:
1. Introduction
2. Results
3. Discussion
4. Materials and Methods
4.1. Animals
4.2. Ethical Compliance
4.3. Microarray Analysis of Murine Brain RNA and Statistical Analysis
4.4. Microarray Analysis of Human Brain RNA and Statistical Analysis
4.5. Experimental Design
Supplementary Materials
Author Contributions
Funding
Acknowledgments
Conflicts of Interest
References
- Brown, G.C. The endotoxin hypothesis of neurodegeneration. J. Neuroinflamm. 2019, 16, 180. [Google Scholar] [CrossRef] [PubMed] [Green Version]
- Dantzer, R. Neuroimmune Interactions: From the Brain to the Immune System and Vice Versa. Physiol. Rev. 2018, 98, 477–504. [Google Scholar] [CrossRef] [PubMed]
- Semmler, A.; Okulla, T.; Sastre, M.; Dumitrescu-Ozimek, L.; Heneka, M.T. Systemic inflammation induces apoptosis with variable vulnerability of different brain regions. J. Chem. Neuroanat. 2005, 30, 144–157. [Google Scholar] [CrossRef] [PubMed]
- Konsman, J.P.; Parnet, P.; Dantzer, R. Cytokine-induced sickness behaviour: Mechanisms and implications. Trends Neurosci. 2002, 25, 154–159. [Google Scholar] [CrossRef]
- Czapski, G.A.; Cakala, M.; Gajkowska, B.; Strosznajder, J.B. Poly(ADP-ribose) polymerase-1 inhibition protects the brain against systemic inflammation. Neurochem. Int. 2006, 49, 751–755. [Google Scholar] [CrossRef]
- Czapski, G.A.; Cakala, M.; Chalimoniuk, M.; Gajkowska, B.; Strosznajder, J.B. Role of nitric oxide in the brain during lipopolysaccharide-evoked systemic inflammation. J. Neurosci. Res. 2007, 85, 1694–1703. [Google Scholar] [CrossRef]
- Czapski, G.A.; Gajkowska, B.; Strosznajder, J.B. Systemic administration of lipopolysaccharide induces molecular and morphological alterations in the hippocampus. Brain Res. 2010, 1356, 85–94. [Google Scholar] [CrossRef]
- Czapski, G.A.; Cakala, M.; Kopczuk, D.; Kaminska, M.; Strosznajder, J.B. Inhibition of nitric oxide synthase prevents energy failure and oxidative damage evoked in the brain by lipopolysaccharide. Pol. J. Pharmacol. 2004, 56, 643–646. [Google Scholar]
- Wang, R.P.; Ho, Y.S.; Leung, W.K.; Goto, T.; Chang, R.C. Systemic inflammation linking chronic periodontitis to cognitive decline. Brain Behav. Immun. 2019, 81, 63–73. [Google Scholar] [CrossRef]
- Drake, C.; Boutin, H.; Jones, M.S.; Denes, A.; McColl, B.W.; Selvarajah, J.R.; Hulme, S.; Georgiou, R.F.; Hinz, R.; Gerhard, A.; et al. Brain inflammation is induced by co-morbidities and risk factors for stroke. Brain Behav. Immun. 2011, 25, 1113–1122. [Google Scholar] [CrossRef]
- Mason, A.; Holmes, C.; Edwards, C.J. Inflammation and dementia: Using rheumatoid arthritis as a model to develop treatments? Autoimmun. Rev. 2018, 17, 919–925. [Google Scholar] [CrossRef]
- Sochocka, M.; Zwolinska, K.; Leszek, J. The Infectious Etiology of Alzheimer’s Disease. Curr. Neuropharm. 2017, 15, 996–1009. [Google Scholar] [CrossRef] [Green Version]
- Wang, L.M.; Wu, Q.; Kirk, R.A.; Horn, K.P.; Ebada Salem, A.H.; Hoffman, J.M.; Yap, J.T.; Sonnen, J.A.; Towner, R.A.; Bozza, F.A.; et al. Lipopolysaccharide endotoxemia induces amyloid-β and p-tau formation in the rat brain. Am. J. Nucl. Med. Mol. Imaging 2018, 8, 86–99. [Google Scholar] [PubMed]
- Gasparotto, J.; Girardi, C.S.; Somensi, N.; Ribeiro, C.T.; Moreira, J.C.F.; Michels, M.; Sonai, B.; Rocha, M.; Steckert, A.V.; Barichello, T.; et al. Receptor for advanced glycation end products mediates sepsis-triggered amyloid-β accumulation, Tau phosphorylation, and cognitive impairment. J. Biol. Chem. 2018, 293, 226–244. [Google Scholar] [CrossRef] [Green Version]
- Zhao, Y.; Cong, L.; Lukiw, W.J. Lipopolysaccharide (LPS) Accumulates in Neocortical Neurons of Alzheimer’s Disease (AD) Brain and Impairs Transcription in Human Neuronal-Glial Primary Co-cultures. Front. Aging Neurosci. 2017, 9, 407. [Google Scholar] [CrossRef]
- Nadhazi, Z.; Takats, A.; Offenmuller, K.; Bertok, L. Plasma endotoxin level of healthy donors. Acta Microbiol. Immunol. Hung. 2002, 49, 151–157. [Google Scholar] [CrossRef]
- Bosenberg, A.T.; Brock-Utne, J.G.; Gaffin, S.L.; Wells, M.T.; Blake, G.T. Strenuous exercise causes systemic endotoxemia. J. Appl. Physiol. (1985) 1988, 65, 106–108. [Google Scholar] [CrossRef] [PubMed]
- Kim, K.A.; Jeong, J.J.; Yoo, S.Y.; Kim, D.H. Gut microbiota lipopolysaccharide accelerates inflamm-aging in mice. BMC Microbiol. 2016, 16, 9. [Google Scholar] [CrossRef] [Green Version]
- Palmer, C.D.; Romero-Tejeda, M.; Sirignano, M.; Sharma, S.; Allen, T.M.; Altfeld, M.; Jost, S. Naturally Occurring Subclinical Endotoxemia in Humans Alters Adaptive and Innate Immune Functions through Reduced MAPK and Increased STAT1 Phosphorylation. J. Immunol. 2016, 196, 668–677. [Google Scholar] [CrossRef]
- Czapski, G.A.; Adamczyk, A.; Strosznajder, R.P.; Strosznajder, J.B. Expression and activity of PARP family members in the hippocampus during systemic inflammation: Their role in the regulation of prooxidative genes. Neurochem. Int. 2013, 62, 664–673. [Google Scholar] [CrossRef]
- Czapski, G.A.; Gassowska, M.; Wilkaniec, A.; Chalimoniuk, M.; Strosznajder, J.B.; Adamczyk, A. The mechanisms regulating cyclin-dependent kinase 5 in hippocampus during systemic inflammatory response: The effect on inflammatory gene expression. Neurochem. Int. 2016, 93, 103–112. [Google Scholar] [CrossRef] [PubMed]
- Nakamura, T.Y.; Nakao, S.; Nakajo, Y.; Takahashi, J.C.; Wakabayashi, S.; Yanamoto, H. Possible Signaling Pathways Mediating Neuronal Calcium Sensor-1-Dependent Spatial Learning and Memory in Mice. PLoS ONE 2017, 12, e0170829. [Google Scholar] [CrossRef] [PubMed] [Green Version]
- Kumar, A.; Bodhinathan, K.; Foster, T.C. Susceptibility to Calcium Dysregulation during Brain Aging. Front. Aging Neurosci. 2009, 1, 2. [Google Scholar] [CrossRef] [PubMed] [Green Version]
- Alzheimer’s Association Calcium Hypothesis Workgroup; Khachaturian, Z.S. Calcium Hypothesis of Alzheimer’s disease and brain aging: A framework for integrating new evidence into a comprehensive theory of pathogenesis. Alzheimers Dement. 2017, 13, 178–182.e117. [Google Scholar] [CrossRef]
- Kawamoto, E.M.; Vivar, C.; Camandola, S. Physiology and pathology of calcium signaling in the brain. Front. Pharmacol. 2012, 3, 61. [Google Scholar] [CrossRef] [Green Version]
- Berridge, M.J. Neuronal calcium signaling. Neuron 1998, 21, 13–26. [Google Scholar] [CrossRef] [Green Version]
- Hopp, S.C. Targeting microglia L-type voltage-dependent calcium channels for the treatment of central nervous system disorders. J. Neurosci. Res. 2020. [Google Scholar] [CrossRef]
- West, A.E.; Chen, W.G.; Dalva, M.B.; Dolmetsch, R.E.; Kornhauser, J.M.; Shaywitz, A.J.; Takasu, M.A.; Tao, X.; Greenberg, M.E. Calcium regulation of neuronal gene expression. Proc. Natl. Acad. Sci. USA 2001, 98, 11024–11031. [Google Scholar] [CrossRef] [Green Version]
- Sharma, A.; Lou, H. Depolarization-mediated regulation of alternative splicing. Front. Neurosci. 2011, 5, 141. [Google Scholar] [CrossRef] [Green Version]
- Sharma, A.; Nguyen, H.; Geng, C.; Hinman, M.N.; Luo, G.; Lou, H. Calcium-mediated histone modifications regulate alternative splicing in cardiomyocytes. Proc. Natl. Acad. Sci. USA 2014, 111, E4920–E4928. [Google Scholar] [CrossRef] [Green Version]
- Bustos, F.J.; Jury, N.; Martinez, P.; Ampuero, E.; Campos, M.; Abarzua, S.; Jaramillo, K.; Ibing, S.; Mardones, M.D.; Haensgen, H.; et al. NMDA receptor subunit composition controls dendritogenesis of hippocampal neurons through CAMKII, CREB-P, and H3K27ac. J. Cell. Physiol. 2017, 232, 3677–3692. [Google Scholar] [CrossRef]
- Cortes-Mendoza, J.; Diaz de Leon-Guerrero, S.; Pedraza-Alva, G.; Perez-Martinez, L. Shaping synaptic plasticity: The role of activity-mediated epigenetic regulation on gene transcription. Int. J. Dev. Neurosci. 2013, 31, 359–369. [Google Scholar] [CrossRef]
- Yamawaki, Y.; Yoshioka, N.; Nozaki, K.; Ito, H.; Oda, K.; Harada, K.; Shirawachi, S.; Asano, S.; Aizawa, H.; Yamawaki, S.; et al. Sodium butyrate abolishes lipopolysaccharide-induced depression-like behaviors and hippocampal microglial activation in mice. Brain Res. 2018, 1680, 13–38. [Google Scholar] [CrossRef] [PubMed]
- Sanchez-Ventura, J.; Amo-Aparicio, J.; Navarro, X.; Penas, C. BET protein inhibition regulates cytokine production and promotes neuroprotection after spinal cord injury. J. Neuroinflamm. 2019, 16, 124. [Google Scholar] [CrossRef] [PubMed]
- Belkina, A.C.; Nikolajczyk, B.S.; Denis, G.V. BET protein function is required for inflammation: Brd2 genetic disruption and BET inhibitor JQ1 impair mouse macrophage inflammatory responses. J. Immunol. 2013, 190, 3670–3678. [Google Scholar] [CrossRef] [PubMed] [Green Version]
- Hamasaki, M.Y.; Severino, P.; Puga, R.D.; Koike, M.K.; Hernandes, C.; Barbeiro, H.V.; Barbeiro, D.F.; Machado, M.C.C.; Reis, E.M.; Pinheiro da Silva, F. Short-Term Effects of Sepsis and the Impact of Aging on the Transcriptional Profile of Different Brain Regions. Inflammation 2019, 42, 1023–1031. [Google Scholar] [CrossRef]
- Jang, E.; Lee, S.; Kim, J.H.; Kim, J.H.; Seo, J.W.; Lee, W.H.; Mori, K.; Nakao, K.; Suk, K. Secreted protein lipocalin-2 promotes microglial M1 polarization. FASEB J. 2013, 27, 1176–1190. [Google Scholar] [CrossRef] [Green Version]
- Cheray, M.; Joseph, B. Epigenetics Control Microglia Plasticity. Front. Cell. Neurosci. 2018, 12, 243. [Google Scholar] [CrossRef] [Green Version]
- Jin, M.; Jang, E.; Suk, K. Lipocalin-2 Acts as a Neuroinflammatogen in Lipopolysaccharide-injected Mice. Exp. Neurobiol. 2014, 23, 155–162. [Google Scholar] [CrossRef] [Green Version]
- Ip, J.P.; Nocon, A.L.; Hofer, M.J.; Lim, S.L.; Muller, M.; Campbell, I.L. Lipocalin 2 in the central nervous system host response to systemic lipopolysaccharide administration. J. Neuroinflamm. 2011, 8, 124. [Google Scholar] [CrossRef] [Green Version]
- Lee, S.; Park, J.Y.; Lee, W.H.; Kim, H.; Park, H.C.; Mori, K.; Suk, K. Lipocalin-2 is an autocrine mediator of reactive astrocytosis. J. Neurosci. 2009, 29, 234–249. [Google Scholar] [CrossRef] [PubMed]
- Lee, S.; Kim, J.H.; Kim, J.H.; Seo, J.W.; Han, H.S.; Lee, W.H.; Mori, K.; Nakao, K.; Barasch, J.; Suk, K. Lipocalin-2 Is a chemokine inducer in the central nervous system: Role of chemokine ligand 10 (CXCL10) in lipocalin-2-induced cell migration. J. Biol. Chem. 2011, 286, 43855–43870. [Google Scholar] [CrossRef] [PubMed] [Green Version]
- Lee, S.; Lee, W.H.; Lee, M.S.; Mori, K.; Suk, K. Regulation by lipocalin-2 of neuronal cell death, migration, and morphology. J. Neurosci. Res. 2012, 90, 540–550. [Google Scholar] [CrossRef]
- Jin, M.; Kim, J.H.; Jang, E.; Lee, Y.M.; Soo Han, H.; Woo, D.K.; Park, D.H.; Kook, H.; Suk, K. Lipocalin-2 deficiency attenuates neuroinflammation and brain injury after transient middle cerebral artery occlusion in mice. J. Cereb. Blood Flow Metab. 2014, 34, 1306–1314. [Google Scholar] [CrossRef] [PubMed]
- Berard, J.L.; Zarruk, J.G.; Arbour, N.; Prat, A.; Yong, V.W.; Jacques, F.H.; Akira, S.; David, S. Lipocalin 2 is a novel immune mediator of experimental autoimmune encephalomyelitis pathogenesis and is modulated in multiple sclerosis. Glia 2012, 60, 1145–1159. [Google Scholar] [CrossRef]
- Llorens, F.; Hermann, P.; Villar-Piqué, A.; Diaz-Lucena, D.; Nägga, K.; Hansson, O.; Santana, I.; Schmitz, M.; Schmidt, C.; Varges, D.; et al. Cerebrospinal fluid lipocalin 2 as a novel biomarker for the differential diagnosis of vascular dementia. Nat. Commun. 2020, 11, 619. [Google Scholar] [CrossRef] [Green Version]
- Naude, P.J.; Eisel, U.L.; Comijs, H.C.; Groenewold, N.A.; De Deyn, P.P.; Bosker, F.J.; Luiten, P.G.; den Boer, J.A.; Oude Voshaar, R.C. Neutrophil gelatinase-associated lipocalin: A novel inflammatory marker associated with late-life depression. J. Psychosom. Res. 2013, 75, 444–450. [Google Scholar] [CrossRef]
- Choi, J.; Lee, H.W.; Suk, K. Increased plasma levels of lipocalin 2 in mild cognitive impairment. J. Neurol. Sci. 2011, 305, 28–33. [Google Scholar] [CrossRef]
- Marques, F.; Mesquita, S.D.; Sousa, J.C.; Coppola, G.; Gao, F.; Geschwind, D.H.; Columba-Cabezas, S.; Aloisi, F.; Degn, M.; Cerqueira, J.J.; et al. Lipocalin 2 is present in the EAE brain and is modulated by natalizumab. Front. Cell. Neurosci. 2012, 6, 33. [Google Scholar] [CrossRef] [Green Version]
- Kim, B.W.; Jeong, K.H.; Kim, J.H.; Jin, M.; Kim, J.H.; Lee, M.G.; Choi, D.K.; Won, S.Y.; McLean, C.; Jeon, M.T.; et al. Pathogenic Upregulation of Glial Lipocalin-2 in the Parkinsonian Dopaminergic System. J. Neurosci. 2016, 36, 5608–5622. [Google Scholar] [CrossRef] [Green Version]
- Tamaoka, A.; Odaka, A.; Ishibashi, Y.; Usami, M.; Sahara, N.; Suzuki, N.; Nukina, N.; Mizusawa, H.; Shoji, S.; Kanazawa, I.; et al. APP717 missense mutation affects the ratio of amyloid beta protein species (A beta 1-42/43 and a beta 1-40) in familial Alzheimer’s disease brain. J. Biol. Chem. 1994, 269, 32721–32724. [Google Scholar] [PubMed]
- Jang, E.; Kim, J.H.; Lee, S.; Kim, J.H.; Seo, J.W.; Jin, M.; Lee, M.G.; Jang, I.S.; Lee, W.H.; Suk, K. Phenotypic polarization of activated astrocytes: The critical role of lipocalin-2 in the classical inflammatory activation of astrocytes. J. Immunol. 2013, 191, 5204–5219. [Google Scholar] [CrossRef] [PubMed] [Green Version]
- Sui, Y.; Stehno-Bittel, L.; Li, S.; Loganathan, R.; Dhillon, N.K.; Pinson, D.; Nath, A.; Kolson, D.; Narayan, O.; Buch, S. CXCL10-induced cell death in neurons: Role of calcium dysregulation. Eur. J. Neurosci. 2006, 23, 957–964. [Google Scholar] [CrossRef] [PubMed]
- Bradburn, S.; McPhee, J.; Bagley, L.; Carroll, M.; Slevin, M.; Al-Shanti, N.; Barnouin, Y.; Hogrel, J.Y.; Paasuke, M.; Gapeyeva, H.; et al. Dysregulation of C-X-C motif ligand 10 during aging and association with cognitive performance. Neurobiol. Aging 2018, 63, 54–64. [Google Scholar] [CrossRef] [PubMed]
- Michlmayr, D.; McKimmie, C. Role of CXCL10 in central nervous system inflammation. Int. J. Interferon Cytokine Mediat. Res. 2014, 6, 1–18. [Google Scholar]
- Salvi, V.; Sozio, F.; Sozzani, S.; Del Prete, A. Role of Atypical Chemokine Receptors in Microglial Activation and Polarization. Front. Aging Neurosci. 2017, 9, 148. [Google Scholar] [CrossRef] [Green Version]
- Gomes, B.A.Q.; Silva, J.P.B.; Romeiro, C.F.R.; Dos Santos, S.M.; Rodrigues, C.A.; Goncalves, P.R.; Sakai, J.T.; Mendes, P.F.S.; Varela, E.L.P.; Monteiro, M.C. Neuroprotective Mechanisms of Resveratrol in Alzheimer’s Disease: Role of SIRT1. Oxid. Med. Cell. Longev. 2018, 2018, 8152373. [Google Scholar] [CrossRef]
- Wang, S.; Song, R.; Wang, Z.; Jing, Z.; Wang, S.; Ma, J. S100A8/A9 in Inflammation. Front. Immunol. 2018, 9, 1298. [Google Scholar] [CrossRef]
- Ma, L.; Sun, P.; Zhang, J.C.; Zhang, Q.; Yao, S.L. Proinflammatory effects of S100A8/A9 via TLR4 and RAGE signaling pathways in BV-2 microglial cells. Int. J. Mol. Med. 2017, 40, 31–38. [Google Scholar] [CrossRef] [Green Version]
- Kummer, M.P.; Vogl, T.; Axt, D.; Griep, A.; Vieira-Saecker, A.; Jessen, F.; Gelpi, E.; Roth, J.; Heneka, M.T. Mrp14 deficiency ameliorates amyloid beta burden by increasing microglial phagocytosis and modulation of amyloid precursor protein processing. J. Neurosci. 2012, 32, 17824–17829. [Google Scholar] [CrossRef]
- Lodeiro, M.; Puerta, E.; Ismail, M.A.; Rodriguez-Rodriguez, P.; Ronnback, A.; Codita, A.; Parrado-Fernandez, C.; Maioli, S.; Gil-Bea, F.; Merino-Serrais, P.; et al. Aggregation of the Inflammatory S100A8 Precedes Abeta Plaque Formation in Transgenic APP Mice: Positive Feedback for S100A8 and Abeta Productions. J. Gerontol. A Biol. Sci. Med. Sci. 2017, 72, 319–328. [Google Scholar] [CrossRef] [PubMed] [Green Version]
- Zhang, C.; Liu, Y.; Gilthorpe, J.; van der Maarel, J.R. MRP14 (S100A9) protein interacts with Alzheimer beta-amyloid peptide and induces its fibrillization. PLoS ONE 2012, 7, e32953. [Google Scholar] [CrossRef] [Green Version]
- Rigillo, G.; Vilella, A.; Benatti, C.; Schaeffer, L.; Brunello, N.; Blom, J.M.C.; Zoli, M.; Tascedda, F. LPS-induced histone H3 phospho(Ser10)-acetylation(Lys14) regulates neuronal and microglial neuroinflammatory response. Brain Behav. Immun. 2018, 74, 277–290. [Google Scholar] [CrossRef] [PubMed]
- Faraco, G.; Pittelli, M.; Cavone, L.; Fossati, S.; Porcu, M.; Mascagni, P.; Fossati, G.; Moroni, F.; Chiarugi, A. Histone deacetylase (HDAC) inhibitors reduce the glial inflammatory response in vitro and in vivo. Neurobiol. Dis. 2009, 36, 269–279. [Google Scholar] [CrossRef]
- Lord, J.; Cruchaga, C. The epigenetic landscape of Alzheimer’s disease. Nat. Neurosci. 2014, 17, 1138–1140. [Google Scholar] [CrossRef] [PubMed] [Green Version]
- Smith, A.R.; Mill, J.; Smith, R.G.; Lunnon, K. Elucidating novel dysfunctional pathways in Alzheimer’s disease by integrating loci identified in genetic and epigenetic studies. Neuroepigenetics 2016, 6, 32–50. [Google Scholar] [CrossRef] [Green Version]
- Muller, S.; Filippakopoulos, P.; Knapp, S. Bromodomains as therapeutic targets. Expert Rev. Mol. Med. 2011, 13, e29. [Google Scholar] [CrossRef] [PubMed] [Green Version]
- Filippakopoulos, P.; Knapp, S. The bromodomain interaction module. FEBS Lett. 2012, 586, 2692–2704. [Google Scholar] [CrossRef]
- Sullivan, J.M.; Badimon, A.; Schaefer, U.; Ayata, P.; Gray, J.; Chung, C.W.; von Schimmelmann, M.; Zhang, F.; Garton, N.; Smithers, N.; et al. Autism-like syndrome is induced by pharmacological suppression of BET proteins in young mice. J. Exp. Med. 2015, 212, 1771–1781. [Google Scholar] [CrossRef] [Green Version]
- Barrett, E.; Brothers, S.; Wahlestedt, C.; Beurel, E. I-BET151 selectively regulates IL-6 production. Biochim. Biophys. Acta 2014, 1842, 1549–1555. [Google Scholar] [CrossRef] [Green Version]
- Peng, J.; Dong, W.; Chen, L.; Zou, T.; Qi, Y.; Liu, Y. Brd2 is a TBP-associated protein and recruits TBP into E2F-1 transcriptional complex in response to serum stimulation. Mol. Cell. Biochem. 2007, 294, 45–54. [Google Scholar] [CrossRef]
- Stratton, M.S.; Lin, C.Y.; Anand, P.; Tatman, P.D.; Ferguson, B.S.; Wickers, S.T.; Ambardekar, A.V.; Sucharov, C.C.; Bradner, J.E.; Haldar, S.M.; et al. Signal-Dependent Recruitment of BRD4 to Cardiomyocyte Super-Enhancers Is Suppressed by a MicroRNA. Cell Rep. 2016, 16, 1366–1378. [Google Scholar] [CrossRef] [PubMed] [Green Version]
- Ray, S.; Zhao, Y.; Jamaluddin, M.; Edeh, C.B.; Lee, C.; Brasier, A.R. Inducible STAT3 NH2 terminal mono-ubiquitination promotes BRD4 complex formation to regulate apoptosis. Cell. Signal. 2014, 26, 1445–1455. [Google Scholar] [CrossRef] [PubMed] [Green Version]
- Liu, S.; Walker, S.R.; Nelson, E.A.; Cerulli, R.; Xiang, M.; Toniolo, P.A.; Qi, J.; Stone, R.M.; Wadleigh, M.; Bradner, J.E.; et al. Targeting STAT5 in hematologic malignancies through inhibition of the bromodomain and extra-terminal (BET) bromodomain protein BRD2. Mol. Cancer Ther. 2014, 13, 1194–1205. [Google Scholar] [CrossRef] [PubMed] [Green Version]
- Stewart, H.J.; Horne, G.A.; Bastow, S.; Chevassut, T.J. BRD4 associates with p53 in DNMT3A-mutated leukemia cells and is implicated in apoptosis by the bromodomain inhibitor JQ1. Cancer Med. 2013, 2, 826–835. [Google Scholar] [CrossRef] [PubMed]
- Dawson, M.A.; Prinjha, R.K.; Dittmann, A.; Giotopoulos, G.; Bantscheff, M.; Chan, W.I.; Robson, S.C.; Chung, C.W.; Hopf, C.; Savitski, M.M.; et al. Inhibition of BET recruitment to chromatin as an effective treatment for MLL-fusion leukaemia. Nature 2011, 478, 529–533. [Google Scholar] [CrossRef] [Green Version]
- Jung, K.H.; Das, A.; Chai, J.C.; Kim, S.H.; Morya, N.; Park, K.S.; Lee, Y.S.; Chai, Y.G. RNA sequencing reveals distinct mechanisms underlying BET inhibitor JQ1-mediated modulation of the LPS-induced activation of BV-2 microglial cells. J. Neuroinflamm. 2015, 12, 36. [Google Scholar] [CrossRef] [Green Version]
- Nicholas, D.A.; Andrieu, G.; Strissel, K.J.; Nikolajczyk, B.S.; Denis, G.V. BET bromodomain proteins and epigenetic regulation of inflammation: Implications for type 2 diabetes and breast cancer. Cell. Mol. Life Sci. 2017, 74, 231–243. [Google Scholar] [CrossRef] [Green Version]
- Rudman, M.D.; Choi, J.S.; Lee, H.E.; Tan, S.K.; Ayad, N.G.; Lee, J.K. Bromodomain and extraterminal domain-containing protein inhibition attenuates acute inflammation after spinal cord injury. Exp. Neurol. 2018, 309, 181–192. [Google Scholar] [CrossRef]
- Jahagirdar, R.; Attwell, S.; Marusic, S.; Bendele, A.; Shenoy, N.; McLure, K.G.; Gilham, D.; Norek, K.; Hansen, H.C.; Yu, R.; et al. RVX-297, a BET Bromodomain Inhibitor, Has Therapeutic Effects in Preclinical Models of Acute Inflammation and Autoimmune Disease. Mol. Pharmacol. 2017, 92, 694–706. [Google Scholar] [CrossRef] [Green Version]
- Bibonne, A.; Neant, I.; Batut, J.; Leclerc, C.; Moreau, M.; Gilbert, T. Three calcium-sensitive genes, fus, brd3 and wdr5, are highly expressed in neural and renal territories during amphibian development. Biochim. Biophys. Acta 2013, 1833, 1665–1671. [Google Scholar] [CrossRef] [PubMed] [Green Version]
- Joensuu, M.; Wallis, T.P.; Saber, S.H.; Meunier, F.A. Phospholipases in neuronal function: A role in learning and memory? J. Neurochem. 2020, 153, 300–333. [Google Scholar] [CrossRef] [PubMed]
- Sun, G.Y.; Xu, J.; Jensen, M.D.; Simonyi, A. Phospholipase A2 in the central nervous system: Implications for neurodegenerative diseases. J. Lipid Res. 2004, 45, 205–213. [Google Scholar] [CrossRef] [PubMed] [Green Version]
- Sun, G.Y.; Chuang, D.Y.; Zong, Y.; Jiang, J.; Lee, J.C.; Gu, Z.; Simonyi, A. Role of cytosolic phospholipase A2 in oxidative and inflammatory signaling pathways in different cell types in the central nervous system. Mol. Neurobiol. 2014, 50, 6–14. [Google Scholar] [CrossRef] [Green Version]
- Jacewicz, M.; Czapski, G.A.; Katkowska, I.; Strosznajder, R.P. Systemic administration of lipopolysaccharide impairs glutathione redox state and object recognition in male mice. The effect of PARP-1 inhibitor. Folia Neuropathol. 2009, 47, 321–328. [Google Scholar]
- Cakala, M.; Malik, A.R.; Strosznajder, J.B. Inhibitor of cyclooxygenase-2 protects against amyloid beta peptide-evoked memory impairment in mice. Pharmacol. Rep. 2007, 59, 164–172. [Google Scholar]
- Varatharaj, A.; Galea, I. The blood-brain barrier in systemic inflammation. Brain Behav. Immun. 2017, 60, 1–12. [Google Scholar] [CrossRef] [Green Version]
- Vargas-Caraveo, A.; Sayd, A.; Maus, S.R.; Caso, J.R.; Madrigal, J.L.M.; Garcia-Bueno, B.; Leza, J.C. Lipopolysaccharide enters the rat brain by a lipoprotein-mediated transport mechanism in physiological conditions. Sci. Rep. 2017, 7, 13113. [Google Scholar] [CrossRef] [Green Version]
- Banks, W.A.; Gray, A.M.; Erickson, M.A.; Salameh, T.S.; Damodarasamy, M.; Sheibani, N.; Meabon, J.S.; Wing, E.E.; Morofuji, Y.; Cook, D.G.; et al. Lipopolysaccharide-induced blood-brain barrier disruption: Roles of cyclooxygenase, oxidative stress, neuroinflammation, and elements of the neurovascular unit. J. Neuroinflamm. 2015, 12, 223. [Google Scholar] [CrossRef] [Green Version]
- Wu, B.W.; Guo, J.D.; Wu, M.S.; Liu, Y.; Lu, M.; Zhou, Y.H.; Han, H.W. Osteoblast-derived lipocalin-2 regulated by miRNA-96-5p/Foxo1 advances the progression of Alzheimer’s disease. Epigenomics 2020. [Google Scholar] [CrossRef]
- Chew, H.; Solomon, V.A.; Fonteh, A.N. Involvement of Lipids in Alzheimer’s Disease Pathology and Potential Therapies. Front. Physiol. 2020, 11, 598. [Google Scholar] [CrossRef] [PubMed]
- McLachlan, D.R.; Lukiw, W.J.; Wong, L.; Bergeron, C.; Bech-Hansen, N.T. Selective messenger RNA reduction in Alzheimer’s disease. Brain Res. 1988, 427, 255–261. [Google Scholar] [CrossRef]
- Lukiw, W.J.; Wong, L.; McLachlan, D.R. Cytoskeletal messenger RNA stability in human neocortex: Studies in normal aging and in Alzheimer’s disease. Int. J. Neurosci. 1990, 55, 81–88. [Google Scholar] [CrossRef] [PubMed]
- Lukiw, W.J.; Zhao, Y.; Cui, J.G. An NF-kappaB-sensitive micro RNA-146a-mediated inflammatory circuit in Alzheimer disease and in stressed human brain cells. J. Biol. Chem. 2008, 283, 31315–31322. [Google Scholar] [CrossRef] [PubMed] [Green Version]
- Alexandrov, P.; Zhai, Y.; Li, W.; Lukiw, W. Lipopolysaccharide-stimulated, NF-kB-, miRNA-146a- and miRNA-155-mediated molecular-genetic communication between the human gastrointestinal tract microbiome and the brain. Folia Neuropathol. 2019, 57, 211–219. [Google Scholar] [CrossRef]
- Lukiw, W.J.; Pogue, A.; Hill, J.M. SARS-CoV-2 Infectivity and Neurological Targets in the Brain. Cell. Mol. Neurobiol. 2020, 1–8. [Google Scholar] [CrossRef]
- Colangelo, V.; Schurr, J.; Ball, M.J.; Pelaez, R.P.; Bazan, N.G.; Lukiw, W.J. Gene expression profiling of 12633 genes in Alzheimer hippocampal CA1: Transcription and neurotrophic factor down-regulation and up-regulation of apoptotic and pro-inflammatory signaling. J. Neurosci. Res. 2002, 70, 462–473. [Google Scholar] [CrossRef]
- Clement, C.; Hill, J.M.; Dua, P.; Culicchia, F.; Lukiw, W.J. Analysis of RNA from Alzheimer’s Disease Post-mortem Brain Tissues. Mol. Neurobiol. 2016, 53, 1322–1328. [Google Scholar] [CrossRef] [Green Version]
- Sethi, P.; Lukiw, W.J. Micro-RNA abundance and stability in human brain: Specific alterations in Alzheimer’s disease temporal lobe neocortex. Neurosci. Lett. 2009, 459, 100–104. [Google Scholar] [CrossRef]


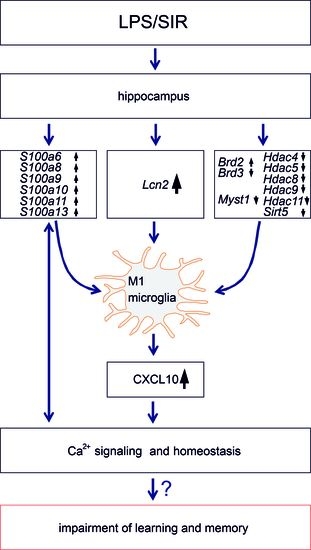
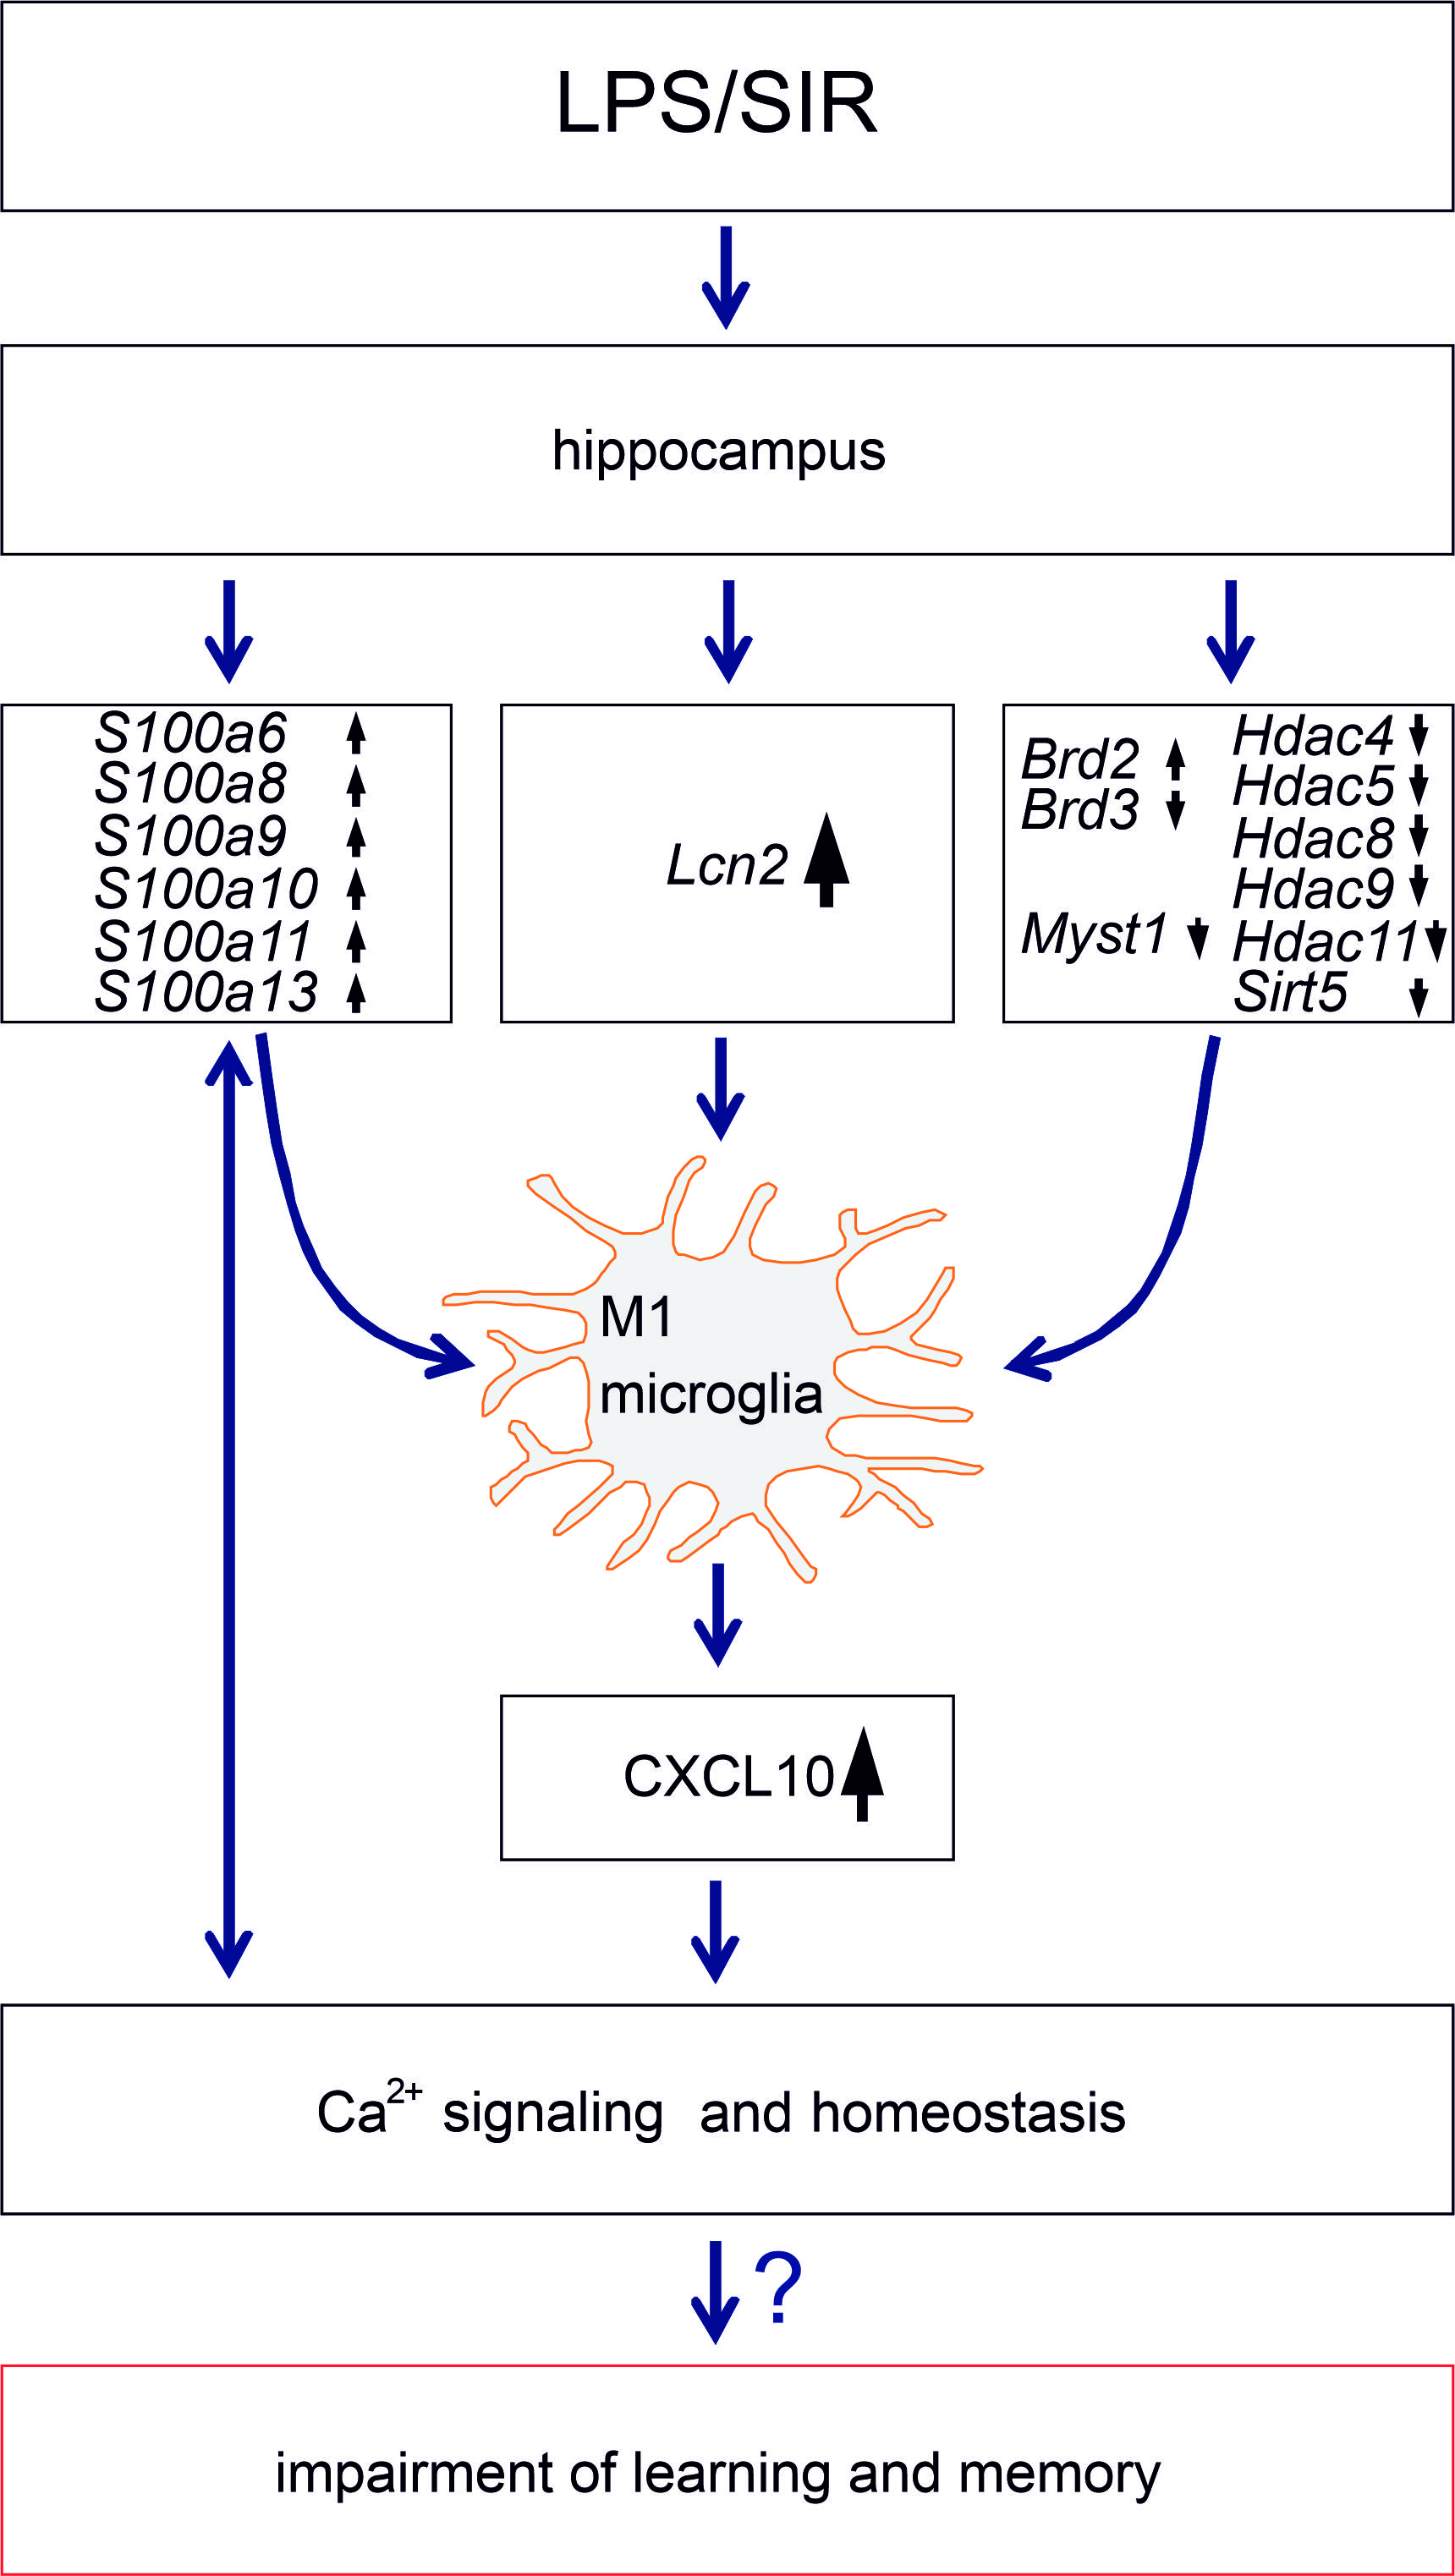
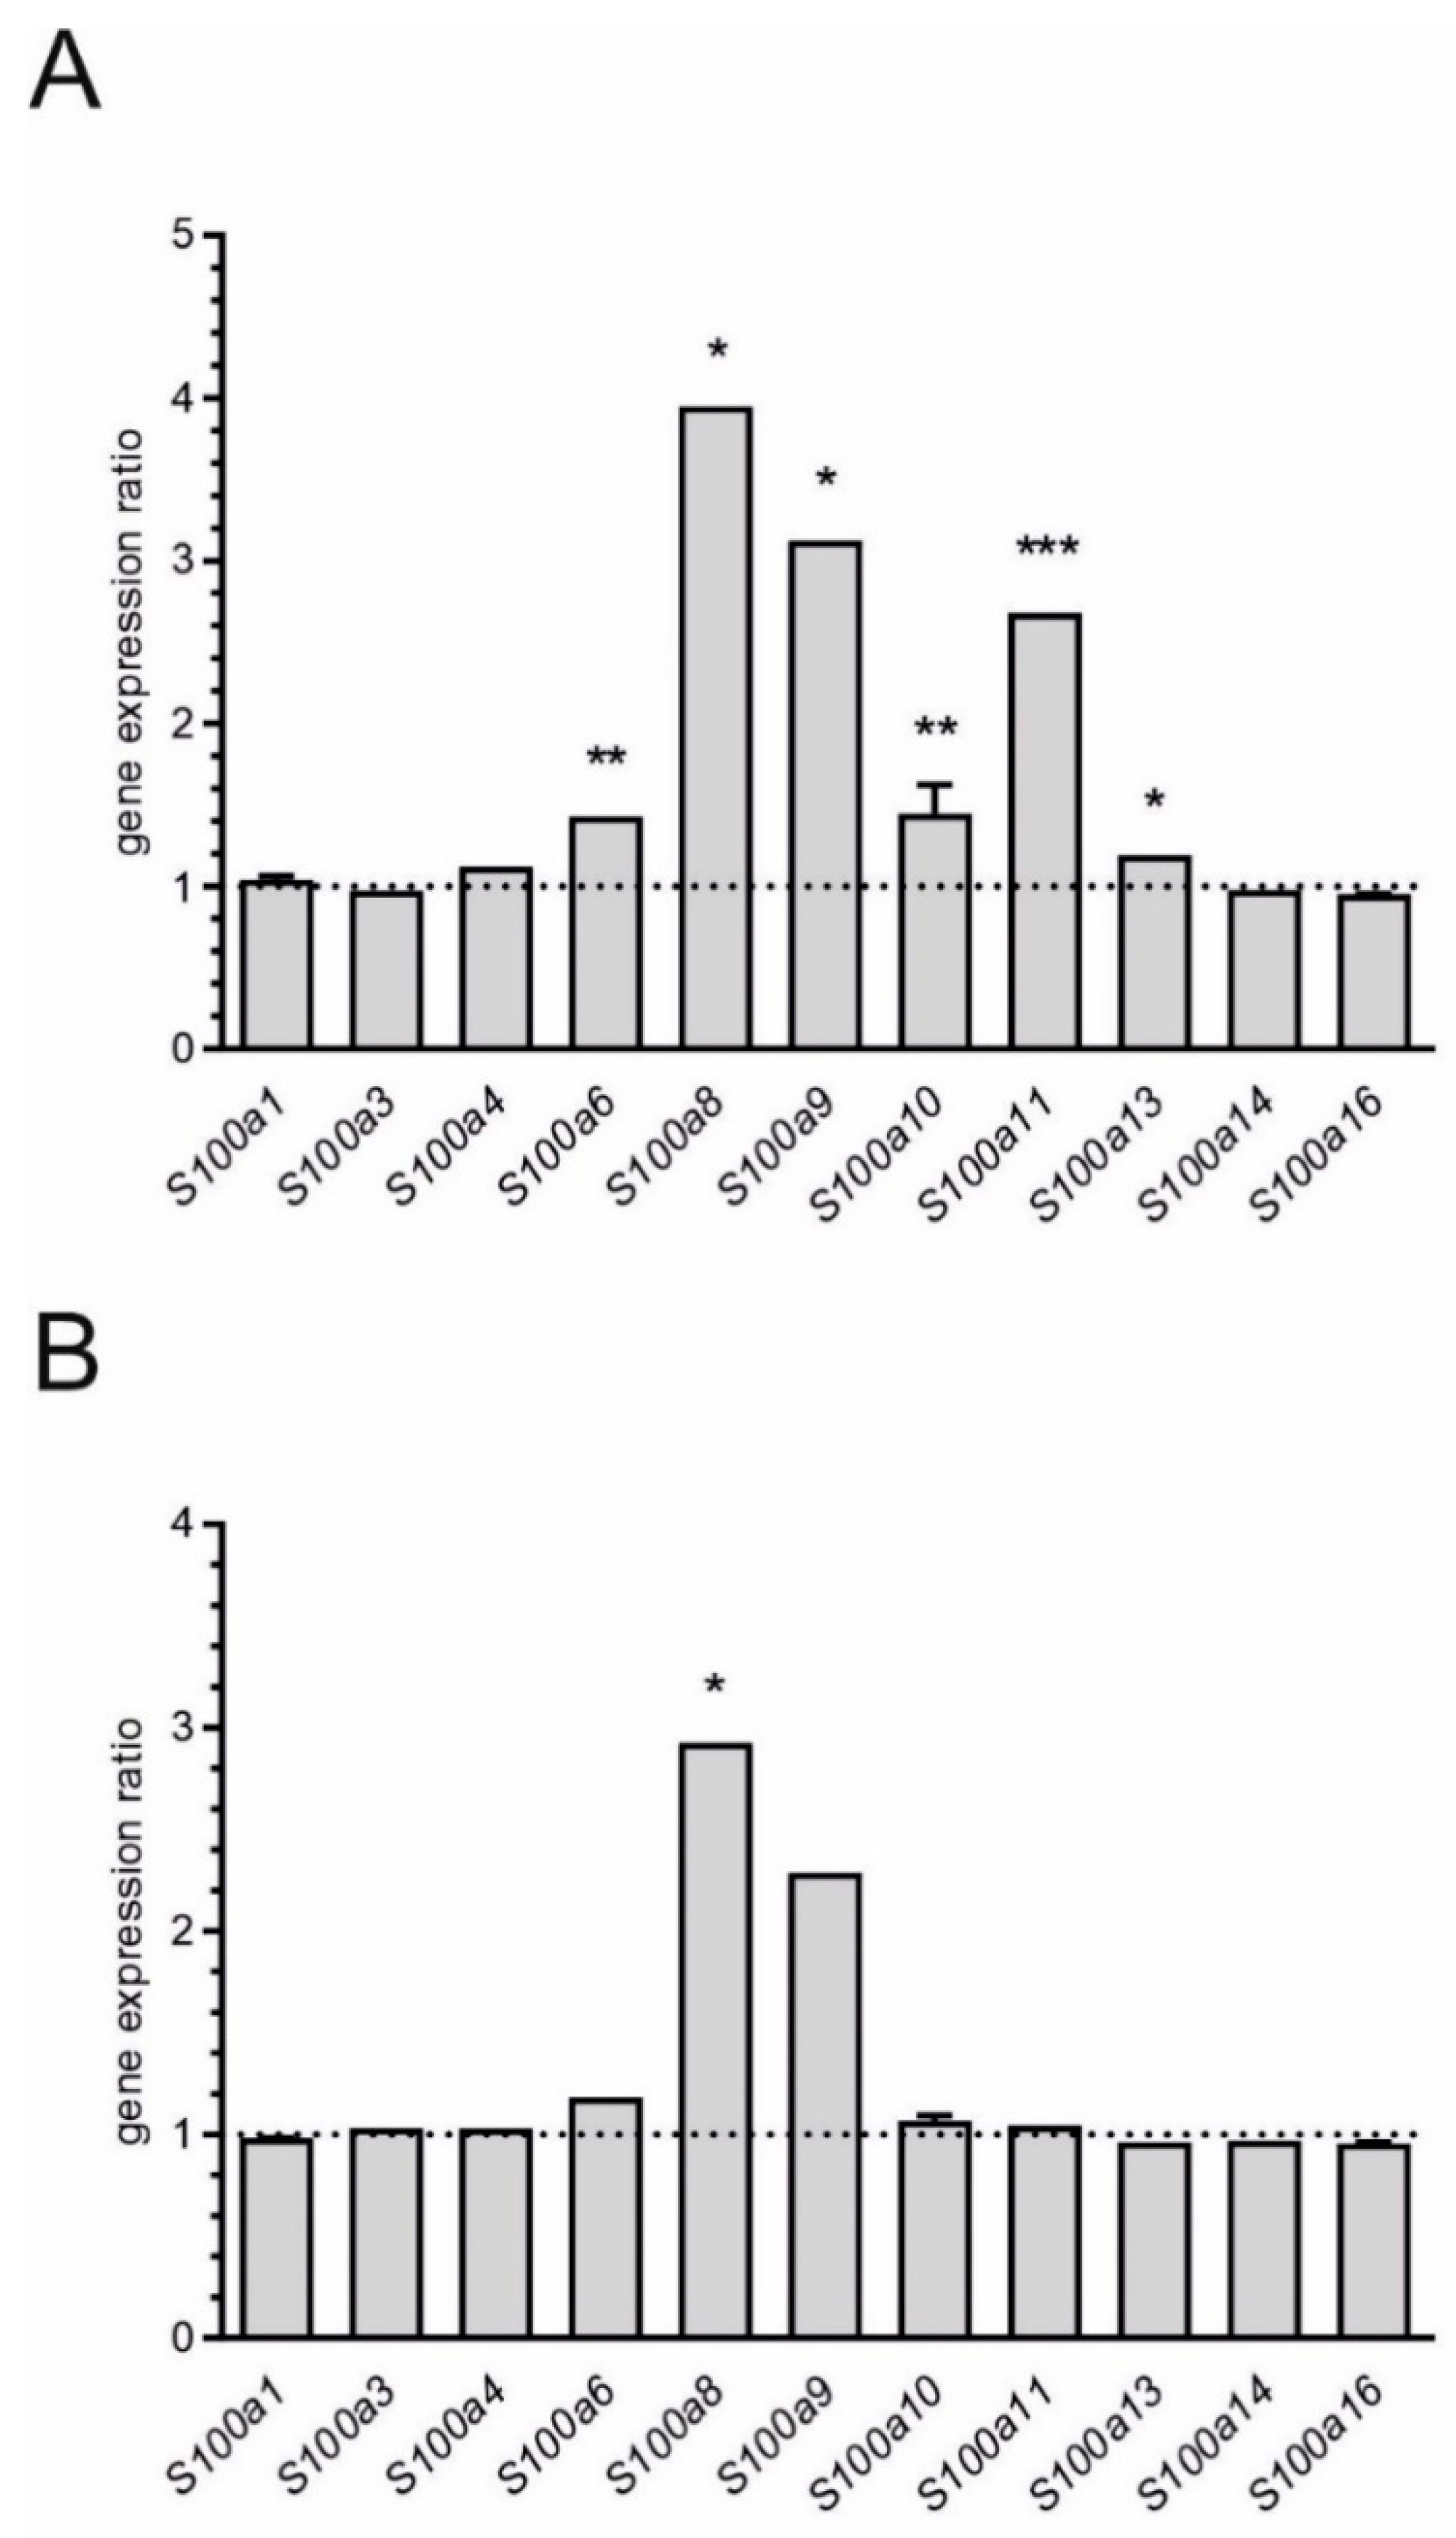
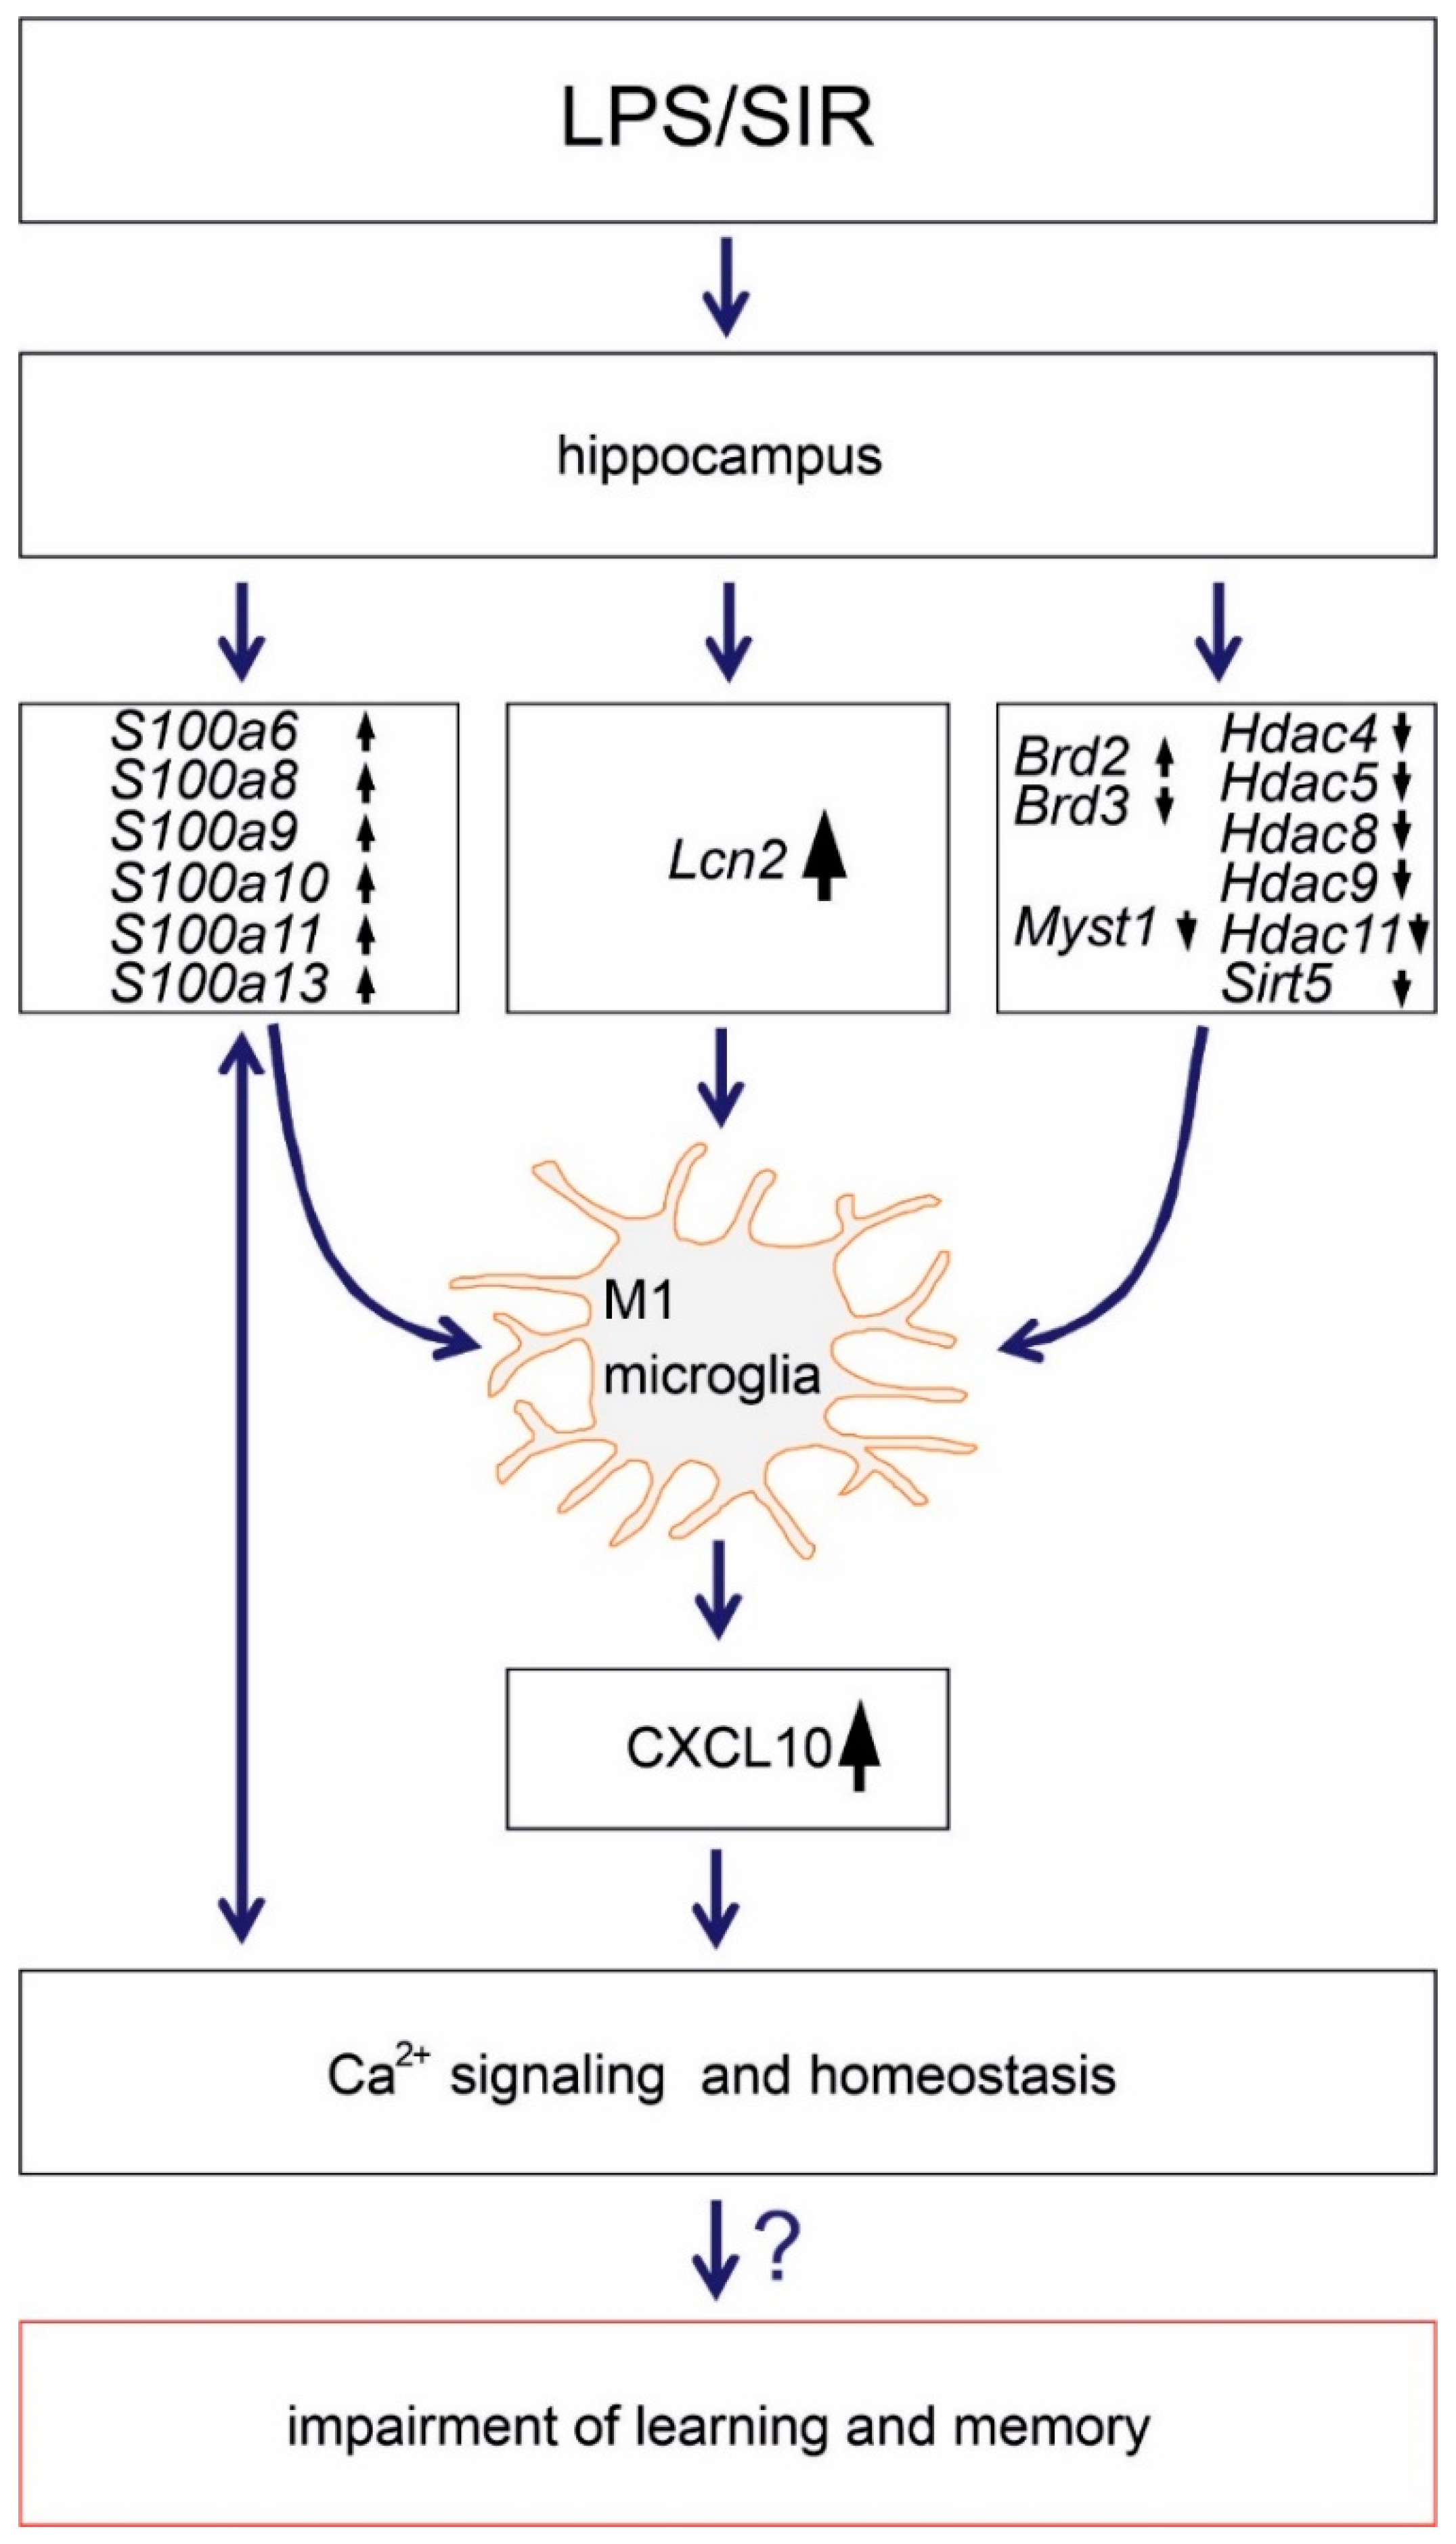
 and
and  indicate an increase and a decrease in gene expression, respectively.
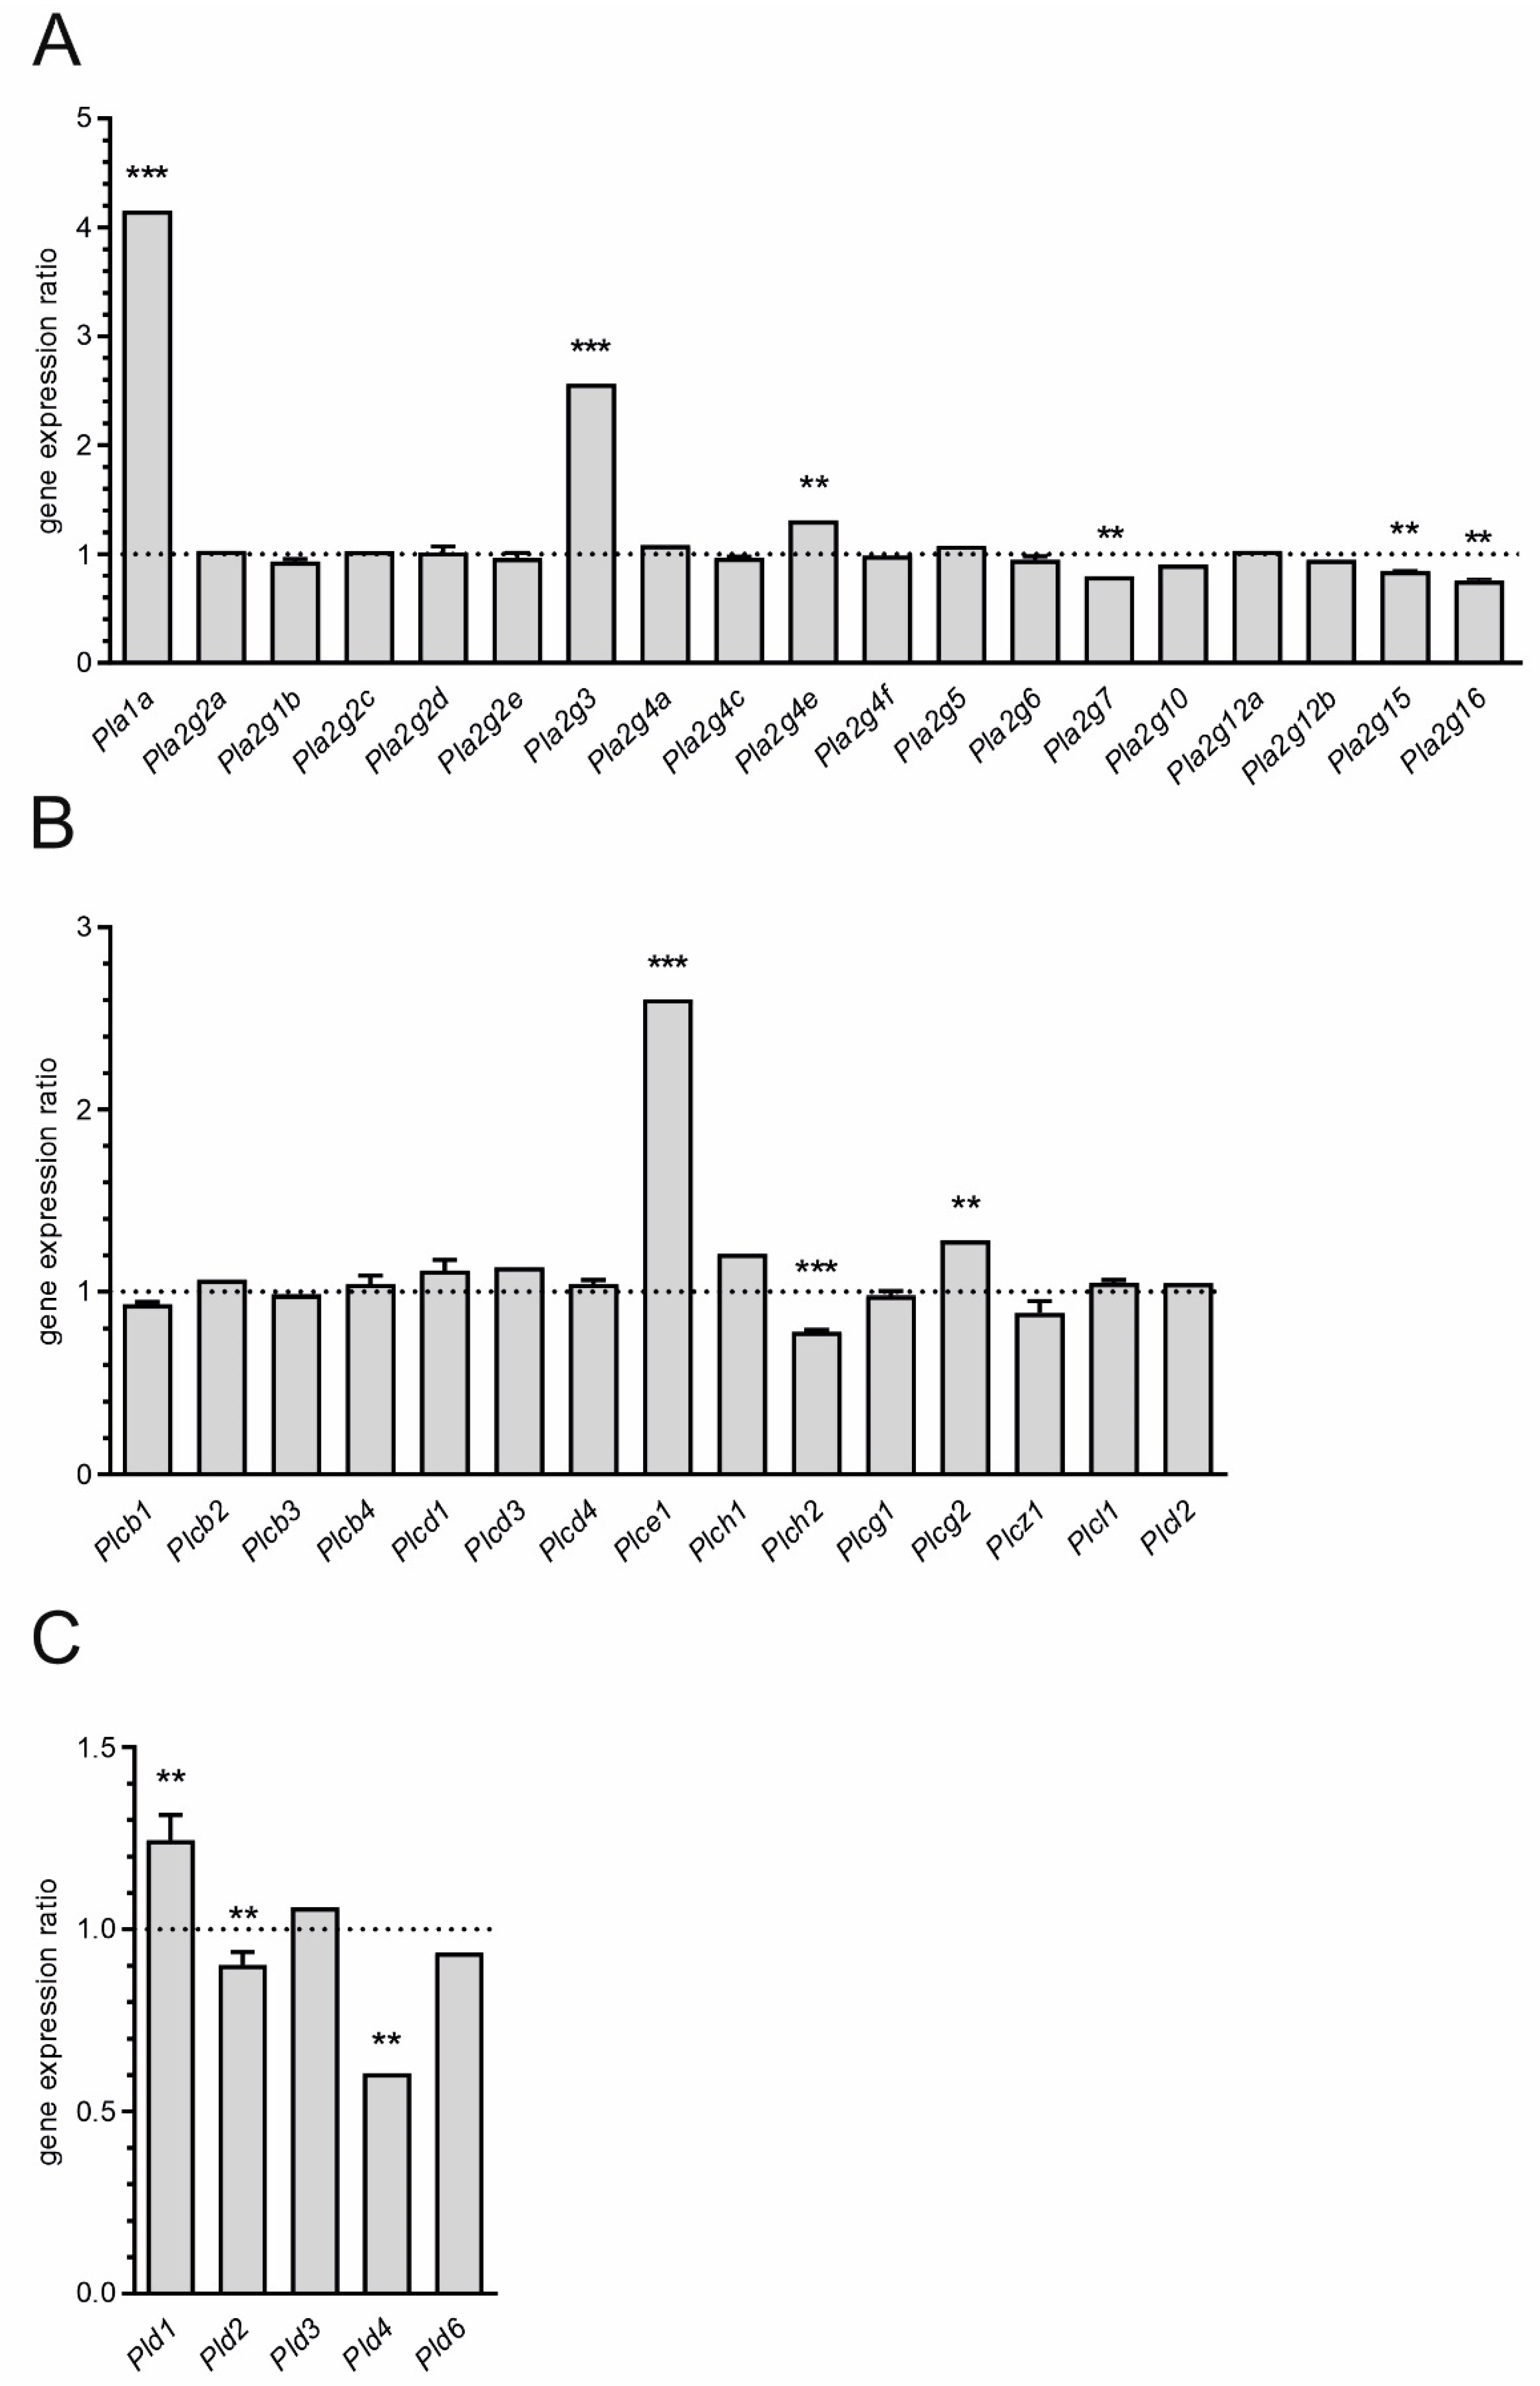
and indicate an increase and a decrease in gene expression, respectively.
indicate an increase and a decrease in gene expression, respectively.
and indicate an increase and a decrease in gene expression, respectively.

| Part A: List of 10 the Most Upregulated Genes (FDR < 0.05) | ||
|---|---|---|
| Gene Symbol | Gene Title | FC |
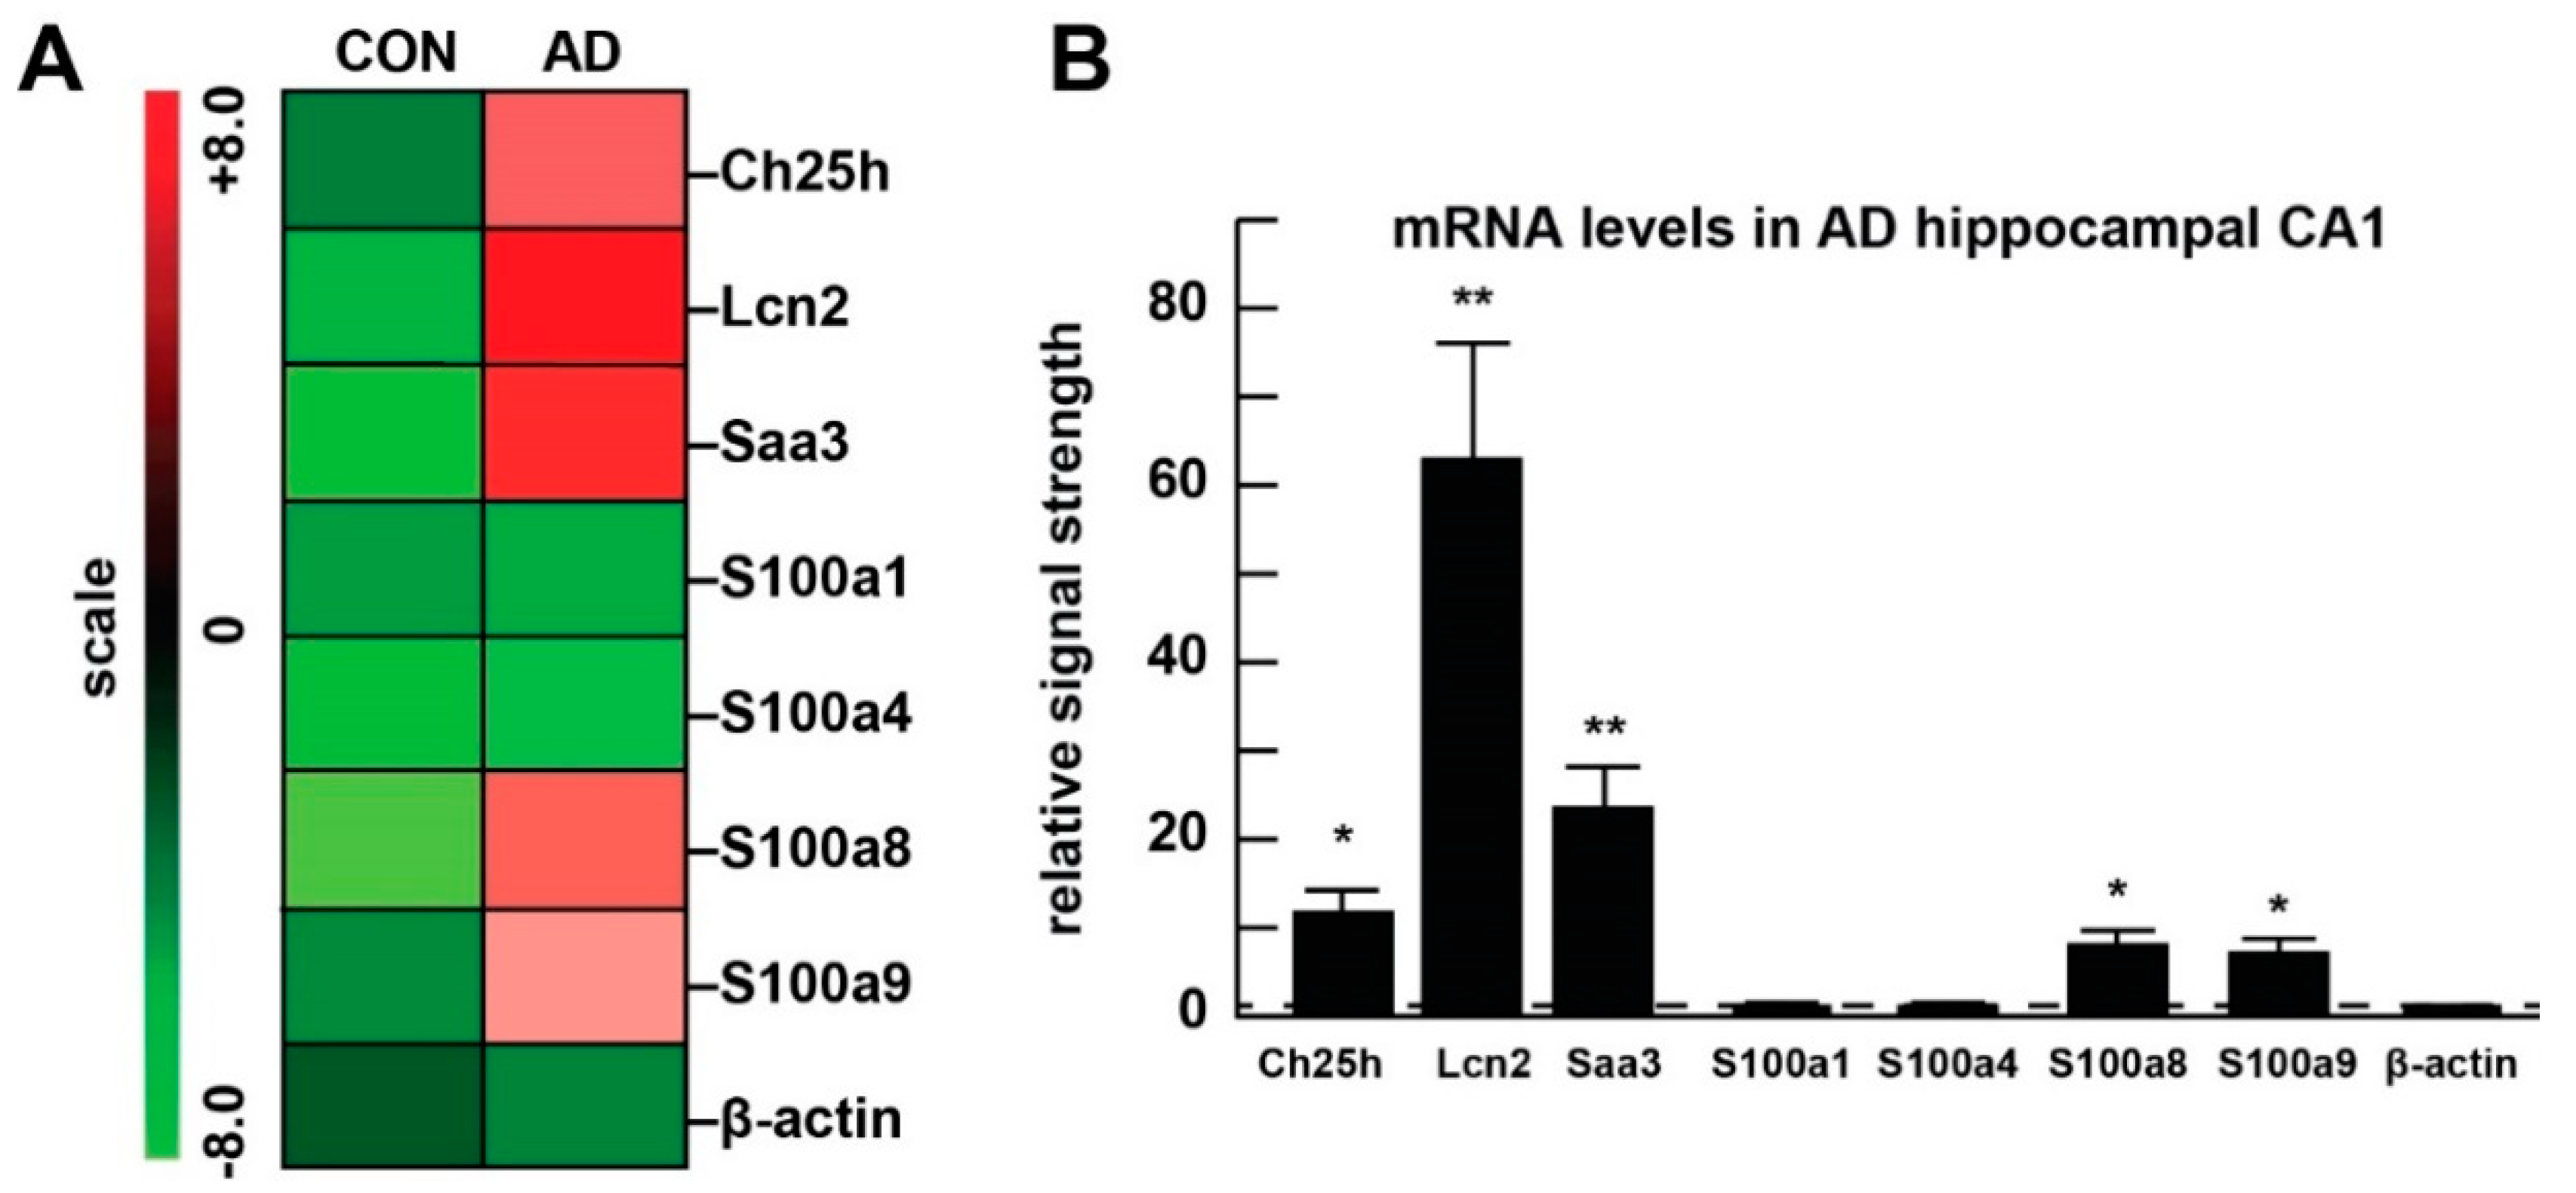
| Lcn2 | lipocalin 2 | 237.80 |
| Saa3 | serum amyloid A 3 | 53.09 |
| Ms4a6d | membrane-spanning 4-domains, subfamily A, member 6D | 26.23 |
| Gbp2 | guanylate binding protein 2 | 22.32 |
| Ctla2a | cytotoxic T lymphocyte-associated protein 2 alpha | 15.50 |
| Ccl5 | chemokine (C-C motif) ligand 5 | 14.31 |
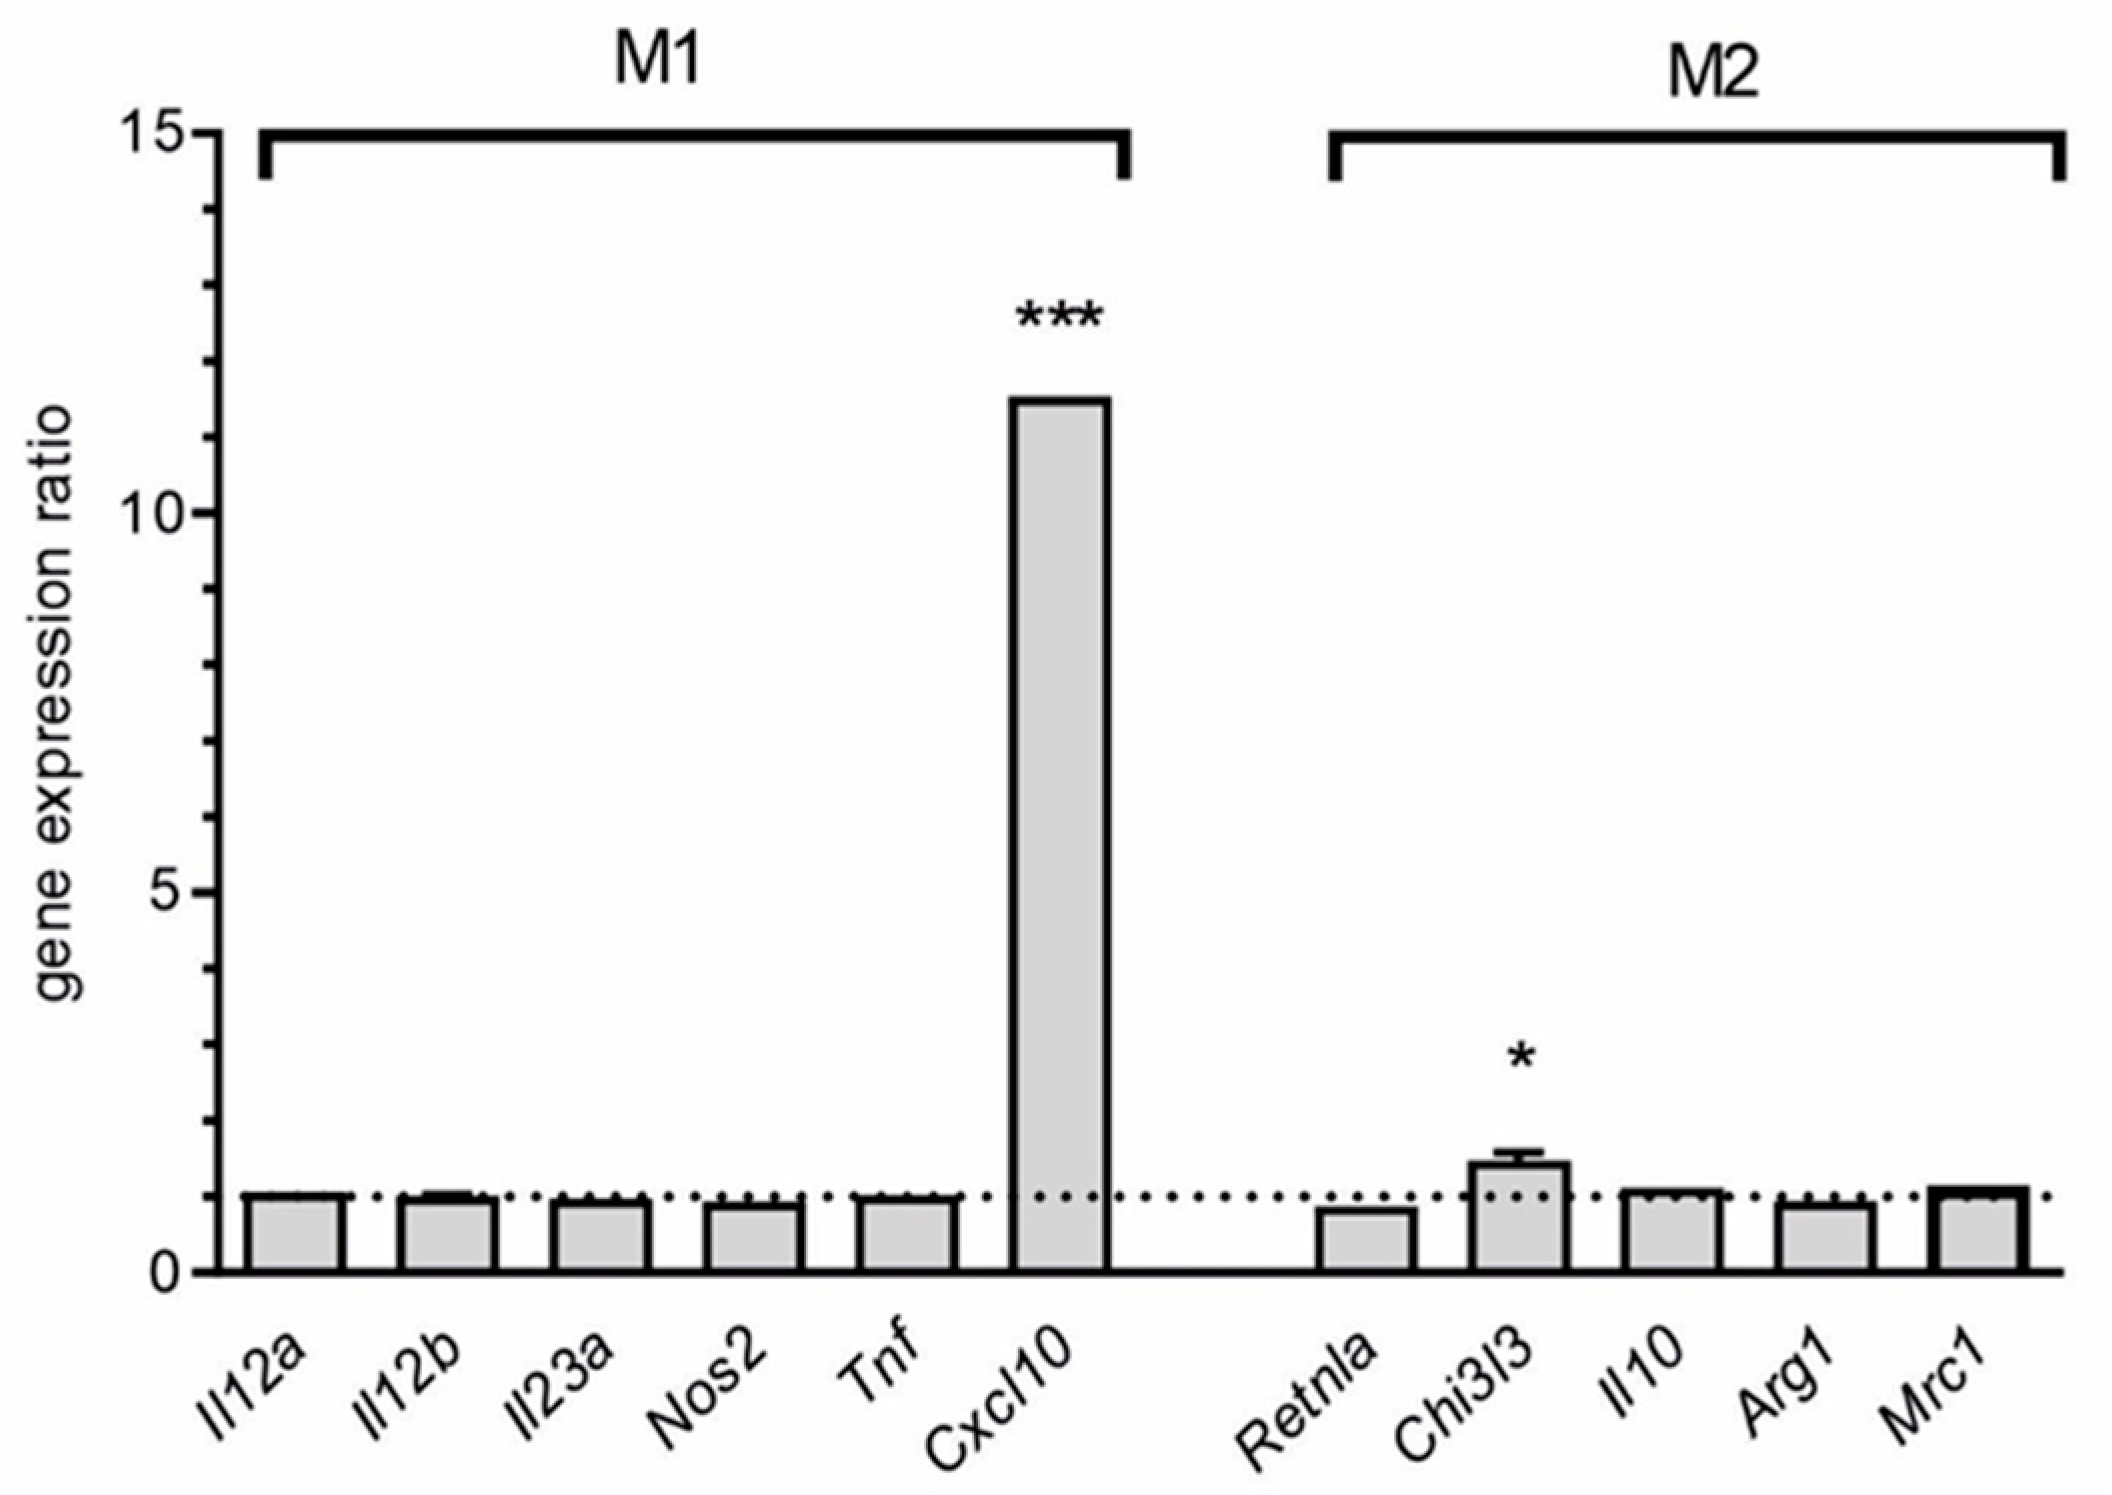
| Cxcl10 | chemokine (C-X-C motif) ligand 10 | 12.15 |
| Lrg1 | leucine-rich alpha-2-glycoprotein 1 | 11.34 |
| Ch25h | cholesterol 25-hydroxylase | 10.43 |
| Ctla2b | cytotoxic T lymphocyte-associated protein 2 beta | 10.01 |
| Part B: List of 10 the Most Downregulated Genes (FDR < 0.05) | ||
| Gene Symbol | Gene Title | FC |
| Gpr34 | G protein-coupled receptor 34 | −7.85 |
| P2ry12 | purinergic receptor P2Y, G-protein coupled 12 | −4.61 |
| Serpinb1a | serine (or cysteine) peptidase inhibitor, clade B, member 1a | −3.75 |
| Akr1c14 | aldo-keto reductase family 1, member C14 | −3.56 |
| Itm2a | integral membrane protein 2A | −3.51 |
| Cxcl12 | chemokine (C-X-C motif) ligand 12 | −3.45 |
| Ugt8a | UDP galactosyltransferase 8A | −3.10 |
| Tek | endothelial-specific receptor tyrosine kinase | −3.06 |
| Slco1c1 | solute carrier organic anion transporter family, member 1c1 | −2.88 |
| Slc40a1 | solute carrier family 40 (iron-regulated transporter), member 1 | −2.71 |
| Group | n | Age x+/−SD | Age Range | Mean PMI *1 | RNA A260/280 | RNA 28S/18S | RNA Yield *2 |
|---|---|---|---|---|---|---|---|
| Control (CON) | 30 | 71.5+/−6.1 | 64–77 | 3.0 | 2.10 | 1.50 | 1.3 |
| Alzheimer (AD) | 36 | 72.2+/−7.6 | 66–79 | 3.1 | 2.09 | 1.45 | 1.3 |
Publisher’s Note: MDPI stays neutral with regard to jurisdictional claims in published maps and institutional affiliations. |
© 2020 by the authors. Licensee MDPI, Basel, Switzerland. This article is an open access article distributed under the terms and conditions of the Creative Commons Attribution (CC BY) license (http://creativecommons.org/licenses/by/4.0/).
Share and Cite
Czapski, G.A.; Zhao, Y.; Lukiw, W.J.; Strosznajder, J.B. Acute Systemic Inflammatory Response Alters Transcription Profile of Genes Related to Immune Response and Ca2+ Homeostasis in Hippocampus; Relevance to Neurodegenerative Disorders. Int. J. Mol. Sci. 2020, 21, 7838. https://doi.org/10.3390/ijms21217838
Czapski GA, Zhao Y, Lukiw WJ, Strosznajder JB. Acute Systemic Inflammatory Response Alters Transcription Profile of Genes Related to Immune Response and Ca2+ Homeostasis in Hippocampus; Relevance to Neurodegenerative Disorders. International Journal of Molecular Sciences. 2020; 21(21):7838. https://doi.org/10.3390/ijms21217838
Chicago/Turabian StyleCzapski, Grzegorz A., Yuhai Zhao, Walter J. Lukiw, and Joanna B. Strosznajder. 2020. "Acute Systemic Inflammatory Response Alters Transcription Profile of Genes Related to Immune Response and Ca2+ Homeostasis in Hippocampus; Relevance to Neurodegenerative Disorders" International Journal of Molecular Sciences 21, no. 21: 7838. https://doi.org/10.3390/ijms21217838