Blood Metabolite Signature of Metabolic Syndrome Implicates Alterations in Amino Acid Metabolism: Findings from the Baltimore Longitudinal Study of Aging (BLSA) and the Tsuruoka Metabolomics Cohort Study (TMCS)

 , , , , and
Abstract
:1. Introduction
2. Results
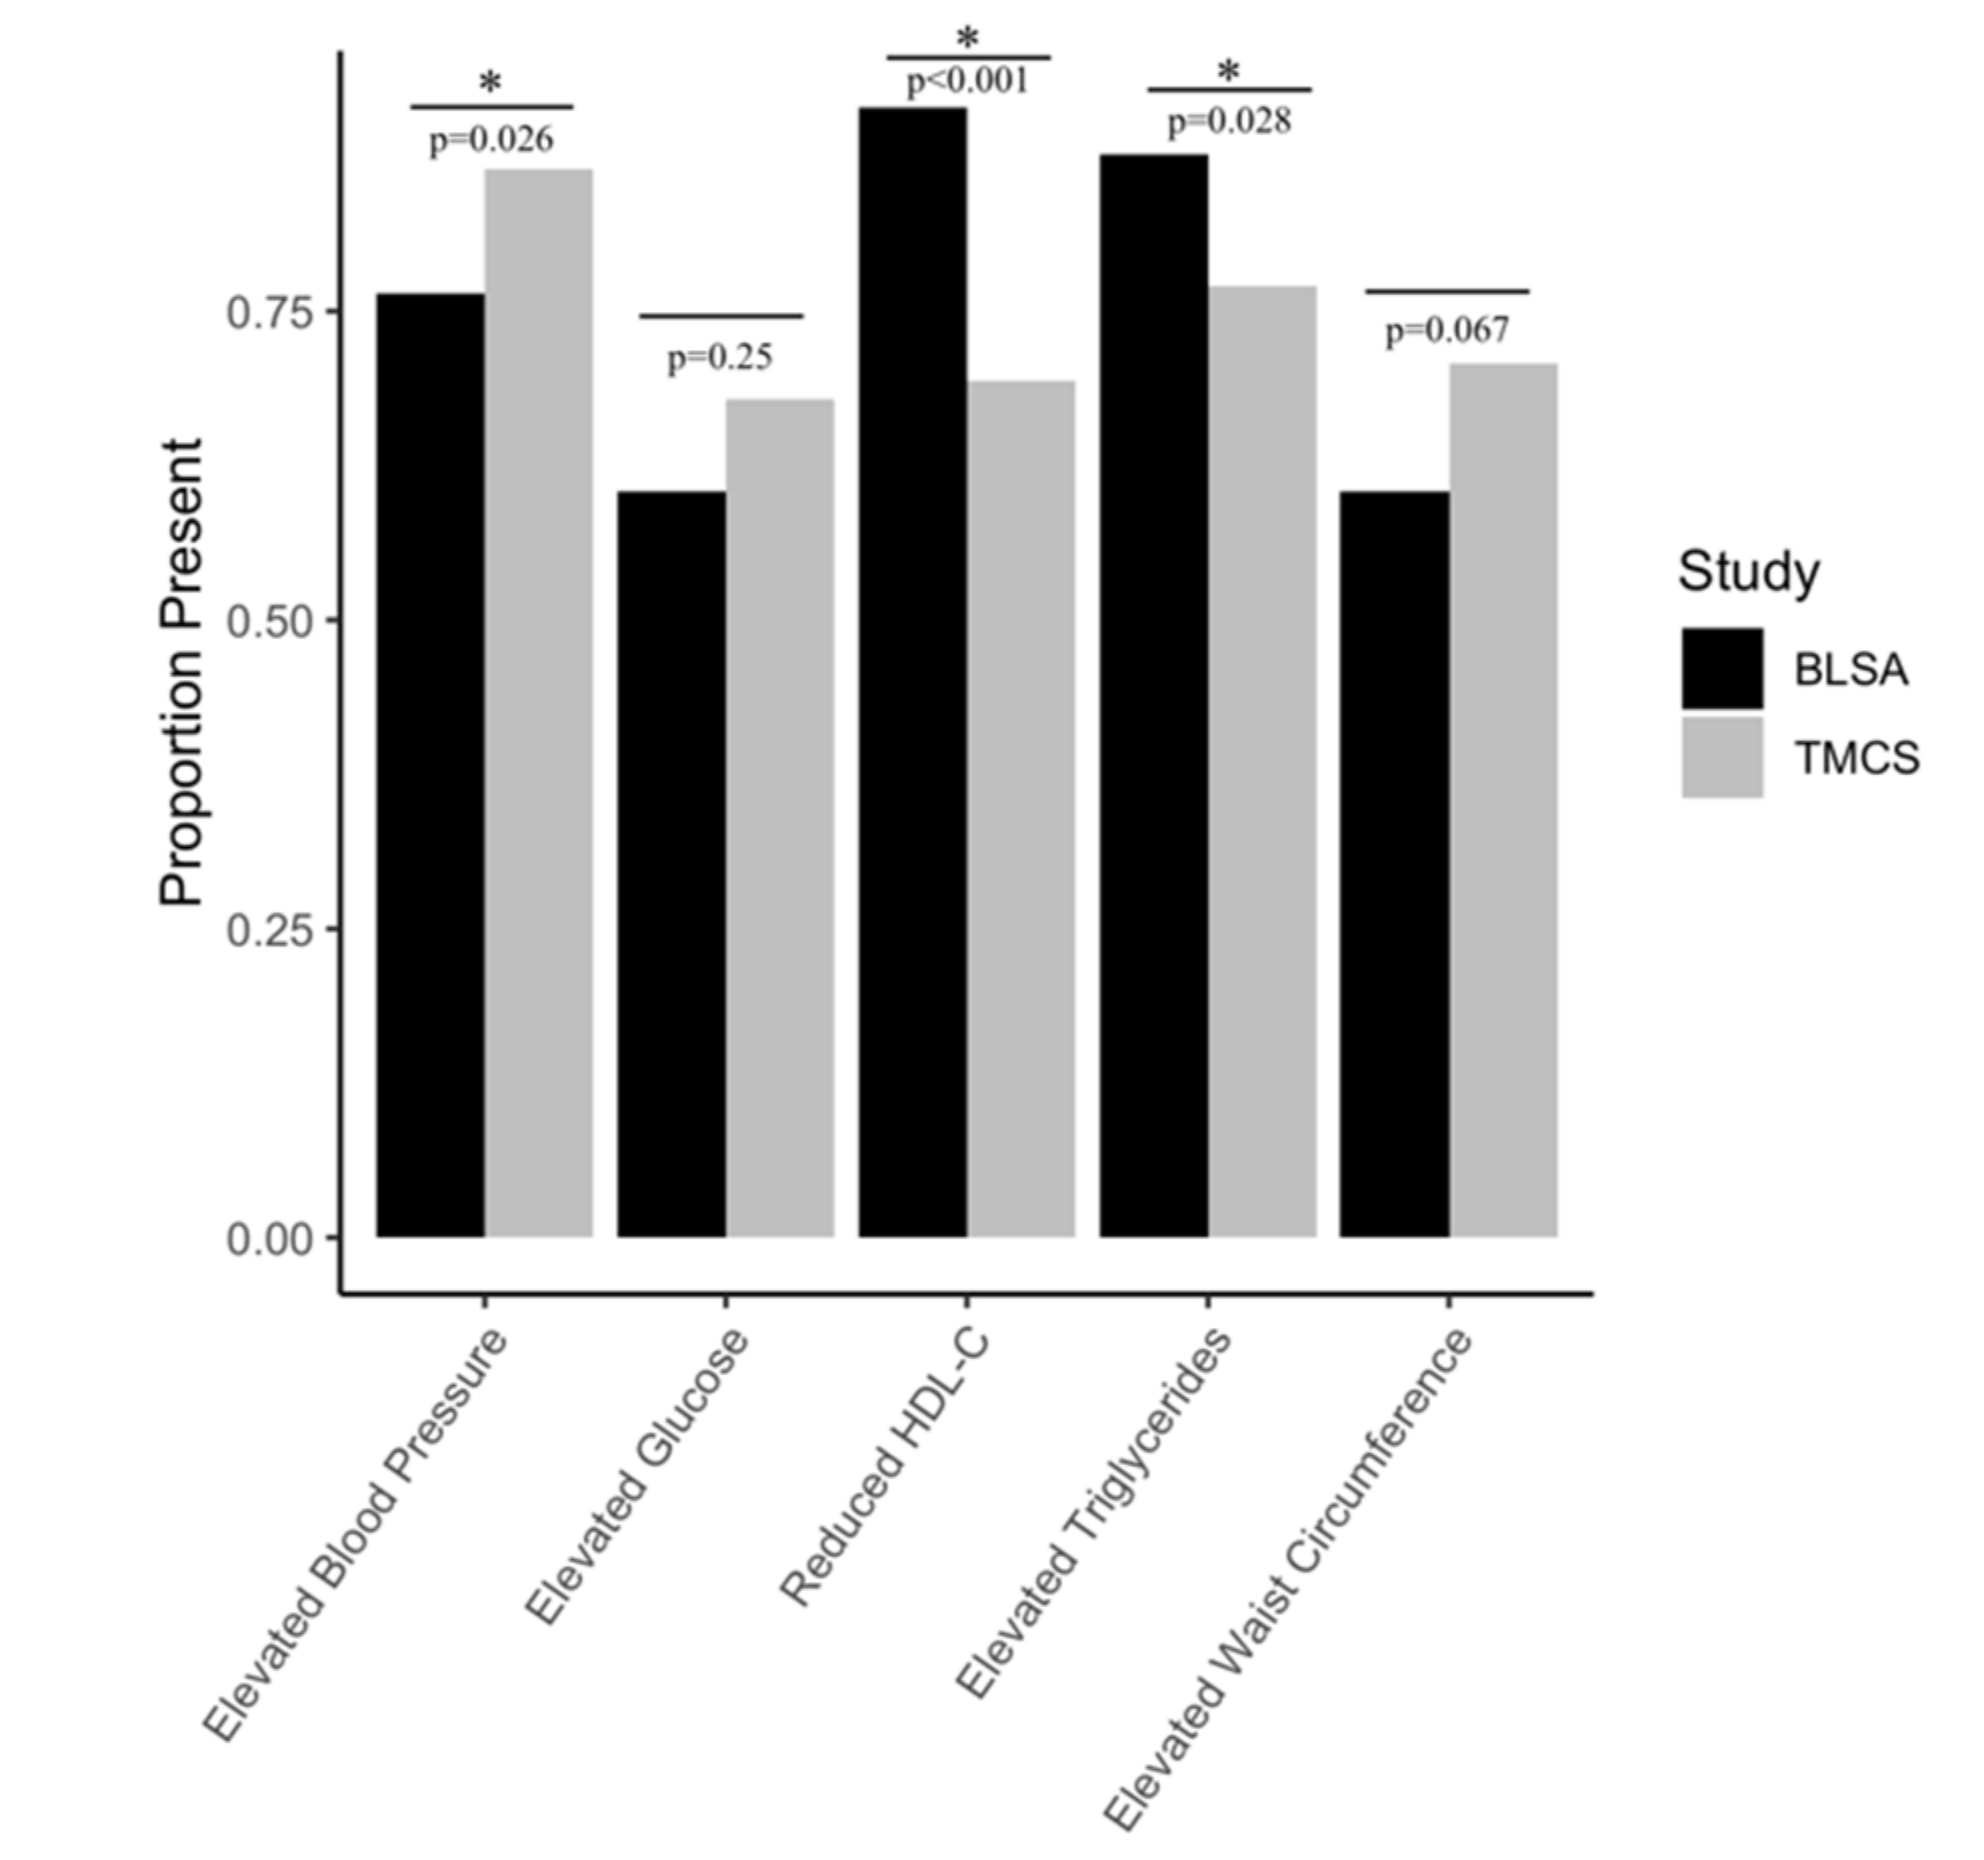
2.1. Participants
2.2. Metabolite Concentrations and Classifications
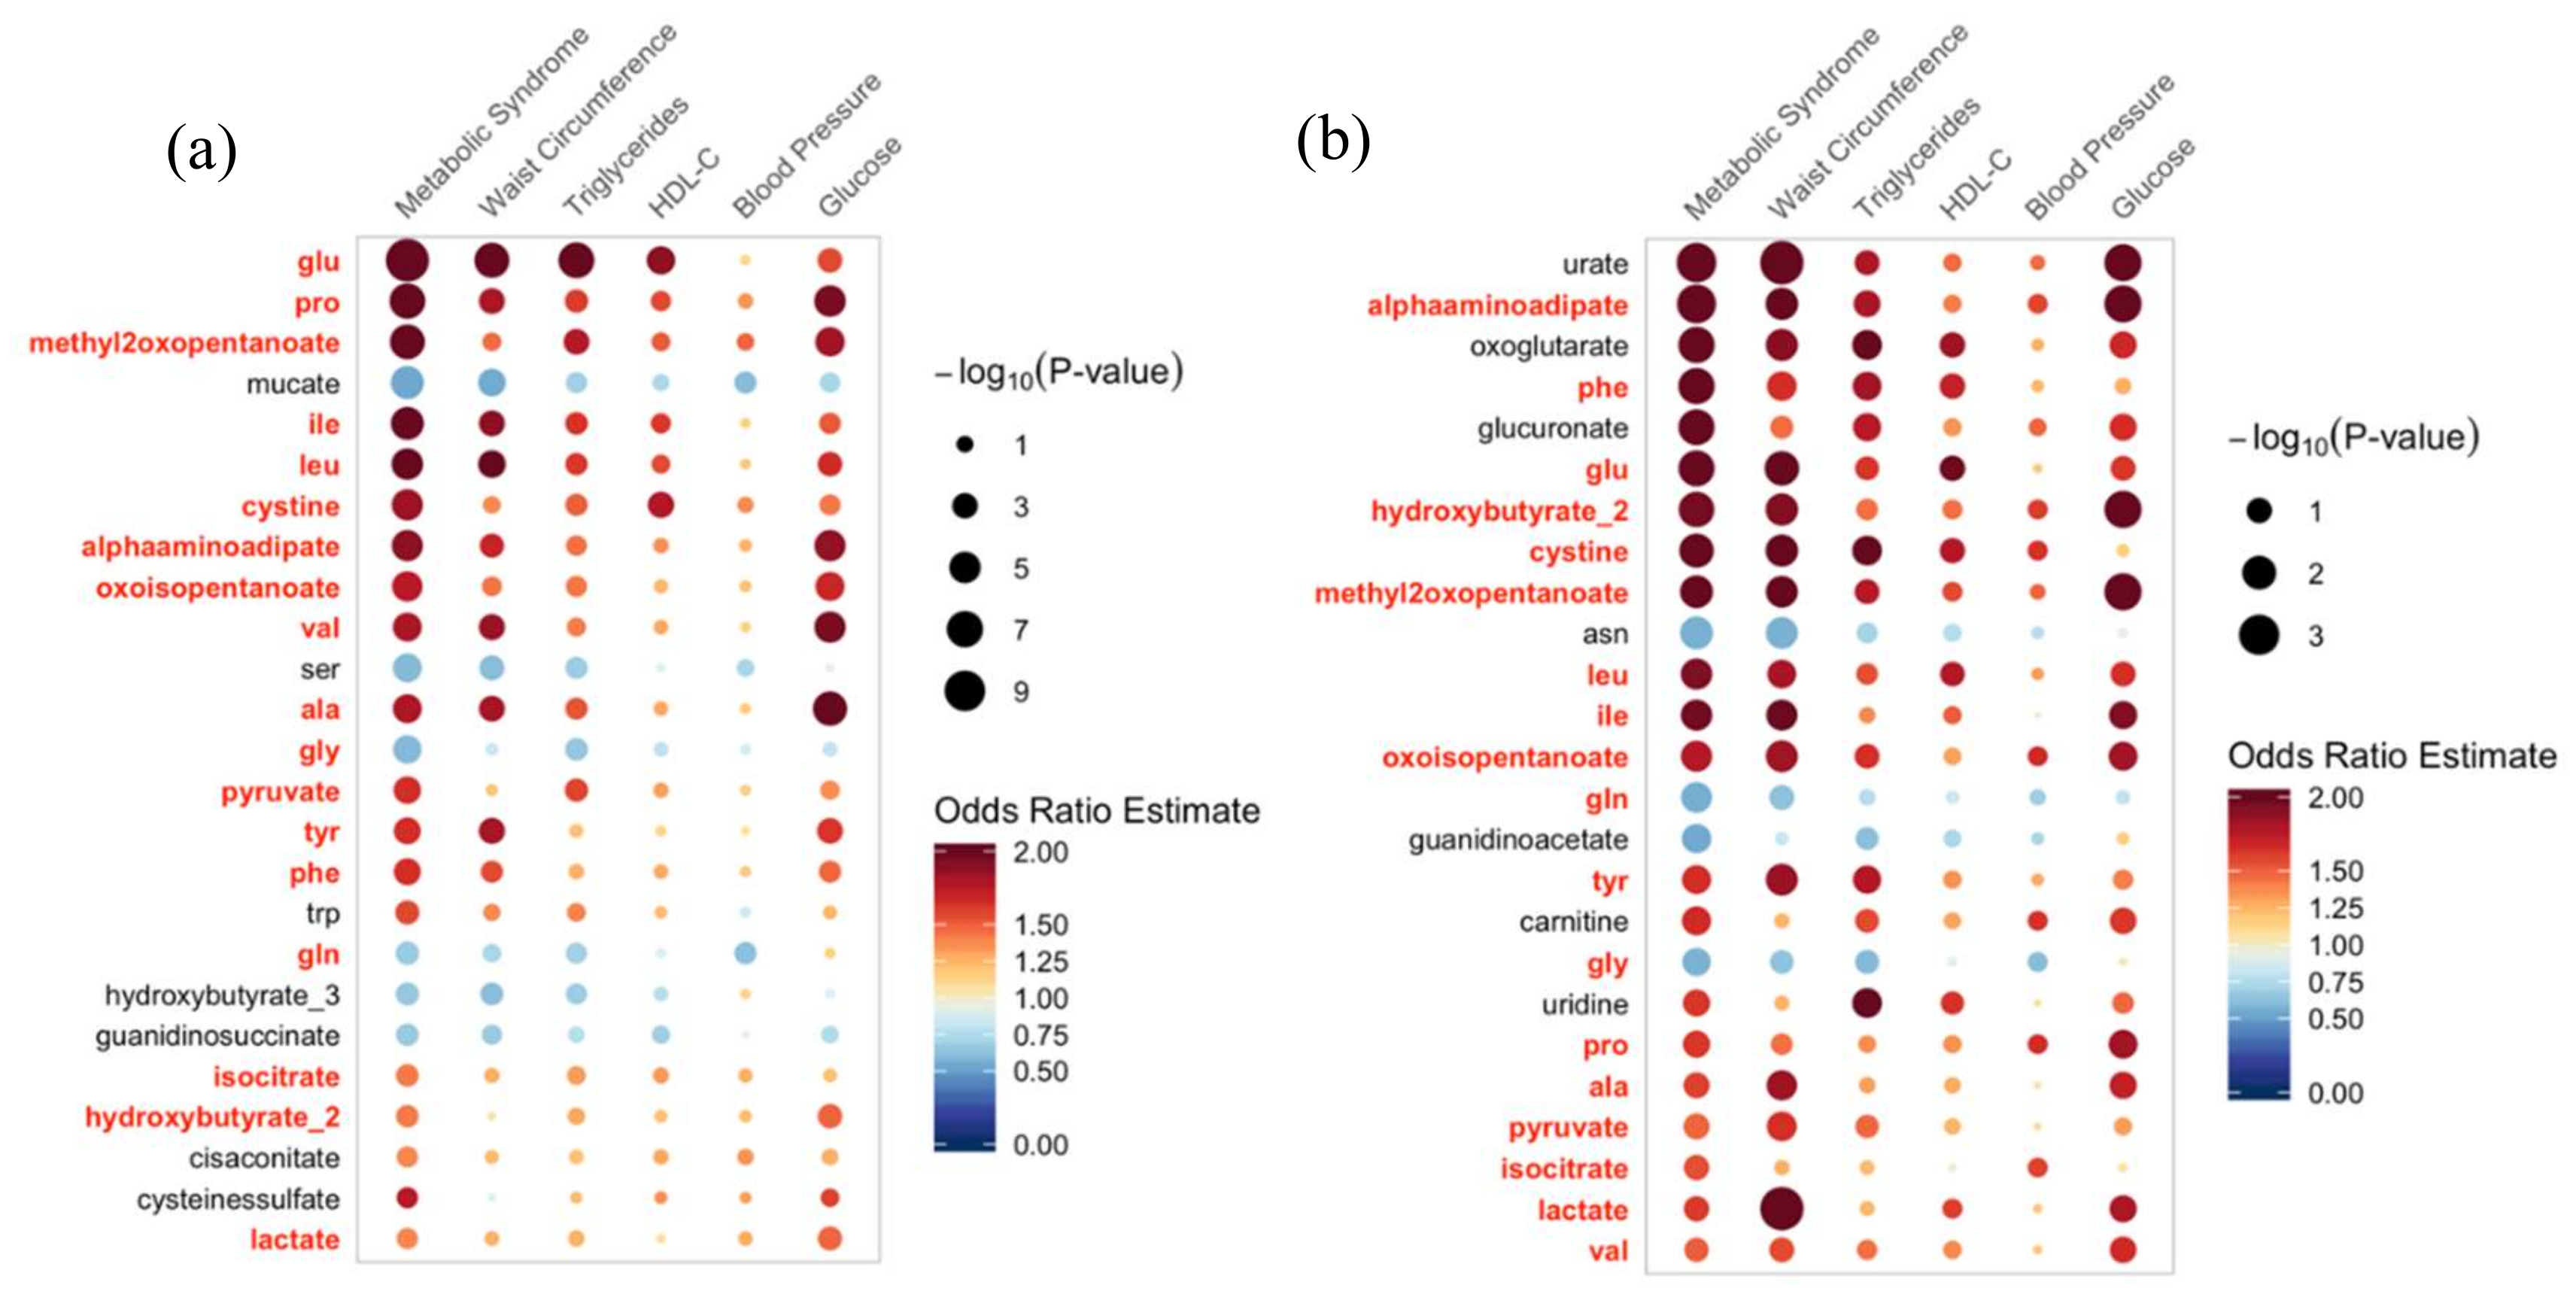
2.3. Associations with Metabolic Risk Factors
2.4. Metabolite Classes Associated with MetS
3. Discussion
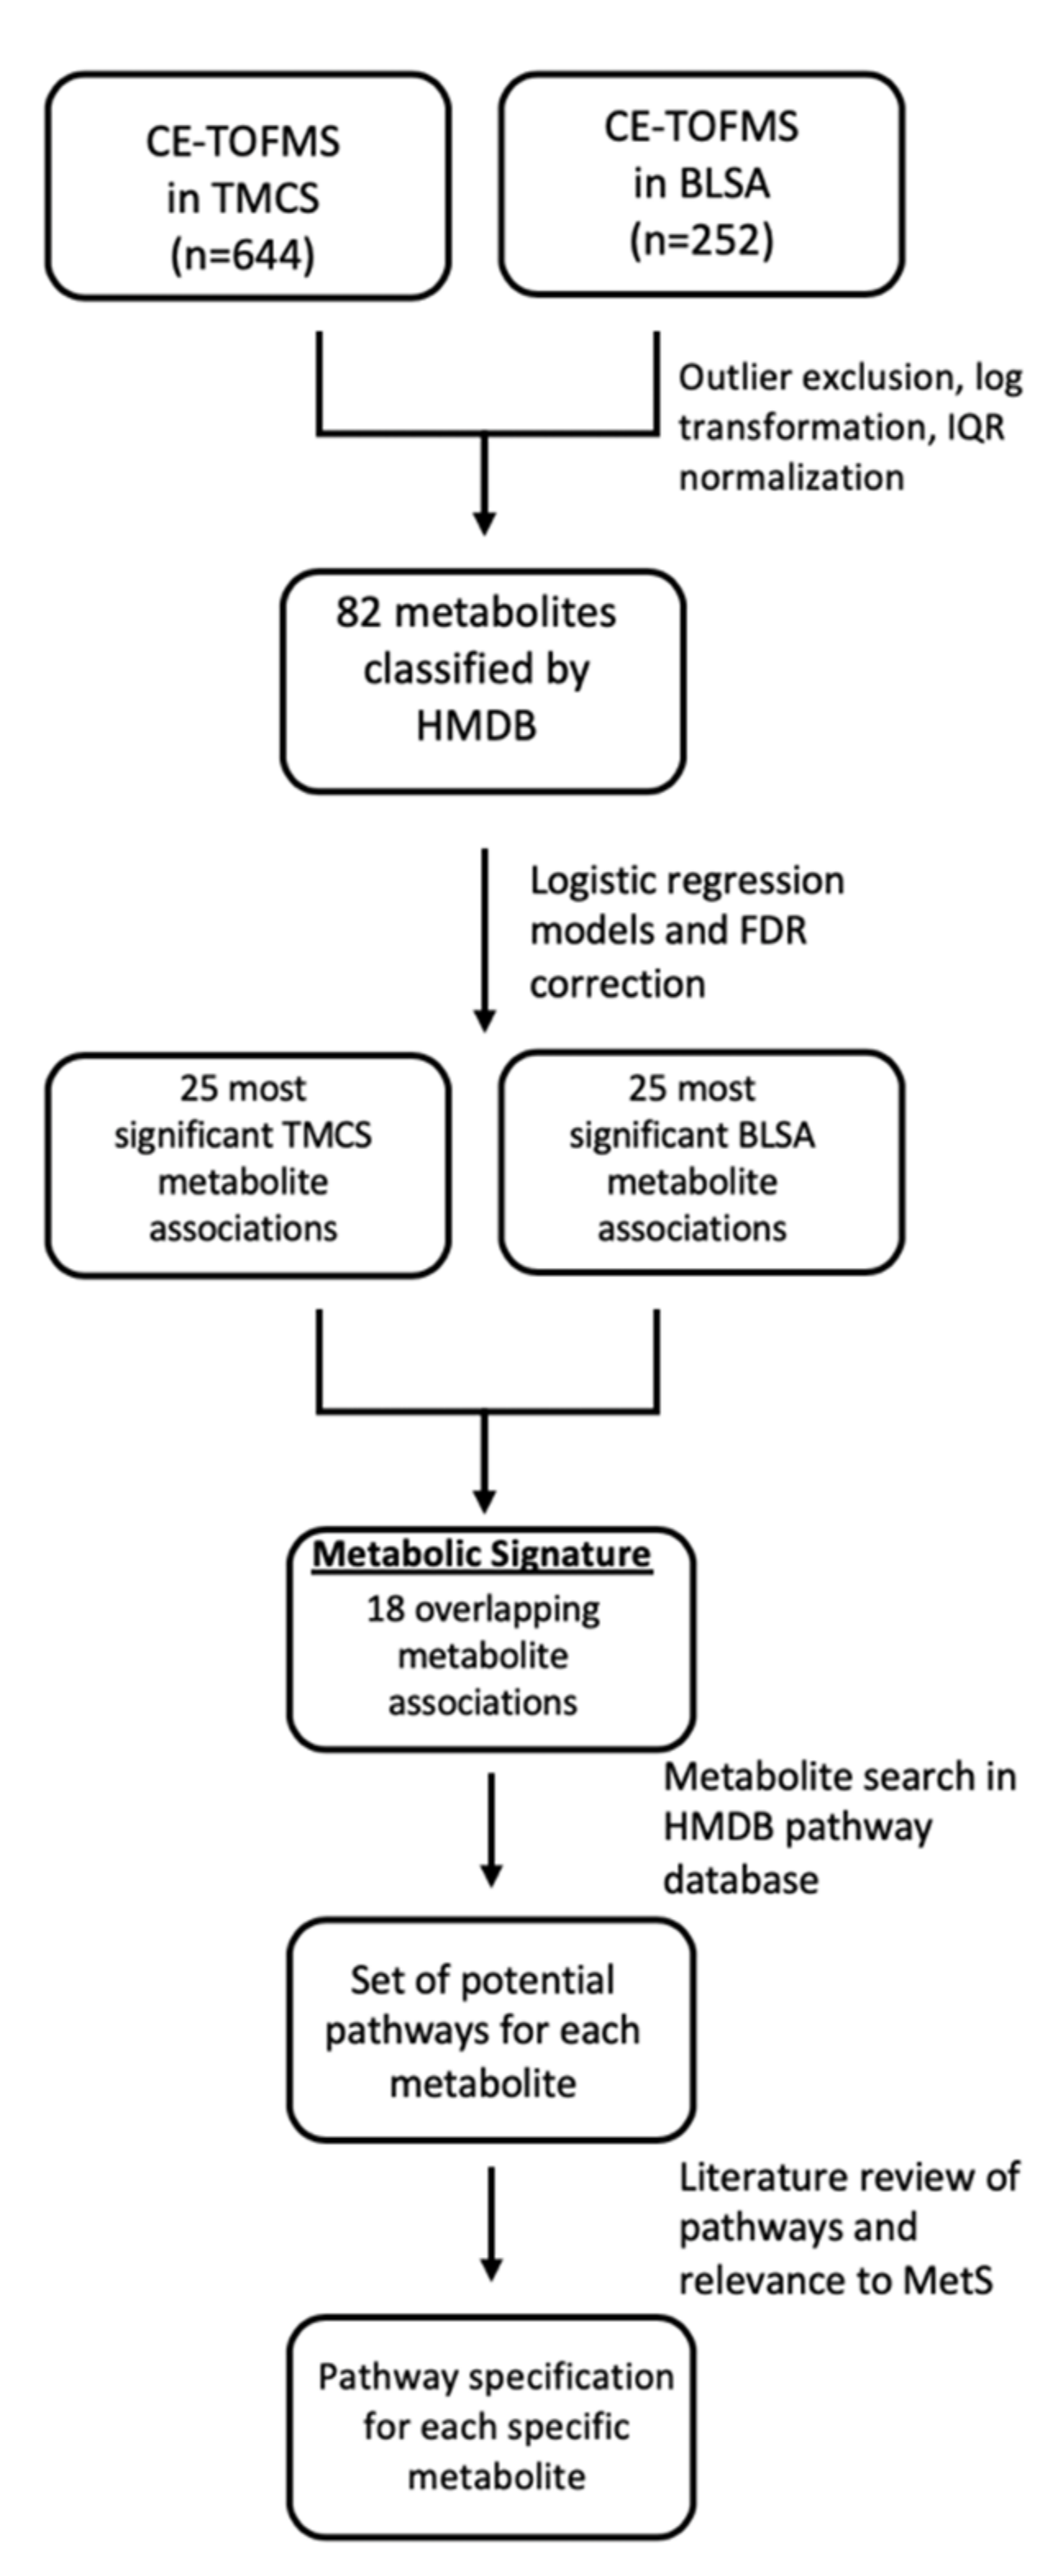
4. Methods
4.1. Participants
4.2. Blood Samples
4.3. Metabolites
4.3.1. Metabolite Extraction
4.3.2. Capillary Electrophoresis Time-of-Flight Mass Spectrometry (CE-TOFMS)
4.4. Metabolite Classifications
4.5. Outcomes
4.5.1. Definition of MetS
4.5.2. Individual Risk Factors
4.6. Statistical Analyses
Supplementary Materials
Author Contributions
Funding
Acknowledgments
Conflicts of Interest
Abbreviations
| BLSA | Baltimore Longitudinal Study of Aging |
| TMCS | Tsuruoka Metabolomics Cohort Study |
| MetS | Metabolic Syndrome |
| CE-TOFMS | Capillary electrophoresis time-of-flight mass spectrometry |
| AD | Alzheimer’s disease |
| HMDB | Human Metabolome Database |
| FDR | False-discovery rate |
| PA | Physical activity |
| MET | Metabolic equivalent |
| DASH | Dietary Approaches to Stop Hypertension |
| LOD | Limit of detection |
| IQR | Interquartile range |
| BCAA | Branched-chain amino acid |
| BCKA | Branched-chain keto acid |
| GSH | Glutathione |
| TCA | Tricarboxylic acid |
References
- Ford, E.S. Risks for all-cause mortality, cardiovascular disease, and diabetes associated with the metabolic syndrome—A summary of the evidence. Diabetes Care 2005, 28, 1769–1778. [Google Scholar] [CrossRef] [PubMed] [Green Version]
- Galassi, A.; Reynolds, K.; He, J. Metabolic syndrome and risk of cardiovascular disease: A meta-analysis. Am. J. Med. 2006, 119, 812–819. [Google Scholar] [CrossRef] [PubMed]
- Chen, W.; Pan, Y.; Jing, J.; Zhao, X.; Liu, L.; Meng, X.; Wang, Y.; Wang, Y.; Investigators, C. Recurrent Stroke in Minor Ischemic Stroke or Transient Ischemic Attack With Metabolic Syndrome and/or Diabetes Mellitus. J. Am. Heart Assoc. 2017, 6. [Google Scholar] [CrossRef] [PubMed] [Green Version]
- Razay, G.; Vreugdenhil, A.; Wilcock, G. The metabolic syndrome and Alzheimer disease. Arch. Neurol. 2007, 64, 93–96. [Google Scholar] [CrossRef] [PubMed] [Green Version]
- Grundy, S.M.; Cleeman, J.I.; Daniels, S.R.; Donato, K.A.; Eckel, R.H.; Franklin, B.A.; Gordon, D.J.; Krauss, R.M.; Savage, P.J.; Smith, S.C., Jr.; et al. Diagnosis and management of the metabolic syndrome: An American Heart Association/National Heart, Lung, and Blood Institute scientific statement: Executive Summary. Crit. Pathw. Cardiol. 2005, 4, 198–203. [Google Scholar] [CrossRef] [PubMed] [Green Version]
- Shin, D.; Kongpakpaisarn, K.; Bohra, C. Trends in the prevalence of metabolic syndrome and its components in the United States 2007-2014. Int. J. Cardiol. 2018, 259, 216–219. [Google Scholar] [CrossRef] [PubMed]
- Hu, F.B. Globalization of Diabetes The role of diet, lifestyle, and genes. Diabetes Care 2011, 34, 1249–1257. [Google Scholar] [CrossRef] [Green Version]
- Odegaard, A.O.; Koh, W.P.; Yuan, J.M.; Gross, M.D.; Pereira, M.A. Western-Style Fast Food Intake and Cardiometabolic Risk in an Eastern Country. Circulation 2012, 126, 182–188. [Google Scholar] [CrossRef] [Green Version]
- Ministry of Health LaWoJ. A Summary of the National Nutritional and Health Survey of 2016. Available online: https://www.mhlw.go.jp/bunya/kenkou/eiyou/dl/h28-houkoku.pdf (accessed on 10 November 2019).
- Scholze, J.; Alegria, E.; Ferri, C.; Langham, S.; Stevens, W.; Jeffries, D.; Uhl-Hochgraeber, K. Epidemiological and economic burden of metabolic syndrome and its consequences in patients with hypertension in Germany, Spain and Italy; a prevalence-based model. BMC Public Health 2010, 10. [Google Scholar] [CrossRef] [Green Version]
- Dekker, J.M.; Girman, C.; Rhodes, T.; Nijpels, G.; Stehouwer, C.D.A.; Bouter, L.M.; Heine, R.J. Metabolic syndrome and 10-year cardiovascular disease risk in the hoorn study. Circulation 2005, 112, 666–673. [Google Scholar] [CrossRef]
- Exalto, L.G.; van der Flier, W.M.; van Boheemen, C.J.M.; Kappelle, L.J.; Vrenken, H.; Teunissen, C.; Koene, T.; Scheltens, P.; Biessels, G.J. The metabolic syndrome in a memory clinic population: Relation with clinical profile and prognosis. J. Neurol. Sci. 2015, 351, 18–23. [Google Scholar] [CrossRef] [PubMed]
- Raffaitin, C.; Gin, H.; Empana, J.P.; Helmer, C.; Berr, C.; Tzourio, C.; Portet, F.; Dartigues, J.F.; Alperovitch, A.; Barberger-Gateau, P. Metabolic Syndrome and Risk for Incident Alzheimer’s Disease or Vascular Dementia The Three-City Study. Diabetes Care 2009, 32, 169–174. [Google Scholar] [CrossRef] [PubMed] [Green Version]
- Vanhanen, M.; Koivisto, K.; Moilanen, L.; Helkala, E.L.; Hanninen, T.; Soininen, H.; Kervinen, K.; Kesaniemi, A.; Laakso, M.; Kuusisto, J. Association of metabolic syndrome with Alzheimer disease A population-based study. Neurology 2006, 67, 843–847. [Google Scholar] [CrossRef]
- Luque-Contreras, D.; Carvajal, K.; Toral-Rios, D.; Franco-Bocanegra, D.; Campos-Pena, V. Oxidative Stress and Metabolic Syndrome: Cause or Consequence of Alzheimer’s Disease? Oxid. Med. Cell. Longev. 2014. [Google Scholar] [CrossRef] [PubMed]
- Hasin, Y.; Seldin, M.; Lusis, A. Multi-omics approaches to disease. Genome Biol. 2017, 18, 83. [Google Scholar] [CrossRef]
- Johnson, C.H.; Ivanisevic, J.; Siuzdak, G. Metabolomics: Beyond biomarkers and towards mechanisms. Nat. Rev. Mol. Cell Biol. 2016, 17, 451–459. [Google Scholar] [CrossRef] [Green Version]
- Sallese, A.; Zhu, J.J. Mass spectrometry based metabolomics: A novel analytical technique for detecting metabolic syndrome? Bioanalysis 2017, 9, 1623–1626. [Google Scholar] [CrossRef]
- Pujos-Guillot, E.; Brandolini, M.; Petera, M.; Grissa, D.; Joly, C.; Lyan, B.; Herquelot, E.; Czernichow, S.; Zins, M.; Goldberg, M.; et al. Systems Metabolomics for Prediction of Metabolic Syndrome. J. Proteome Res. 2017, 16, 2262–2272. [Google Scholar] [CrossRef]
- Wiklund, P.K.; Pekkala, S.; Autio, R.; Munukka, E.; Xu, L.T.; Saltevo, J.; Cheng, S.M.; Kujala, U.M.; Alen, M.; Cheng, S.L. Serum metabolic profiles in overweight and obese women with and without metabolic syndrome. Diabetol. Metab. Syndr. 2014, 6. [Google Scholar] [CrossRef] [Green Version]
- Zhong, F.Y.; Xu, M.Y.; Bruno, R.S.; Ballard, K.D.; Zhu, J.J. Targeted High Performance Liquid Chromatography Tandem Mass Spectrometry-based Metabolomics differentiates metabolic syndrome from obesity. Exp. Biol. Med. 2017, 242, 773–780. [Google Scholar] [CrossRef] [Green Version]
- Tulipani, S.; Llorach, R.; Jauregui, O.; Lopez-Uriarte, P.; Garcia-Aloy, M.; Bullo, M.; Salas-Salvado, J.; Andres-Lacueva, C. Metabolomics Unveils Urinary Changes in Subjects with Metabolic Syndrome following 12-Week Nut Consumption. J. Proteome Res. 2011, 10, 5047–5058. [Google Scholar] [CrossRef] [PubMed]
- Pallister, T.; Jackson, M.A.; Martin, T.C.; Zierer, J.; Jennings, A.; Mohney, R.P.; MacGregor, A.; Steves, C.J.; Cassidy, A.; Spector, T.D.; et al. Hippurate as a metabolomic marker of gut microbiome diversity: Modulation by diet and relationship to metabolic syndrome. Sci. Rep. 2017, 7. [Google Scholar] [CrossRef] [PubMed] [Green Version]
- Lent-Schochet, D.; McLaughlin, M.; Ramakrishnan, N.; Jialal, I. Exploratory metabolomics of metabolic syndrome: A status report. World J. Diabetes 2019, 10, 23–36. [Google Scholar] [CrossRef] [PubMed]
- Lee, C.M.Y.; Huxley, R.R.; Woodward, M.; Zimmet, P.; Shaw, J.; Cho, N.H.; Kim, H.R.; Viali, S.; Tominaga, M.; Vistisen, D.; et al. The metabolic syndrome identifies a heterogeneous group of metabolic component combinations in the Asia-Pacific region. Diabetes Res. Clin. Pr. 2008, 81, 377–380. [Google Scholar] [CrossRef] [PubMed]
- Van Valkengoed, I.G.M.; Argmann, C.; Ghauharali-van der Vlugt, K.; Aerts, J.M.F.G.; Brewster, L.M.; Peters, R.J.G.; Vaz, F.M.; Houtkooper, R.H. Ethnic differences in metabolite signatures and type 2 diabetes: A nested case-control analysis among people of South Asian, African and European origin. Nutr. Diabetes 2017, 7. [Google Scholar] [CrossRef] [PubMed] [Green Version]
- Tillin, T.; Hughes, A.D.; Wang, Q.; Wurtz, P.; Ala-Korpela, M.; Sattar, N.; Forouhi, N.G.; Godsland, I.F.; Eastwood, S.V.; McKeigue, P.M.; et al. Diabetes risk and amino acid profiles: Cross-sectional and prospective analyses of ethnicity, amino acids and diabetes in a South Asian and European cohort from the SABRE (Southall And Brent REvisited) Study. Diabetologia 2015, 58, 968–979. [Google Scholar] [CrossRef] [PubMed] [Green Version]
- Teramoto, T.; Uno, K.; Miyoshi, I.; Khan, I.; Gorcyca, K.; Sanchez, R.J.; Yoshida, S.; Mawatari, K.; Masaki, T.; Arai, H.; et al. Low-density lipoprotein cholesterol levels and lipid-modifying therapy prescription patterns in the real world: An analysis of more than 33,000 high cardiovascular risk patients in Japan. Atherosclerosis 2016, 251, 248–254. [Google Scholar] [CrossRef] [Green Version]
- Hyman, D.J.; Pavlik, V.N. Self-reported hypertension treatment practices among primary care physicians—Blood pressure thresholds, drug choices, and the role of guidelines and evidence-based medicine. Arch. Intern. Med. 2000, 160, 2281–2286. [Google Scholar] [CrossRef] [Green Version]
- Zhou, B.; Danaei, G.; Stevens, G.A.; Bixby, H.; Taddei, C.; Carrillo-Larco, R.M.; Solomon, B.; Riley, L.M.; Di Cesare, M.; Iurilli, M.L.C.; et al. Long-term and recent trends in hypertension awareness, treatment, and control in 12 high-income countries: An analysis of 123 nationally representative surveys. Lancet 2019, 394, 639–651. [Google Scholar] [CrossRef] [Green Version]
- Islami, F.; Torre, L.A.; Jemal, A. Global trends of lung cancer mortality and smoking prevalence. Transl. Lung Cancer R 2015, 4, 327–338. [Google Scholar] [CrossRef]
- Newgard, C.B.; An, J.; Bain, J.R.; Muehlbauer, M.J.; Stevens, R.D.; Lien, L.F.; Haqq, A.M.; Shah, S.H.; Arlotto, M.; Slentz, C.A.; et al. A Branched-Chain Amino Acid-Related Metabolic Signature that Differentiates Obese and Lean Humans and Contributes to Insulin Resistance. Cell Metab. 2009, 9, 565–566. [Google Scholar] [CrossRef] [Green Version]
- Flores-Guerrero, J.L.; Oste, M.C.J.; Kieneker, L.M.; Gruppen, E.G.; Wolak-Dinsmore, J.; Otvos, J.D.; Connelly, M.A.; Bakker, S.J.L.; Dullaart, R.P.F. Plasma Branched-Chain Amino Acids and Risk of Incident Type 2 Diabetes: Results from the PREVEND Prospective Cohort Study. J. Clin. Med. 2018, 7. [Google Scholar] [CrossRef] [PubMed] [Green Version]
- Patel, M.J.; Batch, B.C.; Svetkey, L.P.; Bain, J.R.; Turer, C.B.; Haynes, C.; Muehlbauer, M.J.; Stevens, R.D.; Newgard, C.B.; Shah, S.H. Race and Sex Differences in Small-Molecule Metabolites and Metabolic Hormones in Overweight and Obese Adults. Omics 2013, 17, 627–635. [Google Scholar] [CrossRef] [PubMed] [Green Version]
- Sun, L.; Hu, C.Y.; Yang, R.Y.; Lv, Y.; Yuan, H.P.; Liang, Q.H.; He, B.J.; Pang, G.F.; Jiang, M.H.; Dong, J.; et al. Association of circulating branched-chain amino acids with cardiometabolic traits differs between adults and the oldest-old. Oncotarget 2017, 8, 88882–88893. [Google Scholar] [CrossRef] [Green Version]
- Lotta, L.A.; Scott, R.A.; Sharp, S.J.; Burgess, S.; Luan, J.A.; Tillin, T.; Schmidt, A.F.; Imamura, F.; Stewart, I.D.; Perry, J.R.B.; et al. Genetic Predisposition to an Impaired Metabolism of the Branched-Chain Amino Acids and Risk of Type 2 Diabetes: A Mendelian Randomisation Analysis. PLoS Med. 2016, 13. [Google Scholar] [CrossRef]
- Jackson, R.H.; Singer, T.P. Inactivation of the 2-Ketoglutarate and Pyruvate-Dehydrogenase Complexes of Beef-Heart by Branched-Chain Keto Acids. J. Biol. Chem. 1983, 258, 1857–1865. [Google Scholar]
- Walajtysrode, E.; Williamson, J.R. Effects of Branched-Chain Alpha-Ketoacids on the Metabolism of Isolated Rat-Liver Cells. 3. Interactions with Pyruvate-Dehydrogenase. J. Biol. Chem. 1980, 255, 413–418. [Google Scholar]
- Oyarzabal, A.; Martinez-Pardo, M.; Merinero, B.; Navarrete, R.; Desviat, L.R.; Ugarte, M.; Rodriguez-Pombo, P. A Novel Regulatory Defect in the Branched-Chain -Keto Acid Dehydrogenase Complex Due to a Mutation in the PPM1K Gene Causes a Mild Variant Phenotype of Maple Syrup Urine Disease. Hum. Mutat. 2013, 34, 355–362. [Google Scholar] [CrossRef] [Green Version]
- Iida, M.; Harada, S.; Kurihara, A.; Fukai, K.; Kuwabara, K.; Sugiyama, D.; Takeuchi, A.; Okamura, T.; Akiyama, M.; Nishiwaki, Y.; et al. Profiling of plasma metabolites in postmenopausal women with metabolic syndrome. Menopause 2016, 23, 749–758. [Google Scholar] [CrossRef] [Green Version]
- Lustgarten, M.S.; Price, L.L.; Chale, A.; Phillips, E.M.; Fielding, R.A. Branched Chain Amino Acids Are Associated With Muscle Mass in Functionally Limited Older Adults. J. Gerontol. A Biol. 2014, 69, 717–724. [Google Scholar] [CrossRef] [Green Version]
- Qin, L.Q.; Xun, P.C.; Bujnowski, D.; Daviglus, M.L.; Van Horn, L.; Stamler, J.; He, K.; Grp, I.C.R. Higher Branched-Chain Amino Acid Intake Is Associated with a Lower Prevalence of Being Overweight or Obese in Middle-Aged East Asian and Western Adults. J. Nutr. 2011, 141, 249–254. [Google Scholar] [CrossRef] [PubMed] [Green Version]
- Wang, J.; Liu, Y.X.; Lian, K.; Shentu, X.Y.; Fang, J.W.; Shao, J.; Chen, M.P.; Wang, Y.B.; Zhou, M.Y.; Sun, H.P. BCAA Catabolic Defect Alters Glucose Metabolism in Lean Mice. Front. Physiol. 2019, 10. [Google Scholar] [CrossRef] [PubMed] [Green Version]
- Tamanna, N.; Mahmood, N. Emerging Roles of Branched-Chain Amino Acid Supplementation in Human Diseases. Int. Sch. Res. Not. 2014, 2014, 235619. [Google Scholar] [CrossRef] [PubMed] [Green Version]
- Wang, F.H.; Liu, J.; Deng, Q.J.; Qi, Y.; Wang, M.; Wang, Y.; Zhang, X.G.; Zhao, D. Association between plasma essential amino acids and atherogenic lipid profile in a Chinese population: A cross-sectional study. Atherosclerosis 2019, 286, 7–13. [Google Scholar] [CrossRef] [PubMed]
- Solon-Biet, S.M.; Cogger, V.C.; Pulpitel, T.; Wahl, D.; Clark, X.; Bagley, E.; Gregoriou, G.C.; Senior, A.M.; Wang, Q.P.; Brandon, A.E.; et al. Branched chain amino acids impact health and lifespan indirectly via amino acid balance and appetite control. Nat. Metab. 2019, 1, 532–545. [Google Scholar] [CrossRef]
- Funchal, C.; Rosa, A.M.; Wajner, M.; Wofchuk, S.; Pureur, R.P. Reduction of glutamate uptake into cerebral cortex of developing rats by the branched-chain alpha-keto acids accumulating in maple syrup urine disease. Neurochem. Res. 2004, 29, 747–753. [Google Scholar] [CrossRef]
- Scott, H.A.; Gebhardt, F.M.; Mitrovic, A.D.; Vandenberg, R.J.; Dodd, P.R. Glutamate transporter variants reduce glutamate uptake in Alzheimer’s disease. Neurobiol. Aging 2011, 32. [Google Scholar] [CrossRef]
- Li, H.J.; Ye, D.; Xie, W.; Hua, F.; Yang, Y.L.; Wu, J.; Gu, A.F.; Ren, Y.; Mao, K.S. Defect of branched-chain amino acid metabolism promotes the development of Alzheimer’s disease by targeting the mTOR signaling. Biosci. Rep. 2018, 38. [Google Scholar] [CrossRef] [Green Version]
- Larsson, S.C.; Markus, H.S. Branched-chain amino acids and Alzheimer’s disease: A Mendelian randomization analysis. Sci. Rep. 2017, 7. [Google Scholar] [CrossRef] [Green Version]
- Toledo, J.B.; Arnold, M.; Kastenmuller, G.; Chang, R.; Baillie, R.A.; Han, X.L.; Thambisetty, M.; Tenenbaum, J.D.; Suhre, K.; Thompson, J.W.; et al. Metabolic network failures in Alzheimer’s disease: A biochemical road map. Alzheimers Dement. 2017, 13, 965–984. [Google Scholar] [CrossRef]
- Lovell, M.A.; Markesbery, W.R. Oxidative DNA damage in mild cognitive impairment and late-stage Alzheimers disease. Nucleic Acids Res. 2007, 35, 7497–7504. [Google Scholar] [CrossRef] [Green Version]
- Nunomura, A.; Castellani, R.J.; Zhu, X.W.; Moreira, P.I.; Perry, G.; Smith, M.A. Involvement of oxidative stress in Alzheimer disease. J. Neuropathol. Exp. Neurol. 2006, 65, 631–641. [Google Scholar] [CrossRef] [PubMed] [Green Version]
- Furukawa, S.; Fujita, T.; Shimabukuro, M.; Iwaki, M.; Yamada, Y.; Nakajima, Y.; Nakayama, O.; Makishima, M.; Matsuda, M.; Shimomura, I. Increased oxidative stress in obesity and its impact on metabolic syndrome. J. Clin. Investig. 2004, 114, 1752–1761. [Google Scholar] [CrossRef]
- Sastre, J.; Pallardo, F.V.; Llopis, J.; Furukawa, T.; Vina, J.R.; Vina, J. Glutathione Depletion by Hyperphagia-Induced Obesity. Life Sci. 1989, 45, 183–187. [Google Scholar] [CrossRef]
- Bains, J.S.; Shaw, C.A. Neurodegenerative disorders in humans: The role of glutathione in oxidative stress-mediated neuronal death. Brain Res. Rev. 1997, 25, 335–358. [Google Scholar] [CrossRef]
- Mahajan, U.V.; Varma, V.R.; Griswold, M.E.; Blackshear, C.T.; An, Y.; Oommen, A.M.; Varma, S.; Troncoso, J.C.; Pletnikova, O.; O’Brien, R.; et al. Dysregulation of multiple metabolic networks related to brain transmethylation and polyamine pathways in Alzheimer’s disease: A targeted metabolomic and transcriptomic study. PLoS Med. 2020, 17, e1003012. [Google Scholar] [CrossRef]
- Wu, G.Y.; Fang, Y.Z.; Yang, S.; Lupton, J.R.; Turner, N.D. Glutathione metabolism and its implications for health. J. Nutr. 2004, 134, 489–492. [Google Scholar] [CrossRef] [Green Version]
- Elshorbagy, A.K.; Valdivia-Garcia, M.; Refsum, H.; Butte, N. The Association of Cysteine with Obesity, Inflammatory Cytokines and Insulin Resistance in Hispanic Children and Adolescents. PLoS ONE 2012, 7. [Google Scholar] [CrossRef]
- Lord, R.S.; Bralley, J.A. Clinical Applications of Urinary Organic Acids. Part 1: Detoxification Markers. Altern Med. Rev. 2008, 13, 205–215. [Google Scholar]
- Ruiz-Ramirez, A.; Ortiz-Balderas, E.; Gardozo-Saldana, G.; Diaz-Diaz, E.; El-Hafidi, M. Glycine restores glutathione and protects against oxidative stress in vascular tissue from sucrose-fed rats. Clin. Sci. 2014, 126, 19–29. [Google Scholar] [CrossRef]
- Zhou, X.H.; He, L.Q.; Wu, C.R.; Zhang, Y.M.; Wu, X.; Yin, Y.L. Serine alleviates oxidative stress via supporting glutathione synthesis and methionine cycle in mice. Mol. Nutr. Food Res. 2017, 61, 1700262. [Google Scholar] [CrossRef] [PubMed]
- Sappington, D.; Penney, R.; Siegel, E.; Boysen, G. Glutamine drives glutathione synthesis and contributes to radiation sensitivity of A549 and H460 lung cancer cell lines. Cancer Res. 2016, 76, 1041. [Google Scholar] [CrossRef] [PubMed] [Green Version]
- Felig, P. The glucose-alanine cycle. Metabolism 1973, 22, 179–207. [Google Scholar] [CrossRef]
- Jansson, P.A.; Larsson, A.; Smith, U.; Lonnroth, P. Lactate Release from the Subcutaneous Tissue in Lean and Obese Men. J. Clin. Investig. 1994, 93, 240–246. [Google Scholar] [CrossRef]
- Yang, C.D.; Ko, B.; Hensley, C.T.; Jiang, L.; Wasti, A.T.; Kim, J.; Sudderth, J.; Calvaruso, M.A.; Lumata, L.; Mitsche, M.; et al. Glutamine Oxidation Maintains the TCA Cycle and Cell Survival during Impaired Mitochondrial Pyruvate Transport. Mol. Cell 2014, 56, 414–424. [Google Scholar] [CrossRef] [Green Version]
- Satapati, S.; Sunny, N.E.; Kucejova, B.; Fu, X.R.; He, T.T.; Mendez-Lucas, A.; Shelton, J.M.; Perales, J.C.; Browning, J.D.; Burgess, S.C. Elevated TCA cycle function in the pathology of diet-induced hepatic insulin resistance and fatty liver. J. Lipid Res. 2012, 53, 1080–1092. [Google Scholar] [CrossRef] [Green Version]
- Libert, D.M.; Nowacki, A.S.; Natowicz, M.R. Metabolomic analysis of obesity, metabolic syndrome, and type 2 diabetes: Amino acid and acylcarnitine levels change along a spectrum of metabolic wellness. PeerJ 2018, 6. [Google Scholar] [CrossRef] [Green Version]
- Buckley, W.T.; Milligan, L.P. Participation of cysteine and cystine in inactivation of tyrosine aminotransferase in rat liver homogenates. Biochem. J. 1978, 176, 449–454. [Google Scholar] [CrossRef] [Green Version]
- Liu, L.L.; Li, Q.; Li, N.J.; Ling, J.H.; Liu, R.; Wang, Y.X.; Sun, L.X.; Chen, X.H.; Bi, K.S. Simultaneous determination of catecholamines and their metabolites related to Alzheimer’s disease in human urine. J. Sep. Sci. 2011, 34, 1198–1204. [Google Scholar] [CrossRef]
- Fernstrom, J.D.; Fernstrom, M.H. Tyrosine, phenylalanine, and catecholamine synthesis and function in the brain. J. Nutr. 2007, 137, 1539s–1547s. [Google Scholar] [CrossRef]
- Gao, X.; Zhang, W.D.; Wang, Y.B.; Pedram, P.; Cahill, F.; Zhai, G.J.; Randell, E.; Gulliver, W.; Sun, G. Serum metabolic biomarkers distinguish metabolically healthy peripherally obese from unhealthy centrally obese individuals. Nutr. Metab. 2016, 13. [Google Scholar] [CrossRef] [Green Version]
- Wang, T.J.; Ngo, D.; Psychogios, N.; Dejam, A.; Larson, M.G.; Vasan, R.S.; Ghorbani, A.; O’Sullivan, J.; Cheng, S.; Rhee, E.P.; et al. 2-Aminoadipic acid is a biomarker for diabetes risk. J. Clin. Investig. 2013, 123, 4309–4317. [Google Scholar] [CrossRef]
- Mahajan, U.V.; Varma, V.R.; Huang, C.-W.; An, Y.; Tanaka, T.; Ferrucci, L.; Takebayashi, T.; Harada, S.; Iida, M.; Legido-Quigley, C.; et al. Blood metabolite signatures of metabolic syndrome in two cross-cultural older adult cohorts. 2020. In press. [Google Scholar]
- Pasini, E.; Corsetti, G.; Aquilani, R.; Romano, C.; Picca, A.; Calvani, R.; Dioguardi, F.S. Protein-Amino Acid Metabolism Disarrangements: The Hidden Enemy of Chronic Age-Related Conditions. Nutrients 2018, 10. [Google Scholar] [CrossRef] [Green Version]
- Ferrucci, L. The Baltimore Longitudinal Study of Aging (BLSA): A 50-year-long journey and plans for the future. J. Gerontol. A Biol. Sci. Med. Sci. 2008, 63, 1416–1419. [Google Scholar] [CrossRef] [Green Version]
- Resnick, S.M.; Pham, D.L.; Kraut, M.A.; Zonderman, A.B.; Davatzikos, C. Longitudinal magnetic resonance imaging studies of older adults: A shrinking brain. J. Neurosci. 2003, 23, 3295–3301. [Google Scholar] [CrossRef] [Green Version]
- Harada, S.; Takebayashi, T.; Kurihara, A.; Akiyama, M.; Suzuki, A.; Hatakeyama, Y.; Sugiyama, D.; Kuwabara, K.; Takeuchi, A.; Okamura, T.; et al. Metabolomic profiling reveals novel biomarkers of alcohol intake and alcohol-induced liver injury in community-dwelling men. Environ. Health Prev. 2016, 21, 283–284. [Google Scholar] [CrossRef] [Green Version]
- Casanova, R.; Varma, S.; Simpson, B.; Kim, M.; An, Y.; Saldana, S.; Riveros, C.; Moscato, P.; Griswold, M.; Sonntag, D.; et al. Blood metabolite markers of preclinical Alzheimer’s disease in two longitudinally followed cohorts of older individuals. Alzheimers Dement. 2016, 12, 815–822. [Google Scholar] [CrossRef] [Green Version]
- Kuehnbaum, N.L.; Kormendi, A.; Britz-McKibbin, P. Multisegment Injection-Capillary Electrophoresis-Mass Spectrometry: A High-Throughput Platform for Metabolomics with High Data Fidelity. Anal. Chem. 2013, 85, 10664–10669. [Google Scholar] [CrossRef]
- Hirayama, A.; Nakashima, E.; Sugimoto, M.; Akiyama, S.; Sato, W.; Maruyama, S.; Matsuo, S.; Tomita, M.; Yuzawa, Y.; Soga, T. Metabolic profiling reveals new serum biomarkers for differentiating diabetic nephropathy. Anal. Bioanal. Chem. 2012, 404, 3101–3109. [Google Scholar] [CrossRef]
- Hirayama, A.; Tomita, M.; Soga, T. Sheathless capillary electrophoresis-mass spectrometry with a high-sensitivity porous sprayer for cationic metabolome analysis. Analyst 2012, 137, 5026–5033. [Google Scholar] [CrossRef]
- Hirayama, A.; Soga, T. Capillary Electrophoresis—Mass Spectrometry (CE-MS): Principles and Applications; Wiley-VCH: Weinheim, Germany, 2016. [Google Scholar] [CrossRef]
- Sugimoto, M.; Wong, D.T.; Hirayama, A.; Soga, T.; Tomita, M. Capillary electrophoresis mass spectrometry-based saliva metabolomics identified oral, breast and pancreatic cancer-specific profiles. Metabolomics 2010, 6, 78–95. [Google Scholar] [CrossRef] [Green Version]
- Ohashi, Y.; Hirayama, A.; Ishikawa, T.; Nakamura, S.; Shimizu, K.; Ueno, Y.; Tomita, M.; Soga, T. Depiction of metabolome changes in histidine-starved Escherichia coli by CE-TOFMS. Mol. Biosyst. 2008, 4, 135–147. [Google Scholar] [CrossRef]
- Soga, T.; Heiger, D.N. Amino acid analysis by capillary electrophoresis electrospray ionization mass spectrometry. Anal. Chem. 2000, 72, 1236–1241. [Google Scholar] [CrossRef]
- Sasaki, K.; Sagawa, H.; Suzuki, M.; Yamamoto, H.; Tomita, M.; Soga, T.; Ohashi, Y. Metabolomics Platform with Capillary Electrophoresis Coupled with High-Resolution Mass Spectrometry for Plasma Analysis. Anal. Chem. 2019, 91, 1295–1301. [Google Scholar] [CrossRef]
- Soga, T.; Igarashi, K.; Ito, C.; Mizobuchi, K.; Zimmermann, H.P.; Tomita, M. Metabolomic Profiling of Anionic Metabolites by Capillary Electrophoresis Mass Spectrometry. Anal. Chem. 2009, 81, 6165–6174. [Google Scholar] [CrossRef] [Green Version]
- Wishart, D.S.; Feunang, Y.D.; Marcu, A.; Guo, A.C.; Liang, K.; Vazquez-Fresno, R.; Sajed, T.; Johnson, D.; Li, C.R.; Karu, N.; et al. HMDB 4.0: The human metabolome database for 2018. Nucleic Acids Res. 2018, 46, D608–D617. [Google Scholar] [CrossRef]
- Metter, E.J.; Windham, B.G.; Maggio, M.; Simonsick, E.M.; Ling, S.M.; Egan, J.M.; Ferrucci, L. Glucose and insulin measurements from the oral glucose tolerance test and mortality prediction. Diabetes Care 2008, 31, 1026–1030. [Google Scholar] [CrossRef] [Green Version]
- Mielke, M.M.; Bandaru, V.V.; Han, D.; An, Y.; Resnick, S.M.; Ferrucci, L.; Haughey, N.J. Factors affecting longitudinal trajectories of plasma sphingomyelins: The Baltimore Longitudinal Study of Aging. Aging Cell 2015, 14, 112–121. [Google Scholar] [CrossRef] [Green Version]
- Beydoun, M.A.; Tanaka, T.; Beydoun, H.A.; Ding, E.L.; Ferrucci, L.; Zonderman, A.B. Vitamin D receptor and megalin gene polymorphisms are associated with central adiposity status and changes among US adults. J. Nutr. Sci. 2013, 2. [Google Scholar] [CrossRef] [Green Version]
- Brant, L.J.; Ferrucci, L.; Sheng, S.L.; Concin, H.; Zonderman, A.B.; Kelleher, C.C.; Longo, D.L.; Ulmer, H.; Strasak, A.M. Gender Differences in the Accuracy of Time-Dependent Blood Pressure Indices for Predicting Coronary Heart Disease: A Random-Effects Modeling Approach. Gend. Med. 2010, 7, 616–627. [Google Scholar] [CrossRef] [PubMed] [Green Version]
- Nakamura, M.; Iso, H.; Kitamura, A.; Imano, H.; Noda, H.; Kiyama, M.; Sato, S.; Yamagishi, K.; Nishimura, K.; Nakai, M.; et al. Comparison between the triglycerides standardization of routine methods used in Japan and the chromotropic acid reference measurement procedure used by the CDC Lipid Standardization Programme. Ann. Clin. Biochem. 2016, 53, 632–639. [Google Scholar] [CrossRef] [PubMed] [Green Version]
- Varma, V.R.; Oommen, A.M.; Varma, S.; Casanova, R.; An, Y.; Andrews, R.M.; O’Brien, R.; Pletnikova, O.; Troncoso, J.C.; Toledo, J.; et al. Brain and blood metabolite signatures of pathology and progression in Alzheimer disease: A targeted metabolomics study. PLoS Med. 2018, 15. [Google Scholar] [CrossRef] [PubMed]
- Benjamini, Y.; Hochberg, Y. Controlling the False Discovery Rate—A Practical and Powerful Approach to Multiple Testing. J. R. Stat. Soc. B 1995, 57, 289–300. [Google Scholar] [CrossRef]
- Henglin, M.; Niiranen, T.; Watrous, J.D.; Lagerborg, K.A.; Antonelli, J.; Claggett, B.L.; Demosthenes, E.J.; Von Jeinsen, B.; Demler, O.; Vasan, R.S.; et al. A Single Visualization Technique for Displaying Multiple Metabolite-Phenotype Associations. Metabolites 2019, 9. [Google Scholar] [CrossRef] [Green Version]
- Sacks, F.M.; Appel, L.J.; Moore, T.J.; Obarzanek, E.; Vollmer, W.M.; Svetkey, L.P.; Bray, G.A.; Vogt, T.M.; Cutler, J.A.; Windhauser, M.M.; et al. A dietary approach to prevent hypertension: A review of the Dietary Approaches to Stop Hypertension (DASH) study. Clin. Cardiol. 1999, 22, 6–10. [Google Scholar] [CrossRef]
- Verbrugge, L.M.; Gruber-Baldini, A.L.; Fozard, J.L. Age differences and age changes in activities: Baltimore Longitudinal Study of Aging. J. Gerontol. B Psychol. Sci. Soc. Sci. 1996, 51, S30–S41. [Google Scholar] [CrossRef] [Green Version]
- Talbot, L.A.; Metter, E.J.; Fleg, J.L. Leisure-time physical activities and their relationship to cardiorespiratory fitness in healthy men and women 18-95 years old. Med. Sci. Sports Exerc. 2000, 32, 417–425. [Google Scholar] [CrossRef] [Green Version]
- Talbot, L.A.; Fleg, J.L.; Metter, E.J. Secular trends in leisure-time physical activity in men and women across four decades. Prev. Med. 2003, 37, 52–60. [Google Scholar] [CrossRef]
- Baba, S.; Mannami, T.; Konishi, M.; Sasaki, S. Anthropometric measures, blood pressure and major laboratory examination results in the health check-up examination among the JPHC study participants at baseline survey. Japan Public Health Center-based Prospective Study on Cancer and Cardiovascular Diseases. J. Epidemiol. 2001, 11, S87–S93. [Google Scholar] [CrossRef]
- Fujii, H.; Yamamoto, S.; Takeda-Imai, F.; Inoue, M.; Tsugane, S.; Kadowaki, T.; Noda, M. Validity and applicability of a simple questionnaire for the estimation of total and domain-specific physical activity. Diabetol. Int. 2011, 2, 47–54. [Google Scholar] [CrossRef]


| BLSA (Total Sample) (n = 252) | TMCS (Total Sample) (n = 644) | BLSA MetS (n = 106) | TMCS MetS (n = 274) | |
|---|---|---|---|---|
| Age, Mean (SD) | 73.8 (8.8) * | 69.4 (2.2) * | 72.6 (7.9) † | 69.4 (2.3) † |
| Female, n (%) | 120 (47.2) * | 359 (55.8) * | 46 (43.4) † | 190 (69.3) † |
| White, n (%) | 210 (83.3) | - | 82 (77.4) | - |
| Never smoke, n (%) | 112 (44.4) * | 424 (65.8) * | 60 (56.6) † | 205 (74.8) † |
| Physical Activity (SD) | 87.3 (61.5) | 17.5 (14.6) | 80.6 (58.8) | 16.8 (13.5) |
| DASH Score (SD) | - | 2.69 (0.7) | - | 2.71 (0.7) |
| Storage time, Mean (SD) | 12.4 (9.4) | - | 11.1 (9.2) | - |
| Metabolic syndrome, n (%) | 106 (42.1) | 274 (42.6) | - | - |
| Elevated waist circumference, n (%) | 83 (32.9) * | 276 (42.9) * | 64 (60.4) | 194 (70.8) |
| Waist circumference, Mean (SD) | 35.9 (4.8) * | 32.6 (3.2) * | 38.4 (4.4) † | 34.2 (3.2) † |
| Elevated triglyceride level, n (%) | 121 (48.0) * | 241 (37.4) * | 93 (87.7) † | 211 (77.0) † |
| Triglyceride level, Mean (SD) | 104.5 (59.6) | 105 (62.4) | 133.7 (73.5) | 124.6 (79.1) |
| Hyperlipidemia drug use, n (%) | 93 (37.4) * | 187 (29.0) * | 70 (66.0) | 175 (63.9) |
| Reduced HDL cholesterol, n (%) | 138 (54.8) * | 209 (32.4) * | 97 (91.5) † | 190 (69.3) † |
| HDL cholesterol, Mean (SD) | 56.1 (16.4) * | 67.4 (18.0) * | 49.6 (14.6) † | 64.3 (18.7) † |
| Elevated Blood Pressure, n (%) | 134 (53.2) * | 453 (70.3) * | 81 (76.4) † | 237 (86.5) † |
| SBP, Mean (SD) | 124.6 (20.2) * | 132.8 (18.4) * | 125.3 (18.9) † | 137.4 (18.0) † |
| DBP, Mean (SD) | 71.3 (12.3) * | 75.6 (10.7) * | 71.8 (12.7) † | 76.9 (10.0) † |
| Hypertension drug use, n (%) | 56 (22.5) * | 297 (46.1) * | 42 (39.6) † | 165 (60.2) † |
| Elevated fasting glucose, n (%) | 97 (39.0) * | 319 (49.5) * | 64 (60.4) | 186 (67.9) |
| Fasting glucose, Mean (SD) | 99.6 (16.7) * | 103.2 (15.9) * | 106.5 (19.9) | 107.1 (17.1) |
| Diabetes drug use, n (%) | 18 (7.2) | 60 (9.3) | 17 (16.0) | 38 (13.9) |
| Metabolite | Class | Primary Pathway * |
|---|---|---|
| Lactate | Alpha hydroxy acids | Gluconeogenesis |
| 2-hydroxybutyrate | Alpha hydroxy acids | Glutathione production |
| Pro | Carboxylic acids | Amino acid metabolism |
| Phe | Carboxylic acids | Aromatic amino acid metabolism |
| Tyr | Carboxylic acids | Aromatic amino acid metabolism |
| Ile | Carboxylic acids | BCAA metabolism |
| Leu | Carboxylic acids | BCAA metabolism |
| Val | Carboxylic acids | BCAA metabolism |
| Ala | Carboxylic acids | Gluconeogenesis |
| Glu | Carboxylic acids | Glutathione metabolism |
| Cystine | Carboxylic acids | Glutathione metabolism |
| Gly | Carboxylic acids | Glutathione metabolism |
| Gln | Carboxylic acids | Glutathione metabolism |
| Alphaaminoapidate | Carboxylic acids | Lysine degradation |
| Isocitrate | Carboxylic acids | Tricarboxylic acid cycle |
| Methyl-2-oxopentanoate | Short-chain keto acids | BCAA metabolism |
| Oxoisopentanoate | Short-chain keto acids | BCAA metabolism |
| Pyruvate | Unclassified | Gluconeogenesis |
© 2020 by the authors. Licensee MDPI, Basel, Switzerland. This article is an open access article distributed under the terms and conditions of the Creative Commons Attribution (CC BY) license (http://creativecommons.org/licenses/by/4.0/).
Share and Cite
Roberts, J.A.; Varma, V.R.; Huang, C.-W.; An, Y.; Oommen, A.; Tanaka, T.; Ferrucci, L.; Elango, P.; Takebayashi, T.; Harada, S.; et al. Blood Metabolite Signature of Metabolic Syndrome Implicates Alterations in Amino Acid Metabolism: Findings from the Baltimore Longitudinal Study of Aging (BLSA) and the Tsuruoka Metabolomics Cohort Study (TMCS). Int. J. Mol. Sci. 2020, 21, 1249. https://doi.org/10.3390/ijms21041249
Roberts JA, Varma VR, Huang C-W, An Y, Oommen A, Tanaka T, Ferrucci L, Elango P, Takebayashi T, Harada S, et al. Blood Metabolite Signature of Metabolic Syndrome Implicates Alterations in Amino Acid Metabolism: Findings from the Baltimore Longitudinal Study of Aging (BLSA) and the Tsuruoka Metabolomics Cohort Study (TMCS). International Journal of Molecular Sciences. 2020; 21(4):1249. https://doi.org/10.3390/ijms21041249
Chicago/Turabian StyleRoberts, Jackson A., Vijay R. Varma, Chiung-Wei Huang, Yang An, Anup Oommen, Toshiko Tanaka, Luigi Ferrucci, Palchamy Elango, Toru Takebayashi, Sei Harada, and et al. 2020. "Blood Metabolite Signature of Metabolic Syndrome Implicates Alterations in Amino Acid Metabolism: Findings from the Baltimore Longitudinal Study of Aging (BLSA) and the Tsuruoka Metabolomics Cohort Study (TMCS)" International Journal of Molecular Sciences 21, no. 4: 1249. https://doi.org/10.3390/ijms21041249