Article

Heat Shock Protein 27 Injection Leads to Caspase Activation in the Visual Pathway and Retinal T-Cell Response

Experimental Eye Research Institute, University Eye Hospital, Ruhr-University Bochum, In der Schornau 23-25, 44892 Bochum, Germany
*
Author to whom correspondence should be addressed.
Int. J. Mol. Sci. 2021, 22(2), 513; https://doi.org/10.3390/ijms22020513
Submission received: 20 November 2020 / Revised: 21 December 2020 / Accepted: 29 December 2020 / Published: 6 January 2021

Abstract

:
Heat shock protein 27 (HSP27) is one of the small molecular chaperones and is involved in many cell mechanisms. Besides the known protective and helpful functions of intracellular HSP27, very little is known about the mode of action of extracellular HSP27. In a previous study, we showed that intravitreal injection of HSP27 led to neuronal damage in the retina and optic nerve after 21 days. However, it was not clear which degenerative signaling pathways were induced by the injection. For this reason, the pathological mechanisms of intravitreal HSP27 injection after 14 days were investigated. Histological and RT-qPCR analyses revealed an increase in endogenous HSP27 in the retina and an activation of components of the intrinsic and extrinsic apoptosis pathway. In addition, an increase in nucleus factor-kappa-light-chain-enhancer of activated B cells (NFκB), as well as of microglia/macrophages and T-cells could be observed. In the optic nerve, however, only an increased apoptosis rate was detectable. Therefore, the activation of caspases and the induction of an incipient immune response seem to be the main triggers for retinal degeneration in this intravitreal HSP27 model.

1. Introduction

Heat shock proteins (HSPs) are molecular chaperones, and they are upregulated in response to physiological and environmental stressors [1]. In general, HSPs are attributed protective functions, such as protein stabilization and reduction of apoptosis. HSPs can be classified into different groups according to their molecular weight [2]. Larger proteins, such as HSP70 and HSP60 chaperones, are found in the cytosol, endoplasmic reticulum, mitochondria, and the cell nucleus, as well as in the extracellular environment [3,4].
One of the smaller HSPs is HSP27, also known as HSP25 or heat shock protein beta-1 (HspB1). It is ubiquitously expressed and is involved in various biological functions [5]. Intracellularly, HSP27 can inhibit the cytochrome C-mediated activation of caspases in the cytosol [6]. Furthermore, HSP27 can indirectly prevent the activation of BCL-2-associated X protein (Bax) [7]. Extracellularly, HSP27 can serve as a signal molecule and bind to membrane receptors, such as toll-like receptors (TLRs). In mouse coronary endothelial cells, extracellular HSP27 interaction between TLR2 and TLR4 was observed, which then led to nucleus factor-kappa-light-chain-enhancer of activated B cells (NFκB) phosphorylation [8]. In addition, the treatment of human macrophages with recombinant HSP27 led to increased NFκB transcriptional activity. Treatment of macrophages with HSP27 also resulted in increased expression of a variety of genes, including proinflammatory factor interleukin (IL)-1β and tumor necrosis factor α. Increased anti-inflammatory factors, such as IL-10 and GM-CSF, were also detected at both mRNA and protein levels [9]. This suggests that the mode of action of HSP27 may depend on the localization.
In recent years, studies have been carried out to analyze the relationship among neuronal diseases and HSPs. One of these diseases is glaucoma, whose main feature is the destruction of retinal ganglion cells (RGCs) and their axons [10]. Studies in donor eyes of glaucoma patients demonstrated an increased expression of HSP27 in the nerve fiber layer, RGCs, retinal vessels, and optic nerve heads [11]. Furthermore, increased HSP27 levels in the retina were also detected in various glaucoma models [12]. For example, laser photocoagulation of episcleral and limbal veins induced glaucoma in an animal model. It was observed that the expression of HSP27 was increased in RGCs and retinal astrocytes of laser treated eyes [13]. In the same publication, it was assumed that prolonged HSP27 expression is a cell-specific phenomenon and could serve as a warning sign for neuronal damage. Tezel et al. postulated that the increased expression of HSPs in glaucomatous eyes may initially serve to protect cells from further destruction and facilitate repair. However, the authors also assumed that long-lasting HSP expression could recruit immune responses that contribute to disease progression [11]. Lately, some investigations have also demonstrated that an upregulation of HSPs might be problematic and cause neuronal loss. For example, Chen et al. noted that HSP27 upregulation induced an immune mediated neural damage through activating HSP-specific CD4+ T-cell response [14]. In animal models, it was observed that systemic administration of HSP27 led to glaucoma-like damage [15,16]. Recently, we also demonstrated that intravitreal injection of HSP27 induced a degeneration of RGCs and the optic nerve neurofilament after 21 days [17]. These results suggest that HSP27 may be involved in degenerative mechanisms. However, it is not clear which pathological mechanisms are activated by the increased extracellular HSP27 concentration.
Therefore, this study deals with the possible pathological mechanisms induced through intravitreal HSP27 injection, with a focus on caspase and immunological response in retina and optic nerve.

2. Results

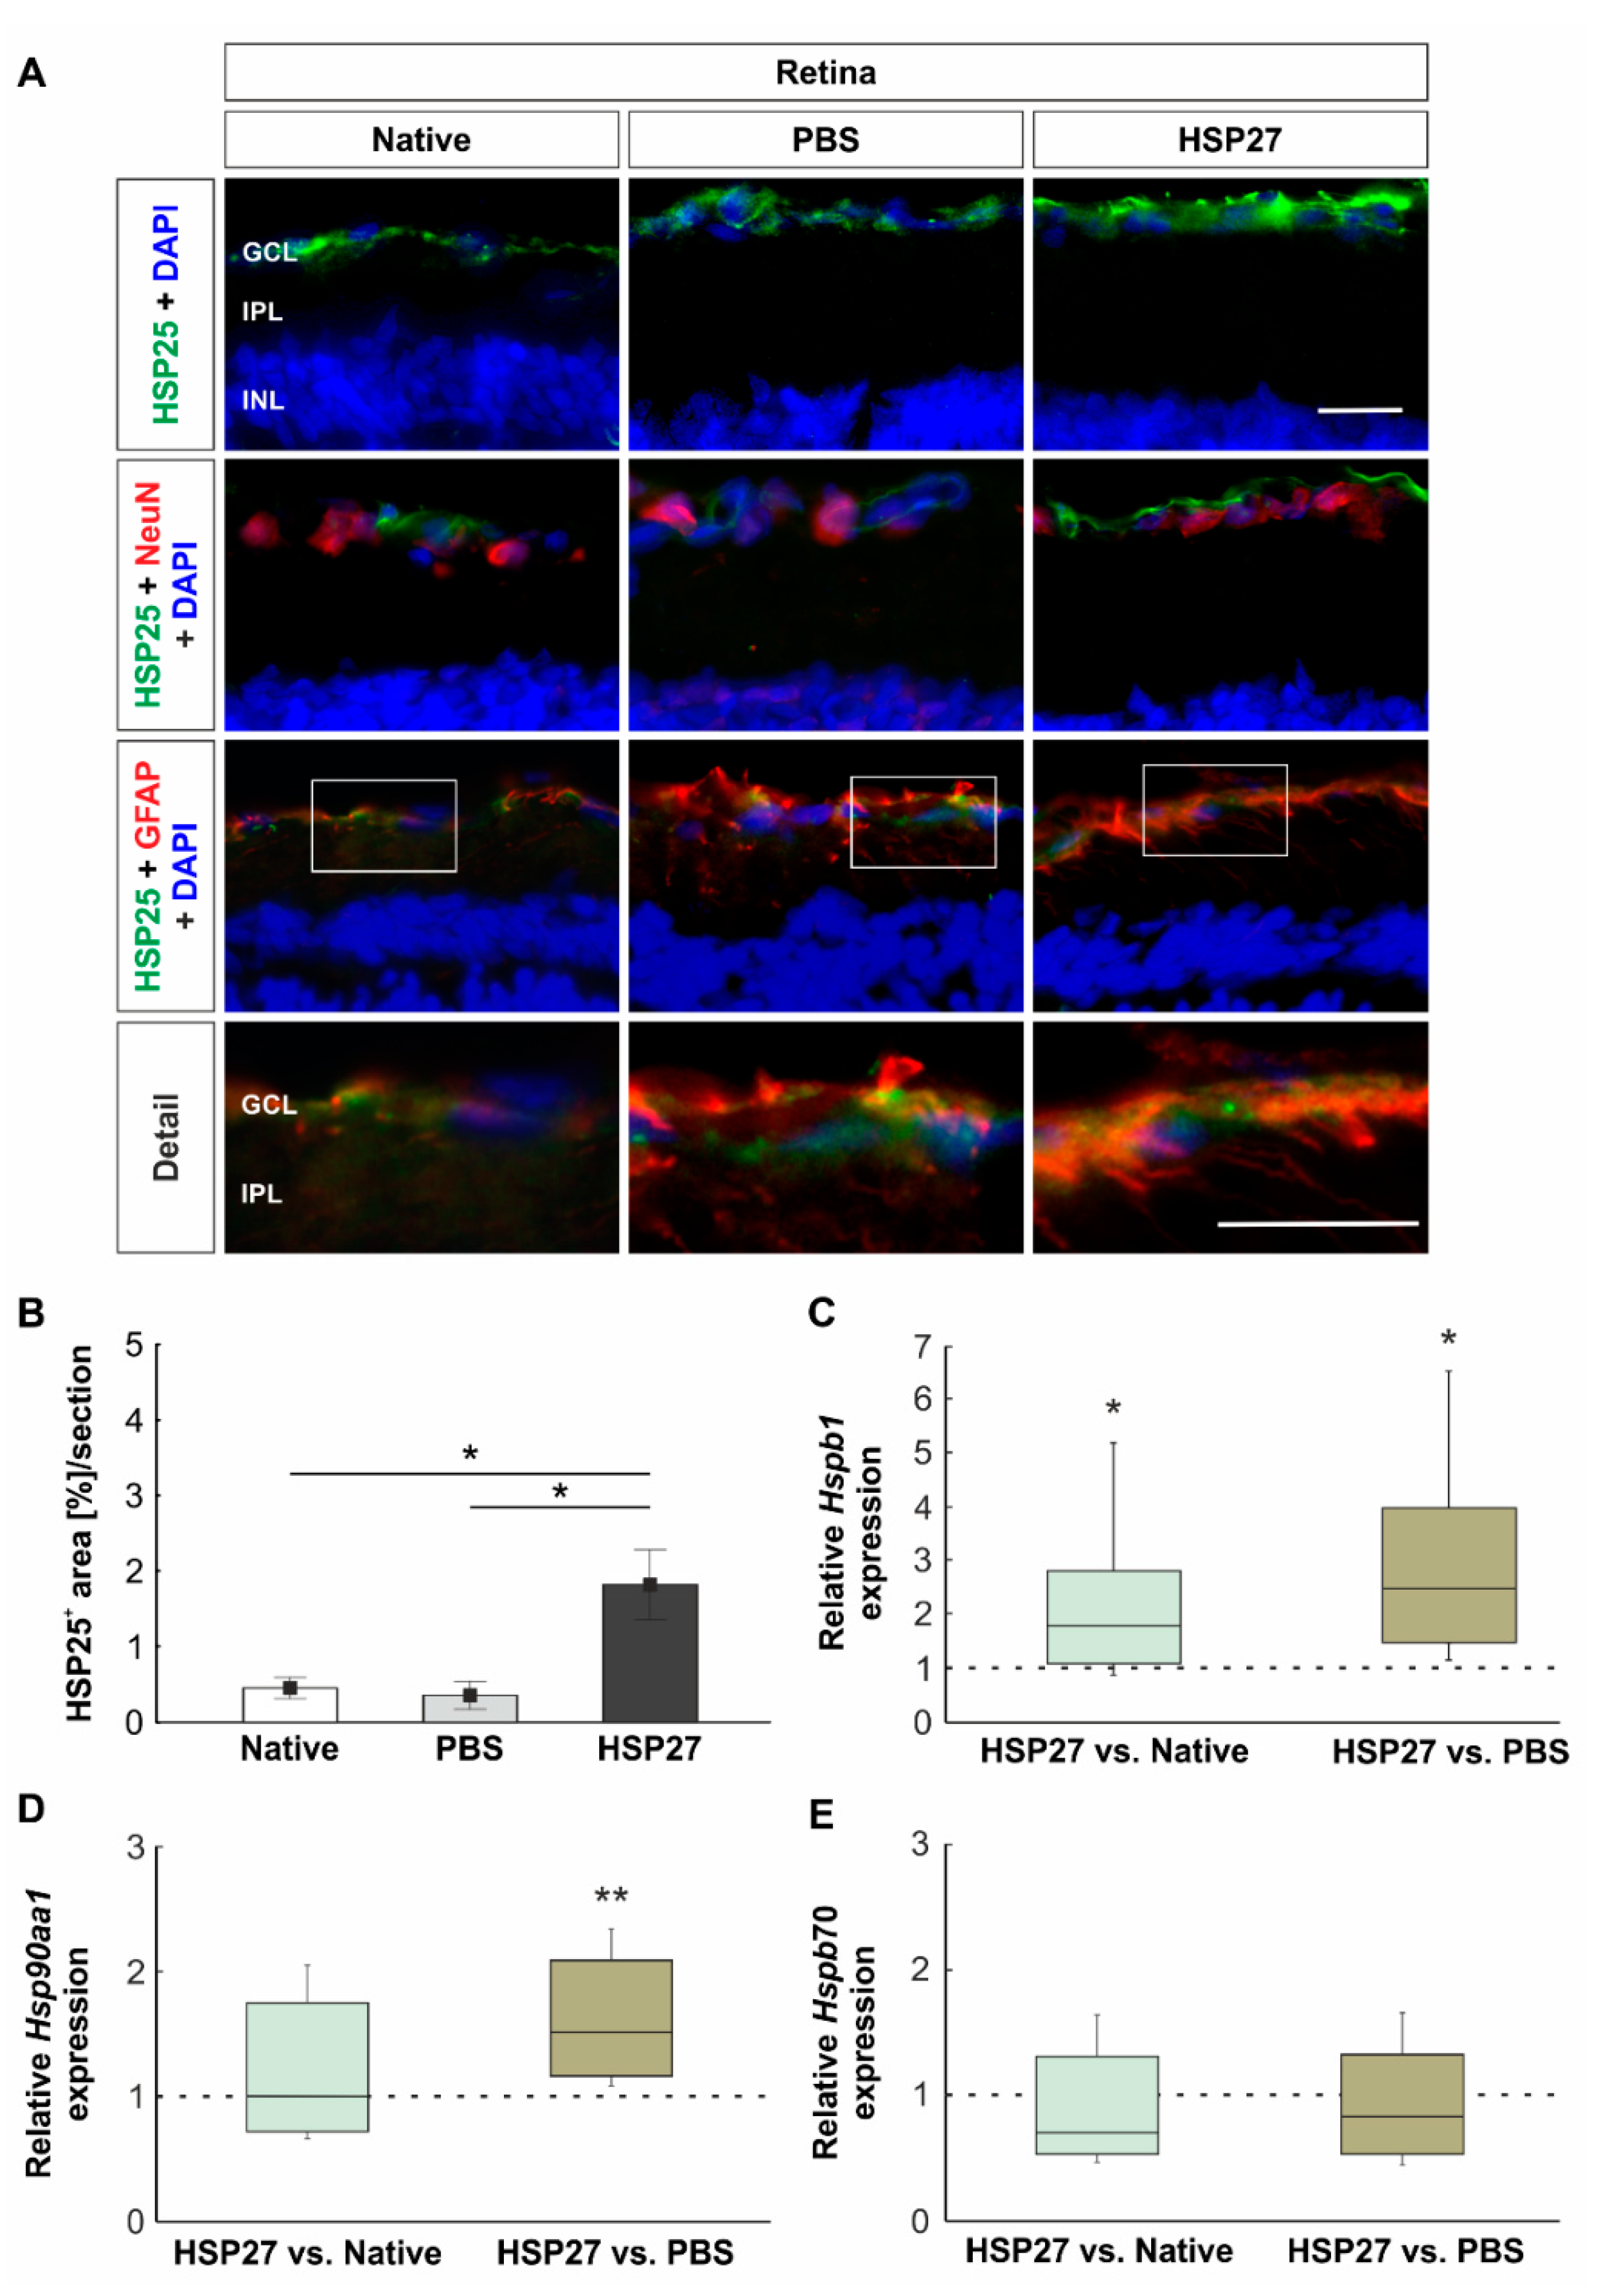
2.1. Increased Heat Shock Protein Levels on Protein and Gene Level

To investigate the level and localization of HSP27, an antibody against HSP25, known as the rodent HSP27, was used (Figure 1A). After HSP25 staining, an area evaluation of the HSP25+ signal was performed. The native (0.5 ± 0.1%) and the PBS (0.4 ± 0.2%) groups showed very similar HSP25+ area size (p = 1.0). In contrast, the HSP25+ staining area in the HSP27 group (1.8 ± 0.5%) was increased (HSP27 vs. native: p = 0.017 and HSP27 vs. PBS: p = 0.014; Figure 1B).
To identify the localization of HSP25, it was stained in combination with a marker against neuronal cells (NeuN) and astrocytes (GFAP). According to these overview stains, we noted that HSP25 was mainly located in the ganglion cell layer (GCL). However, a stronger colocalization between HSP25 and GFAP was observed, suggesting that HSP25 was released by astrocytes (Figure 1A, detail).
In order to evaluate the HSP27 (Hspb1), HSP90 (Hsp90aa1), and HSP70 (Hspb70) expression on mRNA level, RT-qPCR analyses were performed. Compared to controls, a significant upregulation of relative Hspb1 expression was detected in the HSP27 group (HSP27 vs. native: 1.8-fold expression, p = 0.040 and HSP27 vs. PBS: 2.5-fold expression, p = 0.010, Figure 1C). In contrast, the relative expression of Hsp90aa1 in the HSP27 group was only increased as compared with the PBS group (1.5-fold expression, p = 0.002, Figure 1D). No differences in the relative expression of Hsp90aa1 could be measured between the HSP27 and native group (1.0-fold expression, p = 0.990). Similar results were obtained for the relative expression of Hspb70. No differences were found between the HSP27 group and the native group (0.7-fold expression, p = 0.108), as well as the PBS group (0.8-fold expression, p = 0.377, Figure 1E).

2.2. Unaltered Number of Retinal Ganglion Cells but Increased Apoptosis Rate

To analyze neuronal degeneration, we quantified the number of RGCs and the number of RGCs in apoptotic stage using RBPMS and Bax (Figure 2A). The number of RGCs was almost equal in the HSP27 group (96.6 ± 5.6%), the PBS (98.2 ± 6.0%, p = 0.991), and the native group (100.0 ± 12.4%, p = 0.959, Figure 2B). Both control groups also demonstrated comparable RGC counts (native vs. PBS: p = 0.987). Regarding the number of Bax+ and RBPMS+ cells, no differences could be observed in the HSP27 group (11.3 ± 1.9%) when compared with both controls (PBS 10.2 ± 1.8%, p = 0.887 and native 8.4 ± 1.0%, p = 0.450). Similar numbers of apoptotic RGCs were also observed in the PBS and the native group (p = 0.730, Figure 2C).
In order to evaluate the mRNA level, expression of Pou4f1, a marker for RGCs, was analyzed via RT-qPCR. The investigation showed no differences in the relative expression of Pou4f1 between the groups (HSP27 vs. native: 0.7-fold expression, p = 0.139 and HSP27 vs. PBS: 1.1-fold expression, p = 0.639, Figure 2D). In contrast, the analysis of mRNA expression of caspase 3 (Casp3), 8 (Casp8), and 9 (Casp9) demonstrated strong changes in HSP27 retinae. Regarding the relative Casp3 expression, a significant upregulation could be measured in the HSP27 group (HSP27 vs. native: 1.6-fold expression, p = 0.003 and HSP27 vs. PBS: 1.6-fold expression, p = 0.042, Figure 2E). Investigation of the relative Casp8 mRNA revealed a significant elevation in the HSP27 group in relation to the native (1.5-fold expression, p = 0.039) and the PBS group (1.6-fold expression, p = 0.046, Figure 2F). The relative expression of Casp9 was also increased in HSP27 retinae as compared with the native group (1.5-fold expression, p = 0.024) and the PBS group (1.3-fold expression, p = 0.029, Figure 2G).

2.3. HSP27 Could Activate the NFκB Signal Pathway

To investigate further degenerative mechanisms, the NFκB signal was investigated by immunohistochemistry (Figure 3A) and the relative mRNA expression of NFκB (Nfκb), protein kinase D (Prkd1), p38 (Mapk14), and serine/threonine kinase 1 (Akt1) was determined via RT-qPCR (Figure 3). Fourteen days after intravitreal HSP27 injection, more NFκB+ cells in the GCL were noted in this group (196.3 ± 24.6%) when compared with native (100.0 ± 16.2%, p = 0.008) and PBS retinae (121.9 ± 19.3%, p = 0.043). Both controls had similar NFκB+ cell counts (p = 0.731, Figure 3B).
The RT-qPCR results were in accordance with histological data. The HSP27 group displayed a significantly higher expression of Nfκb mRNA expression than the native (1.7-fold expression, p = 0.049) and PBS group (2.0-fold expression, p = 0.017; Figure 3C). In contrast, the relative expression of Prkd1 was comparable in all three groups (HSP27 vs. native: 0.9-fold expression, p = 0.455 and HSP27 vs. PBS: 1.0-fold expression, p = 0.905, Figure 3D). The relative Mapk14 mRNA expression level in HSP27 retinae was also similar to both control groups (HSP27 vs. native: 0.7-fold expression, p = 0.103 and HSP27 vs. PBS: 1.0-fold expression, p = 0.859, Figure 3E). Likewise, the analysis of relative Akt1 mRNA expression revealed no differences between the groups (HSP27 vs. native: 0.8-fold expression, p = 0.378 and HSP27 vs. PBS: 1.4-fold expression, p = 0.444, Figure 3F).

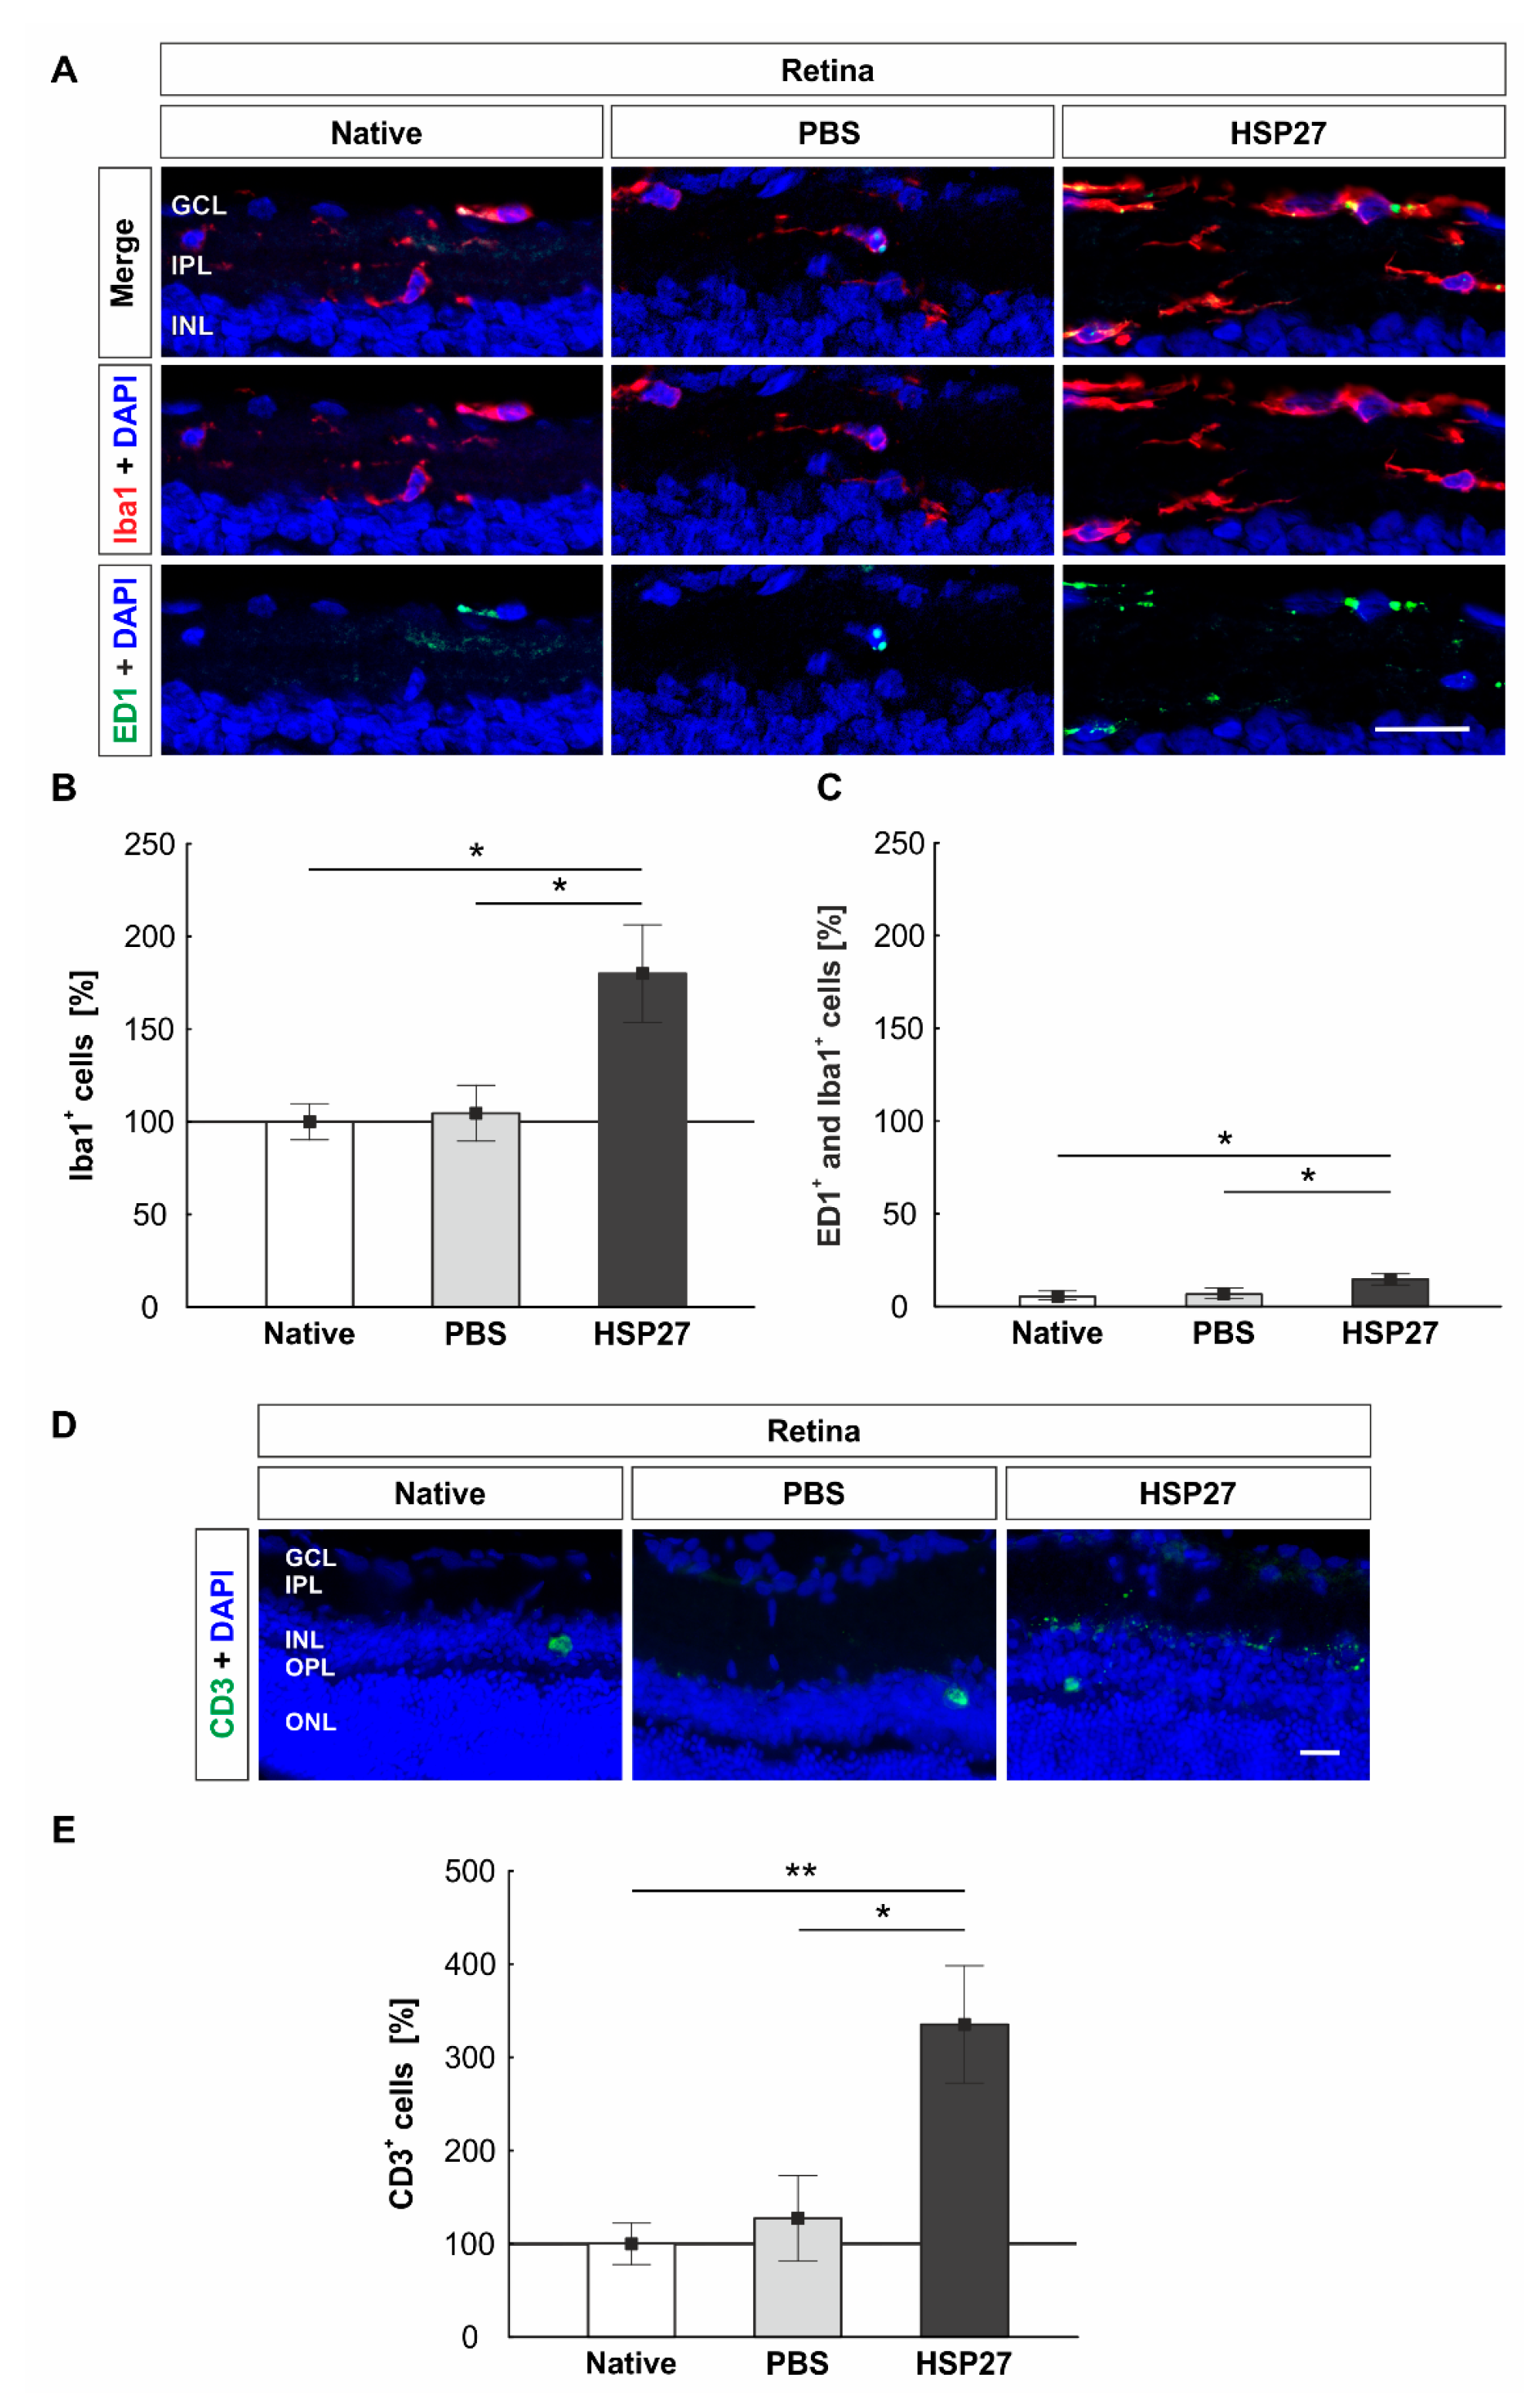
2.4. Increased Microglia/Macrophages and T-Cell Number in Retinae through HSP27

We used the antibody Iba1, which labels the whole microglia/macrophage population [18], and ED1, which labels activated microglia/macrophages, for staining (Figure 4A). At day 14, the number of microglia/macrophages in the HSP27 group (180.0 ± 26.3%) was increased as compared with the native (100.0 ± 9.7%, p = 0.015) and the PBS group (104.6 ± 15.1%, p = 0.022, Figure 4B). The native and the PBS group showed no differences (p = 0.982). The number of active microglia/macrophages doubled in the HSP27 group (14.6 ± 8.6%) as compared with the native group (5.3 ± 4.8%, p = 0.013) and the PBS group (6.7 ± 2.8%, p = 0.034). Both controls displayed similar numbers of ED1+ and Iba1+ cells (p = 0.988, Figure 4C).
Recently, it was speculated whether the increased concentration of HSP27 in glaucoma patients leads to a specific immune response. First investigations showed that high HSP27 concentrations caused a reaction of the T-cells [14]. Hence, retinal T-cells were stained with the marker CD3 (Figure 4D). Overall, only a few T-cells could be detected in the entire retina. However, cell counts revealed differences among the groups. At day 14, the HSP27 group revealed more T-cells (335.3 ± 62.9%) than the native group (100.0 ± 22.1%, p = 0.008) or the PBS one (127.3 ± 45.9%, p = 0.015, Figure 4E). No difference was noted between the PBS and native group (p = 0.919).

2.5. Unaltered HSP25 and NFκB Signals in Optic Nerves

The HSP27 signal was also histologically examined with an antibody against the rodent homologue HSP25 in the optic nerve (Figure 5A). Interestingly, the evaluation of the percentage area of labelled HSP25 did not show any significant differences among the HSP27 optic nerves (22.5 ± 3.7%), the native animals (19.5 ± 1.6%, p = 0.769), and the PBS group (20.7 ± 3.5%, p = 0.904). In addition, between the PBS and native groups no differences were noted (p = 0.962, Figure 5B).
In addition, NFκB was histologically examined in the optic nerve, since it is an important transcription factor (Figure 5A). The number of NFκB+ cells was equal in all three groups (native: 100.0 ± 6.9%, PBS: 108.9 ± 10.7%, and HSP27: 102.1 ± 5.8%, HSP27 vs. native: p = 0.982, HSP27 vs. PBS: p = 0.822, and PBS vs. native, p = 0.719, Figure 5C).

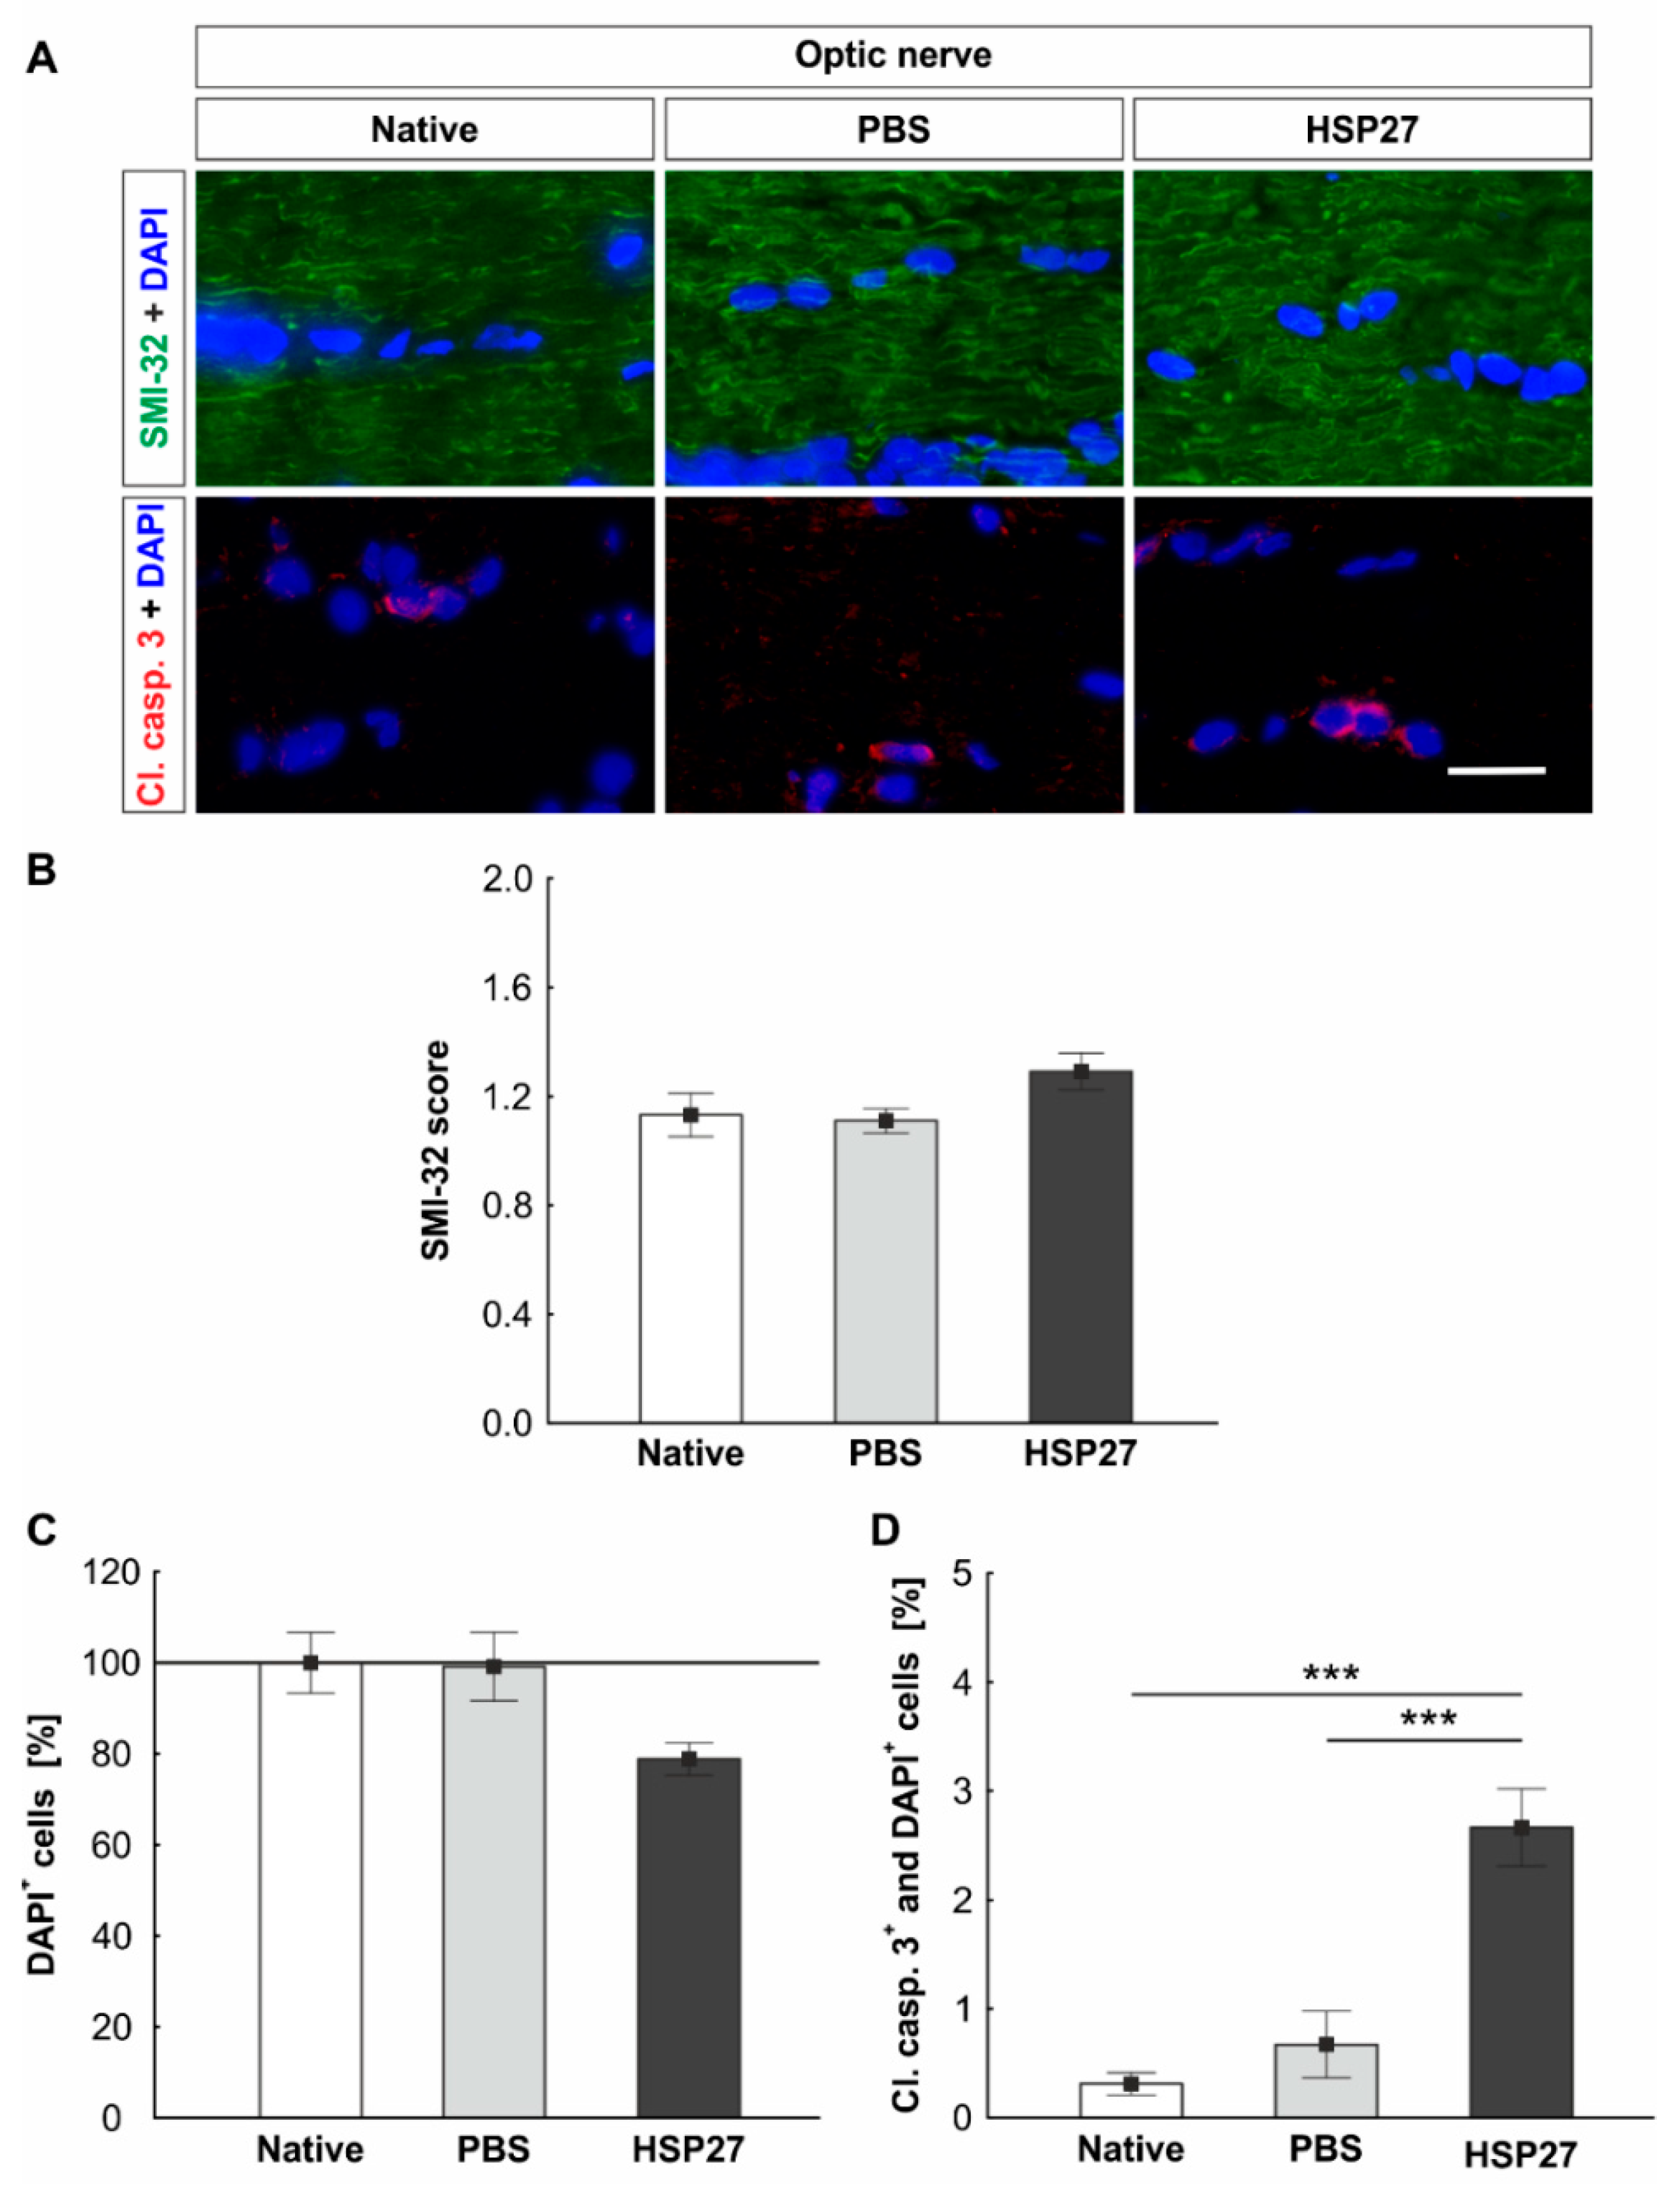
2.6. Increased Apoptosis Rate in the Optic Nerve

The neurofilament of optic nerves was stained with SMI-32 (Figure 6A). No differences among the PBS group (1.1 ± 0.1 mean score), the HSP27 group (1.3 ± 0.2 mean score), and the native group (1.1 ± 0.1 mean score) were detected regarding the SMI-32 score (PBS vs. native: p = 0.972, HSP27 vs. native: p = 0.223, and HSP27 vs. PBS: p = 0.153, Figure 6B).
Apoptotic cells were investigated in the optic nerve via immunohistochemistry using a cleaved caspase 3 antibody (Figure 6A). To determine the number of degenerated cells in the optic nerve, DAPI+ cells, as well as cleaved caspase 3+ and DAPI+ cells, were counted. The number of nuclei was slightly, but not significantly reduced in the optic nerves of the HSP27 group (78.9 ± 3.6%) as compared with the native group (100.0 ± 6.7%, p = 0.061) and the PBS group (99.2 ± 7.5%, p = 0.074). No difference could be seen between the native and the PBS groups (p = 0.995, Figure 6C). In contrast, the number of apoptotic cells was significantly higher in the HSP27 group (2.7 ± 0.4%) as compared with the native (0.3 ± 0.1%, p < 0.001) and the PBS optic nerves (0.7 ± 0.3%, p < 0.001). Native and PBS optic nerves demonstrated similar, low numbers of apoptotic cells (p = 0.633, Figure 6D).

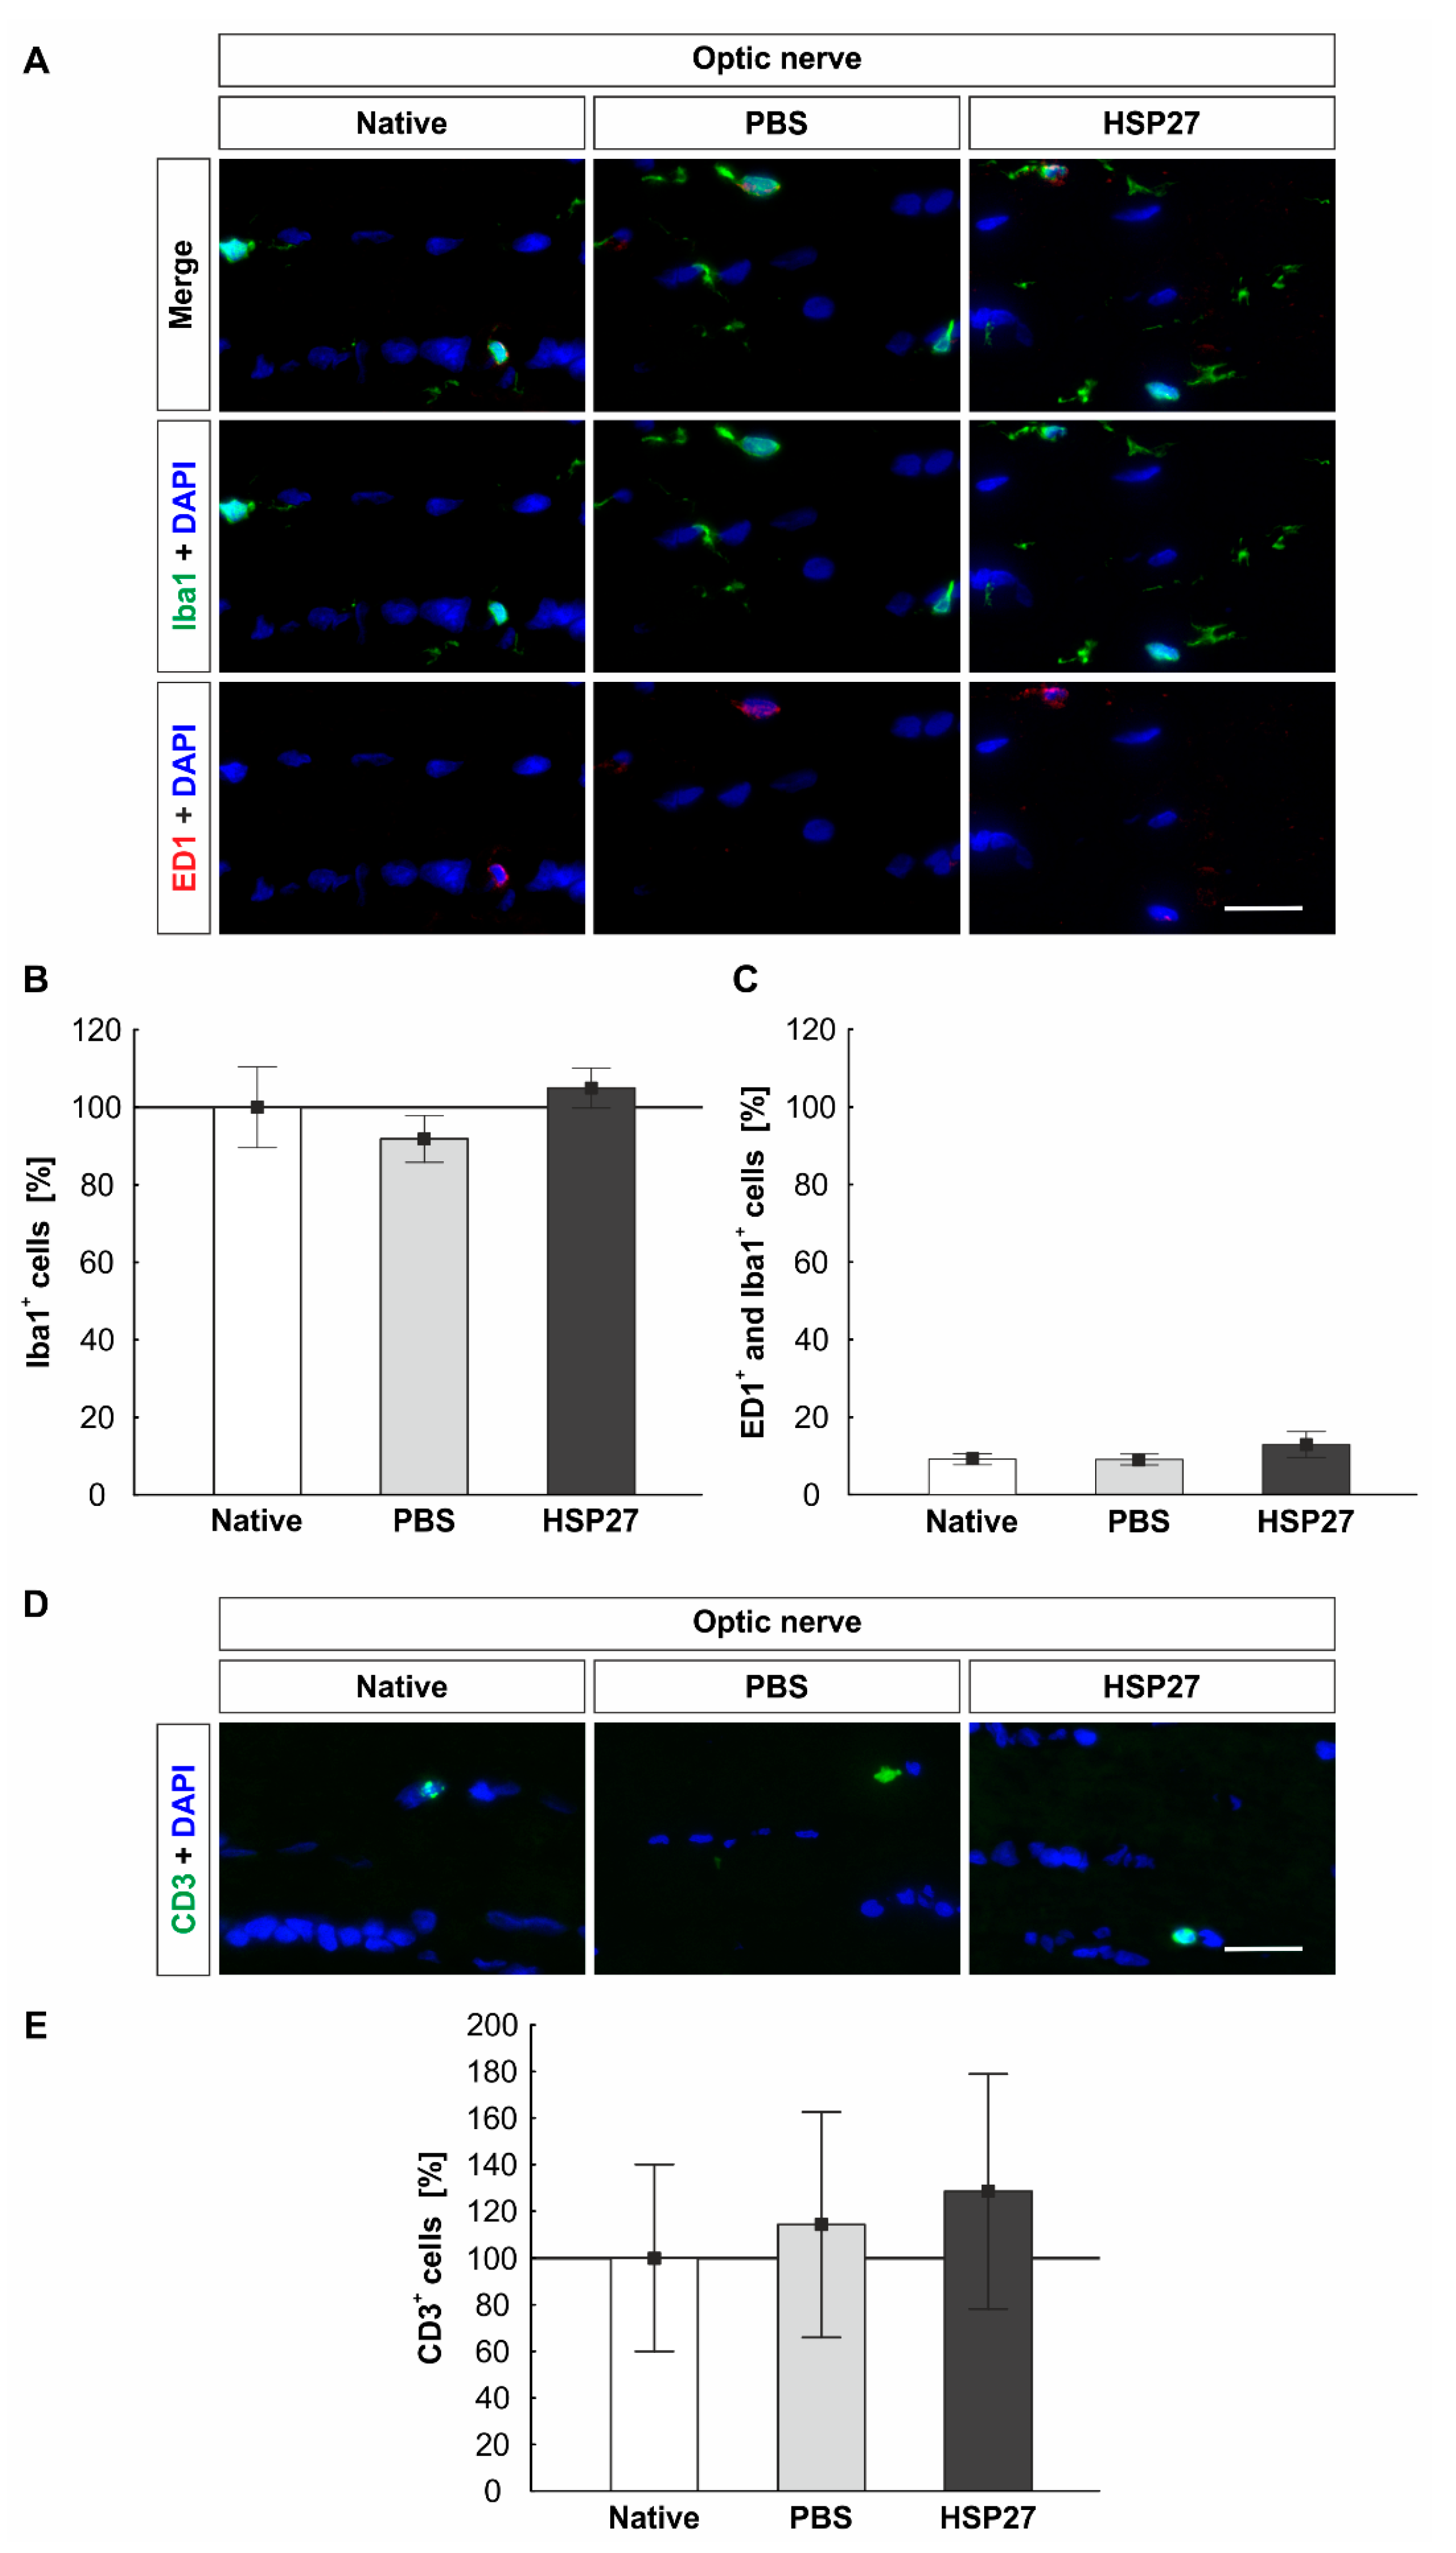
2.7. Constant Number of Microglia/Macrophages and T-Cells in the Optic Nerves

Microglia/macrophages, as well as activated microglia/macrophages, were also visualized in the optic nerve (Figure 7A). The counting of the Iba1+ signals showed no differences among the groups (native: 100.0 ± 10.4%, PBS: 91.8 ± 6.1%, HSP27:105.0 ± 5.2%, HSP27 vs. native: p = 0.889, HSP27 vs. PBS: p = 0.454, and PBS vs. native: p = 0.732, Figure 7B). The number of ED1+ and Iba1+ signals was also statistically equal in the native (9.1 ± 1.4%), the PBS (9.1 ± 1.4%), and the HSP27 (12.9 ± 3.3%) groups (PBS vs. native: p = 1.000, HSP27 vs. native: p = 0.469, and HSP27 vs. PBS: p = 0.459, Figure 7C).
The number of CD3+ T-cells was examined in the optic nerve (Figure 7D). Only very few positive signals could be detected. Counting of CD3+ signals revealed no differences among the native group (100.0 ± 40.0%), the PBS group (114.3 ± 48.3%), and the HSP27 group (128.6 ± 50.4%, PBS vs. native: p = 0.974, HSP27 vs. native: p = 0.902, and HSP27 vs. PBS: p = 0.974, Figure 7E).

3. Discussion

HSP27 is a small chaperone and is considered to be a protective protein in the intracellular environment. The extracellular mode of action of HSP27 has only been investigated in a few cases. In this study, we demonstrated that extracellular HSP27 induced degenerative signaling pathways, including caspase activation, hence, leading to cell death.

3.1. Endogenous HSP as a Response to Stress

Fourteen days after intravitreal HSP27 injection, the HSP response in retinae and optic nerves was examined. Many neuronal diseases result in an increased intracellular expression of HSPs. Since these diseases are often accompanied by an accumulation of insoluble protein aggregates or amyloid fibrils in neurons or glial cells, it is assumed that HSP27 is increasingly expressed to reduce this accumulation. For example, neurons of Alzheimer’s patients display a colocalization of Lewy’s bodies and HSP27 [19]. Many other studies also point to a stress-dependent induction of HSP27 [20,21,22,23]. Therefore, the increased protein and mRNA concentration of endogenous HSP27, in our study, suggests that intravitreal HSP27 injection exerted a form of stress on retinal cells. The reaction appeared to be concentrated in the GCL, as elevated HSP25+ signals were detected histologically mainly in this layer. This was consistent with other studies that found elevated levels of HSP27 in the GCL of rodents with glaucomatous damage, optic nerve injury, or induced retinal damage [12,13,24]. After closer analysis, the astrocytes appeared to be associated with HSP27 in our study. This is in accordance with investigations in eyes from an experimental rat glaucoma model and the DBA/2J mice. There, it was shown that increased HSP27 and phosphorylated HSP27 occurred mainly in glial cells [25]. Considering gene level, the expression of HSP27 was enhanced while the analysis of HSP70 presented no differences among the groups. Furthermore, the expression of HSP90 seemed to be increased as well. Therefore, intravitreal injection of HSP27 seems to induce endogenous expression of HSPs in the retina. Possibly this is a response to the degenerative signaling pathways. Interestingly, we could not detect an increased HSP27 expression in the optic nerve. Therefore, the optic nerve does not seem to be exposed to the same stress response from HSP27 injection.

3.2. Activation of Caspase-Dependent Cell Death

In a previous study, it was demonstrated that intravitreal HSP27 injection led to a loss of retinal ganglion and amacrine cells after 21 days [17]. However, no degenerative signaling pathways or apoptotic signals were identified at that time. For this reason, RGCs and apoptotic signaling pathways were studied at an earlier stage, i.e., 14 days after injection, in the current study. Interestingly, after 14 days, no effects on RGCs were detected, cell counts were comparable in the three groups. This is in contrast to intravitreal injections of other proteins. For example, the injection of S100B induced the loss of RGCs and amacrine cells after 14 days [26]. Likewise, the intravitreal injection of N-methyl-D-aspartate (NMDA) or glutamate caused a rapid degeneration of the RGCs already after 2–3 days [27,28]. The reason for the different times of degeneration lies in the mode of action of the injected substances. Intravitreally injected NMDA or glutamate mediates a rapid response and receptor mediated cell death by excitotoxicity [29]. The mode of action of extracellular HSP27 is still largely unknown. However, there are studies that have described HSP27 as an extracellular signaling molecule. Some membrane receptors for extracellular HSP could be identified. These include cluster of differentiation (CD) CD91, CD40, CD36, CD14, TLRs, and scavenger receptor-A (SR-A) [30]. In human microvascular endothelial cells, TLR3 has been identified as the receptor targeted by HSP27, which led to activation of NFκB and secretion of interleukin 8 and vascular endothelial growth factor [31]. Although not much is known about apoptotic signaling pathways related to extracellular HSP27, our investigations suggest that extracellular HSP27 can induce both intrinsic and extrinsic apoptosis, since mRNA levels of both Casp8 and Casp9 were elevated. Possibly, the injection of HSP7 also led to a TLR binding. Depending on the TLR, different signaling pathways can lead to apoptosis. For example, the binding to TLR2 leads to the recruitment of caspase 8 via several signaling pathways, which in turn leads to cleaved caspase 3 inducing apoptosis [32]. TLR3-initiated apoptosis seems to be mainly triggered by caspase 8 and carried out by caspase 3 [33]. It is also possible that the extrinsic and intrinsic apoptosis signaling pathways influence each other. Activated caspase 8 is able to cleave BH3 interacting-domain death agonist (BID), a pro-apoptotic member of the Bcl-2 family. After cleavage, shortened BID translocates from the cytoplasm into mitochondria and promotes cytochrome c release, which leads to caspase 9 activation, and finally induces apoptosis [34]. In addition, shortened BID and the simultaneous initiation of the intrinsic and extrinsic apoptosis pathway was detected in the glaucomatous eyes of an experimental rat glaucoma model [35]. This indicates that both apoptotic signaling pathways might be activated in glaucoma.
In this intravitreal HSP27 injection model, neuronal degeneration also seems to occur by activation of intrinsic and extrinsic apoptosis pathways. The HSP27 injection led to an increased mRNA expression of Casp 3, 9, and 8. In addition, a higher number of cleaved caspase 3+ cells, was demonstrated in the optic nerve. Other apoptosis-regulating factors such as Bax, p38 (Mapk14), protein kinase D (Prkd1), and serine/threonine kinase 1 (Akt1) were not altered at the time of investigation. The activation of caspases via a yet unknown receptor, therefore, is the likely major trigger for retinal degeneration in this intravitreal HSP27 injection model (Figure 8).

3.3. NFκB Activation and Induction of an Immune Response

In addition to the increased level of caspases, immunological components after HSP27 injection were also investigated. It could be demonstrated that, regarding mRNA and protein level, more retinal NFκB, a specific transcription factor, which is important for the regulation of immune response, was detected. Therefore, HSP27 injection could also induce NFκB activation. As mentioned before, this could also be induced by an interaction between HSP27 and TLR, since NFκB activation by TLR bonding was already detected in other models [9,31]. In any case, the activation of NFκB leads to NFκB migration into the cell nucleus, where it induces a variability of proinflammatory processes [36]. One result of this altered transcription may be the observed activation of microglia/macrophages. NFκB is considered to be a key transcription factor of M1 macrophages and is required for the induction of a large number of inflammatory genes, including those encoding TNF-α, IL-1β, and IL-6 [37]. This could cause more microglia/macrophages to proliferate and activate in the retina. The observed response of microglia/macrophages in the retina could additionally contribute to neuronal damage. The negative characteristics of an uncontrolled microglial response were already observed in many other glaucoma models, this included the DBA/2J mouse model, where a microglial reaction was observed before the neuronal damage occurred [38]. In addition, in a model of ocular hypertension, microglia reactions in the retina, optic nerve, and optic tract have been noted [39].
Another interesting function of NFκB is the regulation of inflammatory response. NFκB can mediate the induction of various proinflammatory genes, and also regulate the activation, differentiation, and effector function of inflammatory T-cells [40,41]. In recent years, it has been speculated whether elevated HSP27 levels induce an immune response in glaucoma. Tezel et al., twenty years ago, postulated that long-lasting HSP expression could promote an immune response [11]. Examination of CD3+ T-cells demonstrated very few specific signal bindings in our study, but cell counts demonstrated more T-cells in HSP27 retinae. This could indicate that if the extracellular concentration of HSP27 is increased and lasts longer, an immune response against HSP27 may occur. Speculations about this have been published earlier, as glaucoma patients displayed elevated antibody titers against HSP27 and other HSPs [42,43,44]. Nevertheless, further studies are needed to pursue and possibly confirm this theory.
It should also be noted that the observed degenerative mechanisms appear to be in the retina rather than in the optic nerve. Activation of the NFkB signaling pathway, as well as microglia/macrophage response and T-cell recruitment, were not observed in the optic nerve. It is possible that the injected HSP27 is degraded so quickly that it has no effect on cells located further away in the optic nerve. The increased caspase 3 signal and the degeneration of the neurofilament observed after 21 days could be a consequence of the degenerative mechanisms in the retina [17]. It should be noted that only one HSP27 dosage (0.4 µg) was tested. Since we already used 0.4 µg HSP27 in a previous study, this was necessary for reasons of comparability [17]. We were previously able to observe neuronal degeneration 21 days after intravitreal HSP27 injection, in this study, we detected an activation of the intrinsic and extrinsic apoptosis pathway. Still, the investigation of higher HSP27 concentrations and a possible dose-dependent effect are aspects that still need to be analyzed in further studies.

4. Materials and Methods

4.1. Animals

All experiments concerning animals were carried out in accordance with the ARVO Statement for Use of Animals in Research and approved by the animal care committee of North Rhine-Westphalia (Germany, approval number 84-02.04.2013.A442, permission date 11 February 2014). In our study, 26 male Wistar rats (376–400 g, Charles River, Sulzfeld, Germany) were used. All animals were kept on a light-dark cycle (12 h/12 h) and an unlimited access to food and water was guaranteed. Health checks were performed regularly.

4.2. Intravitreal HSP27 Injection

The intravitreal injections of HSP27 or PBS were performed, as previously described [26]. Briefly, rats were anesthetized (ketamine, 50 mg/mL, Ratiopharm (Ulm, Germany) and xylazine, 2% (Bayer Health Care, Leverkusen, Germany). A mydriatic (Tropicamid 5 mg/mL, Stulln, Germany) was used to dilate the pupils. To perform the intravitreal injection, eyes were treated with a local anesthetic (Conjuncain 4 mg/mL, Bausch & Lomb, Berlin, Germany). With a 32-gauge needle (Hamilton, Reno, NV, USA), 2 µL of 0.2 µg/µL HSP27 solution (dose per eye 0.4 µg, AtGen, Yatap-dong, Korea) or 2 µL PBS (Biochrom GmbH, Berlin, Germany) were injected under a stereomicroscope (Zeiss, Oberkochen, Germany) in one eye per animal. To avoid damage to the eye an antibiotic ointment (Floxal, Bausch & Lomb, Berlin, Germany) was applied afterwards. The corresponding eye remained untreated.

4.3. Preparation of Retina and Optic Nerve

After 14 days, eyes (n = 13/group) and optic nerves (n = 8/group) were explanted. Five retinae were frozen directly at −80 °C for later quantitative real-time PCR (RT-qPCR) analysis. The other organs were prepared for retinal cross-sections (n = 8/group) or longitudinal optic nerve (n = 8/group) sections, as previously described [17]. The organs were fixed in 4% paraformaldehyde (eyes for 1 h and optic nerves for 2 h, Merck, Burlington, MA, USA), cryo-conserved in 30% sucrose overnight, and frozen embedded in NEG-50 Tissue Tek medium (Thermo Fisher Scientific, Waltham, MA, USA). The retina cross-sections (10 µm) and longitudinal optic nerve sections (4 µm) were attached on glass slides (Superfrost Plus, Thermo Fisher Scientific), fixed in ice-cold acetone, and used for immunohistological staining.

4.4. Specific Immunohistological Stainings of Retina and Optic Nerve

Immunofluorescence stainings were performed on retinal cross-sections (6 sections/animal, n = 8/group) and longitudinal optic nerve sections (6 sections/animal, n = 8/group) [45]. The advantage of immunohistological staining is that in addition to a quantitative evaluation of the signals, the localization of the investigated proteins and structures can also be determined. All sections were blocked with a mixture of a 10–20% serum, 0.1–0.2% Triton X-100 (Sigma-Aldrich, St. Louis, MO, USA) and PBS (ChemCruz, Dallas, TX, USA). Sections were treated over night with primary antibodies (Table 1) diluted in the same block solution. The next day, Cy3/Alexa Fluor 555 or Alexa Fluor 488 labeled secondary antibodies (Table 1) were applied. Cell nuclei were visualized with 4′,6-diamidin-2-phenylindole (DAPI, Serva Electrophoresis, Heidelberg, Germany). Finally, the sections were covered with Shandon-mount (Thermo Fisher Scientific). Negative controls were performed by applying only the secondary antibody.
A directly labeled antibody was used for CD3 staining of T-cells. Hence, after the CD3 antibody was applied to the sections, an overnight incubation took place. On the next day, the nuclei were stained with DAPI.
Four images per retina (two peripheral and two central) and three per optic nerve (proximal, middle, and distal) were taken using a fluorescence microscope (Axio Imager M2, Carl Zeiss Microscopy) with a Zeiss objective lens (40× and 20×) [45,46] and an Axiocam HRc CCD camera (Zeiss). The recording software used was ZEN 2012. All images, except the CD3 staining, were taken at 400× magnification. For CD3 staining, the images were taken at 200× magnification, since signals were counted in all retinal layers. RBPMS+, NFκB+, CD3+, and cleaved caspase 3+ cells were counted in masked pictures if these signals matched DAPI signals. In regard to ED1, the co-localization with Iba1 was evaluated in the GCL and inner plexiform layer (IPL). Bax+ signals were also counted in co-localization with RBPMS+ signals. NFκB+ signals were also counted in the GCL. All cells were counted using ImageJ software (V 1.53, NIH).
To analyze the endogenous HSP27 in the retina and optic nerve, an HSP25 antibody was used, as this is the rodent homologue to human HSP27. HSP25 signals in retina and optic nerve were investigated via area analysis using an ImageJ macro [45]. For this analysis, all retina images were converted into 32-bit gray scale. After background subtraction (48.79), the lower threshold was set at 20.9 and upper threshold at 23.6. In the optic nerve, the background of 49.7 was subtracted, while the lower threshold was set at 57.7 and the upper one at 6.5.
SMI-32 labeled optic nerve neurofilaments were scored using an established scoring system ranging from 0 = intact up to 2 = destroyed, in 0.5 intervals [45]. The figures presented were created with the help of the CorelDRAW software (V: 2018, 64-bit, Corel Corporation, Ottawa, ON, Canada).

4.5. Quantitative Real-Time PCR Analysis of Retinal Tissue

For RNA isolation, the retinae (n = 5/group) were dissected from the eyes and directly frozen at −80 °C. The Gene Elute Mammalian RNA Miniprep Kit (Sigma-Aldrich) was used for RNA extraction and purification. Then, 1 µg RNA was used for reverse transcription with a cDNA synthesis kit (Thermo Fisher Scientific). The RT-qPCR experiments were performed in a PikoReal 96 real-time PCR system (Thermo Fisher Scientific) using SYBR Green. The designed oligonucleotides for RT-qPCR are presented in Table 2. The genes Actb (Actin, beta) and Ppid (Cyclophilin) served as reference genes.

4.6. Statistical Analysis

The immunohistological cell counts of the native group were set to 100% and compared to the HSP27 and the PBS group. The immunohistological data were analyzed using Statistica software (Version 13.3, Dell, Round Rock, TX, USA) using one-way ANOVA followed by Tukey post-hoc test and presented as mean ± standard error mean (SEM) with * p < 0.05, ** p < 0.01, and *** p < 0.001. In regard to RT-qPCR analyses, the relative expression values are presented as median ± quartile + minimum/ maximum. The analysis of relative expression was performed by the Pair Wise Fixed Reallocation Randomization Test © using REST © software (Qiagen, Hilden, Germany).

5. Conclusions

In summary, intravitreally injected HSP27 affected primarily the retina. There, it led to an increased level of caspases 3, 8, and 9 after 14 days, which suggested the involvement of the intrinsic and extrinsic apoptosis pathway. In addition, an activation of retinal NFκB was noted, which induced a probable reaction of microglia/macrophages. First indications of an immune response were also observed via an increased number of retinal T-cells (Figure 8). The damage in the optic nerve seemed to be mostly a consequence of retinal damage, as hardly any degenerative mechanisms had been observed in the optic nerve at the analyzed point in time.

Author Contributions

P.G. carried out experiments, performed statistical analyses, drafted the manuscript, and generated graphics; P.J.H. carried out experiments and revised the manuscript; S.R. revised the manuscript; N.G. carried out experiments; H.B.D. revised the manuscript; S.C.J. designed the study and drafted the manuscript. All authors have read and agreed to the published version of the manuscript.

Funding

This work was supported by FoRUM (Ruhr-University Bochum, Germany).

Institutional Review Board Statement

The study was conducted in accordance with the ARVO Statement for Use of Animals in Research and approved by the animal care committee of North Rhine-Westphalia (Germany, approval number 84-02.04.2013.A442, permission date 11 February 2014).

Acknowledgments

We would like to thank Janka Schmidt for excellent technical assistance.

Conflicts of Interest

All authors in this study declare that they have no conflict of interests.

References

  1. Lindquist, S.; Craig, E.A. The heat-shock proteins. Annu. Rev. Genet. 1988, 22, 631–677. [Google Scholar] [CrossRef]
  2. Kampinga, H.H.; Hageman, J.; Vos, M.J.; Kubota, H.; Tanguay, R.M.; Bruford, E.A.; Cheetham, M.E.; Chen, B.; Hightower, L.E. Guidelines for the nomenclature of the human heat shock proteins. Cell Stress Chaperones 2009, 14, 105–111. [Google Scholar] [CrossRef] [Green Version]
  3. Brocchieri, L.; Karlin, S. Conservation among HSP60 sequences in relation to structure, function, and evolution. Protein Sci. 2000, 9, 476–486. [Google Scholar] [CrossRef] [Green Version]
  4. Kampinga, H.H.; Craig, E.A. The HSP70 chaperone machinery: J proteins as drivers of functional specificity. Nat. Rev. Mol. Cell Biol. 2010, 11, 579–592. [Google Scholar] [CrossRef] [Green Version]
  5. Jakob, U.; Gaestel, M.; Engel, K.; Buchner, J. Small heat shock proteins are molecular chaperones. J. Biol. Chem. 1993, 268, 1517–1520. [Google Scholar] [CrossRef]
  6. Bruey, J.M.; Ducasse, C.; Bonniaud, P.; Ravagnan, L.; Susin, S.A.; Diaz-Latoud, C.; Gurbuxani, S.; Arrigo, A.P.; Kroemer, G.; Solary, E.; et al. Hsp27 negatively regulates cell death by interacting with cytochrome c. Nat. Cell. Biol. 2000, 2, 645–652. [Google Scholar] [CrossRef] [PubMed]
  7. Havasi, A.; Li, Z.; Wang, Z.; Martin, J.L.; Botla, V.; Ruchalski, K.; Schwartz, J.H.; Borkan, S.C. Hsp27 inhibits Bax activation and apoptosis via a phosphatidylinositol 3-kinase-dependent mechanism. J. Biol. Chem. 2008, 283, 12305–12313. [Google Scholar] [CrossRef] [PubMed] [Green Version]
  8. Jin, C.; Cleveland, J.C.; Ao, L.; Li, J.; Zeng, Q.; Fullerton, D.A.; Meng, X. Human myocardium releases heat shock protein 27 (HSP27) after global ischemia: The proinflammatory effect of extracellular HSP27 through toll-like receptor (TLR)-2 and TLR4. J. Mol. Med. 2014, 20, 280–289. [Google Scholar] [CrossRef] [PubMed]
  9. Salari, S.; Seibert, T.; Chen, Y.X.; Hu, T.; Shi, C.; Zhao, X.; Cuerrier, C.M.; Raizman, J.E.; O’Brien, E.R. Extracellular HSP27 acts as a signaling molecule to activate NF-kappaB in macrophages. Cell Stress Chaperones 2013, 18, 53–63. [Google Scholar] [CrossRef] [Green Version]
  10. EGS. European Glaucoma Society Terminology and Guidelines for Glaucoma, 4th Edition—Chapter 2: Classification and terminology Supported by the EGS Foundation: Part 1: Foreword; Introduction; Glossary; Chapter 2 Classification and Terminology. Br. J. Ophthalmol. 2017, 101, 73–127. [Google Scholar] [CrossRef] [Green Version]
  11. Tezel, G.; Hernandez, R.; Wax, M.B. Immunostaining of heat shock proteins in the retina and optic nerve head of normal and glaucomatous eyes. Arch. Ophthalmol. 2000, 118, 511–518. [Google Scholar] [CrossRef] [PubMed] [Green Version]
  12. Chidlow, G.; Wood, J.P.; Casson, R.J. Expression of inducible heat shock proteins Hsp27 and Hsp70 in the visual pathway of rats subjected to various models of retinal ganglion cell injury. PLoS ONE 2014, 9, e114838. [Google Scholar] [CrossRef] [PubMed] [Green Version]
  13. Kalesnykas, G.; Niittykoski, M.; Rantala, J.; Miettinen, R.; Salminen, A.; Kaarniranta, K.; Uusitalo, H. The expression of heat shock protein 27 in retinal ganglion and glial cells in a rat glaucoma model. Neuroscience 2007, 150, 692–704. [Google Scholar] [CrossRef]
  14. Chen, H.; Cho, K.S.; Vu, T.H.K.; Shen, C.H.; Kaur, M.; Chen, G.; Mathew, R.; McHam, M.L.; Fazelat, A.; Lashkari, K.; et al. Commensal microflora-induced T cell responses mediate progressive neurodegeneration in glaucoma. Nat. Commun. 2018, 9, 3209. [Google Scholar] [CrossRef]
  15. Wax, M.B.; Tezel, G.; Yang, J.; Peng, G.; Patil, R.V.; Agarwal, N.; Sappington, R.M.; Calkins, D.J. Induced autoimmunity to heat shock proteins elicits glaucomatous loss of retinal ganglion cell neurons via activated T-cell-derived fas-ligand. J. Neurosci. Off. J. Soc. Neurosci. 2008, 28, 12085–12096. [Google Scholar] [CrossRef] [Green Version]
  16. Joachim, S.C.; Grus, F.H.; Kraft, D.; White-Farrar, K.; Barnes, G.; Barbeck, M.; Ghanaati, S.; Cao, S.; Li, B.; Wax, M.B. Complex antibody profile changes in an experimental autoimmune glaucoma animal model. Investig. Ophthalmol. Vis. Sci. 2009, 50, 4734–4742. [Google Scholar] [CrossRef]
  17. Grotegut, P.; Kuehn, S.; Dick, H.B.; Joachim, S.C. Destructive effect of intravitreal heat shock protein 27 application on retinal ganglion cells and neurofilament. Int. J. Mol. Sci. 2020, 21, 549. [Google Scholar] [CrossRef] [Green Version]
  18. Imai, Y.; Ibata, I.; Ito, D.; Ohsawa, K.; Kohsaka, S. A novel gene iba1 in the major histocompatibility complex class III region encoding an EF hand protein expressed in a monocytic lineage. Biochem. Biophys. Res. Commun. 1996, 224, 855–862. [Google Scholar] [CrossRef]
  19. McLean, P.J.; Kawamata, H.; Shariff, S.; Hewett, J.; Sharma, N.; Ueda, K.; Breakefield, X.O.; Hyman, B.T. TorsinA and heat shock proteins act as molecular chaperones: Suppression of alpha-synuclein aggregation. J. Neurochem. 2002, 83, 846–854. [Google Scholar] [CrossRef]
  20. Mehlen, P.; Coronas, V.; Ljubic-Thibal, V.; Ducasse, C.; Granger, L.; Jourdan, F.; Arrigo, A.P. Small stress protein Hsp27 accumulation during dopamine-mediated differentiation of rat olfactory neurons counteracts apoptosis. Cell Death Differ. 1999, 6, 227–233. [Google Scholar] [CrossRef]
  21. Huot, J.; Houle, F.; Spitz, D.R.; Landry, J. HSP27 phosphorylation-mediated resistance against actin fragmentation and cell death induced by oxidative stress. Cancer Res. 1996, 56, 273–279. [Google Scholar] [PubMed]
  22. Krueger-Naug, A.M.; Hopkins, D.A.; Armstrong, J.N.; Plumier, J.C.; Currie, R.W. Hyperthermic induction of the 27-kDa heat shock protein (Hsp27) in neuroglia and neurons of the rat central nervous system. J. Comp. Neurol. 2000, 428, 495–510. [Google Scholar] [CrossRef]
  23. Matozaki, M.; Saito, Y.; Yasutake, R.; Munira, S.; Kaibori, Y.; Yukawa, A.; Tada, M.; Nakayama, Y. Involvement of Stat3 phosphorylation in mild heat shock-induced thermotolerance. Exp. Cell Res. 2019, 377, 67–74. [Google Scholar] [CrossRef] [PubMed]
  24. Schmidt, T.; Fischer, D.; Andreadaki, A.; Bartelt-Kirbach, B.; Golenhofen, N. Induction and phosphorylation of the small heat shock proteins HspB1/Hsp25 and HspB5/alphaB-crystallin in the rat retina upon optic nerve injury. Cell Stress Chaperones 2016, 21, 167–178. [Google Scholar] [CrossRef] [Green Version]
  25. Huang, W.; Fileta, J.B.; Filippopoulos, T.; Ray, A.; Dobberfuhl, A.; Grosskreutz, C.L. Hsp27 phosphorylation in experimental glaucoma. Invest. Ophthalmol. Vis. Sci. 2007, 48, 4129–4135. [Google Scholar] [CrossRef]
  26. Kuehn, S.; Meissner, W.; Grotegut, P.; Theiss, C.; Dick, H.B.; Joachim, S.C. Intravitreal S100B Injection Leads to Progressive Glaucoma Like Damage in Retina and Optic Nerve. Front. Cell. Neurosci. 2018, 12, 312. [Google Scholar] [CrossRef] [Green Version]
  27. Ueki, Y.; Reh, T.A. Activation of BMP-Smad1/5/8 signaling promotes survival of retinal ganglion cells after damage in vivo. PLoS ONE 2012, 7, e38690. [Google Scholar] [CrossRef]
  28. Gao, L.; Zheng, Q.J.; Ai, L.Q.; Chen, K.J.; Zhou, Y.G.; Ye, J.; Liu, W. Exploration of the glutamate-mediated retinal excitotoxic damage: A rat model of retinal neurodegeneration. Int. J. Ophthalmol. 2018, 11, 1746–1754. [Google Scholar]
  29. Lam, T.T.; Abler, A.S.; Kwong, J.M.; Tso, M.O. N-methyl-D-aspartate (NMDA)--induced apoptosis in rat retina. Invest. Ophthalmol. Vis. Sci. 1999, 40, 2391–2397. [Google Scholar]
  30. Batulan, Z.; Pulakazhi Venu, V.K.; Li, Y.; Koumbadinga, G.; Alvarez-Olmedo, D.G.; Shi, C.; O’Brien, E.R. Extracellular Release and Signaling by Heat Shock Protein 27: Role in Modifying Vascular Inflammation. Front. Immunol. 2016, 7, 285. [Google Scholar] [CrossRef] [Green Version]
  31. Thuringer, D.; Jego, G.; Wettstein, G.; Terrier, O.; Cronier, L.; Yousfi, N.; Hebrard, S.; Bouchot, A.; Hazoume, A.; Joly, A.L.; et al. Extracellular HSP27 mediates angiogenesis through Toll-like receptor 3. FASEB J 2013, 27, 4169–4183. [Google Scholar] [CrossRef]
  32. Aliprantis, A.O.; Yang, R.B.; Weiss, D.S.; Godowski, P.; Zychlinsky, A. The apoptotic signaling pathway activated by Toll-like receptor-2. Embo J. 2000, 19, 3325–3336. [Google Scholar] [CrossRef] [Green Version]
  33. Han, K.J.; Su, X.; Xu, L.G.; Bin, L.H.; Zhang, J.; Shu, H.B. Mechanisms of the TRIF-induced interferon-stimulated response element and NF-kappaB activation and apoptosis pathways. J. Biol. Chem. 2004, 279, 15652–15661. [Google Scholar] [CrossRef] [Green Version]
  34. Luo, X.; Budihardjo, I.; Zou, H.; Slaughter, C.; Wang, X. Bid, a Bcl2 interacting protein, mediates cytochrome c release from mitochondria in response to activation of cell surface death receptors. Cell 1998, 94, 481–490. [Google Scholar] [CrossRef] [Green Version]
  35. Huang, W.; Fileta, J.B.; Dobberfuhl, A.; Filippopolous, T.; Guo, Y.; Kwon, G.; Grosskreutz, C.L. Calcineurin cleavage is triggered by elevated intraocular pressure, and calcineurin inhibition blocks retinal ganglion cell death in experimental glaucoma. Proc. Natl. Acad. Sci. USA 2005, 102, 12242–12247. [Google Scholar] [CrossRef] [Green Version]
  36. Solt, L.A.; May, M.J. The IkappaB kinase complex: Master regulator of NF-kappaB signaling. Immunol. Res. 2008, 42, 3–18. [Google Scholar] [CrossRef] [Green Version]
  37. Wang, N.; Liang, H.; Zen, K. Molecular mechanisms that influence the macrophage m1-m2 polarization balance. Front. Immunol. 2014, 5, 614. [Google Scholar] [CrossRef] [Green Version]
  38. Bosco, A.; Steele, M.R.; Vetter, M.L. Early microglia activation in a mouse model of chronic glaucoma. J. Comp. Neurol. 2011, 519, 599–620. [Google Scholar] [CrossRef] [Green Version]
  39. Ebneter, A.; Casson, R.J.; Wood, J.P.; Chidlow, G. Microglial activation in the visual pathway in experimental glaucoma: Spatiotemporal characterization and correlation with axonal injury. Investig. Ophthalmol. Vis. Sci. 2010, 51, 6448–6460. [Google Scholar] [CrossRef] [Green Version]
  40. Lawrence, T. The nuclear factor NF-kappaB pathway in inflammation. Cold Spring Harb. Perspect. Biol. 2009, 1, a001651. [Google Scholar] [CrossRef] [Green Version]
  41. Tak, P.P.; Firestein, G.S. NF-kappaB: A key role in inflammatory diseases. J. Clin. Investig. 2001, 107, 7–11. [Google Scholar] [CrossRef]
  42. Lorenz, K.; Beck, S.; Keilani, M.M.; Wasielica-Poslednik, J.; Pfeiffer, N.; Grus, F.H. Course of serum autoantibodies in patients after acute angle-closure glaucoma attack. Clin. Exp. Ophthalmol. 2017, 45, 280–287. [Google Scholar] [CrossRef] [PubMed]
  43. Tezel, G.; Seigel, G.M.; Wax, M.B. Autoantibodies to small heat shock proteins in glaucoma. Investig. Ophthalmol. Vis. Sci. 1998, 39, 2277–2287. [Google Scholar]
  44. Joachim, S.C.; Bruns, K.; Lackner, K.J.; Pfeiffer, N.; Grus, F.H. Antibodies to alpha B-crystallin, vimentin, and heat shock protein 70 in aqueous humor of patients with normal tension glaucoma and IgG antibody patterns against retinal antigen in aqueous humor. Curr. Eye Res. 2007, 32, 501–509. [Google Scholar] [CrossRef]
  45. Noristani, R.; Kuehn, S.; Stute, G.; Reinehr, S.; Stellbogen, M.; Dick, H.B.; Joachim, S.C. Retinal and Optic Nerve Damage is Associated with Early Glial Responses in an Experimental Autoimmune Glaucoma Model. J. Mol. Neurosci. Mn 2016, 58, 470–482. [Google Scholar] [CrossRef]
  46. Reinehr, S.; Reinhard, J.; Gandej, M.; Kuehn, S.; Noristani, R.; Faissner, A.; Dick, H.B.; Joachim, S.C. Simultaneous Complement Response via Lectin Pathway in Retina and Optic Nerve in an Experimental Autoimmune Glaucoma Model. Front. Cell. Neurosci. 2016, 10, 140. [Google Scholar] [CrossRef] [Green Version]
Figure 1. Localization and expression level of heat shock proteins. (A) Heat shock protein 25 (HSP25, green), astrocytes (GFAP, red), neuronal cells (NeuN, red), and cell nuclei (DAPI, blue) were stained on retinal cross-sections. The detail view revealed that HSP25 signals were rather colocalized with GFAP signals than with NeuN signals (detail). (B) The HSP25 signal was strongly increased in the heat shock protein 27 (HSP27) group as compared with the native (p = 0.017) and PBS group (p = 0.014). (C) Compared to controls, a significant increase in Hspb1 mRNA expression was measured in HSP27 treated retinae (HSP27 vs. native: p = 0.040 and HSP27 vs. PBS: p = 0.010). (D) Via RT-qPCR, a significant increase in Hsp90aa1 mRNA expression was also observed in the HSP27 group as compared with the PBS group (p = 0.002), but not compared with the native group. (E) In contrast, the relative mRNA expression of Hspb70 was similar in all groups. Scale bars = 20 μm. GCL, ganglion cell layer; IPL, inner plexiform layer; INL, inner nuclear layer. * p < 0.05 and ** p < 0.01. Immunohistology = mean ± SEM, RT-qPCR = median ± quartile + minimum/ maximum. Dashed line represents the relative expression level of the control group.
Ijms 22 00513 g001
Figure 2. Constant number of retinal ganglion cells but increased apoptosis rate. (A) Retinal ganglion cells (RGCs) in the retina were marked with RBPMS (green), apoptotic RGCs with Bax (red), and cell nuclei with DAPI (blue). (B) RBPMS cell count revealed no differences among the HSP27, the PBS, and the native group. (C) Bax+ cell counts also demonstrated no differences among the groups. (D) The expression level of Pou4f1 (marker for RGC), investigated by RT-qPCR, was similar in the groups. (E) The relative expression of Casp3 mRNA was significantly increased in the HSP27 group as compared with the native group (p = 0.003) and the PBS group (p = 0.042). (F) Via RT-qPCR, an increase in Casp8 mRNA expression was detected in HSP27 retinae as compared with both control groups (native: p = 0.039 and PBS: p = 0.046). (G) The mRNA expression of Casp9 was also increased in HSP27 animals as compared with the native group (p = 0.024) and PBS group (p = 0.029). Scale bar = 20 µm. GCL, ganglion cell layer; IPL, inner plexiform layer; INL, inner nuclear layer. * p < 0.05 and ** p < 0.01. Immunohistology = mean ± SEM, RT-qPCR = median ± quartile + minimum/maximum. Dashed line represents the relative expression level of the control group, solid line represents 100%.
Ijms 22 00513 g002
Figure 3. Increased NFκB signals after HSP27 injection. (A) Nucleus factor-kappa-light-chain-enhancer of activated B cells (NFκB, green) and DAPI (blue) were stained on retinal cross-sections. (B) More NFκB signals were noted in the HSP27 group than in the native (p = 0.008) and PBS group (p = 0.043). (C) The relative NfκB mRNA expression level in the HSP27 group was increased as compared with the native group (p = 0.049) and PBS group (p = 0.017). (D) Regarding Prkd1 mRNA expression, no differences were noted. (E) The relative Mapk14 mRNA expression level in HSP27 retinae was similar as compared with both control groups. (F) Analysis of relative Akt1 mRNA expression revealed no differences among the groups. Scale bar = 20 µm. GCL, ganglion cell layer; IPL, inner plexiform layer; INL, inner nuclear layer; OPL, outer plexiform layer. * p < 0.05 and ** p < 0.01. Immunohistology = mean ± SEM, RT-qPCR = median ± quartile + minimum/ maximum. Dashed line represents the relative expression level of the control group, solid line represents 100%.
Ijms 22 00513 g003
Figure 4. Intravitreal HSP27 injection induced microglia/macrophage and T-Cell response. (A) Microglia/macrophages (Iba1, red) in an active state (ED1, green, arrows) were marked on retinal cross-sections. DAPI (blue) was used to visualize cell nuclei. (B) HSP27 increased the number of microglia (native, p = 0.015 and PBS, p = 0.022). (C) In HSP27 retinae, a higher number of ED1+ and Iba1+ cells was noted as compared with both controls (native: p = 0.013 and PBS: p = 0.034). (D) CD3+ T-cells (green) and cell nuclei (DAPI, blue) were stained in retinae. (E) More T-cells were counted in HSP27 retinae than in both controls (native: p = 0.008 and PBS: p = 0.015). Scale bar = 20 µm. GCL, ganglion cell layer; IPL, inner plexiform layer; INL, inner nuclear layer; OPL, outer plexiform layer; ONL, outer nuclear layer. * p < 0.05 and ** p < 0.01. Immunohistology = mean ± SEM. Solid line represents 100% cells.
Ijms 22 00513 g004
Figure 5. Constant HSP25 expression and unchanged NFκB signal in the optic nerve. (A) HSP25 (green), NFκB (red), and cell nuclei (DAPI, blue) were labeled on optic nerve longitudinal sections. (B) The evaluation of the percentage area of the HSP25 signals showed no differences among the three groups. (C) The counting of the NFkB+ signals also showed no differences among the groups. Scale bar = 20 µm. Immunohistology = mean ± SEM. Solid line represents 100% cells.
Ijms 22 00513 g005
Figure 6. The optic nerves show an increased rate of apoptosis after HSP27 injection. (A) The antibody against SMI-32 (green) was applied to identify the neurofilaments in the optic nerve. Cleaved caspase 3 (red) was used to detect apoptotic cells and cell nuclei were stained with DAPI (blue). (B) Fourteen days after HSP27 injection, no effects on the neurofilament were noted via SMI-32 scoring. (C) The number of DAPI+ cell nuclei did not change significantly. (D) The cleaved caspase 3 cell count revealed an increase of apoptotic cells in the HSP27 group as compared with the native group (p < 0.001) and PBS group (p < 0.001). Scale bar = 20 µm. *** p < 0.001 and immunohistology = mean ± SEM. Solid line represents 100% cells.
Ijms 22 00513 g006
Figure 7. Constant number of microglia/macrophages and T-cells in the optic nerve. (A) Microglia/macrophages (Iba1, green) and microglia/macrophages in active state (ED1, red), as well as nuclei (DAPI, blue), were marked in the optic nerve. (B) The number of microglia/macrophages was comparable in all groups. (C) Likewise, no differences among the native group, the PBS group, and the HSP27 group could be observed regarding to the number of activated microglia/macrophages. (D) T-cells (CD3, green) and nuclei (DAPI, blue) were stained in the optic nerve. (E) Evaluation of the CD3+ signals showed no significant differences among the groups. Scale bar = 20 µm. Immunohistology = mean ± SEM. Solid line represents 100% cells.
Ijms 22 00513 g007
Figure 8. Summary of the degenerative mechanisms. HSP27 might act as an extracellular signaling molecule and binds to a receptor. As a result, intrinsic and extrinsic apoptotic mechanisms are activated. The NFκB pathway could also be activated. In addition, an increase in microglia/macrophages as well as T-cells can be observed in the retina.
Ijms 22 00513 g008
Table 1. Primary and secondary antibodies used for immunohistochemistry.
Primary AntibodiesSecondary Antibodies
Name and hostCompanyDilutionNameCompanyDilution
Retinal Cross-sections
Bax (rabbit)Abcam1:100Donkey anti-rabbit Alexa Fluor 555Abcam1:400
CD3-FITC (directly labeled antibody, mouse)BD Biosciences1:1000
ED1 (mouse)Millipore1:250Goat anti-mouse Alexa Fluor 488Invitrogen1:400
GFAP (chicken)Millipore1:400Donkey anti-chicken Cy3Millipore1:500
HSP25 (rabbit)Enzo Life Sciences1:100Donkey anti-rabbit Alexa Fluor 488Jackson ImmunoResearch1:500
Iba1 (rabbit)Wako1:500Goat anti-rabbit Cy3Linaris1:300
NeuN (chicken)Millipore1:500Donkey anti-chicken Cy3Millipore1:500
NFκB (rabbit)Santa Cruz1:500Goat anti-rabbit Alexa Fluor 488Invitrogen1:500
RBPMS (guinea pig)Millipore1:250Donkey anti-guinea pig Alexa 488Jackson ImmunoResearch1:400
Longitudinal Optic NerveSections
CD3-FITC (directly labeled antibody, mouse)BD Biosciences1:100
Cl. caspase3 (rabbit)Sigma-Aldrich1:300Donkey anti-rabbit Alexa Fluor 555Invitrogen1:400
ED1 (mouse)Millipore1:200Goat anti-mouse Alexa Fluor 555Invitrogen1:500
HSP25 (rabbit)Enzo Life Sciences1:100Donkey anti-rabbit Alexa Fluor 488Jackson ImmunoResearch1:500
Iba1 (rabbit)Wako1:400Goat anti-rabbit Alexa Fluor 488Invitrogen1:500
SMI-32 (mouse)Biolegend1:2000Goat anti-mouse Alexa Fluor 488Invitrogen1:400
Table 2. List of oligonucleotides used for mRNA expression analysis in retinae.
GenePrimer SequenceGenBank Accession Number
Actb-FcccgcgagtacaaccttctNM_031144.3
Actb-Rcgtcatccatggcgaact
Akt1-FgacgtagccattgtgaaggagNM_033230.2
Akt1-Rccatcattcttgaggaggaagt
Casp3-FccgacttcctgtatgcttactctaNM_012922.2
Casp3-Rcatgacccgtcccttgaa
Casp8-FagagcctgagggaaagatgtcNM_022277.1
Casp8-Rtcacatcatagttcacgccagt
Casp9-FcgtggtggtcatcctctctcNM_031632.1
Casp9-Rgagcatccatctgtgccata
Hspb1-FgaggagctcacagttaagaccaaNM_031970.4
Hspb1-Rttcatcctgcctttcttcgt
Hspb70-FcatatccaatatctttgaggtggaXM_017601842.1
Hspb70-Rtggggaagacttcacagtca
Hsp90aa1-FgggagctcatttccaactccNM_175761.2
Hsp90aa1-Rgggttcggtcttgcttgtt
Mapk14-FgaacttcgcaaatgtatttattggtNM_031020.2
Mapk14-Rcgagtccaaaaccagcatc
Nfκb-FctggcagctcttctcaaagcNM_001276711.1
Nfκb-Rcaggtcatagagaggctcaa
Pou4f1-FctggccaacctcaagatccXM_008770931
Pou4f1-Rcgtgagcgactcgaacct
Ppid-FtgctggaccaaacacaaatgM19553.1
Ppid-Rcttcccaaagaccacatgct
Prkd1-FtgctccttcaggactcctctNM_001276715.1
Prkd1-Rgaagccacattcagggaact
Publisher’s Note: MDPI stays neutral with regard to jurisdictional claims in published maps and institutional affiliations.

