
Time-Course Transcriptomic Profiling of Floral Induction in Cultivated Strawberry


1
Department of Fruit Science, College of Horticulture, China Agricultural University, Beijing 100193, China
2
Key Laboratory of Landscaping Agriculture, Ministry of Agriculture and Rural Affairs, College of Horticulture, Nanjing Agricultural University, Nanjing 210095, China
*
Author to whom correspondence should be addressed.
†
These authors contributed equally to this work.
Int. J. Mol. Sci. 2022, 23(11), 6126; https://doi.org/10.3390/ijms23116126
Submission received: 14 April 2022
/
Revised: 25 May 2022
/
Accepted: 25 May 2022
/
Published: 30 May 2022
(This article belongs to the Special Issue Advances in Research for Fruit Crop Breeding and Genetics)
Abstract
:The initiation and quality of flowering directly affect the time to market and economic benefit of cultivated strawberries, but the underlying mechanisms of these processes are largely unknown. To investigate the gene activity during the key period of floral induction in strawberries, time-course transcriptome analysis was performed on the shoot apex of the strawberry cultivar ‘Benihoppe.’ A total of 7177 differentially expressed genes (DEGs) were identified through pairwise comparisons. These DEGs were grouped into four clusters with dynamic expression patterns. By analyzing the key genes in the potential flowering pathways and the development of the leaf and flower, at least 73 DEGs that may be involved in the regulatory network of floral induction in strawberries were identified, some of which belong to the NAC, MYB, MADS, and SEB families. A variety of eight hormone signaling pathway genes that might play important roles in floral induction were analyzed. In particular, the gene encoding DELLA, a key inhibitor of the gibberellin signaling pathway, was found to be significantly differentially expressed during the floral induction. Furthermore, the differential expression of some important candidate genes, such as TFL1, SOC1, and GAI-like, was further verified by qRT-PCR. Therefore, we used this time-course transcriptome data for a preliminary exploration of the regulatory network of floral induction and to provide potential candidate genes for future studies of flowering in strawberries.
1. Introduction
Strawberries (Fragaria sp.) belong to the large botanical family Rosaceae which contains many species with high economic value worldwide [1,2]. Most strawberry genotypes are short-day (SD) plants that are induced to flower in the autumn when exposed to decreasing photoperiod and temperature [3,4,5]. With the onset of these “autumn signals”, the shoot apical meristem (SAM) undergoes a transformation from leaf primordia to flower primordia, and the number of branch crowns (axillary leaf rosette) from the leaf axils is increased with floral induction, which may promote additional inflorescences and has a strong effect on berry yield [1,2,6,7,8,9,10]. Thus, floral induction is one of the most important stages of plant growth and development in agricultural production.
A major ecological trait of perennial plants is the timing of the transition to flowering, which determines the transition from vegetative to reproductive growth. The genetic, epigenetic, hormonal, and environmental factors for the transition from the vegetative to reproductive stage are best understood in the annual long-day (LD) plant Arabidopsis thaliana [11,12]. At least 180 genes have been shown to be involved in flowering-time control in Arabidopsis, and these genes mainly function in regulatory networks of different pathways that integrate environmental (photoperiod, vernalization, and temperature) and endogenous (autonomous, gibberellin, circadian clock, and age) signals [11,13]. CONSTANS (CO) is a central activator that mediates the photoperiodic pathway. FLOWERING LOCUS C (FLC) acts as a central suppressor to regulate the vernalization and autonomous pathways. The concentrations of SQUAMOSA PROMOTER BINDING LIKE (SPL) transcription factors increase with plant age. All of these genes regulate the downstream floral pathway integrator transcription factors FLOWERING LOCUS T (FT), SUPPRESSOR OF OVEREXPRESSION OF CONSTANS 1 (SOC1), and AGAMOUS LIKE24 (AGL24), which activate the expression of the meristem identity genes LEAFY (LFY), APETALA1 (AP1), SEPALLATA3 (SEP3), and FRUITFULL (FUL) [11,14,15]. In addition, mutations that reduce the expression of biosynthesis pathway genes or enhance the degradation of gibberellic acid (GA) showed delayed flowering [16]. The functions of these homologous genes from different species, especially model plants, are gradually becoming clear.
Flowering has always been the focus of strawberry crop research. The induction of flowers generally takes three steps: the vegetative stage, in which vegetative SAM gives rise to leaf primordia; then SAM shifts to the reproductive stage, where the initiation of flower meristem occurs from SAM and the entire shoot apex looks fat; followed by the next stage, the development of flower primordia [17,18]. Although TERMINAL FLOWER 1 (TFL1) functions to maintain the vegetative meristem in both the woodland strawberry (Fragria vesca) and Arabidopsis, it has been shown to be the major floral suppressor in the strawberry, whereas it plays only a minor role in flowering time in Arabidopsis [19,20,21,22]. According to previous studies, FvTFL1 integrates both photoperiodic and temperature signals to control floral induction in strawberries. Weak expression of FvTFL1 in cool temperatures below 13 °C or SDs at temperatures of 13–20 °C allows floral induction to occur [21,23,24]. Photoperiodic flowering has been better studied than temperature-induced flowering in F. vesca. The activation of FvCO is affected by light, and CO plays a major role in activating FvFT1 in leaves. FT acts as a florigen, moving to the shoot apex to form leaves, and SOC1 acts as the hub for multiple flowing times in Arabidopsis. However, the leaf-expressed FvFT1 in strawberries represses flowering by activating FvTFL1 at SAM through FvSOC1 in LDs [13,20,21,25]. Whereas under SD, the silenced FvFT1-FvSOC1-FvTFL1 pathway leads to the increased expression of the floral meristem identity marker genes FvAP1 and FvFUL1, which were considered a floral marker gene and have been used many times in the studies of strawberry flowering [21,25,26,27,28]. Xiong, et al. [29] reported that FvSPL10, the ortholog of AtSPL9 in Arabidopsis, activates FvAP1 by directly binding to its promoter and ectopic expression of FvSPL10 in Arabidopsis promotes early flowering and increases organ size. However, whether FvSPL10 is involved in regulating the age pathway in strawberry flowering is unknown at present.
Axillary buds (AXBs) fate is closely related to SAM fate in strawberries. AXBs mainly differentiate into runners (a type of elongated branch) during vegetative growth. In contrast, in reproductive growth, runner induction ceases, and the number of branch crowns increases with floral induction [1,2,6,7,8,9,10]. As a result, a trade-off between flowering and runner formation has been proposed, and it is also obvious in perpetual flowering strawberry varieties, in which flowering is promoted by LD (long days), but very few runners are produced [1,7,8,9,10]. GA is one of the key factors involved in floral induction and AXB differentiation in strawberries [7]. GA3 treatment can effectively inhibit floral induction and promote runner formation in strawberries [30,31,32]. Mutations in the rate-limiting enzyme gene GA20ox4 in the GA biosynthetic pathway result in a runner-free phenotype. Additionally, a mutation in a DELLA growth inhibitor gene that regulates the GA signaling pathway caused a runner-less phenotype [27,33,34]. In addition, the floral integrator SOC1 affects both floral induction and AXB fate by regulating the GA synthesis pathway, which provides evidence for GA inhibition of strawberry floral initiation [25]. However, the effect of GA on floral induction varies with species. GA can promote flower formation in Arabidopsis but inhibit flowering in apples and strawberries [7,35,36].
Although several genes that control flowering in strawberries have been identified and functionally characterized, more details of the floral induction of this important berry crop have not been explored. In this study, we generated time-course RNA-seq data of the three floral induction stages in the cultivated strawberry ‘Benihoppe.’ Many genes potentially related to the floral induction process were investigated, such as the genes for seven potential flower-time control pathways, leaf development, and flower development during floral induction. In addition, the MADS family and SEB family genes, closely related to flowering, and eight hormone signaling pathway genes were investigated. These transcription factors and a variety of hormone signals form a regulatory network to regulate floral induction. These results will provide new ideas for future functional studies and shed light on the genetic control of floral induction in strawberries.
2. Results and Discussion
2.1. Morphological Observation and FaAP1 Expression during Floral Induction in ‘Benihoppe’ Strawberry
The daughter plants of ‘Benihoppe’ were rooted on 6 June 2018, which was recorded as the 0 week (0 w) (Figure S1). In order to understand the morphological changes and corresponding marker genes of the strawberries during the floral induction, samples were collected weekly from 8 weeks (8 w), and the morphology of the SAMs was observed. We found that SAMs showed no significant changes from 8 w to 13 w and remained in the vegetative stage (Figure 1A,B). Then the SAM looked fatter from 14 w (Figure 1C), it was speculated that the flower meristem was starting, and the SAM shifted to the reproductive stage. Further, the flower primordia could be observed from 15 w with the changes in the environment (Figure 1D,E). By analyzing the expression of the FaAP1 during 8 w–16 w, the results showed that expression gradually increased from 13 w, suggesting that FaAP1 expression is up-regulated prior to the morphological change (Figure 1F).
2.2. Transcriptome Sequencing
Considering the results of the morphological observations and the expression profile of FaAP1, samples at 9 w (vegetative stage), 13 w (shifts to the reproductive stage at gene level), and 15 w (reproductive stage) were selected for transcriptome sequencing. A total of 9 cDNA libraries were prepared from the RNA extracted from the shoot apex. After Illumina sequencing, the data were filtered to remove low-quality reads and adapters. A total of 441,229,076 clean reads were obtained, of which the clean base was 66.18 G, and the average GC content was 47.61%. An average of 98.36% of the sequenced bases had quality scores (Q-scores) of Q30 or higher (Table 1). Clean reads from the nine libraries were compared with the Fragaria × ananassa ‘Camarosa’ Genome (Version 1.0).
Spearman correlation coefficient analysis showed that the correlation coefficients of the three replicates were greater than 0.925, indicating that the RNA-seq data could be used for further analysis (Figure S2).
2.3. GO Category Enrichment Analysis of the Differentially Expressed Genes
|Log2 fold-change| (|Log2 FC|) ≥1, and p value < 0.05 were used as the critical thresholds to define the differentially expressed genes (DEGs). When compared with plants at 9 w, 3719 DEGs were significantly changed at 13 w, and of these, 2368 DEGs were up-regulated, and 1351 DEGs were down-regulated. Compared with plants at 13 w, 4525 genes showed significant differential expression at 15 w; 2174 DEGs were up-regulated, and 2351 DEGs were down-regulated (Figure 2A). Based on the expression trend of the DEGs, 322 DEGs that were up-regulated at both 13 w and 15 w were classified as Cluster 1 (Figure 2B,C), and 18 DEGs that were down-regulated at both 13 w and 15 w were classified as Cluster 2 (Figure 2B,D). The 463 DEGs that were up-regulated at 13 w and down-regulated at 15 w were classified as Cluster 3 (Figure 2B,E), and 264 DEGs that were down-regulated at 13 w and down-regulated at 15 w were classified as Cluster 4 (Figure 2B,F). To explore the functions of the genes in the four clusters of DEGs, we performed GO category enrichment analysis, and the results showed that the DEGs in cluster 1 were concentrated in the ‘biological process’ GO category in terms such as ‘cell division,’ ‘nucleus,’ ‘DNA binding,’ and ‘protein binding function’ (Figure 2G). The DEGs in cluster 2 were concentrated in the terms ‘response to auxin,’ ‘regulation of transcription,’ ‘nucleus,’ and ‘DNA binding transcription factor activity functions’ (Figure 2H). The genes in cluster 3 were mainly concentrated in the ‘regulation of transcription,’ ‘nucleus,’ and ‘molecular functions’ terms (Figure 2I), and the genes in cluster 4 were mainly concentrated in the terms ‘chloroplast, ‘cytoplasm’, ‘protein binding’, and ‘oxidation-reduction process’ (Figure 2J). These results are a preliminary analysis of the clustering of differentially expressed genes. In addition, to further explore the high-expression (FPKM>2) of DEGs at the three time points during the floral induction in the strawberries, |Log2FC| ≥ 2, p < 0.001, and average of FPKM>2 was used as the critical thresholds to define the highly differentially expressed genes (HDEGs). The functions of unknown genes or the unknown functions of known genes can be identified by clustering genes with the same or similar expression patterns. Hierarchical clustering of the HDEGs, which were clustered by the log2 of the FPKM values, is shown in Figures S3–S5.
2.4. Comparison of Potential Flowering Pathway Genes in Strawberry and Arabidopsis
To fully identify candidate genes in the flowering time pathway in the strawberries, we retrieved 68 homologs of important Arabidopsis flower induction genes from the transcriptome data and analyzed their FPKM values. These genes are roughly classified as participating in the photoperiod, vernalization, autonomous, gibberellin, age, and carbohydrate pathways based on the known flowering pathways in Arabidopsis [1,11,13].
The FPKM values of some genes that are involved in the photoperiod pathway can be detected in the shoot apex. Surprisingly, some DEGs in this pathway that appear to have inconsistent functions were identified in short-day strawberries as compared with long-day Arabidopsis (Figure S6). For example, FLAVIN BINDING KELCH REPEAT F-BOX 1 (FKF1) [37], GIGANTEA (GI) [38], PSEUDO-RESPONSE REGULATOR 5 (APRR5), and APRR7 [39] play positive roles in flowering in Arabidopsis, while the expression of their strawberry homologs was significantly decreased at 13 w compared with 9 w (Figure S6), even though CO and FKF1 were both promoted in the leaves during the blue light-induced floral induction of strawberry [40]. However, strawberry homologs of LUX ARRHYTHMO (LUX) [41], NUCLEAR FACTOR Y, SUBUNIT B2 (NF-YB2) [42], and CONSTITUTIVE PHOTOMORPHOGENIC 1-like (COP1-like) [43] showed similar expression trends during the floral induction compared with Arabidopsis genes. For this result, we speculated that these genes are mainly expressed and function in leaves. Thus, their transcript level in the SAM is not very meaningful for functional analysis of these genes during the floral induction.
In addition to the photoperiod pathway, the vernalization pathway is also an important flowering pathway in Arabidopsis. In this transcriptome data, only FLOWERING LOCUS C (FLC) [44] and ARABIDOPSIS TRITHORAX 1 (ATX1) [45] were identified as DEGs among the homologous genes related to the vernalization pathway (Figure 3A). Although both FLC and ATX1 act repressors during flowering in Arabidopsis, our results show that the expression of FLC at 15 w was significantly increased compared to 9 w, and the expression of ATX1 was increased at 13 w and decreased at 15 w. It is speculated that in addition to the factors of the expression locations of some genes, changes in seedling status and environment may also be significant factors.
We did not find DEGs in the autonomous and age-related pathways in the strawberries (Figure 3B). Although homologs of these genes have been reported to play important roles in flowering in Arabidopsis or other species [1,13,46], no significant changes were found during the floral induction in our RNA-seq data. As to the gibberellin pathway, FLOWERING PROMOTING FACTOR 1 (FPF1) [47], DWARF AND DELAYED FLOWERING 1 (DDF1) [48], and DDF2 showed a declining trend in general, while they are promoters of flowering in Arabidopsis. In addition, GAIP [49], an inhibitor of the gibberellin signaling pathway, was upregulated at 13 w, although it acts as a suppressor in Arabidopsis flowering (Figure 3B). These results suggest that they might play opposite roles to Arabidopsis in the process of floral induction in strawberries. Carbohydrate is also thought to play an important role in regulating flowering. We found no significant difference in the expression of TREHALOSE-6-PHOSPHATE SYNTHASE 1 (TPS1) [50], but TPS10 was upregulated at 13 w and was down-regulated at 15 w. In other pathways, we detected continuous down-regulation of HYPERSENSITIVE TO RED AND BLUE 1 (HRB1) [51] (Figure 3B). Taking all of these results into consideration, the functions of key flowering genes in Arabidopsis might not be conserved in strawberries, especially GAIP encoding the DELLA protein, which can be further discussed.
2.5. Analysis of DEGs with Roles in Leaf Development and Flowering
Compared with the sample containing only SAM and a young leaf at 9 w, the sample at 13 w consists of SAM, a young leaf, and the flower meristem in the beginning, and the sample at 15 w consists of SAM and flower primordia (Figure 1A–E). Thus, investigating DEGs related to leaf development and flower development may help better understand the regulatory network of floral induction [18,52]. Expression patterns of 28 homologs of leaf development genes were investigated, including strawberry homologs of growth-regulating factor GRF, cell proliferation gene GRF1-INTERACTING FACTOR (GIF1), adaxial-adaxial gene PHAVOLUTA (PHV) and some active family members, such as REGULATOR OF AXILLARY MERISTEMS 3 (RAX3), KNOTTED-LIKE FROM ARABIDOPSIS THALIANA 2 (KNAT2), and LATERAL ORGAN FUSION 1 (LOF) genes of MYB family, CUC1/2/3 of NAC family, and YAB1/5 and YAB4-like genes of YABBY family (Figure 4A). Compared with the DEGs of leaf development in diploid strawberries, several conserved genes were detected, such as LATERAL SUPPRESSOR (LAS), CUC2/3, FASCIATED EAR (FEA), etc. [18], which can serve as key genes for studying leaf development during the floral induction of strawberry.
Floral induction is a prerequisite for flower development. It has been shown that the floral integrator FvSOC1 acts as a repressor by promoting FvTFL1 during the floral induction in short-day strawberries [25]. In this data, the significant reduction in the expression of SOC1 and TFL1 in our transcriptome at 13 w further verified the repressor role of SOC1 (Figure 4B). The homologs of FT in the strawberry FvFT1 were not detected in the RNA-seq data because it is only expressed in old leaves [18,21]. However, as another homolog of the FT, FT2 was detected in the shoot apices, and its expression was up-regulated at 13 w, indicating that FT2 may function differently from FT1. By analyzing the expression of flower identity genes, we found that the expression of LFY, AP1, and FUL continuously increased as expected, indicating the reliability of the samples. These genes were conserved during the floral induction of octoploid strawberry and diploid strawberry [18,21,25]. Further, several homologs of flower development genes are shown in Figure 4B. The number of the NAC family, MYB family, and bHLH family members accounted for 12.5%, 8.3%, and 16.7% of the 24 DEGs, respectively. They were BRUNO-LIKE 1 (BRN1), NAC29, and NAC89 of NAC family; bHLH63, DYSFUNCTIONAL TAPETUM 1 (DYT1), SPATULA (SPT), and SPT-like of bHLH family; DIVARICATA 1 (DIV1) and MYB6 of MYB family. Besides, primordia-specific gene such as JAGGED (JAG) was also explored. These genes can also be considered candidate genes for studying flower development in strawberries.
2.6. Expression Patterns of DEGs from the MADS and SEB Families
In our analysis of the genes involved in flowering pathways, as well as floral integrators and identity genes, we found at least four MADS family members—AP1, FLC, SOC1, and SVP (Figure 4B). This indicated that MADS family genes might play an important role in the process of flowering in strawberries. MADS family members in cotton, wintersweet (Chimonanthus praecox), peach, pear, and Arabidopsis were also found to be involved in several plant growth and development processes, such as flower morphogenesis, floral induction, gibberellin synthesis, and delay of senescence [53,54,55,56,57]. To investigate the expression of other MADS family members in flowering in strawberries, the nine different genes and their copies were identified by comparing the MADS family in strawberry with the MADS family in Arabidopsis. They are AGAMOUS-LIKE 1 (AGL1), AGL14, MADS57, AGL15, CMB1, PISTILLATA (PI), MADS6-like, MADS2, and MADS14. Except for AGL14 and AGL15, which were significantly up-regulated at 13 w, the other genes, such as MADS57 and CMB1, mainly showed significant changes in expression at 15 w (Figure 5A,B), indicating that most MADS family members could have roles in the reproductive stage.
The SBP family has been reported to be a plant-specific family whose members play important roles in early flowering [58], nutritional change and reproductive stages [59], and the gibberellic acid response [60]. We found that the three SBP family members, SPL3, SPL1-like, and SPL9, showed no significant expression changes during floral induction based on our data, although these homologs were previously reported to be involved in the age pathway of flowering in Arabidopsis [61]. To understand the expression patterns of other members of the SBP family in strawberries, we performed phylogenetically and expression analyses (Figure 5C,D). The results showed that SBP8 and SBP18 were significantly down-regulated at 13 w. In comparison, SBP13 and SBP7 were significantly up-regulated at 15 w, and SBP14 was significantly down-regulated at 15 w compared with expression at 9 w (Figure 5C,D). These results suggest that these SBP family genes might also respond to the process of floral induction in strawberries.
2.7. Expression Analysis of DEGs in Different Hormone Signaling Pathways
Plant hormones, including auxin, cytokinin (CK), abscisic acid (ABA), GA, ethylene, brassinosteroids, jasmonic acid (JA), and salicylic acid (SA), play a synergistic role in floral induction in response to external stimulation and the local environment [62]. KEGG enrichment analysis of the DEGs showed that the most were enriched in the plant signal transduction pathways (Figure 6). Therefore, by referring to the KO04075 pathway (https://www.kegg.jp/kegg-bin/show_pathway?ath04075 accessed on 2 March 2022), the changes in the expression of key genes in various hormone signal transduction pathways during strawberry floral induction were explored. In the RNA-seq data, most of the key genes in the auxin signal transduction pathway were up-regulated (Figure 7A,B). AUX1, TIR1-like, IAA20-like, IAA6, GH3.6, AIP10A5, AIP15A-like, AIP6B, and SAUR38 were significantly up-regulated at 13 w, while AUX2, IAA4-like, GH3.1, GH3.5, and GH3.17-like were up-regulated at 15 w, suggesting that auxin signaling plays a role in promoting floral induction in general. These genes can be used as candidate genes for further study of how flowering is related to auxin. In addition, IAA2-like, GH3.9, and SAUR36 were significantly down-regulated at 13 w, indicating that these genes might act as suppressors in the auxin mediated-flowering in strawberries.
Based on the importance of GA in floral induction, the DELLA protein in the GA signaling pathway has become a popular focus of research. It is the intersection of various hormonal pathways [7,27,33,34,62]. In our data, the repressor of the GA signaling pathway, DELLA, was significantly up-regulated at 13 w. At the same time, GID1B-like, the gibberellin receptor and the inhibitor of DELLA, was decreased at 13 w (Figure 8A,E), indicating that GA signaling might inhibit floral induction in strawberries, contrary to its role in floral induction in Arabidopsis.
CRE1 and AHP are both promoters in the cytokinin signaling pathway (Figure 8B). Our transcriptome data showed that the expression of both genes did not change significantly at 13 w but began to be significantly up-regulated until 15 w (Figure 8E). In the downstream part of the cytokinin pathway, A-ARR expression was increased at 15 w, which was consistent with that of the upstream part. Additionally, expression of B-ARR, which is negatively regulated by A-ARR, was opposite to that of A-ARR. These results suggest that the cytokinin signal transduction pathway might mainly play a role in the reproductive stage. In cytokinin-mediated floral induction in Arabidopsis, DELLA was reported to bind B-ARR, which induces DELLA to re-target the promoter regulated by cytokinin for activation [63,64]. Combined with the analysis of DELLA expression, our results showed that GA and cytokinin might have antagonistic effects on strawberry floral induction.
In the ethylene signaling pathway, the repressor EBF1/2 further inhibits ERF1 by directly inhibiting EIN3, ultimately affecting ethylene signal transduction (Figure 8C). In Arabidopsis, EIN3 delays flowering by activating ERF1 in the APETALA2 (AP2)/ERF1 protein family and its evolutionary relatives, and there is a link between ethylene signaling and DELLA, that the inhibition of EIN3-ERF1 is mainly attributed to the decreased GA level and the accumulation of DELLA protein [65,66,67]. In our transcriptome data, we found that EBF1-like was up-regulated at the early stage of floral induction. Correspondingly, EIN3-like1 was down-regulated at 13 w, and the expression of ERF1B was significantly decreased at 15 w (Figure 8C). This suggests that ethylene signals might also negatively regulate floral induction in strawberries. However, DELLA expression was up-regulated during this period, which appears to be inconsistent with the regulatory relationship between DELLA and EIN3-ERF1 during Arabidopsis floral initiation. Interestingly, it is also reported that DELLA inhibits ethylene signaling by binding EIN3 and ERFs to form a feedback regulatory network in response to ethylene signals [14,68]. We speculate that the crosstalk between DELLA and the ethylene signal may be more complicated due to the particularity of DELLA in the floral initiation process of strawberries, which should be further explored.
Jasmonic acid (JA) plays an important role in a variety of plant diseases and is involved in a variety of developmental processes, including flowering time in Arabidopsis [62]. DELLA protein can interact with JASMONATE-ZIM-DOMAIN PROTEINs (JAZs) to reduce the inhibition of its key target MYC2 [69]. Here, significant down-regulation of MYC2 expression suggested that the JA signal might play a negative role in floral induction. The genetic link between DELLA and JA signaling could be a point for future studies on strawberries (Figure 8D,E).
In the ABA signal transduction pathway, the ABA receptor gene PYRABACTIN RESISTANCE 1-LIKE/PYRABACTIN RESISTANCE (PYL/PYR) and other key genes were significantly up-regulated at 13 w. In contrast, the expression of the negative regulator of the ABA pathway, PROTEIN PHOSPHATASE 2C (PP2C), was decreased at 13 w. Although PP2C indirectly inhibits the expression of ABA-responsive genes by inhibiting SNF1-RELATED PROTEIN KINASE 2 (SnRK2), the expression of SAPK2-like, belonging to SnRK2 proteins, was consistent with that of PP2C. However, the expression level of SRK2I was increased at the early stage of floral induction and decreased at 15 w (Figure 9A,D). These results indicate that the relationship between floral induction and the ABA signaling pathway is complex in strawberries.
Brassinosteroids (BRs) are thought to promote flowering in Arabidopsis [70]. We found that BRASSINAZOLE-RESISTANT 1 (BZR1)-like2 was significantly up-regulated at 13 w, and the expression of CYCLIN-D3-1 (CYCD3.1) and CYCD3.3 was increased at 15 w. The surprise is that although XYLOGLUCAN ENDOTRANSGLUCOSYLASE/HYDROLASE (XTH23) is positively regulated by BZR1 (Figure 9B,D), it was down-regulated at 15 w. These results at least suggested that BRs signals play positive roles in the initiation of flower meristem. Although there are few reports describing the role of SA in plant floral induction, we also found two DEGs in the SA signaling pathway. The upstream promoter of the SA signaling pathway, HBP1B-like, was significantly up-regulated at 13 w. At the same time, the downstream promoter, PR1-like, was significantly up-regulated at 15 w (Figure 9C,D), suggesting that the SA signals might also promote floral induction in strawberries by participating in the complex plant hormone signaling pathways.
2.8. QRT-PCR Identification of DEGs
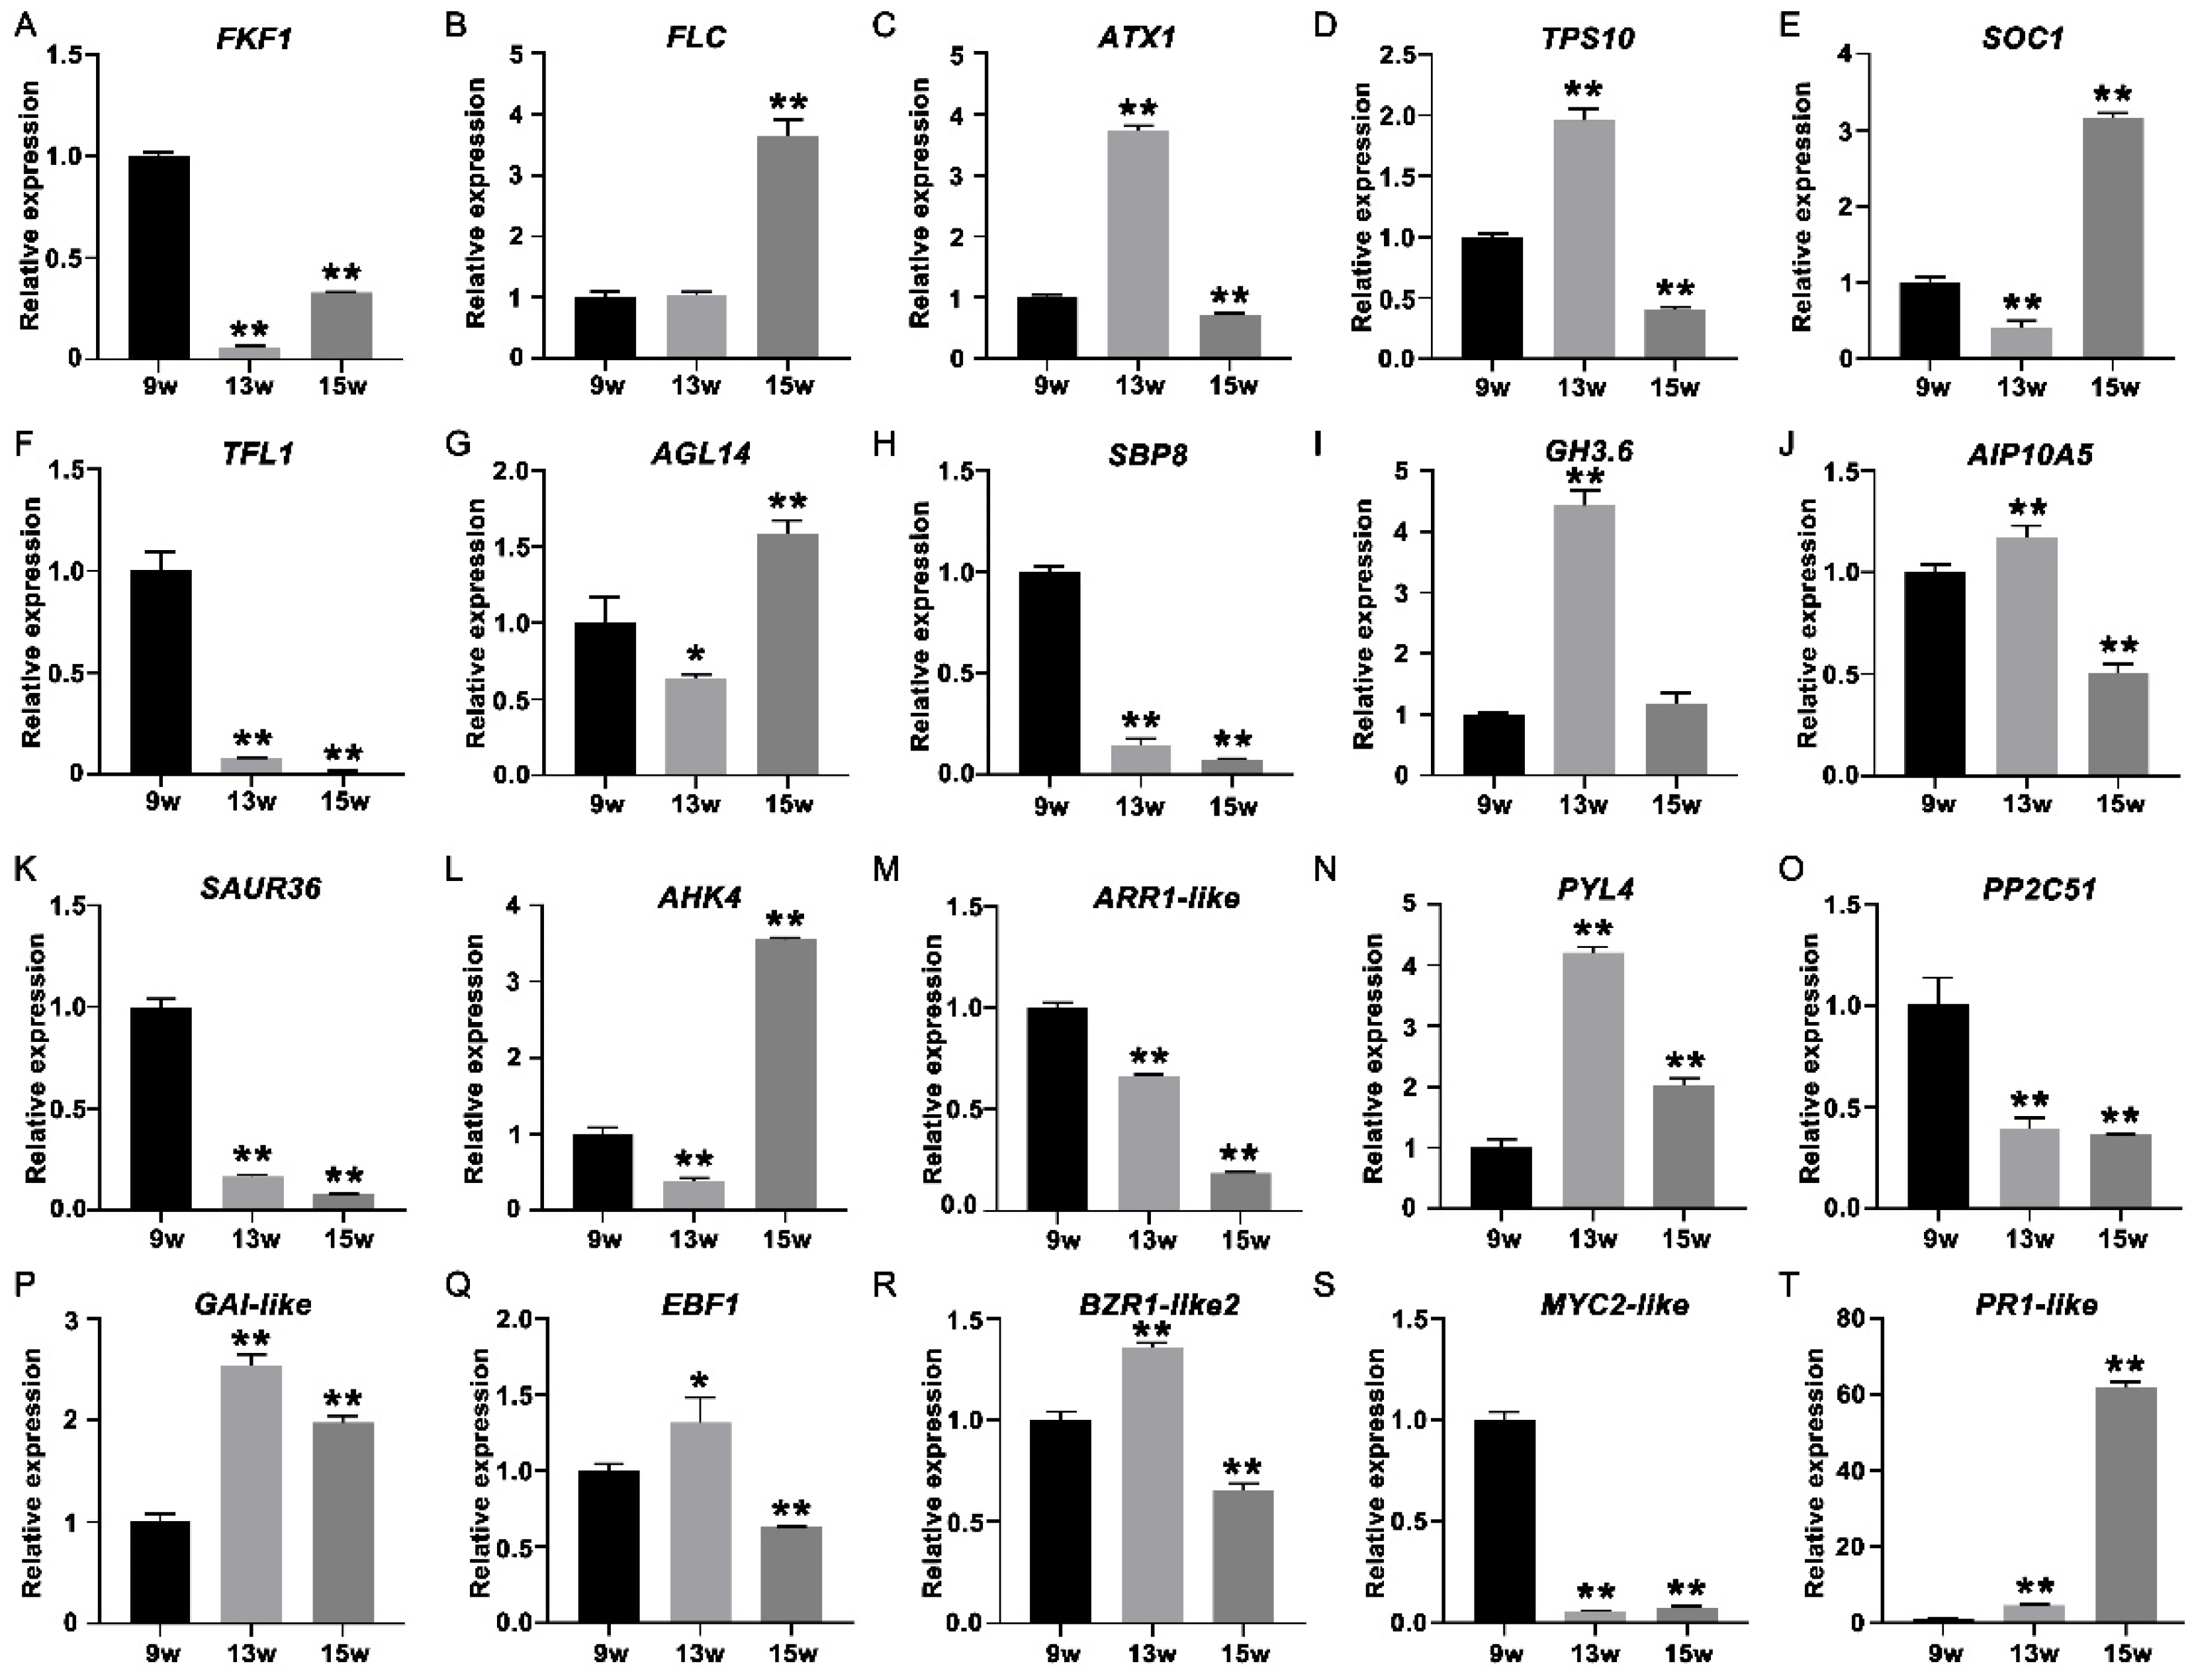
To further verify the expression profile of genes determined from the RNA-seq data, 24 transcripts were selected for qRT-PCR analysis (Figure 10A–T), such as FKF1 in the photoperiodic pathway (Figure 10A), FLC and ATX1 in the vernalization pathway (Figure 10B,C), TPS10 in the carbohydrate pathway (Figure 10D), the floral integrator SOC1 (Figure 10E), the key repressor TFL1 in flowering in strawberry (Figure 10F), AGL14 in the MADS family (Figure 10G), SBP8 in the SEB family (Figure 10H), key genes (GH3.6, AIP10A5 and SAUR36) in the auxin signaling pathway (Figure 10I–K), two key genes (AHK4 the ARR1-like) in the cytokinin signaling pathway (Figure 10L,M), PYL4 and PP2C51 in the ABA signaling pathway (Figure 10N,O), GAI-like in the GA signaling pathway (Figure 10P), EBF1 in the ethylene signaling pathway (Figure 10Q), BZR1-Like2 in the brassinosteroid signaling pathway (Figure 10R), MYC2-like in the JA signaling pathway (Figure 10S), and PR1-like in the salicylic acid signaling pathways (Figure 10T). These qRT-PCR results were consistent with the expression profiles obtained from the RNA-seq data, indicating the reliability of RNA-seq.
3. Conclusions
In the present study, 7177 DEGs that respond to floral induction signals in the shoot apex were identified in the strawberry cultivar ‘Benihoppe.’ Some key genes with conserved functions in floral initiation, leaf development, and flower development, such as SOC1, TFL1, AP1, and CUC2 were detected. Two important gene families involved in floral initiation, the MADS family and SEB family, were also analyzed. We preliminarily explored the expression of key genes in eight hormone signaling pathways and believed that the DELLA gene could be an important candidate gene to explore the floral induction of strawberries in the future.
4. Materials and Methods
4.1. Plant Material and Sample Collection
Strawberry plants (Fragaria × ananassa ‘Benihoppe’) were grown in the greenhouse in Shangzhuang Experimental Station (China Agricultural University), Beijing (S 116°23’, W 39°56’), China. The daughter plants of ‘Benihoppe’ were rooted on 6 June 2018, which we marked as the 0 week (0 w) (Figure S1). The shoot apices were sampled once weekly from 1 August 2018 (8 w) to 26 September 2018 (16 w), with three biological replicates each time, and each biological replicate contained the shoot apices of 5 plants. All collected samples were immediately frozen in liquid nitrogen and then stored at −80 °C. Sampling was performed at approximately 10 a.m. to reduce the possibility of differences in gene expression due to circadian oscillation. The temperatures and day lengths in Beijing in August and September are shown in Figure S1.
4.2. RNA Isolation and Qualitative and Quantitative Analysis of Total RNA
Total RNA samples were isolated from strawberry shoot apices using the E.Z.N.A. Total RNA Kit (Omega, R6834-01, Norcross, GA, USA) according to the manufacturer’s protocol. First-strand cDNAs were synthesized from total RNA using HIScript II Reverse Transcriptase (Vazyme, R233-01, Nanjing, China). The qRT-PCR reactions were performed in 10 μL volumes containing 1 μL cDNA as a template using ChamQ Universal SYBR qPCR Master Mix (Vazyme, Q711-02, Nanjing China) on an ABI Q6 Real-Time PCR System (Applied Biosystems, Foster City, CA, USA). The 2−ΔΔCT method was used to analyze the qRT-PCR expression data [72]. FaACTIN was used as the internal control for the normalization of gene expression in strawberries. The name and sequences of gene-specific primers are given in Table S1.
4.3. RNA-seq
All RNA samples were delivered to Hangzhou Lianchuan Biotechnology Co. Ltd. (Hangzhou, China) to prepare cDNA libraries and high-throughput RNA sequencing on the Illumina 4000 sequencing instrument. HISAT2 software (https://ccb.jhu.edu/software/hisat/index.shtml accessed on 2 March 2022) was used for alignment, and valid reads were aligned to the reference octoploid strawberry genome (https://datadryad.org/stash/dataset/doi:10.5061/dryad.b2c58pc accessed on 2 March 2022) [73]. Splicing and merging of transcripts were performed with Stringtie software (https://ccb.jhu.edu/software/stringtie/ accessed on 2 March 2022); FPKM was used to estimate the quantification of gene expression levels. A corrected p-value of <0.05 and |log2foldchange| ≥1 were set as the thresholds for significant differential expression. The raw sequence data have been submitted to the NCBI Sequence Read Archive under accession number PRJNA746082.
4.4. Gene Expression Pattern Analysis and Functional Annotation
EdgeR software (https://bioconductor.org/packages/release/bioc/html/edgeR.html accessed on 2 March 2022), was used for transcript quantification, difference comparison, and visualization, and the differential expression results were graphically displayed using R (https://www.r-project.org/ accessed on 2 March 2022) and Tbtools (https://github.com/CJ-Chen/TBtools accessed on 2 March 2022). The GOseq R package (http://www.bioconductor.org/packages/release/bioc/html/goseq.html accessed on 2 March 2022) was used for Gene Ontology (GO) enrichment analysis, and KOBAS software was used for the Kyoto Encyclopedia of Genes and Genomes (KEGG) analysis (http://kobas.cbi.pku.edu.cn/kobas3/ accessed on 2 March 2022).
4.5. Shoot Apical Meristem Microscopy
Morphological observation of SAMs was carried out once a week from 8w, and five plants were sampled each time. After sampling, leaves were peeled off to expose the apical meristem step by step, and meristem morphologies were photographed using a microscope (Sz61, Olympus, Tokyo, Japan) equipped with a RisingCam industrial digital camera (E3ISPM20000KPA, Hangzhou, China).
4.6. Sequence Alignments and Phylogenetic Analyses
Alignments were performed using BioEdit 7.0 (https://bioedit.software.informer.com/7.0/) and ClustalW (http://www.ch.embnet.org/software/ClustalW.html accessed on 2 March 2022). Phylogenetic analyses were performed using MEGA 7.0 (https://www.megasoftware.net/ accessed on 2 March 2022). The CDS sequences of MADS family and SEB family members from Arabidopsis were downloaded from TAIR (https://www.arabidopsis.org/ accessed on 2 March 2022). The primers are listed in Table S1.
Supplementary Materials
The following supporting information can be downloaded at: https://www.mdpi.com/article/10.3390/ijms23116126/s1.
Author Contributions
Conceptualization, H.W., J.L. and Z.W.; methodology, J.L., J.Z. and H.W.; investigation, J.L. and J.Z.; Data curation, J.L. and J.Z.; writing-original draft preparation, J.L. and J.Z.; writing-review and editing, H.W. and Z.W.; supervision, H.W.; funding acquisition, H.W. All authors have read and agreed to the published version of the manuscript.
Funding
This research was funded by National Key Research and Development Program of China, grant number 2019YFD001800.
Institutional Review Board Statement
Not applicable.
Informed Consent Statement
Not applicable.
Data Availability Statement
Not applicable.
Conflicts of Interest
The authors declare no conflict of interest.
References
- Mouhu, K.; Hytonen, T.; Folta, K.; Rantanen, M.; Paulin, L.; Auvinen, P.; Elomaa, P. Identification of flowering genes in strawberry, a perennial SD plant. BMC Plant Biol. 2009, 9, 122. [Google Scholar] [CrossRef] [PubMed] [Green Version]
- Hytönen, T.; Elomaa, P. Genetic and Environmental Regulation of Flowering and Runnering in Strawberry. Genes Genomes Genom. 2011, 5, 56–64. [Google Scholar]
- Jonkers, H. On the Flower Formation, the Dormancy and the Early Forcing of Strawberries. Ph.D. Thesis, Mededelingen van de Landbouwhogeschool, Wageningen, The Netherlands, 1965. [Google Scholar]
- Heide, O.M. Photoperiod and Temperature Interactions in Growth and Flowering of Strawberry. Physiol. Plantarum. 1977, 40, 21–26. [Google Scholar] [CrossRef]
- Heide, O.M.; Sønsteby, A. Interactions of temperature and photoperiod in the control of flowering of latitudinal and altitudinal populations of wild strawberry (Fragaria vesca). Physiol. Plant. 2010, 130, 280–289. [Google Scholar] [CrossRef]
- Konsin, M.; Voipio, I.; Palonen, P. Influence of photoperiod and duration of short-day treatment on vegetative growth and flowering of strawberry (Fragaria × ananassa Duch.). J. Hortic. Sci. Biotechnol. 2001, 76, 77–82. [Google Scholar] [CrossRef]
- Hytönen, T.; Palonen, P.; Mouhu, K.; Junttila, O. Crown branching and cropping potential in strawberry (Fragaria × ananassa Duch.) can be enhanced by daylength treatments. J. Hortic. Sci. Biotechnol. 2004, 79, 466–471. [Google Scholar] [CrossRef]
- Koskela, E.A. Genetic Control of Flowering in the Diploid Strawberry Fragaria vesca. Master’s Thesis, University of Helsinki, Helsinki, Finland, 2009. [Google Scholar]
- Kurokura, T.; Iwama, T.; Inaba, Y.; Sugiyama, N. Effect of day-length on the developmental pattern of axillary buds in June-bearing strawberry plants. J. Hortic. Sci. Biotechnol. 2005, 80, 139–142. [Google Scholar] [CrossRef]
- Sønsteby, A.; Heide, O.M. Long-day control of flowering in everbearing strawberries. J. Hortic. Sci. Biotechnol. 2007, 82, 875–884. [Google Scholar] [CrossRef]
- Blüemel, M.; Dally, N.; Jung, C. Flowering time regulation in crops—What did we learn from Arabidopsis? Curr. Opin. Biotechnol. 2015, 32, 121–129. [Google Scholar] [CrossRef]
- Engelmann, K.; Purugganan, M. The molecular evolutionary ecology of plant development: Flowering time in Arabidopsis thaliana. Adv. Bot. Res. 2006, 44, 507–526. [Google Scholar]
- Fornara, F.; de Montaigu, A.; Coupland, G. SnapShot: Control of Flowering in Arabidopsis. Cell 2010, 141, 550. [Google Scholar] [CrossRef] [PubMed] [Green Version]
- Andrés, F.; Coupland, G. The genetic basis of flowering responses to seasonal cues. Nat. Rev. Genet. 2012, 13, 627–639. [Google Scholar] [CrossRef] [PubMed]
- Villar, L.; Lienqueo, I.; Llanes, A.; Rojas, P.; Perez, J.; Correa, F.; Sagredo, B.; Masciarelli, O.; Luna, V.; Almada, R. Comparative transcriptomic analysis reveals novel roles of transcription factors and hormones during the flowering induction and floral bud differentiation in sweet cherry trees (Prunus avium L. cv. Bing). PLoS ONE 2020, 15, e0230110. [Google Scholar] [CrossRef] [PubMed] [Green Version]
- Mutasa-Göttgens, E.; Hedden, P. Gibberellin as a factor in floral regulatory networks. J. Exp. Bot 2009, 60, 1979–1989. [Google Scholar] [CrossRef] [PubMed] [Green Version]
- Han, P.; Zhang, Z.; Zheng, J.; Song, D.; Liang, J.; Zhu, B.; Wang, H. Effects of low temperature on flower bud differentiation in strawberry. J. China Agric. Univ. 2019, 24, 30–39. (In Chinese) [Google Scholar]
- Li, Y.P.; Feng, J.; Cheng, L.C.; Dai, C.; Gao, Q.; Liu, Z.C.; Kang, C.Y. Gene Expression Profiling of the Shoot Meristematic Tissues in Woodland Strawberry Fragaria vesca. Front. Plant Sci. 2019, 10, 1624. [Google Scholar] [CrossRef] [Green Version]
- Bradley, D.; Ratcliffe, O.; Vincent, C.; Carpenter, R.; Coen, E. Inflorescence commitment and architecture in Arabidopsis. Science 1997, 275, 80–83. [Google Scholar] [CrossRef] [Green Version]
- Hytönen, T.; Kurokura, T. Control of Flowering and Runnering in Strawberry. Hortic. J. 2020, 89, 96–107. [Google Scholar] [CrossRef] [Green Version]
- Koskela, E.A.; Mouhu, K.; Albani, M.C.; Kurokura, T.; Rantanen, M.; Sargent, D.J.; Battey, N.H.; Coupland, G.; Elomaa, P.; Hytonen, T. Mutation in TERMINAL FLOWER1 Reverses the Photoperiodic Requirement for Flowering in the Wild Strawberry Fragaria vesca. Plant Physiol. 2012, 159, 1043–1054. [Google Scholar] [CrossRef] [Green Version]
- Koskela, E.A.; Sønsteby, A.; Flachowsky, H.; Heide, O.M.; Hanke, M.; Elomaa, P.; Hytönen, T. TERMINAL FLOWER1 is a breeding target for a novel everbearing trait and tailored flowering responses in cultivated strawberry (Fragaria × ananassa Duch.). Plant Biotechnol. J. 2016, 14, 1852–1861. [Google Scholar] [CrossRef] [Green Version]
- Koskela, E.A.; Kurokura, T.; Toivainen, T.; Sonsteby, A.; Heide, O.M.; Sargent, D.J.; Isobe, S.; Jaakola, L.; Hilmarsson, H.; Elomaa, P.; et al. Altered regulation of TERMINAL FLOWER1 causes the unique vernalisation response in an arctic woodland strawberry accession. New Phytol. 2017, 216, 841–853. [Google Scholar] [CrossRef] [PubMed] [Green Version]
- Rantanen, M.; Kurokura, T.; Jiang, P.P.; Mouhu, K.; Hytonen, T. Strawberry homologue of TERMINAL FLOWER1 integrates photoperiod and temperature signals to inhibit flowering. Plant J. 2015, 82, 163–173. [Google Scholar] [CrossRef] [PubMed]
- Mouhu, K.; Kurokura, T.; Koskela, E.A.; Albert, V.A.; Elomaa, P.; Hytonen, T. The Fragaria vesca Homolog of Suppressor of Overexpression of CONSTANS1 Represses Flowering and Promotes Vegetative Growth. Plant Cell 2013, 25, 3296–3310. [Google Scholar] [CrossRef] [PubMed] [Green Version]
- Kurokura, T.; Samad, S.; Koskela, E.; Mouhu, K.; Hytonen, T. Fragaria vesca CONSTANS controls photoperiodic flowering and vegetative development. J. Exp. Bot. 2017, 68, 4839–4850. [Google Scholar] [CrossRef] [Green Version]
- Caruana, J.C.; Sittmann, J.W.; Wang, W.; Liu, Z. Suppressor of Runnerless Encodes a DELLA Protein that Controls Runner Formation for Asexual Reproduction in Strawberry. Mol. Plant 2018, 11, 230–233. [Google Scholar] [CrossRef] [PubMed] [Green Version]
- Wigge, P.A.; Kim, M.C.; Jaeger, K.E.; Busch, W.; Schmid, M.; Lohmann, J.U.; Weigel, D. Integration of spatial and temporal information during floral induction in Arabidopsis. Science 2005, 309, 1056–1059. [Google Scholar] [CrossRef]
- Xiong, J.; Bai, Y.; Ma, C.; Zhu, H.; Zheng, D.; Cheng, Z. Molecular Cloning and Characterization of SQUAMOSA-Promoter Binding Protein-Like Gene FvSPL10 from Woodland Strawberry (Fragaria vesca). Plants 2019, 8, 342. [Google Scholar] [CrossRef] [Green Version]
- Feng, J.; Cheng, L.; Zhu, Z.; Yu, F.; Dai, C.; Liu, Z.; Guo, W.W.; Wu, X.M.; Kang, C. GRAS transcription factor loss of AXILLARY MERISTEMS is essential for stamen and runner formation in wild strawberry. Plant Physiol. 2021, 186, 1970–1984. [Google Scholar] [CrossRef]
- Hytönen, T.; Elomaa, P.; Moritz, T.; Junttila, O. Gibberellin mediates daylength-controlled differentiation of vegetative meristems in strawberry (Fragaria × ananassa Duch). BMC Plant Biol. 2009, 9, 18. [Google Scholar] [CrossRef] [Green Version]
- Ni, J.; Gao, C.; Chen, M.-S.; Pan, B.-Z.; Ye, K.; Xu, Z.-F. Gibberellin Promotes Shoot Branching in the Perennial Woody Plant Jatropha curcas. Plant Cell Physiol. 2015, 56, 1655–1666. [Google Scholar] [CrossRef] [Green Version]
- Li, W.; Zhang, J.; Sun, H.; Wang, S.; Chen, K.; Liu, Y.; Li, H.; Ma, Y.; Zhang, Z. FveRGA1, encoding a DELLA protein, negatively regulates runner production in Fragaria vesca. Planta 2018, 247, 941–951. [Google Scholar] [CrossRef] [PubMed]
- Tenreira, T.; Lange, M.J.P.; Lange, T.; Bres, C.; Labadie, M.; Monfort, A.; Hernould, M.; Rothan, C.; Denoyes, B. A Specific Gibberellin 20-Oxidase Dictates the Flowering-Runnering Decision in Diploid Strawberry. Plant Cell 2017, 29, 2168–2182. [Google Scholar] [CrossRef] [PubMed] [Green Version]
- Yamaguchi, N.; Winter, C.M.; Wu, M.F.; Kanno, Y.; Wagner, D. Gibberellin Acts Positively Then Negatively to Control Onset of Flower Formation in Arabidopsis. Science 2014, 344, 638–641. [Google Scholar] [CrossRef]
- Zhang, S. Physiologicaland Molecular Responses of “Fuji” Apple (Malus × domestica borkh.) to GA3 Application and Alternate bearing Signal during Floral Bud Differentiation. Master’s Thesis, Northwest A&F University, Xianyang, China, 2016. (In Chinese). [Google Scholar]
- Sawa, M.; Nusinow, D.A.; Kay, S.A.; Imaizumi, T. FKF1 and GIGANTEA complex formation is required for day-length measurement in Arabidopsis. Science 2007, 318, 261–265. [Google Scholar] [CrossRef] [PubMed] [Green Version]
- Fowler, S.; Lee, K.; Onouchi, H.; Samach, A.; Richardson, K.; Coupland, G.; Putterill, J. GIGANTEA: A circadian clock-controlled gene that regulates photoperiodic flowering in Arabidopsis and encodes a protein with several possible membrane-spanning domains. EMBO J. 1999, 18, 4679–4688. [Google Scholar] [CrossRef] [PubMed] [Green Version]
- Nakamichi, N.; Kita, M.; Niinuma, K.; Ito, S.; Yamashino, T.; Mizoguchi, T.; Mizuno, T. Arabidopsis clock-associated pseudo-response regulators PRR9, PRR7 and PRR5 coordinately and positively regulate flowering time through the canonical CONSTANS-dependent photoperiodic pathway. Plant Cell Physiol. 2007, 48, 822–832. [Google Scholar] [CrossRef] [Green Version]
- Ye, Y.; Liu, Y.; Li, X.; Chen, Q.; Zhang, Y.; Luo, Y.; Liu, Z.; Wang, Y.; Lin, Y.; Zhang, Y.; et al. Transcriptome Profile Analysis of Strawberry Leaves Reveals Flowering Regulation under Blue Light Treatment. Int. J. Genom. 2021, 2021, 5572076. [Google Scholar] [CrossRef]
- Hazen, S.P.; Schultz, T.F.; Pruneda-Paz, J.L.; Borevitz, J.O.; Ecker, J.R.; Kay, S.A. LUX ARRHYTHMO encodes a Myb domain protein essential for circadian rhythms. Proc. Natl. Acad. Sci. USA 2005, 102, 10387–10392. [Google Scholar] [CrossRef] [Green Version]
- Cai, X.; Ballif, J.; Endo, S.; Davis, E.; Liang, M.; Chen, D.; DeWald, D.; Kreps, J.; Zhu, T.; Wu, Y. A putative CCAAT-binding transcription factor is a regulator of flowering timing in Arabidopsis. Plant Physiol. 2007, 145, 98–105. [Google Scholar] [CrossRef] [Green Version]
- Jang, S.; Marchal, V.; Panigrahi, K.C.S.; Wenkel, S.; Soppe, W.; Deng, X.-W.; Valverde, F.; Coupland, G. Arabidopsis COP1 shapes the temporal pattern of CO accumulation conferring a photoperiodic flowering response. EMBO J. 2008, 27, 1277–1288. [Google Scholar] [CrossRef] [Green Version]
- Searle, I.; He, Y.; Turck, F.; Vincent, C.; Fornara, F.; Kröber, S.; Amasino, R.A.; Coupland, G. The transcription factor FLC confers a flowering response to vernalization by repressing meristem competence and systemic signaling in Arabidopsis. Genes Dev. 2006, 20, 898–912. [Google Scholar] [CrossRef] [PubMed] [Green Version]
- Pien, S.; Fleury, D.; Mylne, J.S.; Crevillen, P.; Inze, D.; Avramova, Z.; Dean, C.; Grossniklaus, U.J.P.C. ARABIDOPSIS TRITHORAX1 Dynamically Regulates FLOWERING LOCUS C Activation via Histone 3 Lysine 4 Trimethylation. Plant Cell 2008, 20, 580–588. [Google Scholar] [CrossRef] [PubMed] [Green Version]
- Kinoshita, A.; Richter, R. Genetic and molecular basis of floral induction in Arabidopsis thaliana. J. Exp. Bot. 2020, 71, 2490–2504. [Google Scholar] [CrossRef] [PubMed]
- Kania, T.; Russenberger, D.; Peng, S.; Apel, K.; Melzer, S. FPF1 promotes flowering in Arabidopsis. Plant Cell 1997, 9, 1327–1338. [Google Scholar]
- Magome, H.; Yamaguchi, S.; Hanada, A.; Kamiya, Y.; Oda, K. dwarf and delayed-flowering 1, a novel Arabidopsis mutant deficient in gibberellin biosynthesis because of overexpression of a putative AP2 transcription factor. Plant J. 2004, 37, 720–729. [Google Scholar] [CrossRef]
- Cheng, H.; Qin, L.; Lee, S.; Fu, X.; Richards, D.E.; Cao, D.; Luo, D.; Harberd, N.P.; Peng, J. Gibberellin regulates Arabidopsis floral development via suppression of DELLA protein function. Development 2004, 131, 1055–1064. [Google Scholar] [CrossRef] [Green Version]
- Wahl, V.; Ponnu, J.; Schlereth, A.; Arrivault, S.; Langenecker, T.; Franke, A.; Feil, R.; Lunn, J.E.; Stitt, M.; Schmid, M. Regulation of Flowering by Trehalose-6-Phosphate Signaling in Arabidopsis thaliana. Science 2013, 339, 704–707. [Google Scholar] [CrossRef]
- Kang, X.; Zhou, Y.; Sun, X.; Ni, M. HYPERSENSITIVE TO RED AND BLUE 1 and its C-terminal regulatory function control FLOWERING LOCUS T expression. Plant J. 2007, 52, 937–948. [Google Scholar] [CrossRef]
- Hollender, C.A.; Kang, C.Y.; Darwish, O.; Geretz, A.; Matthews, B.F.; Slovin, J.; Alkharouf, N.; Liu, Z.C. Floral Transcriptomes in Woodland Strawberry Uncover Developing Receptacle and Anther Gene Networks. Plant Physiol. 2014, 165, 1062–1075. [Google Scholar] [CrossRef] [Green Version]
- Li, Y.; Ning, H.; Zhang, Z.; Wu, Y.; Jiang, J.; Su, S.; Tian, F.; Li, X. A cotton gene encoding novel MADS-box protein is preferentially expressed in fibers and functions in cell elongation. Acta Biochim. Et Biophys. Sin. 2011, 43, 607–617. [Google Scholar] [CrossRef] [Green Version]
- Liu, G.; Zheng, P.; Sayed, H.; Teng, Y. Characteristics of Two Dormancy-associated MADS-box Genes in Pear and Their Expression Analysis During the Dormancy. Acta Hortic. Sin. 2013, 40, 724–732. [Google Scholar]
- Zhang, L.; Xu, Y.; Ma, R. Molecular cloning, identification, and chromosomal localization of two MADS box genes in peach (Prunus persica). J. Genet. Genom. 2008, 35, 365–372. [Google Scholar] [CrossRef]
- Zhang, W.; Fan, S.; Pang, C.; Wei, H.; Ma, J.; Song, M.; Yu, S. Molecular Cloning and Function Analysis of Two SQUAMOSA-Like MADS-Box Genes from Gossypium hirsutum L. J. Integr. Plant Biol. 2013, 55, 597–607. [Google Scholar] [CrossRef] [PubMed]
- Zhou, Y.; Li, B.-Y.; Li, M.; Li, X.-J.; Zhang, Z.-T.; Li, Y.; Li, X.-B. A MADS-box gene is specifically expressed in fibers of cotton (Gossypium hirsutum) and influences plant growth of transgenic Arabidopsis in a GA-dependent manner. Plant Physiol. Biochem. 2014, 75, 70–79. [Google Scholar] [CrossRef]
- Gandikota, M.; Birkenbihl, R.P.; Hohmann, S.; Cardon, G.H.; Saedler, H.; Huijser, P. The miRNA156/157 recognition element in the 3’ UTR of the Arabidopsis SBP box gene SPL3 prevents early flowering by translational inhibition in seedlings. Plant J. 2007, 49, 683–693. [Google Scholar] [CrossRef] [Green Version]
- Jung, J.H.; Seo, P.J.; Kang, S.K.; Park, C.M. miR172 signals are incorporated into the miR156 signaling pathway at the SPL3/4/5 genes in Arabidopsis developmental transitions. Plant Mol. Biol. 2011, 76, 35–45. [Google Scholar] [CrossRef]
- Zhang, Y.; Schwarz, S.; Saedler, H.; Huijser, P. SPL8, a local regulator in a subset of gibberellin-mediated developmental processes in Arabidopsis. Plant Mol. Biol. 2007, 63, 429–439. [Google Scholar] [CrossRef] [Green Version]
- Preston, J.C.; Hileman, L.C. Functional Evolution in the Plant SQUAMOSA-PROMOTER BINDING PROTEIN-LIKE (SPL) Gene Family. Front. Plant Sci. 2013, 4, 80. [Google Scholar] [CrossRef] [Green Version]
- Izawa, T. What is going on with the hormonal control of flowering in plants? Plant J. 2020, 105, 431–445. [Google Scholar] [CrossRef]
- Oka, A.; Sakai, H.; Iwakoshi, S. His-Asp phosphorelay signal transduction in higher plants: Receptors and response regulators for cytokinin signaling in Arabidopsis thaliana. Genes Genet. Syst. 2002, 77, 383–391. [Google Scholar] [CrossRef] [Green Version]
- Sakai, H.; Honma, T.; Aoyama, T.; Sato, S.; Kato, T.; Tabata, S.; Oka, A. ARR1, a transcription factor for genes immediately responsive to cytokinins. Science 2001, 294, 1519–1521. [Google Scholar] [CrossRef] [PubMed] [Green Version]
- Guo, H.W.; Ecker, J.R. Plant responses to ethylene gas are mediated by SCF (EBF1/EBF2)-dependent proteolysis of EIN3 transcription factor. Cell 2003, 115, 667–677. [Google Scholar] [CrossRef] [Green Version]
- Guo, H.W.; Ecker, J.R. The ethylene signaling pathway: New insights. Curr. Opin. Plant Biol. 2004, 7, 40–49. [Google Scholar] [CrossRef] [PubMed]
- Achard, P.; Baghour, M.; Chapple, A.; Hedden, P.; Van Der Straeten, D.; Genschik, P.; Moritz, T.; Harberd, N.P. The plant stress hormone ethylene controls floral transition via DELLA-dependent regulation of floral meristem-identity genes. Proc. Natl. Acad. Sci. USA 2007, 104, 6484–6489. [Google Scholar] [CrossRef] [PubMed] [Green Version]
- Marin-de la Rosa, N.; Sotillo, B.; Miskolczi, P.; Gibbs, D.J.; Vicente, J.; Carbonero, P.; Onate-Sanchez, L.; Holdsworth, M.J.; Bhalerao, R.; Alabadi, D.; et al. Large-Scale Identification of Gibberellin-Related Transcription Factors Defines Group VII ETHYLENE RESPONSE FACTORS as Functional DELLA Partners. Plant Physiol. 2014, 166, 1022–1032. [Google Scholar] [CrossRef] [Green Version]
- Browse, J.; Wallis, J.G. Arabidopsis Flowers Unlocked the Mechanism of Jasmonate Signaling. Plants 2019, 8, 285. [Google Scholar] [CrossRef] [Green Version]
- Li, Z.; He, Y. Roles of Brassinosteroids in Plant Reproduction. Int. J. Mol. Sci. 2020, 21, 872. [Google Scholar] [CrossRef] [Green Version]
- Xing, S.; Jia, M.; Wei, L.; Mao, W.; Abbasi, U.A.; Zhao, Y.; Chen, Y.; Cao, M.; Zhang, K.; Dai, Z.; et al. CRISPR/Cas9-introduced single and multiple mutagenesis in strawberry. J. Genet. Genom. 2018, 45, 685–687. [Google Scholar] [CrossRef]
- Gong, B.H.; Yi, J.; Wu, J.; Sui, J.J.; Khan, M.A.; Wu, Z.; Zhong, X.H.; Seng, S.S.; He, J.N.; Yi, M.F. LlHSFA1, a novel heat stress transcription factor in lily (Lilium longiflorum), can interact with LlHSFA2 and enhance the thermotolerance of transgenic Arabidopsis thaliana. Plant Cell Rep. 2014, 33, 1519–1533. [Google Scholar] [CrossRef]
- Edger, P.P.; Poorten, T.J.; VanBuren, R.; Hardigan, M.A.; Colle, M.; McKain, M.R.; Smith, R.D.; Teresi, S.J.; Nelson, A.D.L.; Wai, C.M.; et al. Origin and evolution of the octoploid strawberry genome. Nat. Genet. 2019, 51, 541–547. [Google Scholar] [CrossRef] [Green Version]
Figure 1.
Overview of floral induction in strawberry ‘Benihoppe.’ (A–E) Morphological observation of the shoot apices at different time points during the induction of flower in strawberry. The observation results of 9 w, 13 w, 14 w, 15 w, and 16 w are shown (A–E). SAM, shoot apical meristem; S, Stipule; YF, young leaf; FM, flower meristem. Scale bar = 1 mm. (F) QRT-PCR analysis of the expression of the flowering marker gene FaAP1 from 8 w to 16 w. Data are displayed as averages ± SD of three biological repeats.
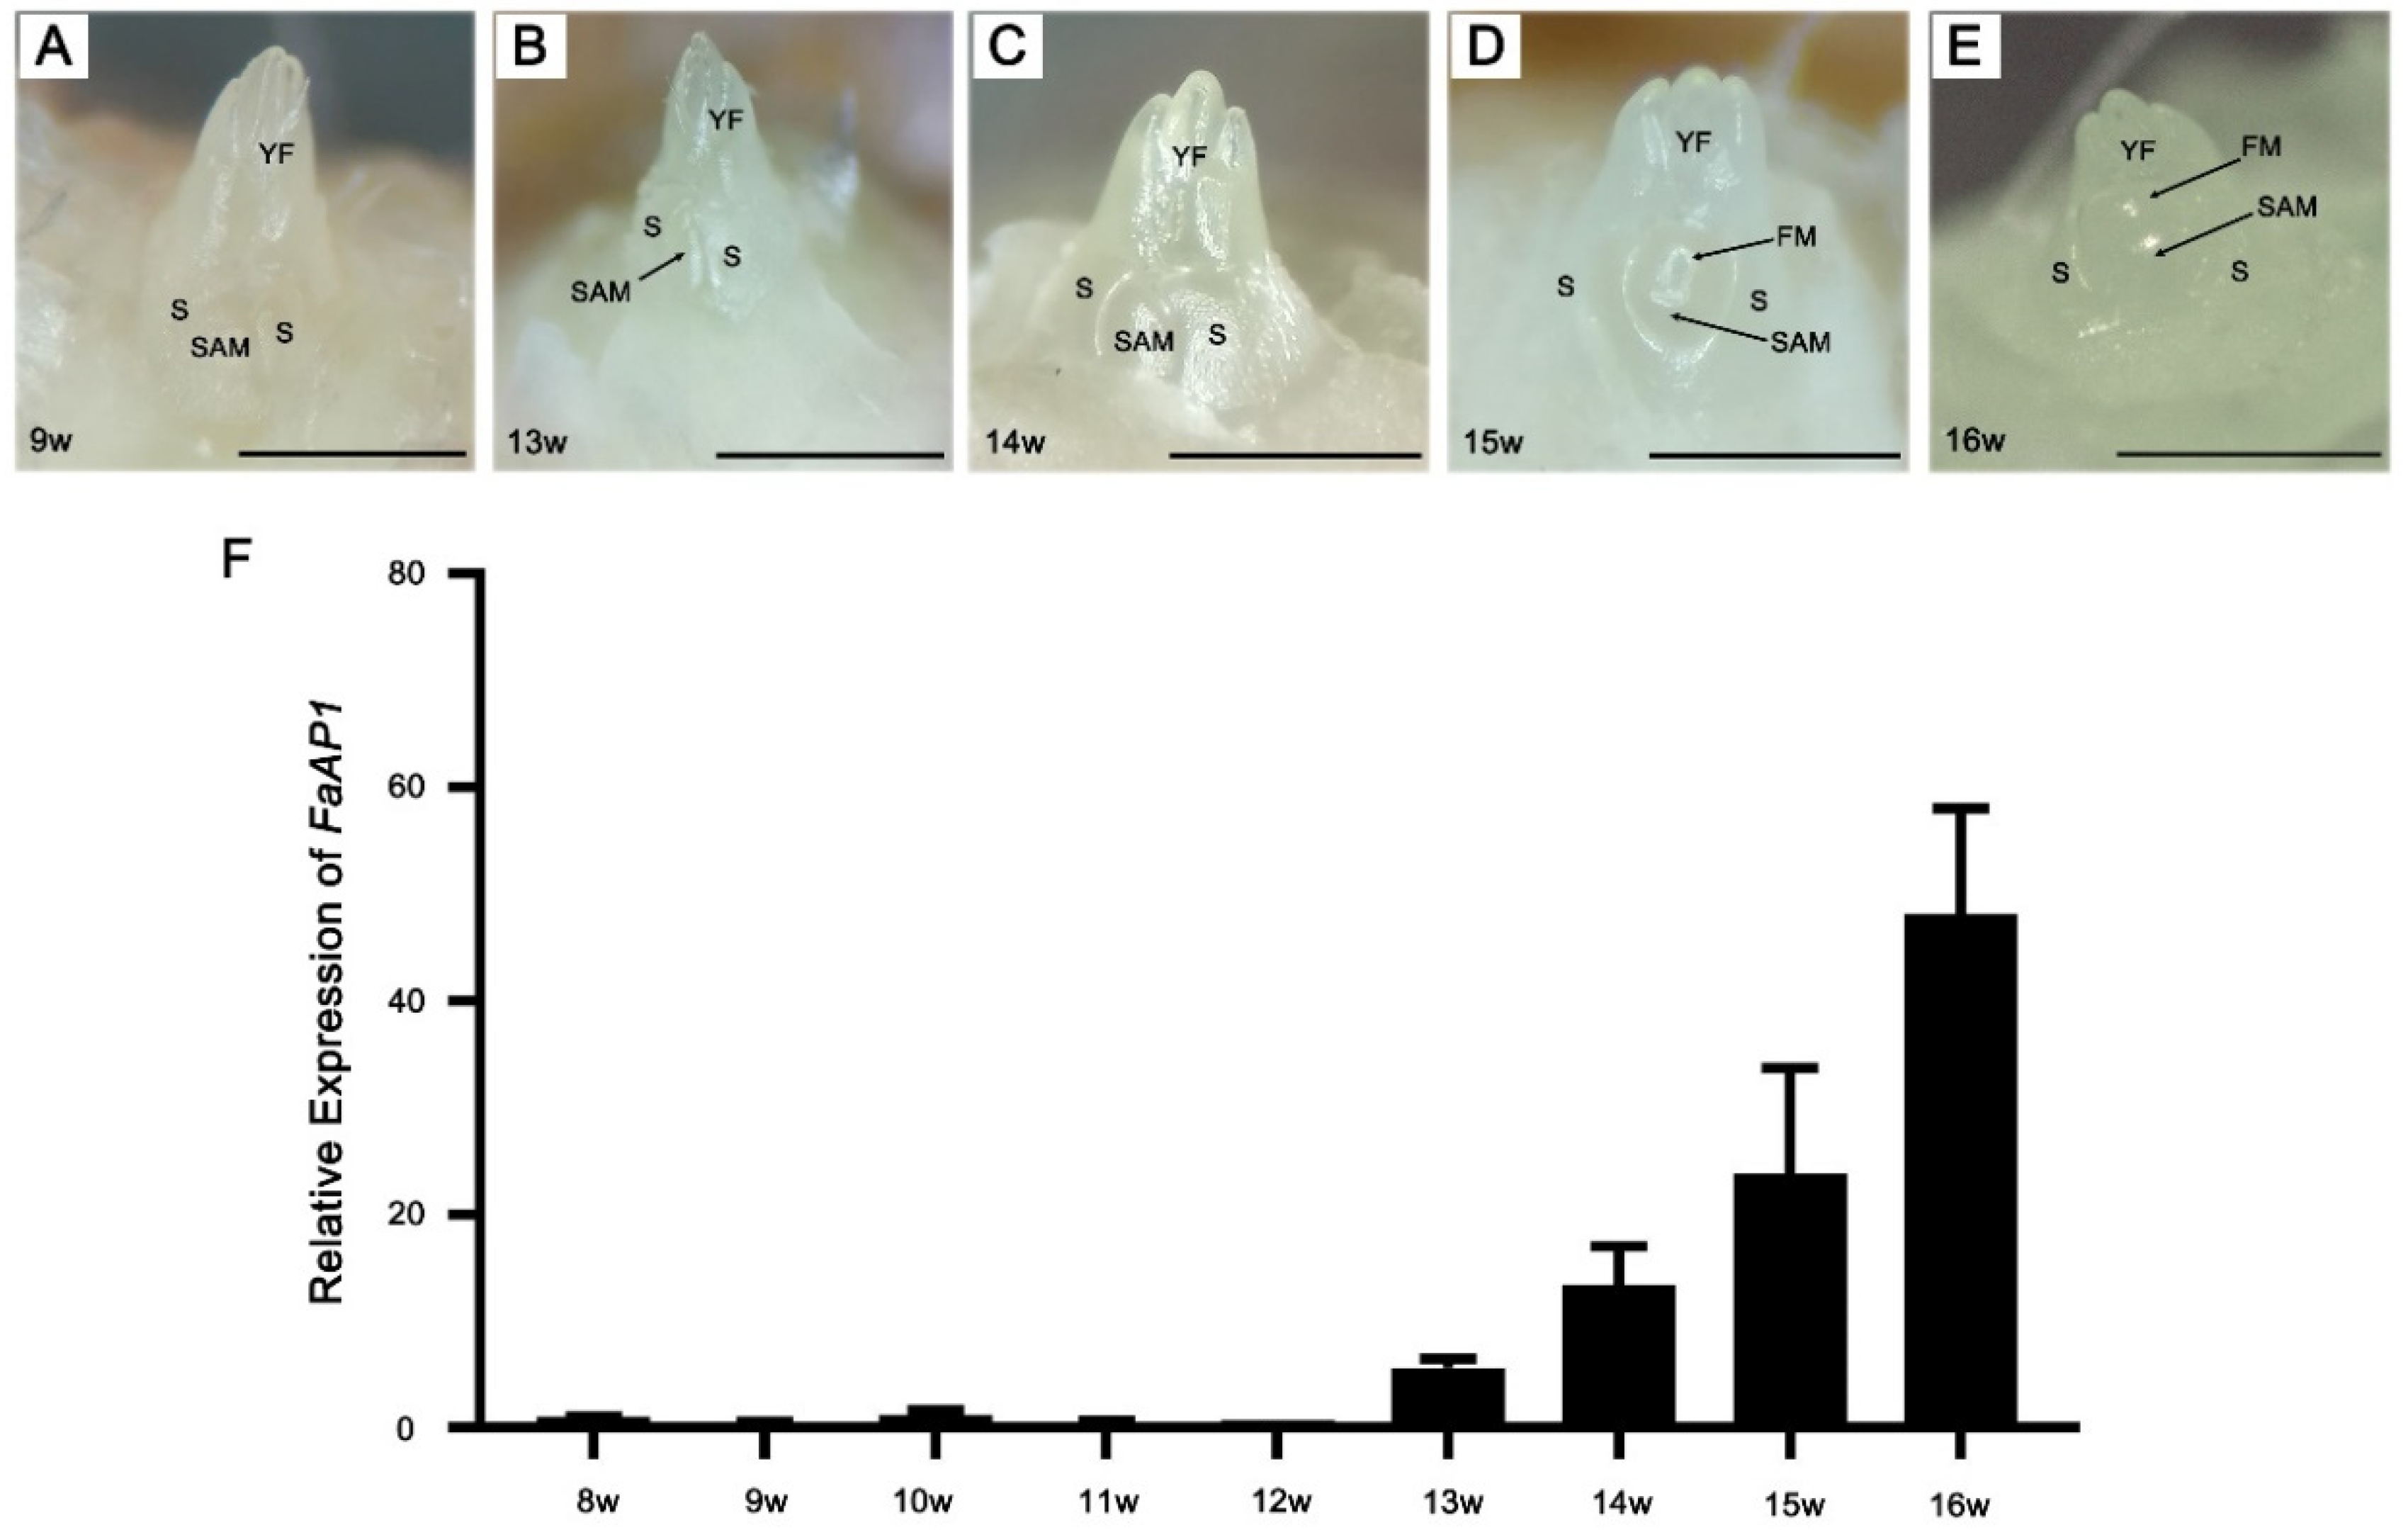
Figure 2.
Differential gene expression and GO enrichment analysis during flowering in strawberry. (A) Number of up-regulated and down-regulated DEGs of 13 w and 15 w. (B) Venn diagram of DEGs in the 13 w and 15 w RNA-seq libraries. (C–F) Expression of the DEGs at 9 w, 13 w, and 15 w in clusters 1−4, based on the overlaps in the Venn diagram in panel B. (G–J) GO enrichment analysis of DEGs in cluster 1 (G), cluster 2 (H), cluster 3 (I), and cluster 4 (J).
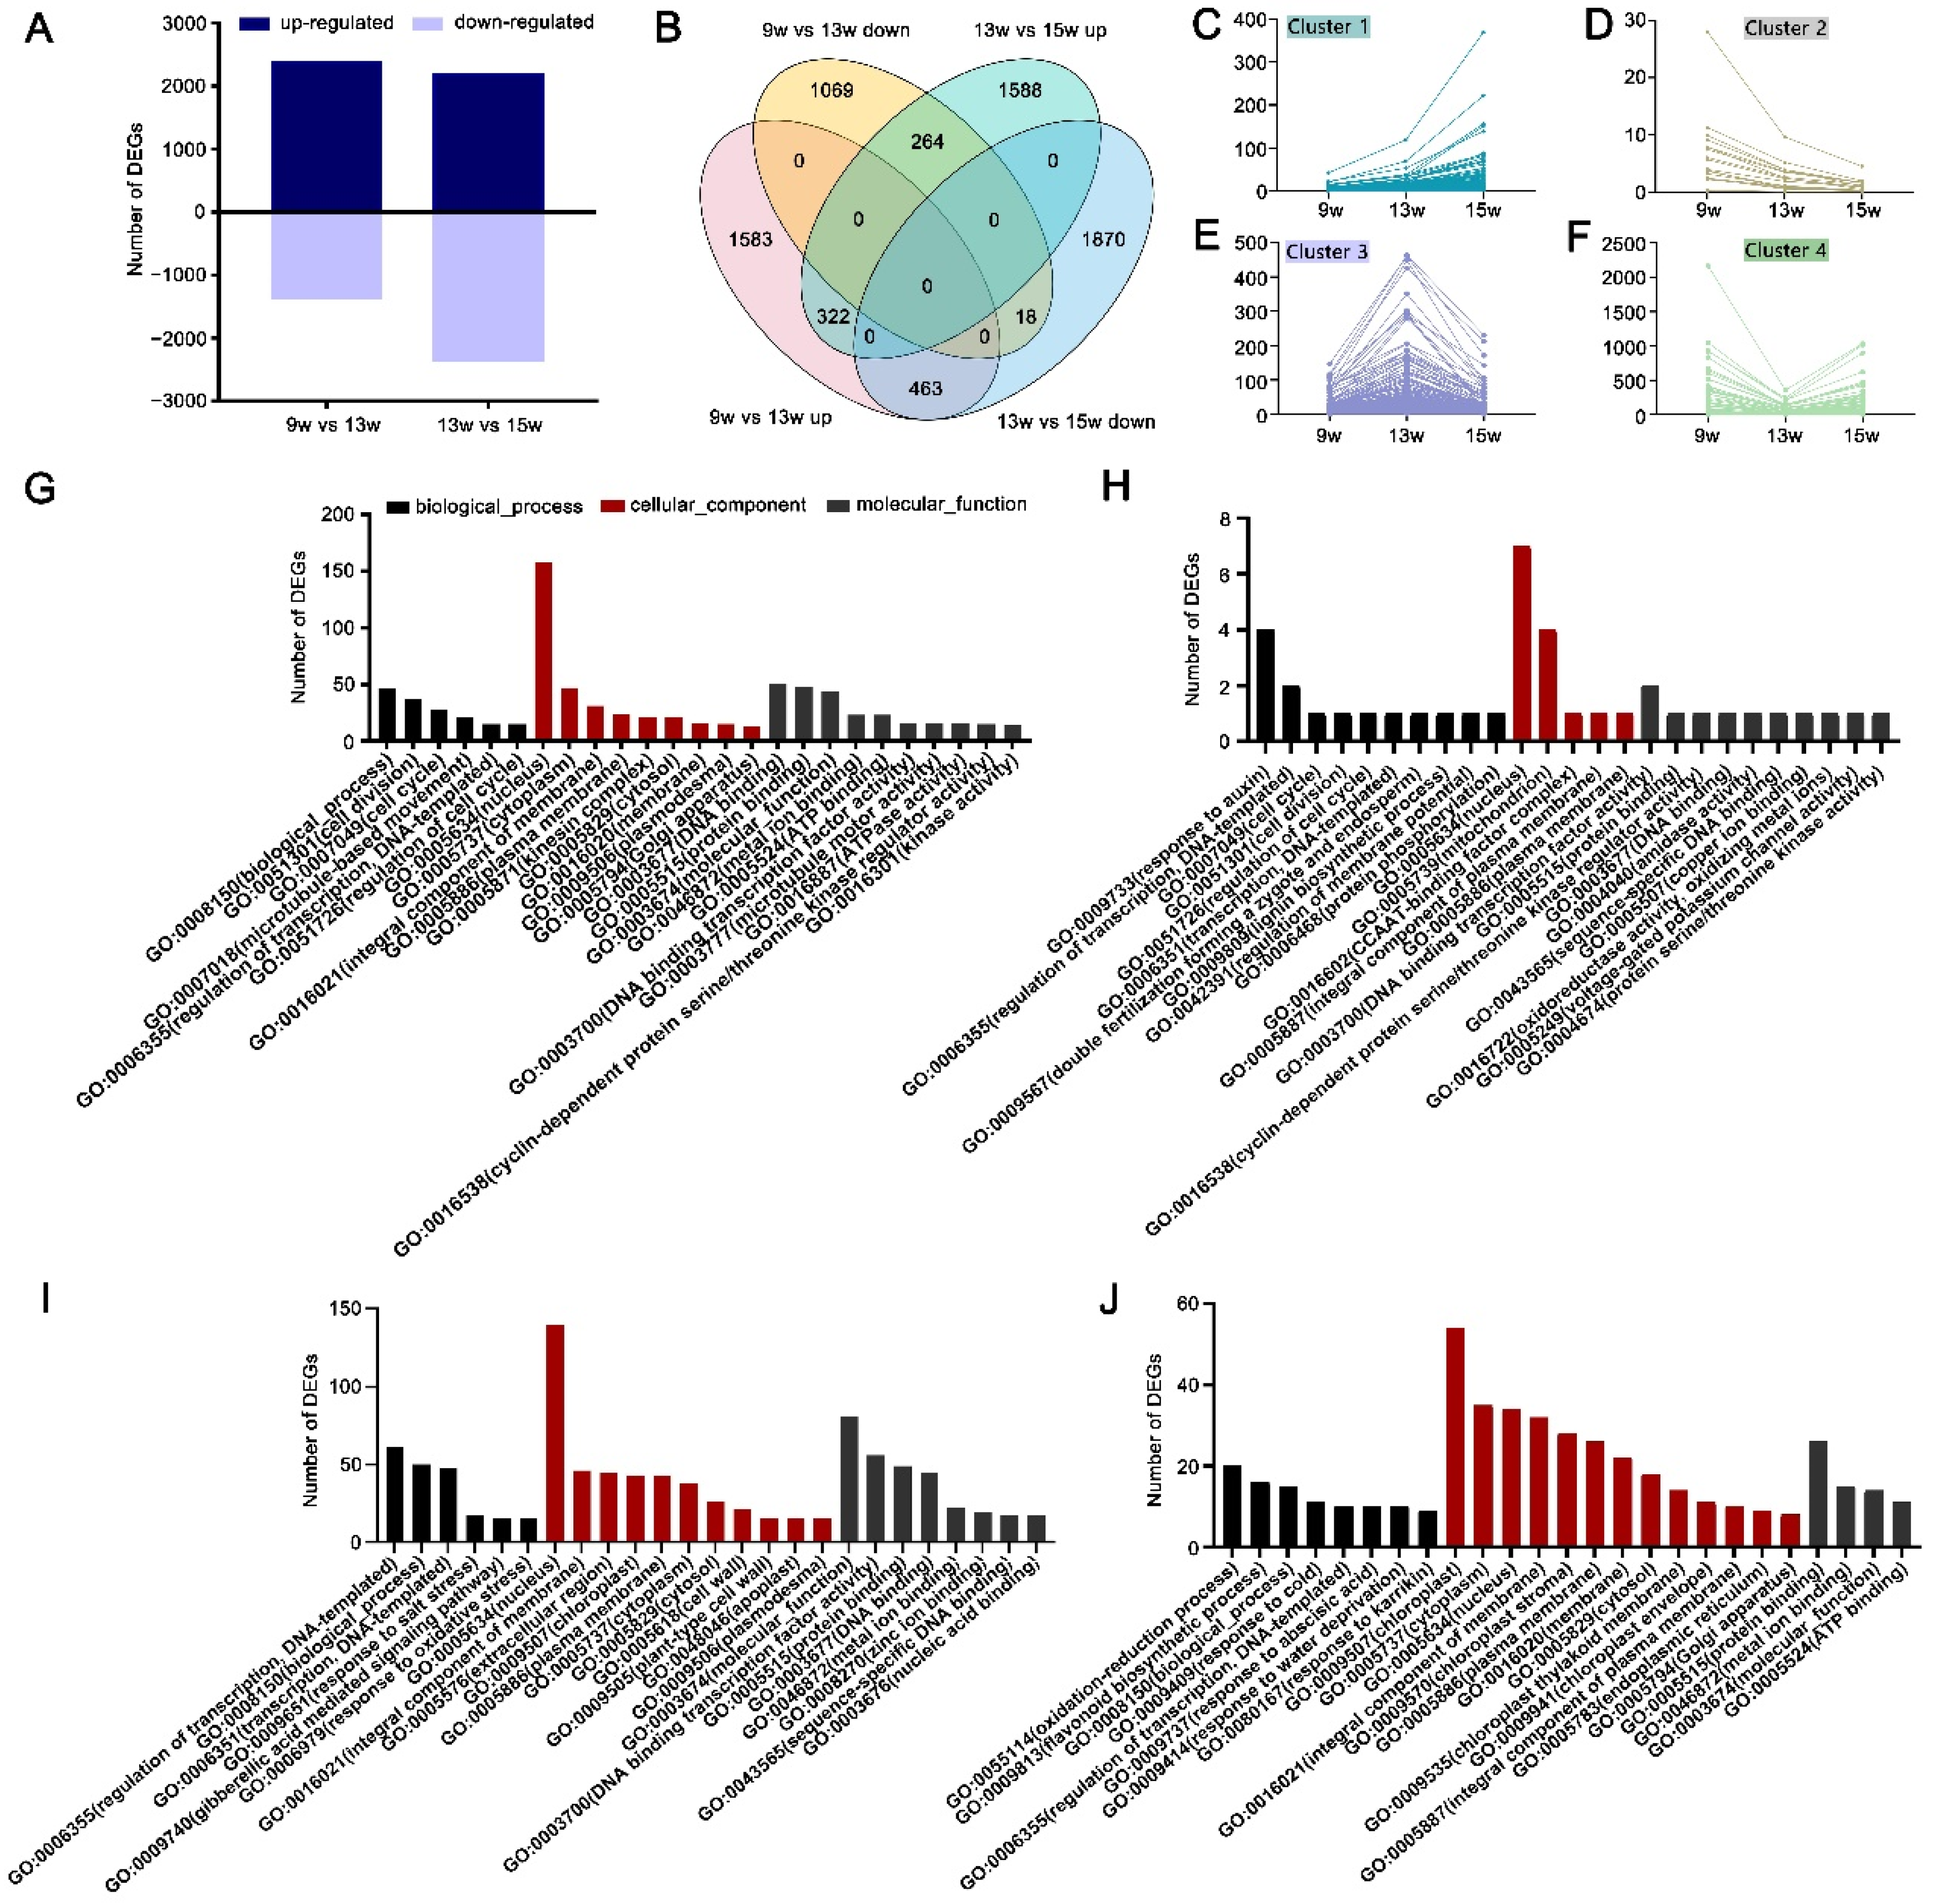
Figure 3.
FPKM values of key genes belonging to the different flowering time pathways. (A) Heat map showing the expression of genes involved in the vernalization pathway. (B) Heat maps showing the expression of genes involved in the autonomous, GA, age-related, carbohydrate, and other pathways. (+) indicates the positive regulators of flower bud differentiation in Arabidopsis, and (−) indicates negative regulator. 9 w: vegetative stage, 13 w: shifts to reproductive stage at gene level, 15 w: reproductive stage. The column with the black boxes represents the student’s t test analysis of DEGs at 9 w vs. 13 w; The column with the pink boxes represents the student’s t test analysis of DEGs at 13 w vs. 15 w; The column with the blue boxes represents the student’s t test analysis of DEGs at 9 w vs. 15 w. (* |Log2FC| ≥ 1, p < 0.05. ** |Log2FC| ≥ 2, p < 0.01).

Figure 4.
FPKM values of DEGs related to leaf and flower development. (A) Heat map showing the DEGs that may be involved in leaf development. (B) Heat map showing the DEGs that may be involved in flower development. The purple boxes indicate the genes in which expression was significantly changed at 13 w. 9 w: vegetative stage, 13 w: shifts to reproductive stage at gene level, 15 w: reproductive stage. The column with the black boxes represents the student’s t test analysis of DEGs at 9 w vs. 13 w; The column with the pink boxes represents the student’s t test analysis of DEGs at 13 w vs. 15 w; The column with the blue boxes represents the student’s t test analysis of DEGs at 9 w vs. 15 w. (* |Log2FC| ≥ 1, p < 0.05. ** |Log2FC| ≥ 2, p < 0.01).

Figure 5.
Phylogenetic analyses and relative expression of the DEGs in the MADS and SEB families. (A) Phylogenetic analysis of DEGs in the MADS family. (B) Heatmap showing the relative expression of DEGs in the MADS family. (C) Phylogenetic analysis of DEGs in the SEB family. (D) Heatmap showing the relative expression of DEGs in the SEB family. The purple boxes indicate the genes in which expression was significantly changed at 13 w. 9 w: vegetative stage; 13 w: shifts to reproductive stage at gene level; 15 w: reproductive stage. The column with the black boxes represents the student’s t test analysis of DEGs at 9 w vs. 13 w; The column with the pink boxes represents the student’s t test analysis of DEGs at 13 w vs. 15 w; The column with the blue boxes represents the student’s t test analysis of DEGs at 9 w vs. 15 w. (* |Log2FC| ≥ 1, p < 0.05).
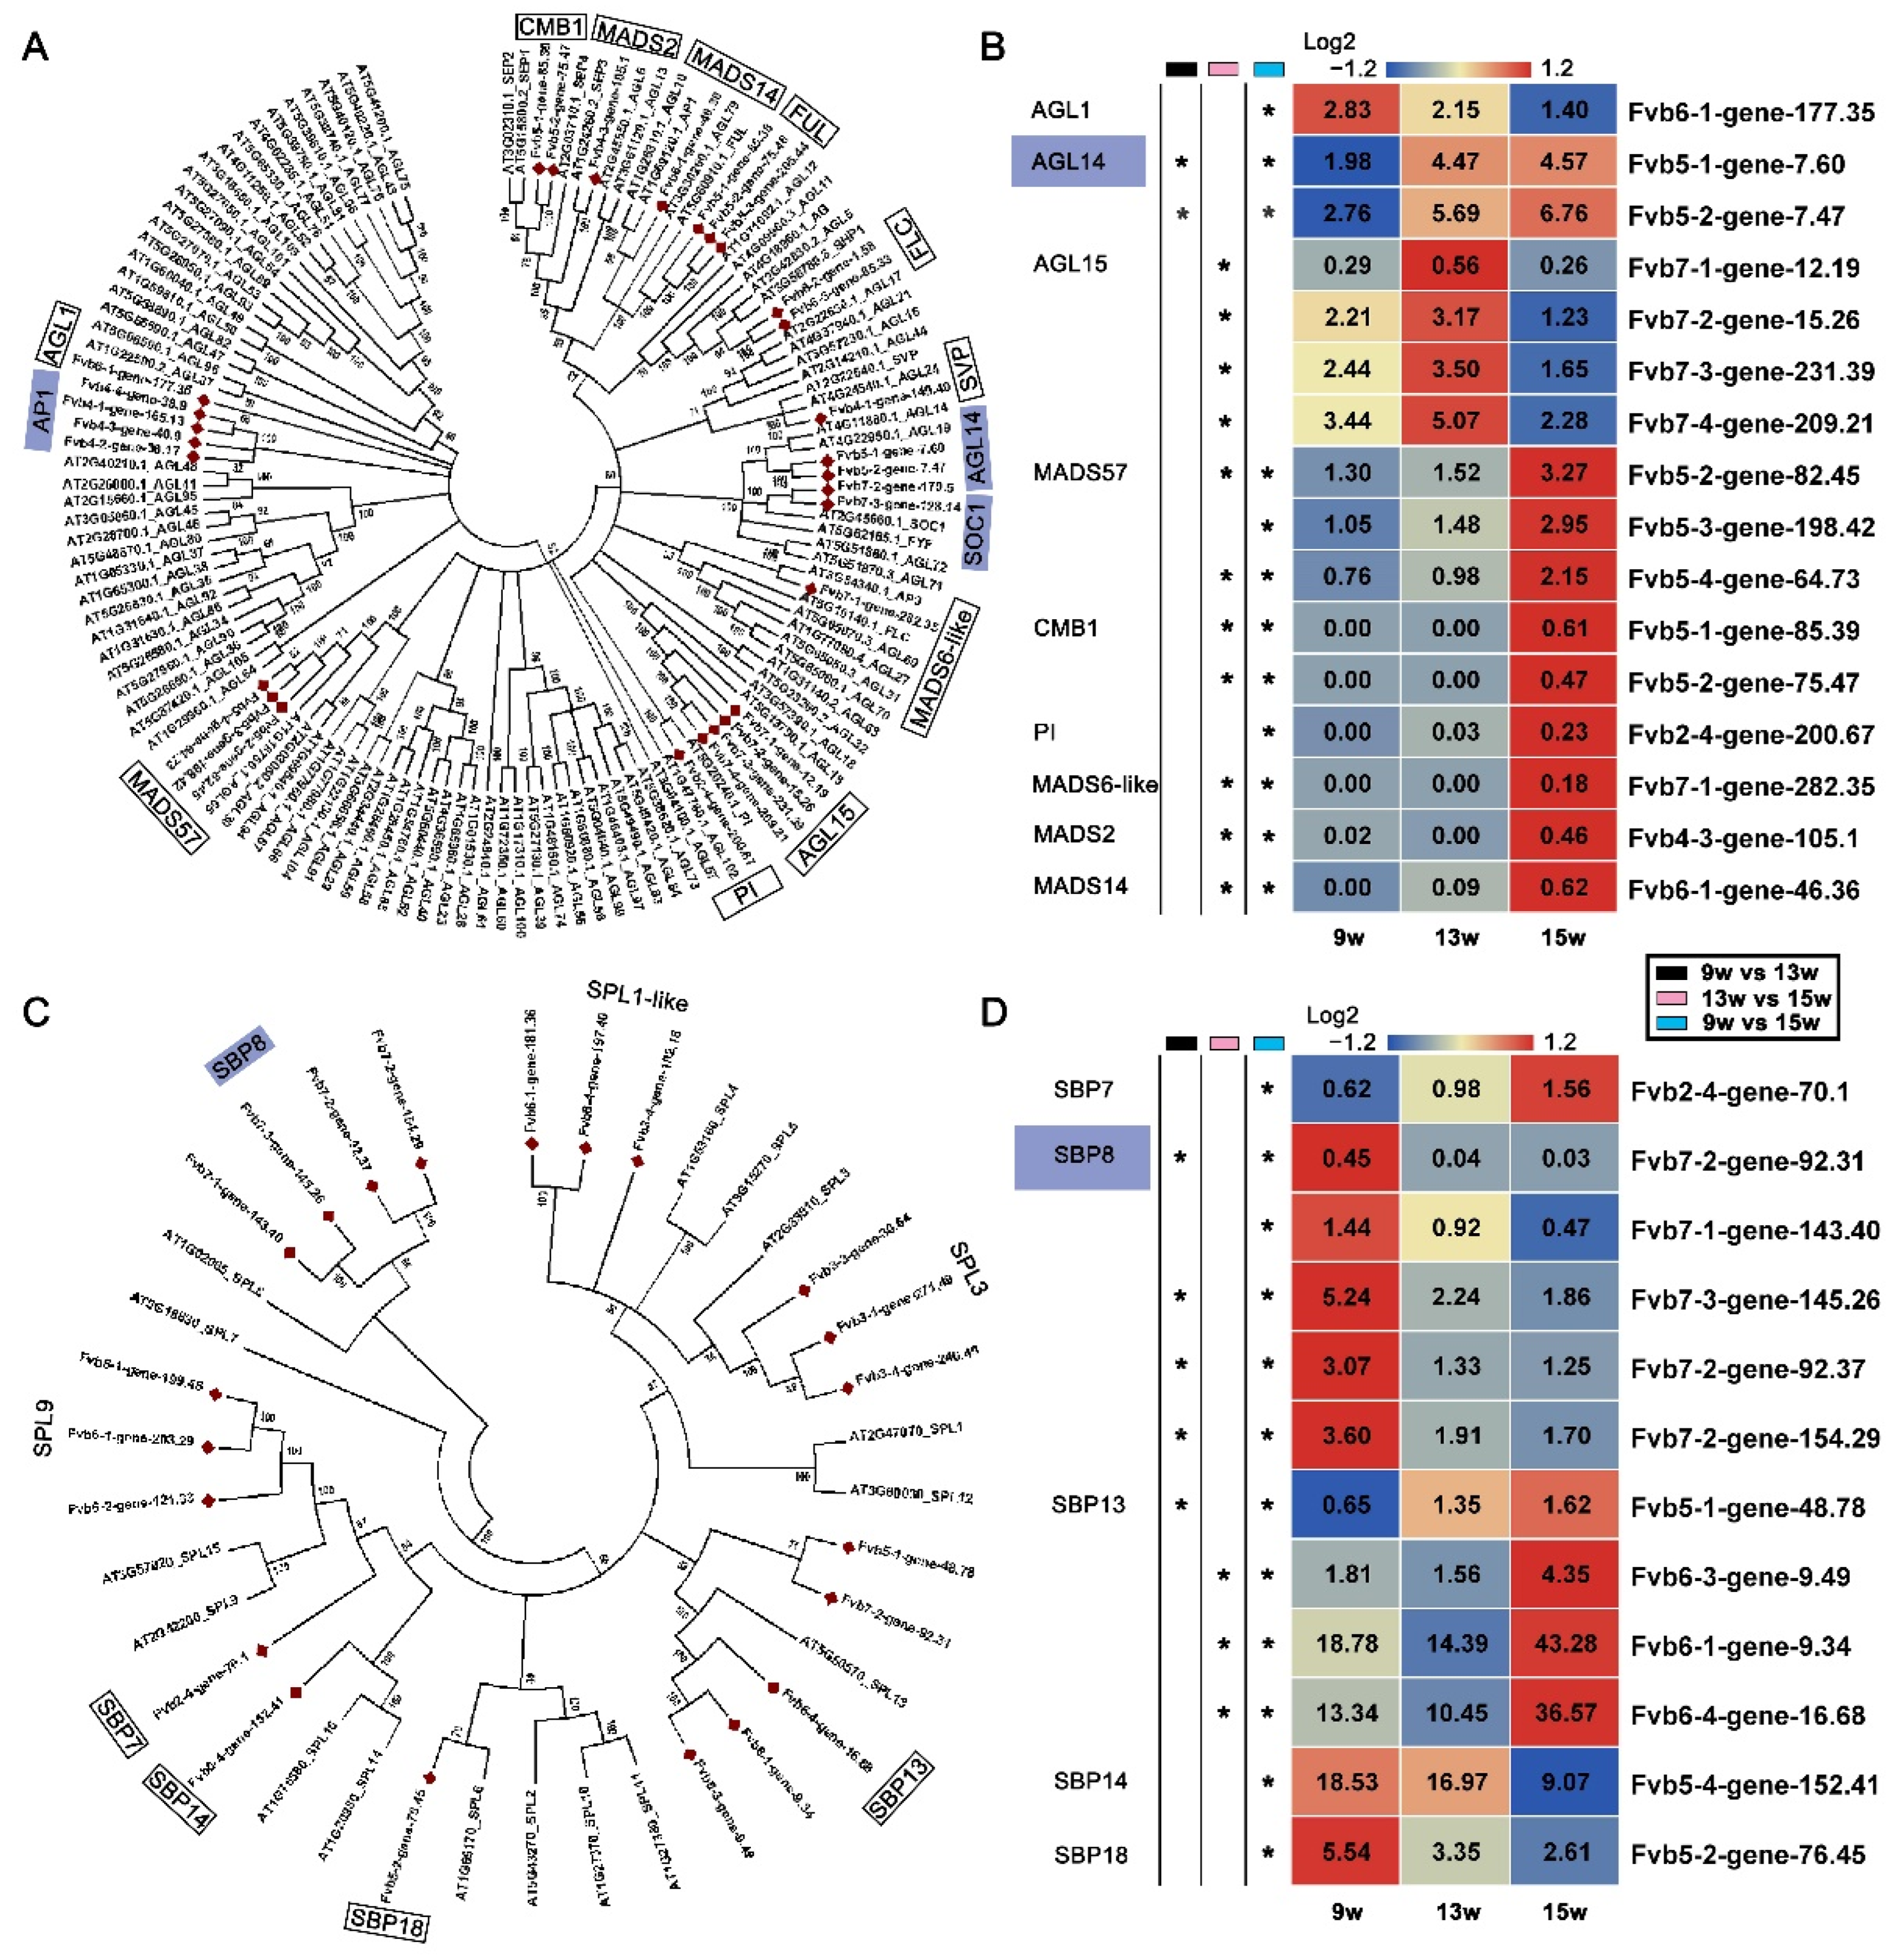
Figure 6.
Kyoto Encyclopedia of Genes analysis of DEGs. KEGG pathway analysis of the DEGs showing the top 20 enriched pathways. The most enriched pathway—Plant hormone signal transduction is indicated by the red box.
Figure 6.
Kyoto Encyclopedia of Genes analysis of DEGs. KEGG pathway analysis of the DEGs showing the top 20 enriched pathways. The most enriched pathway—Plant hormone signal transduction is indicated by the red box.
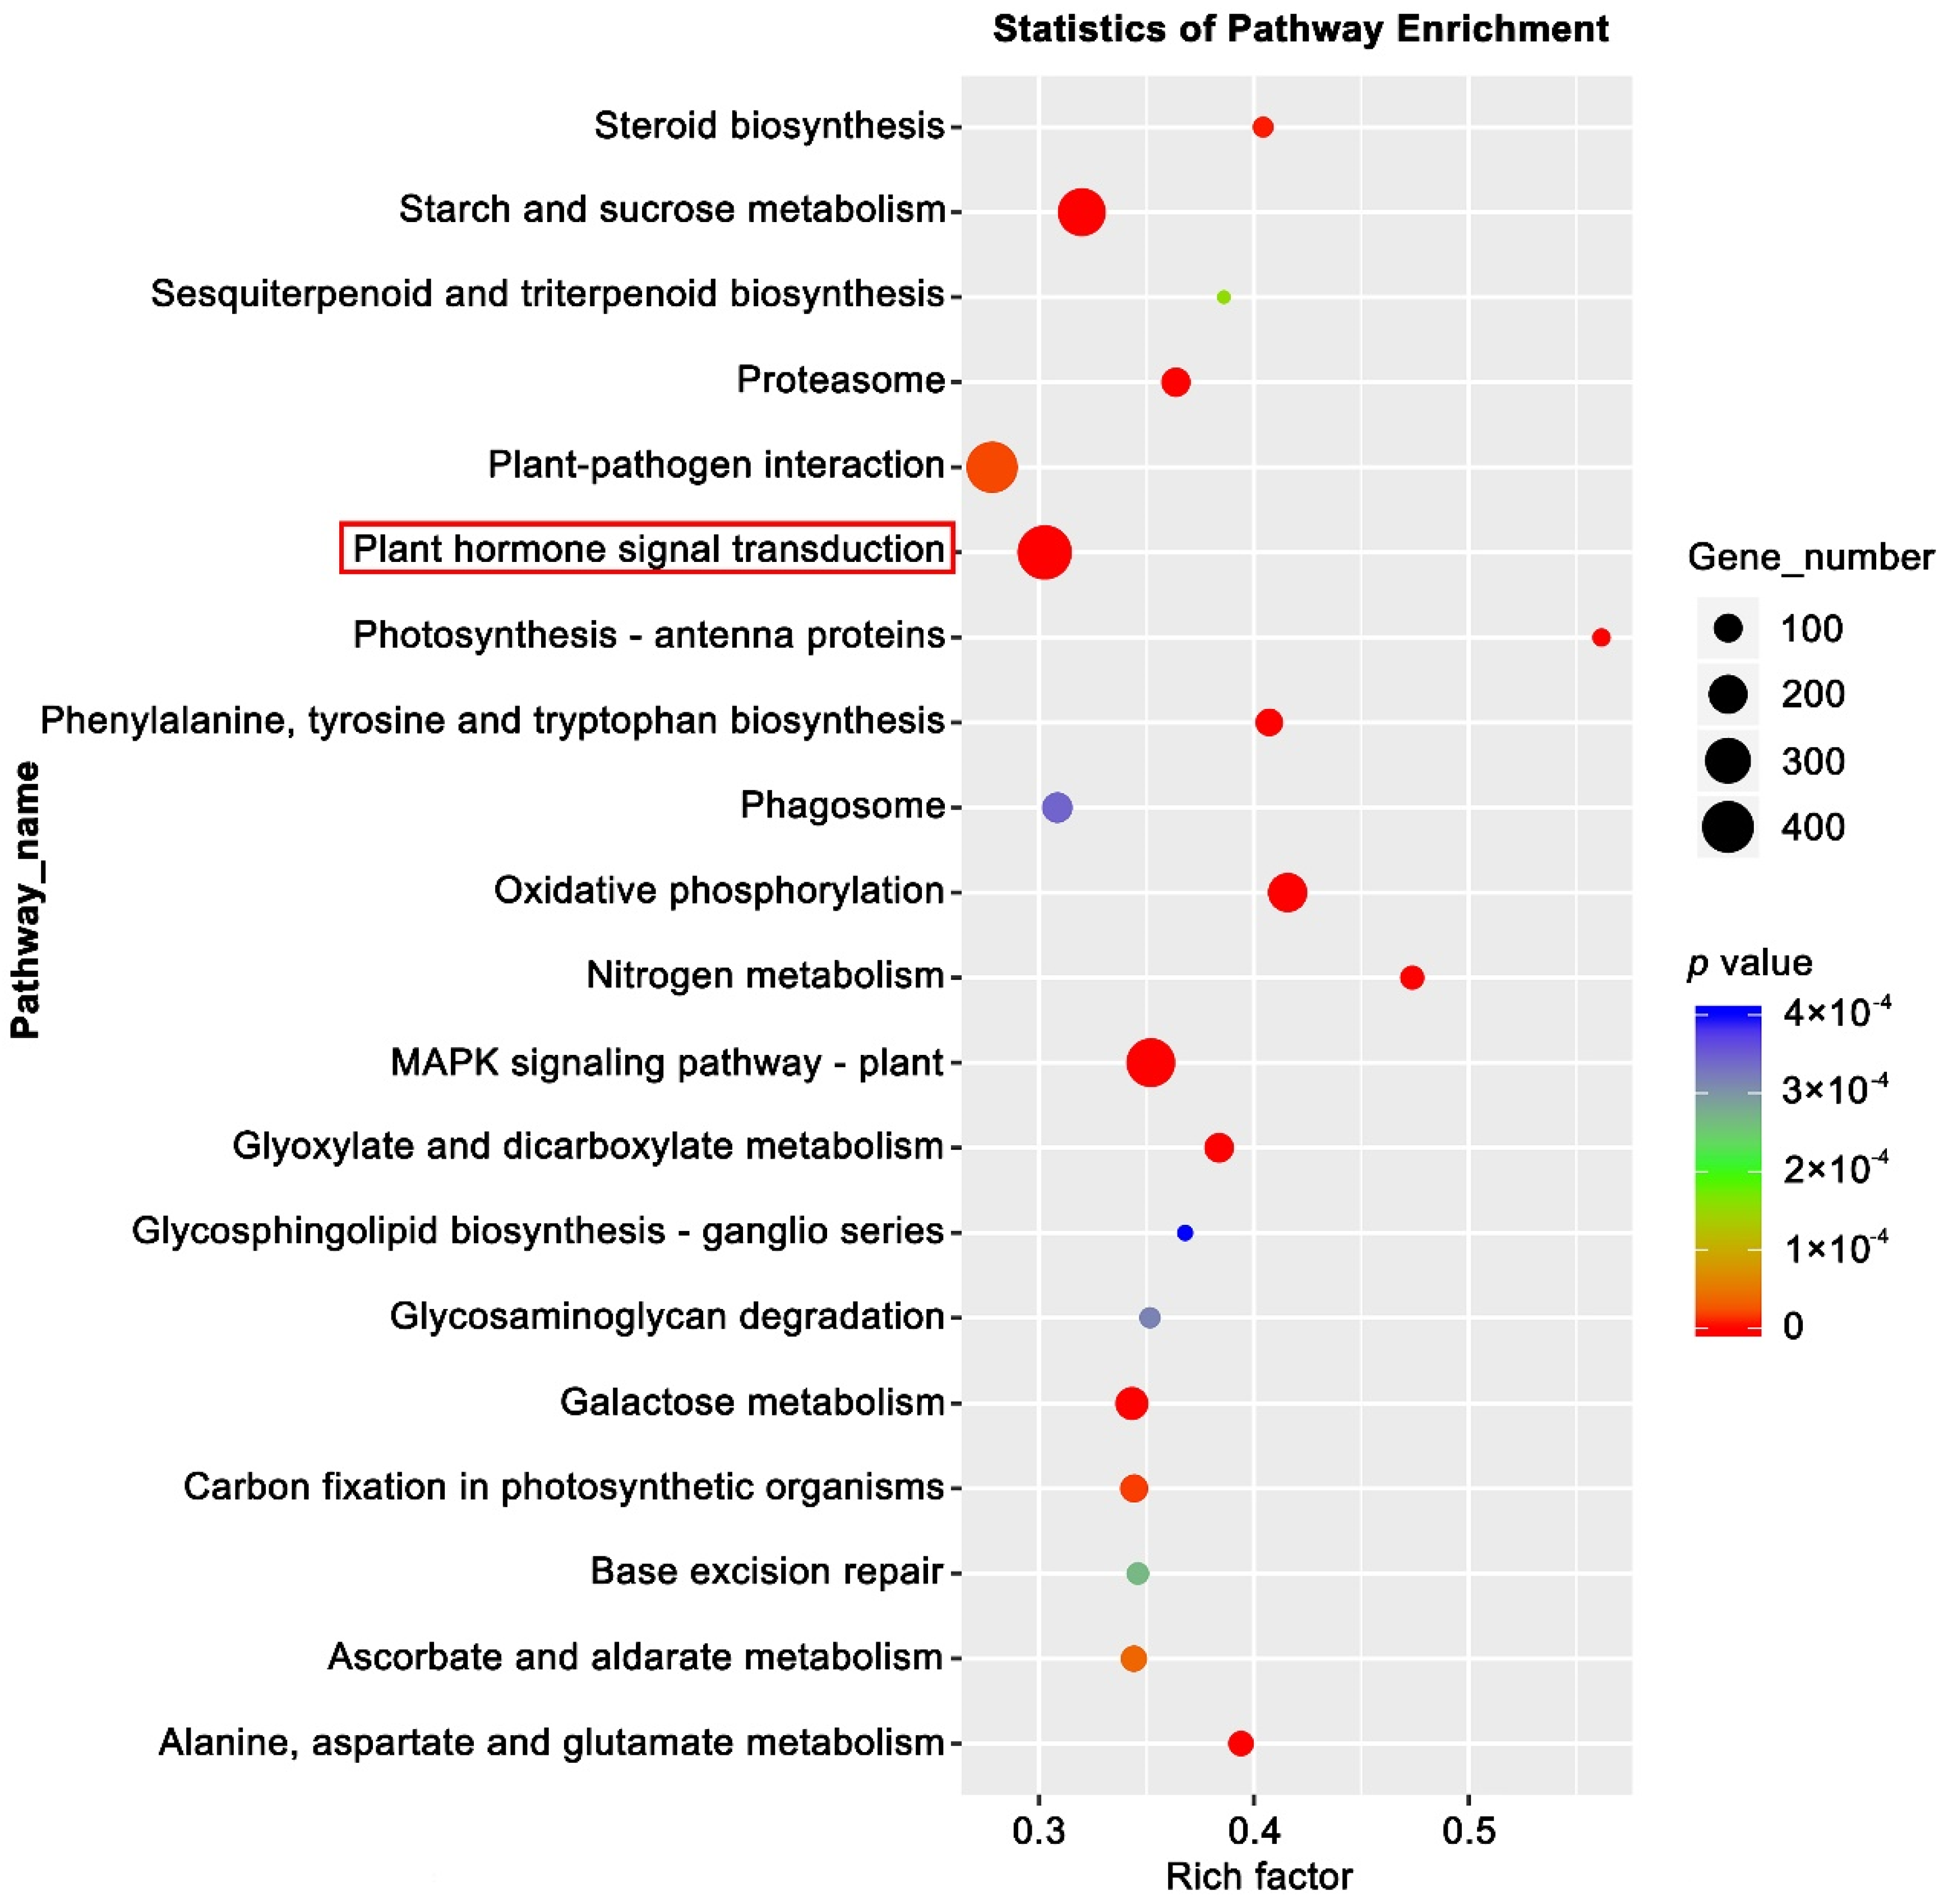
Figure 7.
DEGs involved in auxin signaling pathways. (A) Auxin signal transduction pathways by referring to the KO04075 pathway in KEGG enrichment analysis. (B) Heatmaps showing the relative expression of DEGs involved in the auxin. The purple boxes indicate the genes in which expression was significantly changed by 9 w vs. 13 w. 9 w: vegetative stage, 13 w: shifts to reproductive stage at gene level, 15 w: reproductive stage. The column with the black boxes represents the student’s t test analysis of DEGs by 9 w vs. 13 w. The column with the pink boxes represents the student’s t test analysis of DEGs by 13 w vs. 15 w; The column with the blue boxes represents the student’s t test analysis of DEGs by 9 w vs. 15 w. (* |Log2FC| ≥ 1, p < 0.05. ** |Log2FC| ≥ 2, p < 0.01).

Figure 8.
DEGs involved in gibberellin, cytokinin, ethylene, and jasmonic acid signaling pathways. (A–D) Gibberellin, cytokinin, ethylene, and jasmonic acid signal transduction pathways by referring to the KO04075 pathway in KEGG enrichment analysis. (E) Heatmaps showing the relative expression of DEGs involved in the above-mentioned hormone signaling pathways. The purple boxes indicate the genes in which expression was significantly changed by 9 w vs. 13 w. 9 w: vegetative stage, 13 w: shifts to reproductive stage at gene level, 15 w: reproductive stage. The column with the black boxes represents the student’s t test analysis of DEGs by 9 w vs. 13 w; The column with the pink boxes represents the student’s t test analysis of DEGs by 13 w vs. 15 w; The column with the blue boxes represents the student’s t test analysis of DEGs by 9 w vs. 15 w. (* |Log2FC| ≥ 1, p < 0.05. ** |Log2FC| ≥ 2, p < 0.01).

Figure 9.
DEGs involved in abscisic acid, brassinosteroid, and salicylic acid signaling pathways. (A–C) Abscisic acid, brassinosteroid, and salicylic acid signal transduction pathways by referring to the KO04075 pathway in KEGG enrichment analysis. (D) Heatmaps showing the relative expression of DEGs involved in the above-mentioned hormone signaling pathways. The purple boxes indicate the genes in which expression was significantly changed by 9 w vs. 13 w. 9 w: vegetative stage, 13 w: shifts to the reproductive stage at the gene level, 15 w: reproductive stage. The column with the black boxes represents the student’s t test analysis of DEGs by 9 w vs. 13 w; The column with the pink boxes represents the student’s t test analysis of DEGs by 13 w vs. 15 w; The column with the blue boxes represents the student’s t test analysis of DEGs by 9 w vs. 15 w. (* |Log2FC| ≥ 1, p < 0.05. ** |Log2FC| ≥ 2, p < 0.01).

Figure 10.
QRT-PCR analysis of 24 strawberry genes that showed differential expression at 9 w, 13 w, and 15 w to verify the RNA-seq data. (A–T) QRT-PCR identification of DEGs mentioned in the above text. Error bars indicate the standard deviation (SD) for three biological replicates. (* p < 0.05, ** p < 0.01).

Table 1.
Overview of the RNA-seq read data from the nine strawberry flower bud libraries.
| Sample | Raw Read Number a | Valid Read Number | Total Mapped Reads (%) | GC Content (%) b | Q30 (%) c |
|---|---|---|---|---|---|
| 9 w_1 | 54,341,278 | 52,680,790 | 89.03% | 47.50 | 98.21 |
| 9 w_2 | 44,889,462 | 42,256,470 | 88.58% | 47 | 98.18 |
| 9 w_3 | 51,051,002 | 45,602,432 | 90.21% | 47.50 | 98.51 |
| 13 w_1 | 52,877,744 | 49,127,442 | 89.97% | 48 | 98.46 |
| 13 w_2 | 54,852,944 | 51,190,822 | 90.21% | 47 | 98.38 |
| 13 w_3 | 55,022,942 | 51,511,104 | 90.72% | 48 | 98.37 |
| 15 w_1 | 53,068,162 | 49,831,302 | 90.95% | 48 | 98.42 |
| 15 w_2 | 53,338,002 | 49,269,292 | 90.37% | 47.50 | 98.38 |
| 15 w_3 | 53,002,122 | 49,759,422 | 90.52% | 48 | 98.31 |
a: The number of reads in the original offline data; b: The proportion of G and C content in four bases in valid reads; c: Proportion of bases with mass value ≥ 30 (sequencing error rate less than 0.001).
Publisher’s Note: MDPI stays neutral with regard to jurisdictional claims in published maps and institutional affiliations. |
© 2022 by the authors. Licensee MDPI, Basel, Switzerland. This article is an open access article distributed under the terms and conditions of the Creative Commons Attribution (CC BY) license (https://creativecommons.org/licenses/by/4.0/).
Share and Cite
MDPI and ACS Style
Liang, J.; Zheng, J.; Wu, Z.; Wang, H. Time-Course Transcriptomic Profiling of Floral Induction in Cultivated Strawberry. Int. J. Mol. Sci. 2022, 23, 6126. https://doi.org/10.3390/ijms23116126
AMA Style
Liang J, Zheng J, Wu Z, Wang H. Time-Course Transcriptomic Profiling of Floral Induction in Cultivated Strawberry. International Journal of Molecular Sciences. 2022; 23(11):6126. https://doi.org/10.3390/ijms23116126
Chicago/Turabian StyleLiang, Jiahui, Jing Zheng, Ze Wu, and Hongqing Wang. 2022. "Time-Course Transcriptomic Profiling of Floral Induction in Cultivated Strawberry" International Journal of Molecular Sciences 23, no. 11: 6126. https://doi.org/10.3390/ijms23116126
Note that from the first issue of 2016, this journal uses article numbers instead of page numbers. See further details here.