Article

Molecular Pathogenesis of Colorectal Cancer: Impact of Oncogenic Targets Regulated by Tumor Suppressive miR-139-3p

1
Department of Digestive Surgery, Breast and Thyroid Surgery, Graduate School of Medical and Dental Sciences, Kagoshima University, Kagoshima 890-8520, Japan
2
Department of Functional Genomics, Graduate School of Medicine, Chiba University, Chiba 260-8670, Japan
*
Author to whom correspondence should be addressed.
Int. J. Mol. Sci. 2022, 23(19), 11616; https://doi.org/10.3390/ijms231911616
Submission received: 30 July 2022 / Revised: 14 September 2022 / Accepted: 27 September 2022 / Published: 1 October 2022

Abstract

:
We recently determined the RNA sequencing-based microRNA (miRNA) expression signature of colorectal cancer (CRC). Analysis of the signature showed that the expression of both strands of pre-miR-139 (miR-139-5p, the guide strand, and miR-139-3p, the passenger strand) was significantly reduced in CRC tissues. Transient transfection assays revealed that expression of miR-139-3p blocked cancer cell malignant transformation (e.g., cell proliferation, migration, and invasion). Notably, expression of miR-139-3p markedly blocked RAC-alpha serine/threonine-protein kinase (AKT) phosphorylation in CRC cells. A combination of in silico database and gene expression analyses of miR-139-3p-transfected cells revealed 29 putative targets regulated by miR-139-3p in CRC cells. RNA immunoprecipitation analysis using an Argonaute2 (AGO2) antibody revealed that KRT80 was efficiently incorporated into the RNA-induced silencing complex. Aberrant expression of Keratin 80 (KRT80) was detected in CRC clinical specimens by immunostaining. A knockdown assay using small interfering RNA (siRNA) targeting KRT80 showed that reducing KRT80 expression suppressed the malignant transformation (cancer cell migration and invasion) of CRC cells. Importantly, inhibiting KRT80 expression reduced AKT phosphorylation in CRC cells. Moreover, hexokinase-2 (HK2) expression was reduced in cells transfected with the KRT80 siRNAs or miR-139-3p. The involvement of miRNA passenger strands (e.g., miR-139-3p) in CRC cells is a new concept in miRNA studies. Our tumor-suppressive miRNA-based approach helps elucidate the molecular pathogenesis of CRC.

1. Introduction

According to the World Health Organization (Globocan 2020), colorectal cancer (CRC) is the third most common cancer (over 1,800,000 cases) worldwide and the second leading cause of cancer-related deaths (over 880,000 deaths) [1]. In clinical practice, the prognosis of CRC is relatively good if diagnosed early. However, the prognosis is consistently poor in advanced cases, with a 5-year survival rate of approximately 14% (stage III or stage IV metastatic disease) [2]. At the time of the initial diagnosis, approximately 14–18% of patients with CRC have metastases, and the treatment strategies for unresectable cases are limited [3].
The oncogenesis of CRC is illustrated by a well-known multistep model of cancer cells [4,5,6]. From previous studies, mutations in various genes involved in the oncogenesis of CRC (e.g., APC, TP53, SMAD4, KRAS, and PIK3CA) and activation of cancer signaling pathways (e.g., WNT, RAS/MAPK, PI3K, TGF-β, P53, and DNA mismatch-repair) caused by these gene mutations have been reported [4]. CRC cells have highly heterogeneous properties, requiring new therapeutic parameters for CRC from genetic and genomic points of view. As a result of this molecular heterogeneity, recent genome-wide transcriptome analyses have revealed that CRC cells can be molecularly classified into four consensus molecular subtypes (CMS1 to CMS4) [7]. The future treatment strategies for CRC patients will be based on these subtypes.
As a result of the Human Genome Project, it has become clear that a vast number of functional non-coding RNA molecules (ncRNAs) are present in the human genome [8]. Current studies have shown that numerous ncRNAs play important roles in various biological activities such as the stabilization of RNA molecules and regulation of gene expression and the cell cycle [9,10]. Extensive research to date has revealed that ncRNA dysregulation is deeply involved in the initiation and development of human diseases, including cancer [11].
Among ncRNAs, microRNAs (miRNAs), consisting of only 19–22 nucleotides, have been well studied in cancer research fields. They function as fine-tuners of gene expression control in a sequence-dependent manner [12]. A single miRNA controls numerous genes, and in turn, a single gene is controlled by numerous miRNAs [13]. As a result, miRNAs and their target genes form a very complex network within cells, and it is easy to imagine that aberrant expression of miRNAs disrupts this RNA network. Many studies have shown aberrant expression of miRNAs in CRC cells, and these miRNAs act as oncogenes and/or tumor suppressors by targeting cancer-related genes in CRC cells [14,15,16].
More recently, to identify aberrantly expressed miRNAs in CRC cells, we determined the miRNA expression signature of CRC by RNA sequencing [17]. Our signature revealed that both the guide and passenger strands of 16 miRNAs (e.g., miR-9, miR-28, miR-29c, miR-30a, miR-99a, miR-100, miR-125b, miR-129, miR-133a, miR-139, miR-143, miR-145, miR-218, miR-195, miR-490, and miR-497) derived from pre-miRNAs were downregulated [17]. Our recent studies showed that some passenger strands of miRNAs (e.g., miR-30a, miR-99a, miR-143, miR-145, and miR-490) act as tumor-suppressive miRNAs in a wide range of cancers [17,18,19,20,21]. Interestingly, the genes regulated by a specific miRNA differ depending on the type of cancer.
In this study, we focused on miR-139-3p (the passenger strand of pre-miR-139) and investigated its functional significance and target oncogenes in CRC cells. Notably, ectopic expression of miR-139-3p markedly blocked the phosphorylation of RAC-alpha serine/threonine-protein kinase (AKT) in CRC cells. Our search strategy for miRNA targets revealed a total of 29 genes as putative candidate targets of miR-139-3p in CRC cells. Of these, keratin 80 (KRT80) was found to be a direct target of miR-139-3p, and its aberrant expression enhanced the malignant transformation of CRC cells. Involvement of the passenger strand of miRNA and its gene targets in CRC pathogenesis is a new concept and provides novel insights into the molecular pathogenesis of CRC.

2. Results

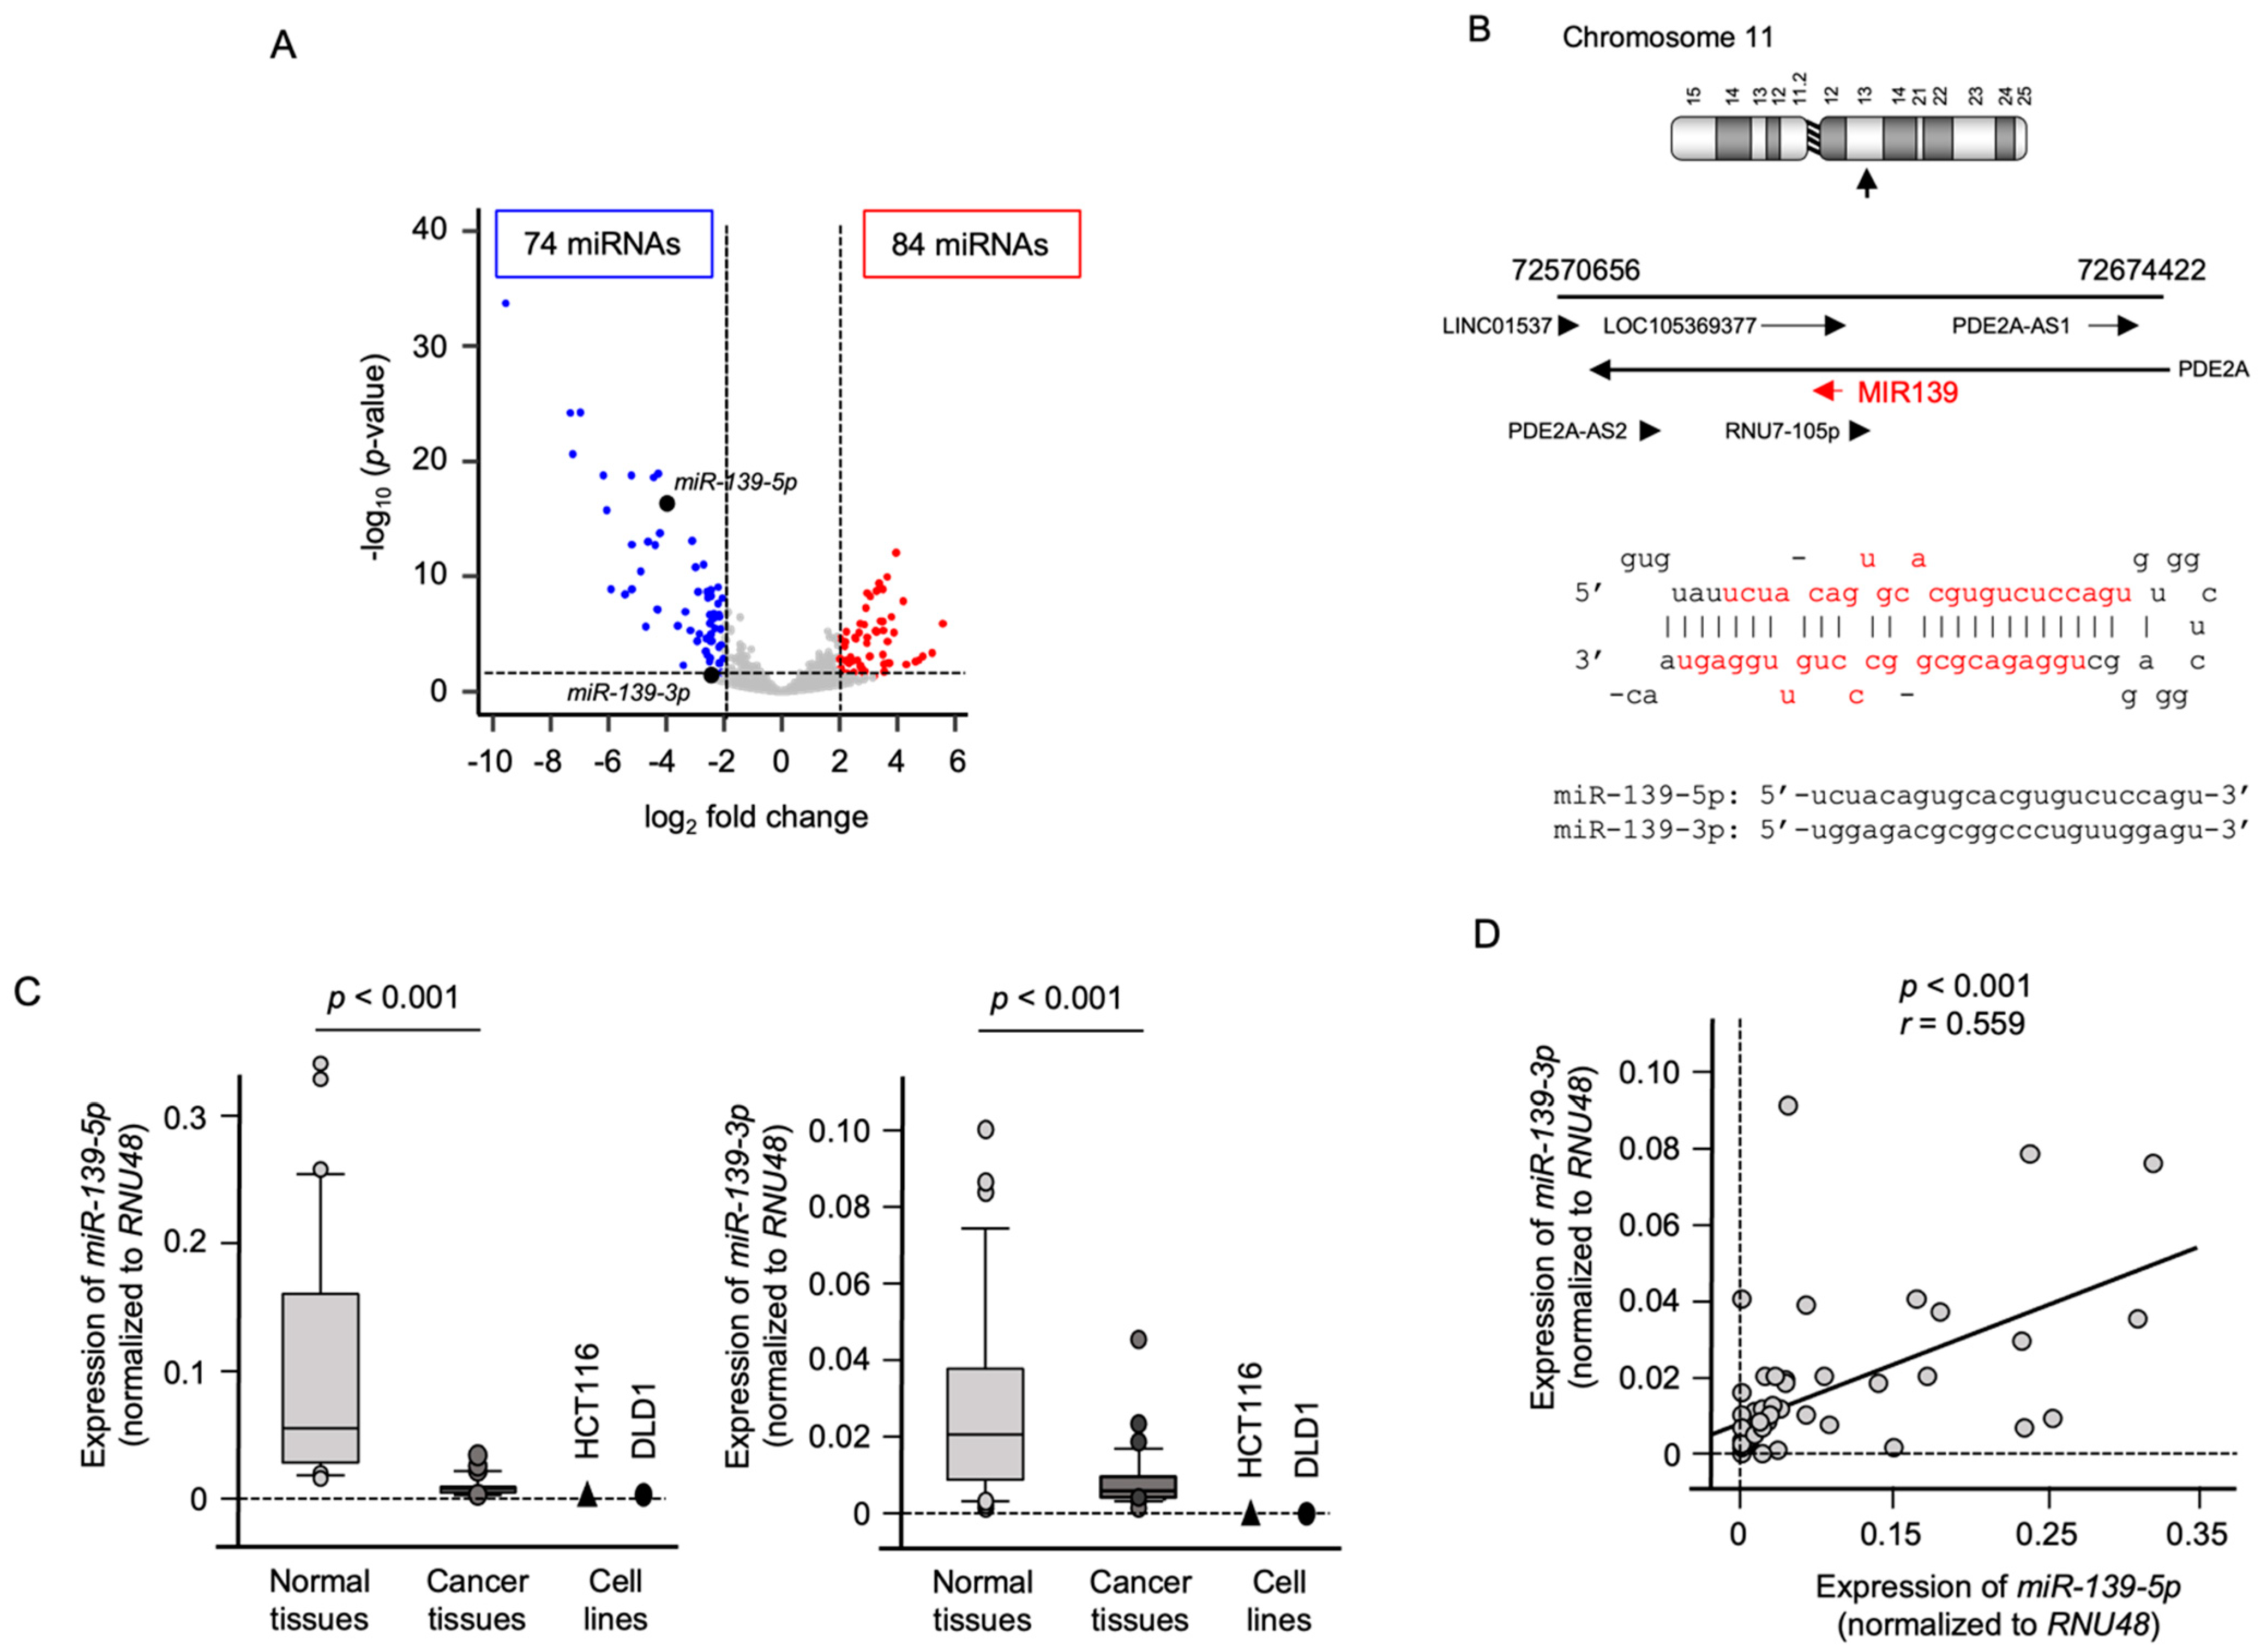
2.1. Expression of miR-139-5p and miR-139-3p in CRC Specimens

Recently, we determined the miRNA expression signature of CRC by miRNA sequencing using CRC clinical specimens (GEO accession number: GSE183437). Analysis of the signature showed that 84 miRNAs were upregulated, and 70 were downregulated in CRC tissues (Figure 1A). Among downregulated miRNAs in CRC tissues, we focused on miR-139-5p (the guide strand) and miR-139-3p (the passenger strand), because both strands of miRNAs derived from pre-miR-139 were significantly downregulated in CRC tissues. Our interest is to clarify how the passenger strand of miRNA is involved in the malignant transformation of CRC cells. The mature sequences of the two microRNAs are shown in Figure 1B.
CRC tissues and noncancerous tumor-adjacent tissues (27 paired) were used to verify the expression status of miR-139-5p, miR-139-3p, and their target genes. Clinical information of these specimens is shown in Table S1. The expression levels of miR-139-5p (p < 0.001) and miR-139-3p (p < 0.001) were significantly lower in CRC tissues than normal tissues (Figure 1C). Next, we examined the expression levels of miR-139-5p and miR-139-3p in two CRC cell lines, HCT116 and DLD-1. In these cell lines, the expression levels of miR-139-5p and miR-139-3p were lower than those in normal epithelial tissues (Figure 1C).
Furthermore, a positive correlation was detected between miR-139-5p and miR-139-3p expression levels by Spearman’s rank analysis (r = 0.559, p < 0.001; Figure 1D).

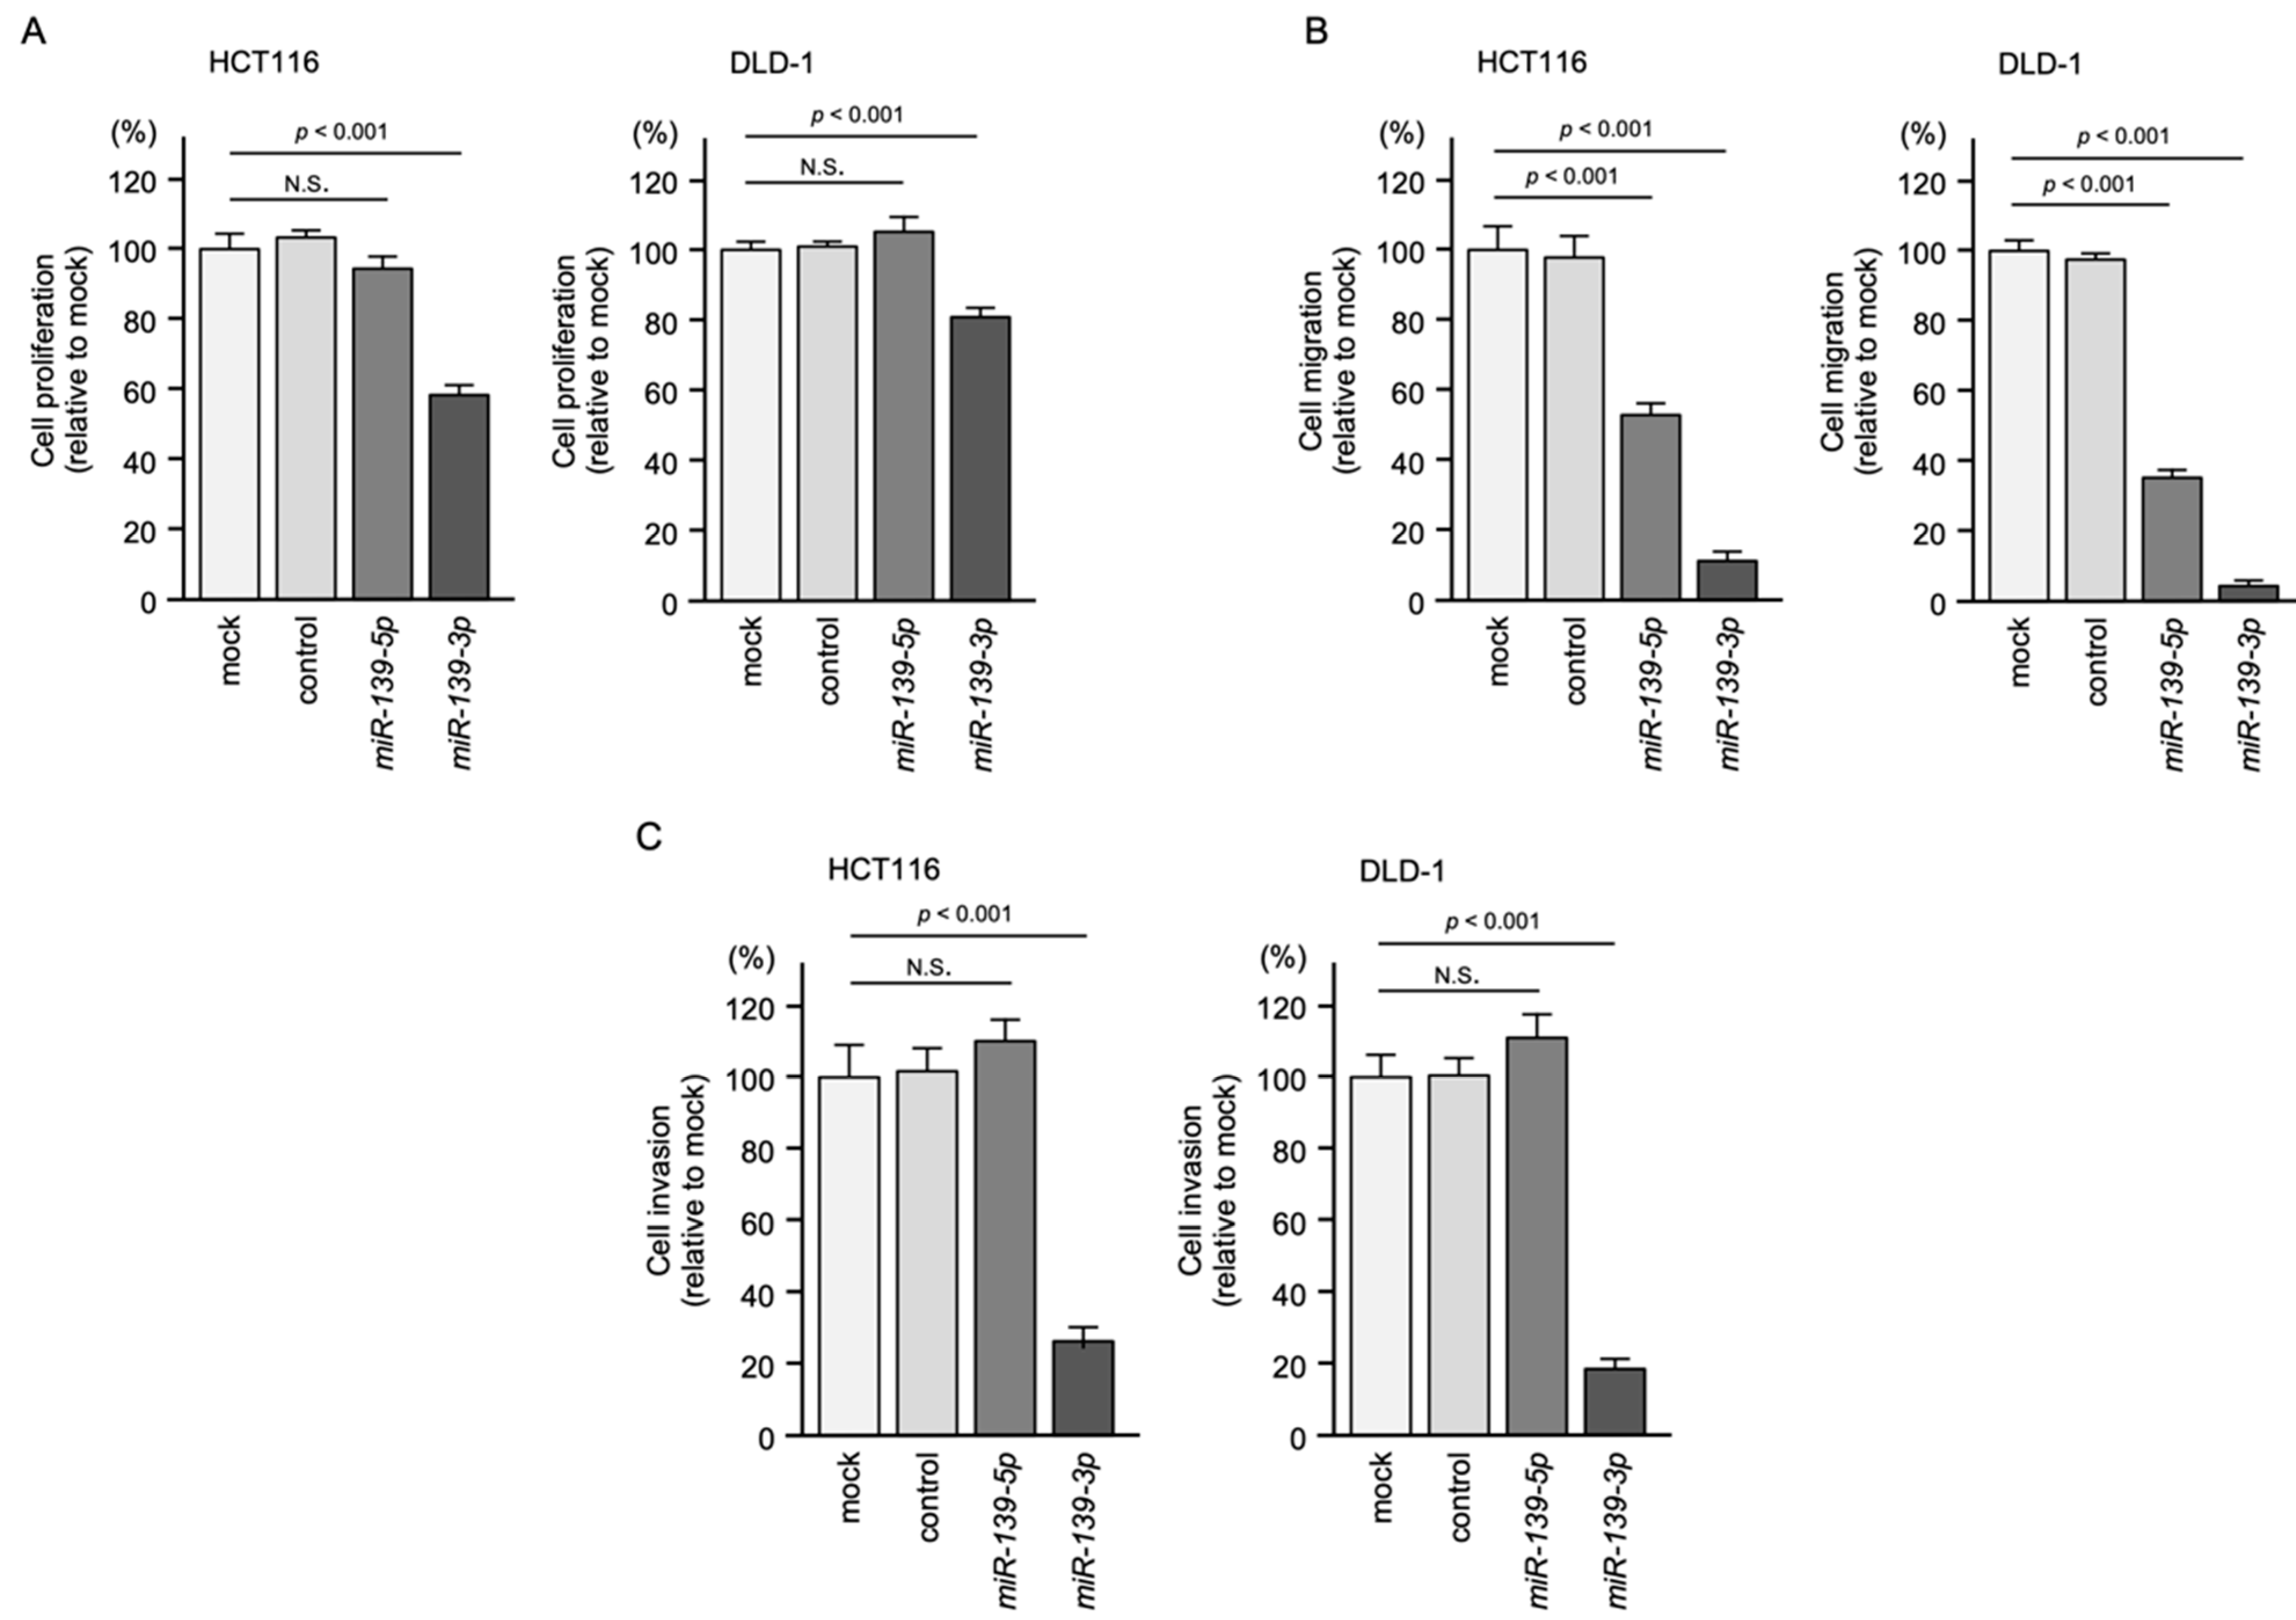
2.2. Ectopic Expression Assays of miR-139-5p and miR-139-3p in CRC Cell Lines

To investigate the tumor-suppressive functions of miR-139-5p and miR-139-3p, we ectopically expressed mature miR-139-5p and miR-139-3p in two CRC cell lines, HCT116 and DLD-1, and performed functional assays, e.g., cancer cell proliferation, migration, and invasion. After miR-139-5p transfection, cancer cell migration in both cell lines was significantly inhibited (Figure 2A–C). In contrast, the malignant phenotypes of cancer cells, e.g., proliferation, migration, and invasion, were significantly reduced by miR-139-3p transfection in both cell lines (Figure 2A–C). Representative images from the migration and invasion assays are shown in Figure S1.

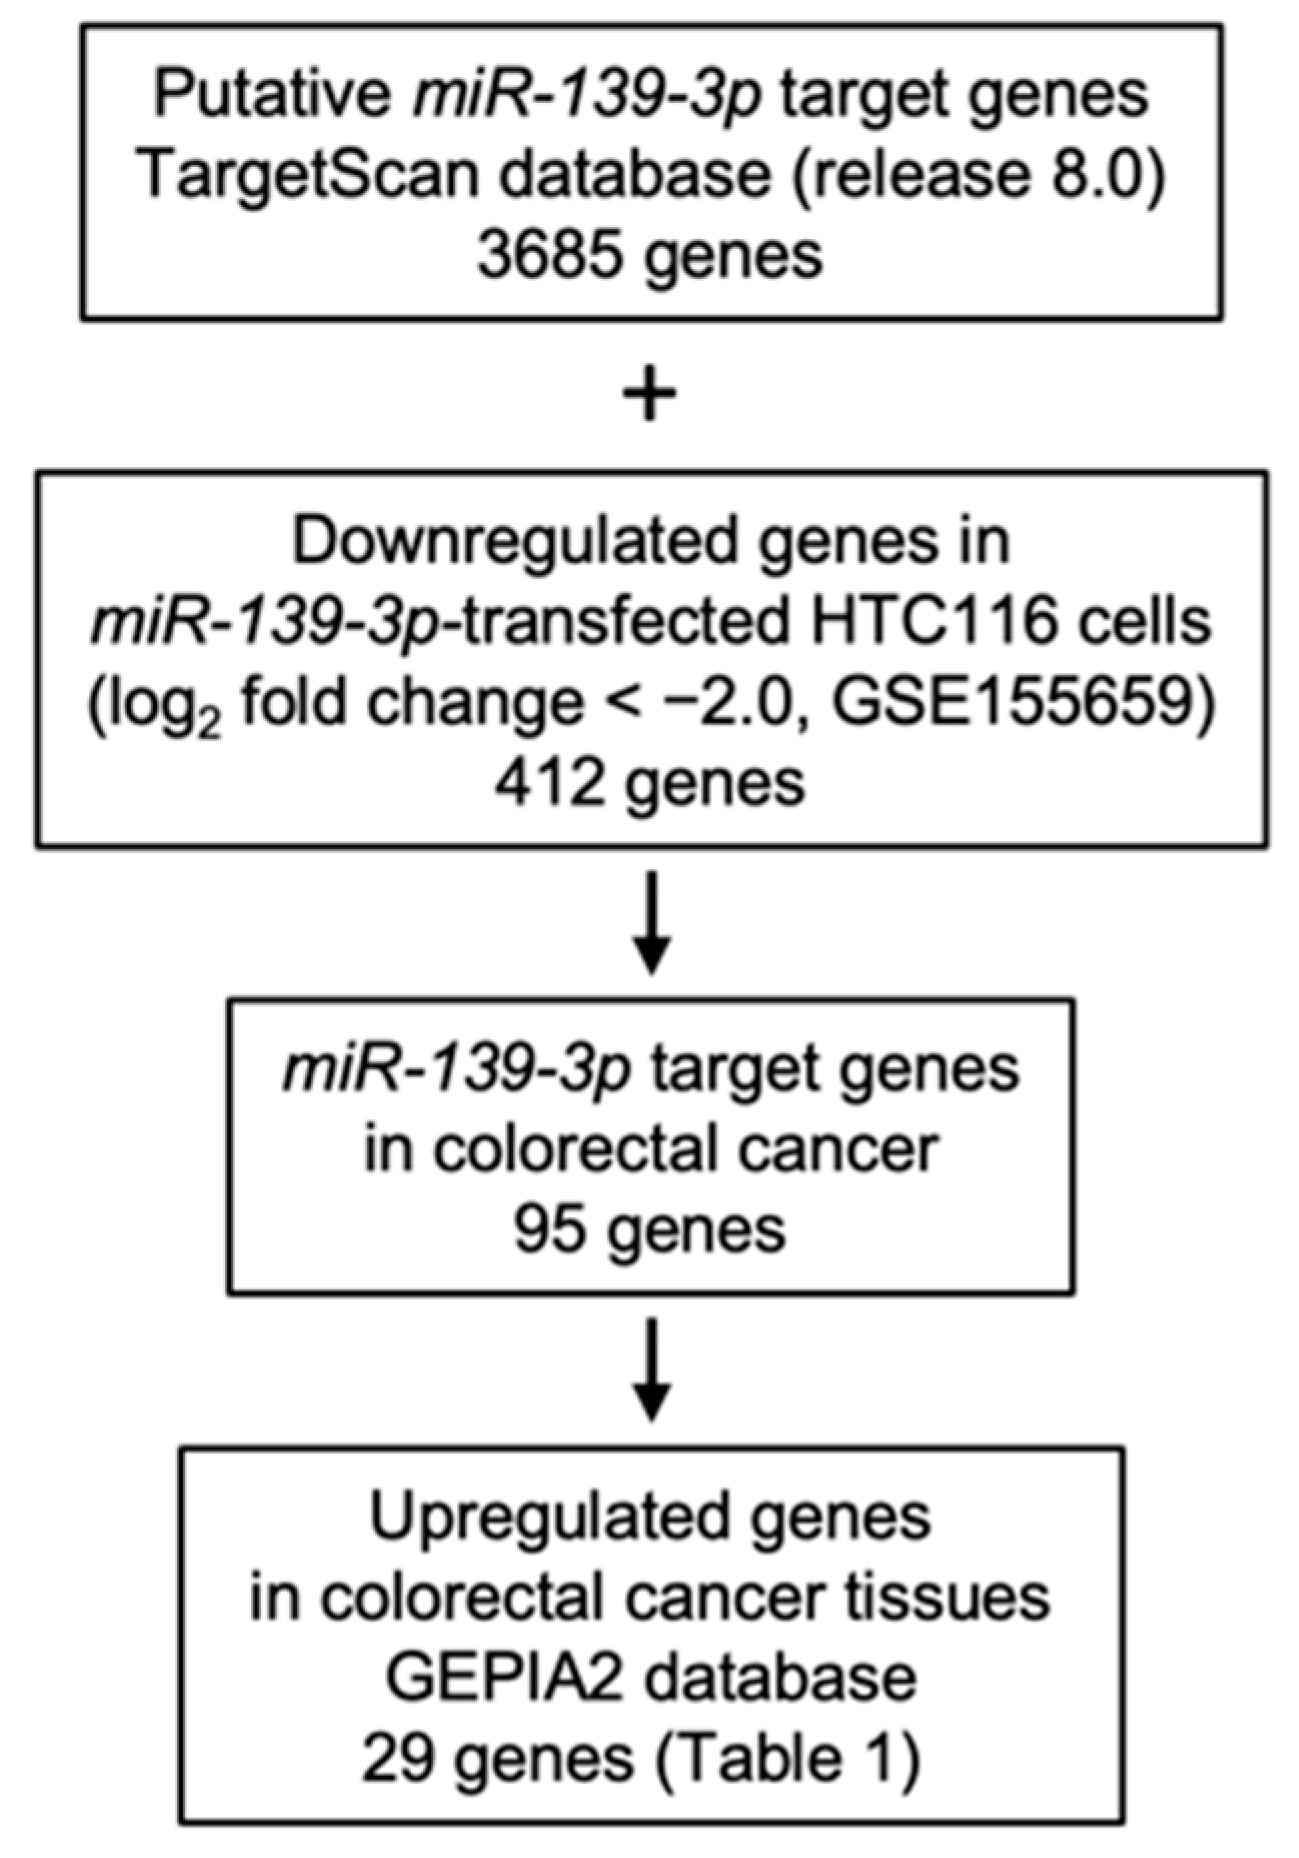
2.3. Identification of Oncogenes Regulated by miR-139-3p in CRC Cells

Based on these expressions and functional analysis, aberrant expression of miR-139-3p and disruption of its gene regulation mechanisms were considered to be more deeply involved in the malignant pathogenesis of CRC. We focused on miR-139-3p (passenger strand) for further validation.
We investigated whether epigenetic modifications affect the downregulation of miR-139-3p in CRC cells. After treatment of Trichostatin A (TSA) in CRC cells, the expression level of miR-139 was increased compared to TSA untreated cells (Figure S2A). In addition, miR-139-3p expression level was elevated by 5-aza-2-deoxycytidine (5-aza-dC) treatment in CRC cells (Figure S2B). These results suggest that histone deacetylation and DNA methylation are closely involved in the downregulation of miR-139-3p in CRC cells.
The following hypotheses regarding miR-139-3p target genes in CRC cells were made: the target genes of miR-139-3p have one or more binding site(s), are downregulated after miR-139-3p transfection in CRC cells, and are upregulated in CRC tissues. We combined the gene expression data from two databases (TargetScan and GEPIA2) with gene expression data from miR-139-3p-transfected CRC cells (GSE155659) to search for genes that meet these three criteria. A flowchart of the search strategy is shown in Figure 3. A total of 95 putative targets of miR-139-3p in CRC cells were identified.
We assessed the expression levels of putative miR-139-3p target genes in CRC clinical tissues using The Cancer Genome Atlas database via the GEPIA2 platform. A total of 29 genes were significantly upregulated in CRC clinical specimens (colon adenocarcinoma or rectal adenocarcinoma) in this database (p < 0.01: Table 1, Figure S3). GEPIA2 analysis revealed that the expression level of KRT80 was fairly low in normal tissues (Figure S3). Genes expressed exclusively in cancer cells are appropriate therapeutic targets for CRC. We focused on KRT80 in the subsequent functional analyses in CRC cells.

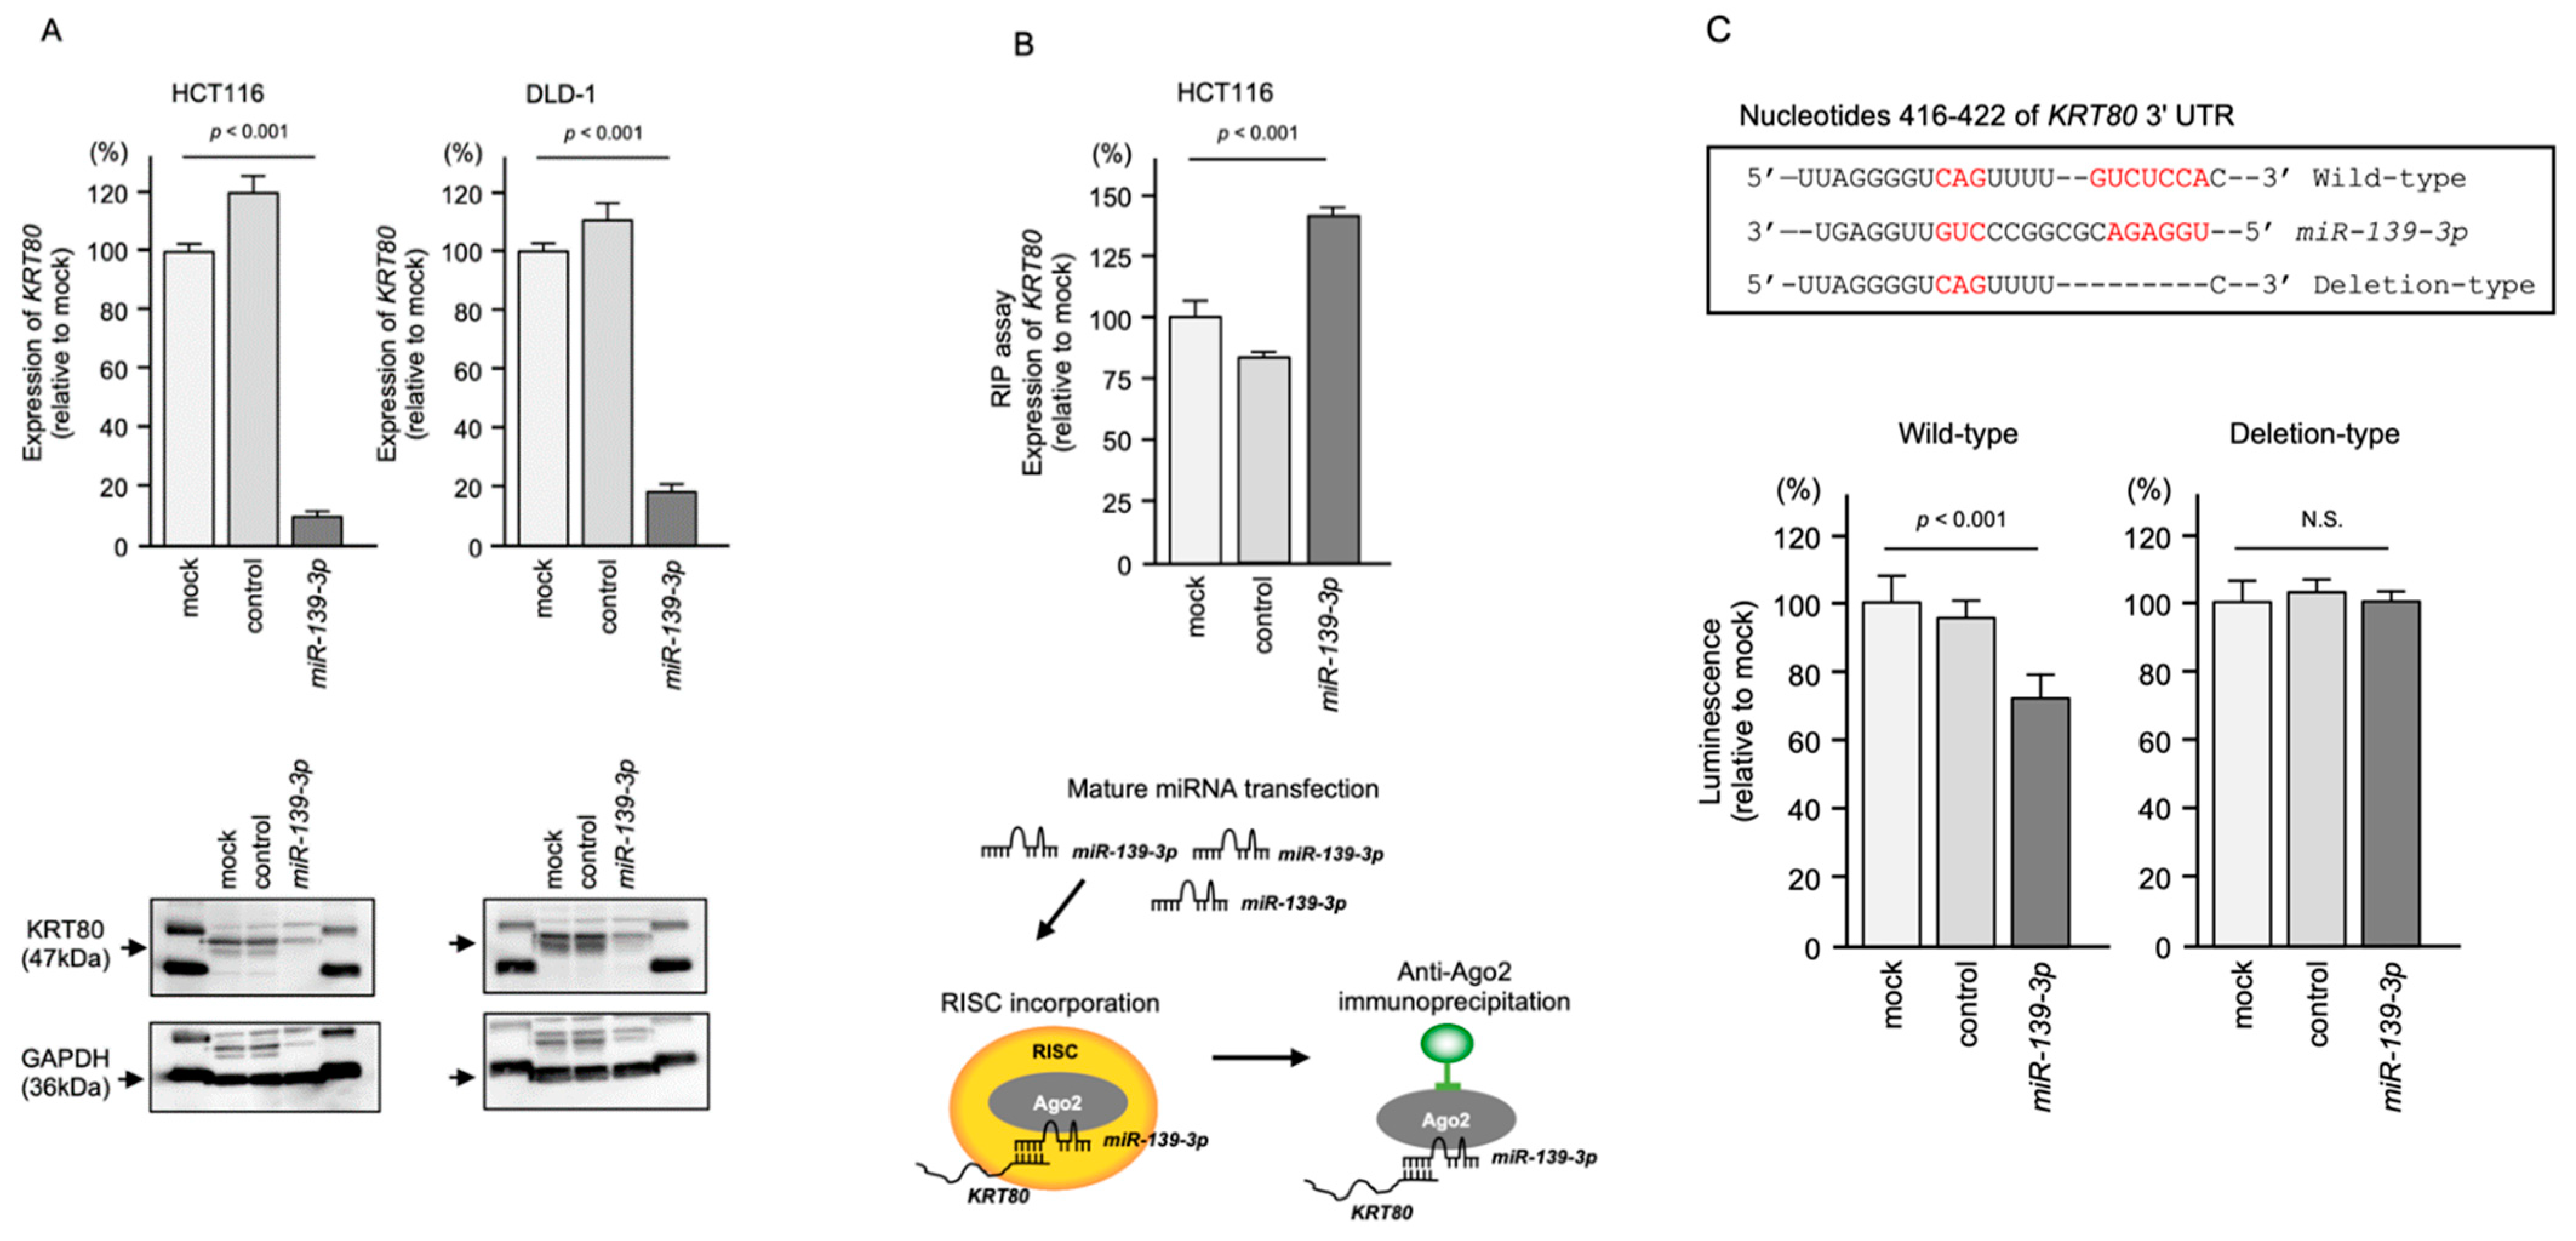
2.4. Direct Regulation of KRT80 by miR-139-3p in CRC Cells

In CRC cells transfected with miR-139-3p, both the mRNA and protein levels of KRT80 were significantly downregulated (Figure 4A).
Next, RNA immunoprecipitation (RIP) analysis was performed to confirm that KRT80 mRNA was incorporated into the RNA-induced silencing complex (RISC) after miR-139-3p transfection. The RIP assay concept is illustrated in a schematic in Figure 4B. In samples subjected to immunoprecipitation using an Argonaute2 (AGO2) antibody, quantitative real-time reverse-transcription PCR (qRT-PCR) showed that the KRT80 mRNA level was significantly higher than that in mock and miRNA control-transfected cells (p < 0.001; Figure 4B). Ago2-bound miR-139-3p and KRT80 mRNA were isolated by immunoprecipitation using the AGO2 antibody, suggesting that the RISC plays a central role in miRNA biogenesis (Figure 4B).
Finally, a dual-luciferase reporter assay was performed to confirm that miR-139-3p binds directly to the 3′ untranslated regions (UTR) of KRT80. Luciferase activity was significantly reduced following co-transfection with miR-139-3p and a vector containing the miR-139-3p-binding site within the 3’-UTR of KRT80 (Figure 4C). In contrast, co-transfection with a vector containing the KRT80 3’-UTR in which the miR-139-3p-binding site was deleted resulted in no change in luciferase activity (Figure 4C).

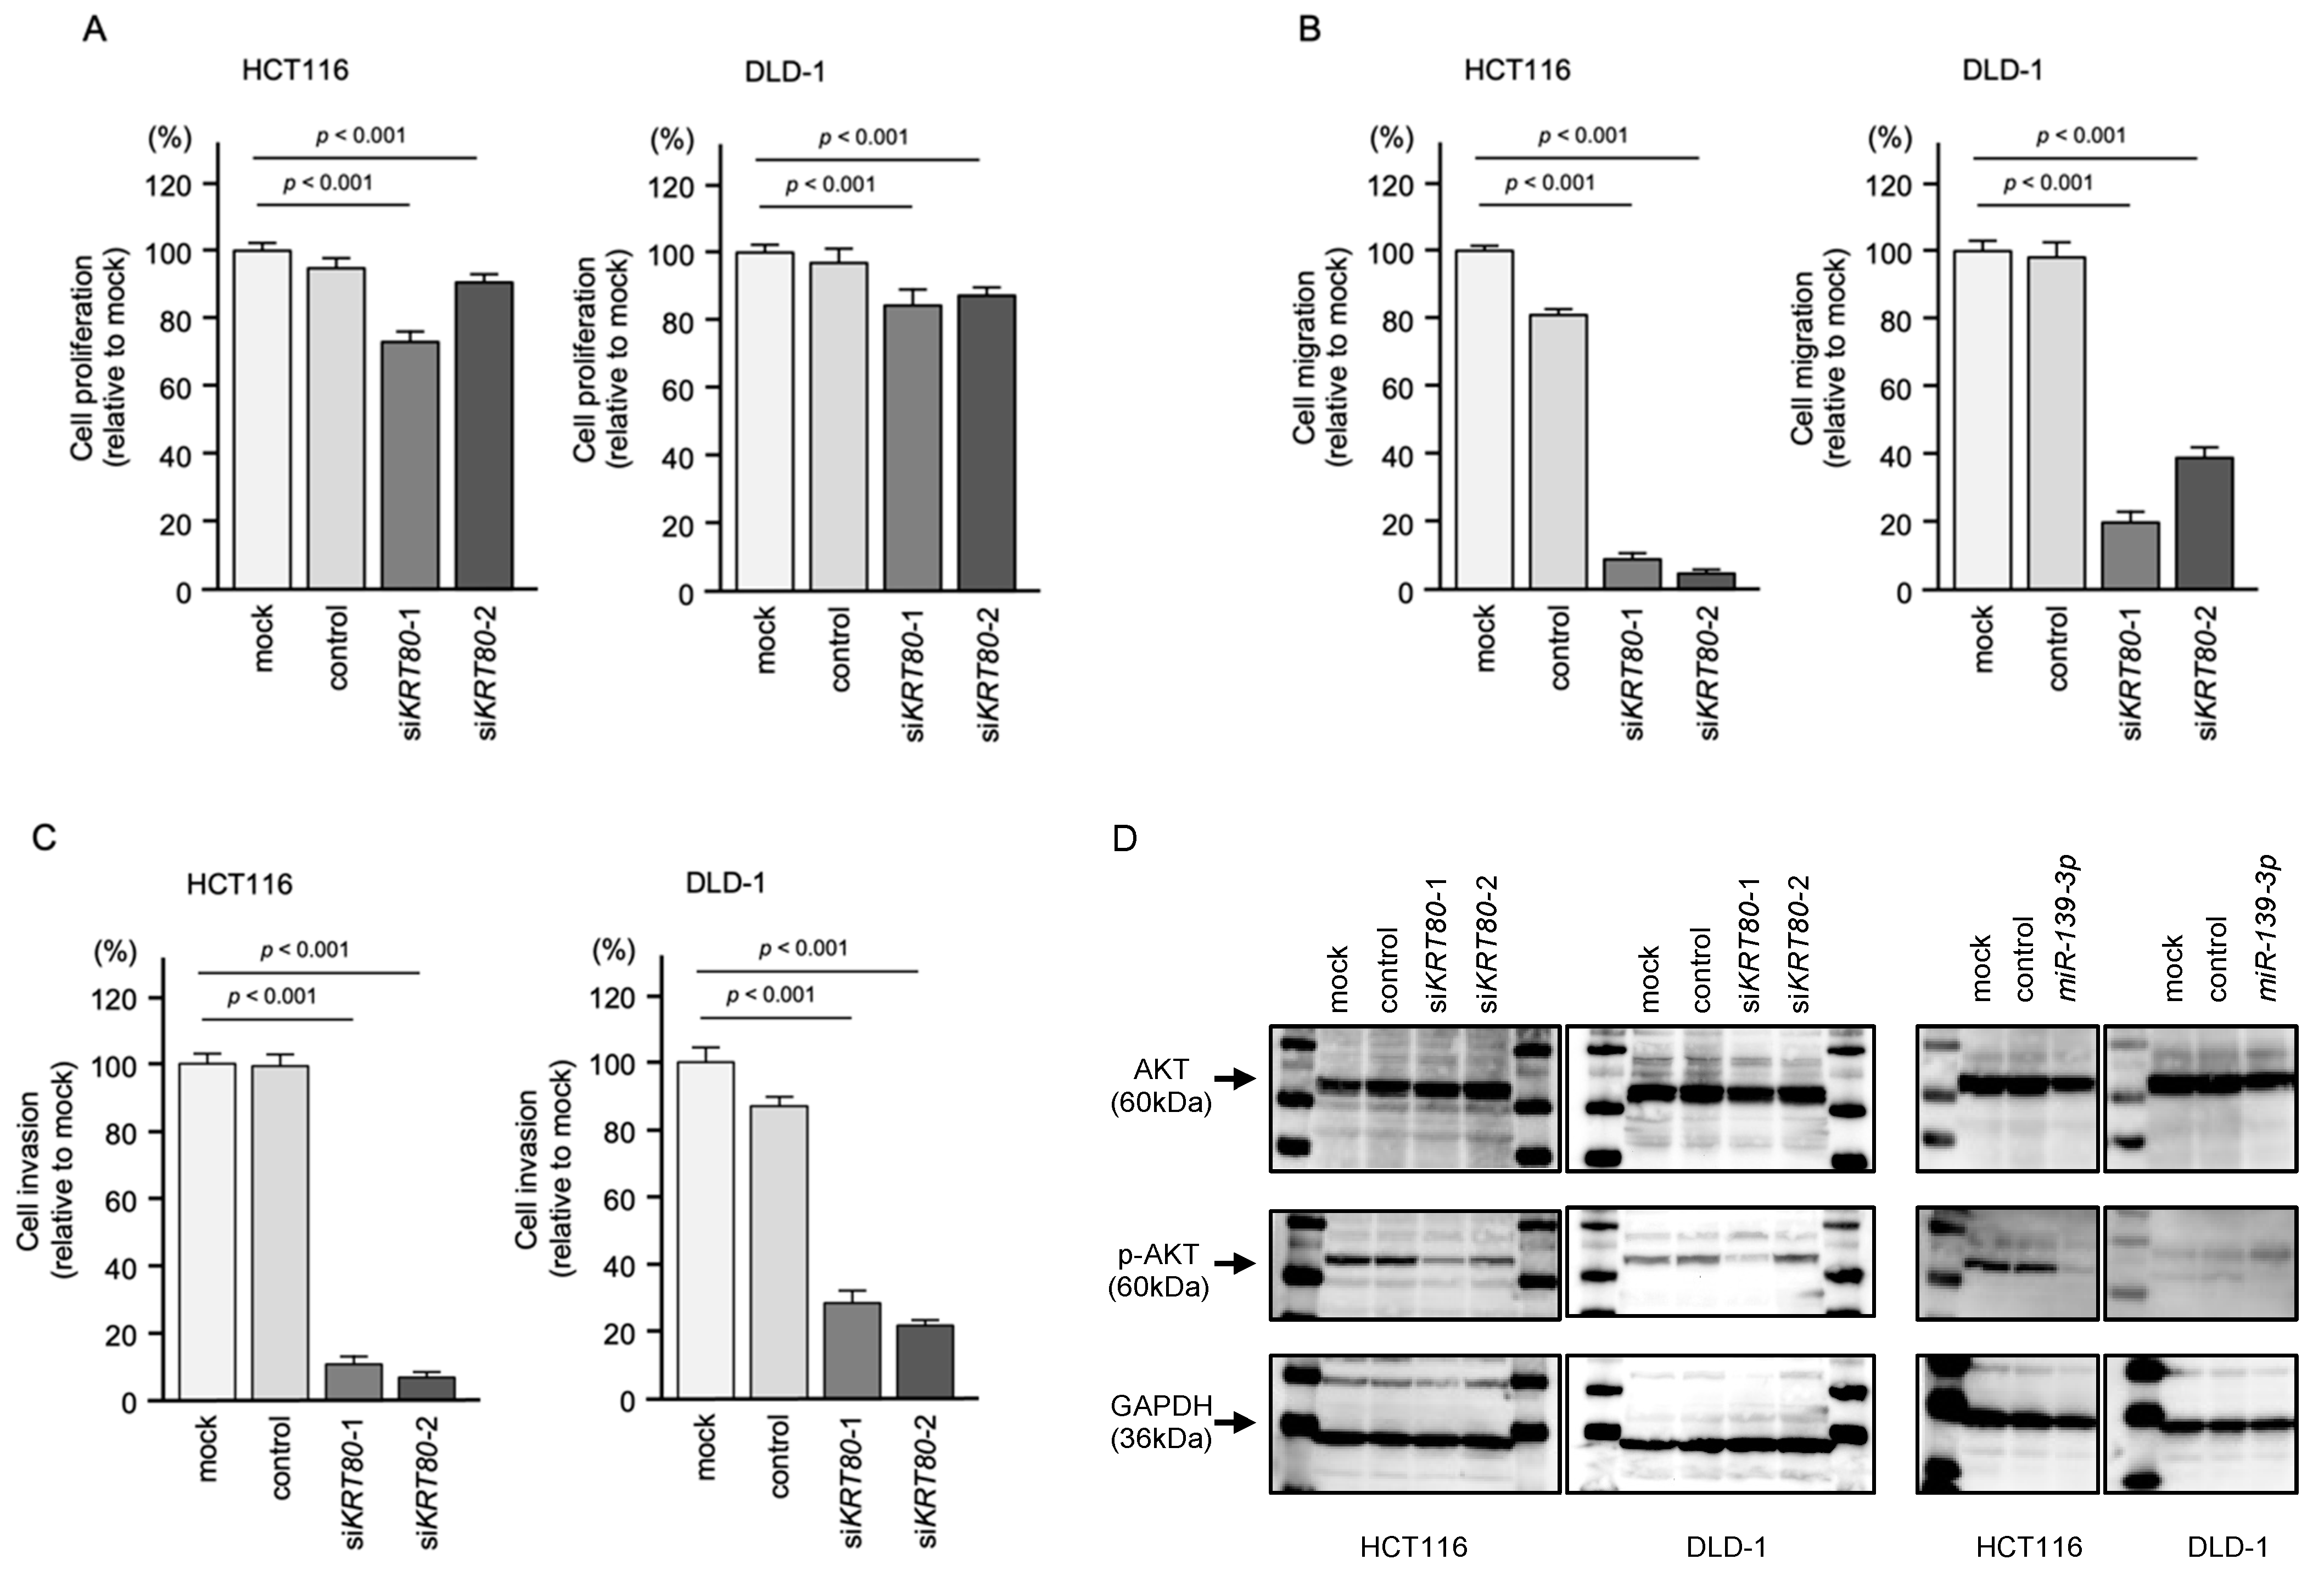
2.5. Knockdown Assays by Small Interfering RNAs (siRNAs) Targeting KRT80 in CRC Cell Lines

To assess the functional significance of KRT80 in CRC cells, we performed knockdown assays using siRNAs corresponding to KRT80 mRNA. First, the inhibitory effects of two different siRNAs (siKRT80-1 and siKRT80-2) targeting KRT80 in two cell lines were examined. Both KRT80 mRNA and protein levels were effectively suppressed after transfection of each siRNA into HCT116 and DLD-1 cells (Figure S4).
Knockdown of KRT80 slightly inhibited cell proliferation (Figure 5A) and markedly inhibited migration and invasion in both HCT116 and DLD-1 cells (Figure 5B,C). Representative photographs from the migration and invasion assays are shown in Figure S5.
Based on the previous report that overexpression of KRT80 induced epithelial-mesenchymal transition (EMT)-related genes and activated AKT signaling via phosphorylation of AKT (Ser 473) [22], Western blotting for phosphorylation of AKT was performed on KRT80 and miR-139-3p.
Notably, transfection of the KRT80 siRNAs suppressed the phosphorylation of AKT (Figure 5D).
In addition, expression of miR-139-3p markedly inhibited the phosphorylation of AKT in CRC cells, according to Western blot analysis.

2.6. Aberrant Expression of KRT80 Protein in CRC Clinical Specimens

Protein expression of KRT80 was assessed by immunohistochemistry in CRC clinical specimens. Overexpression of KRT80 protein was detected in cancer lesions (Figure 6).

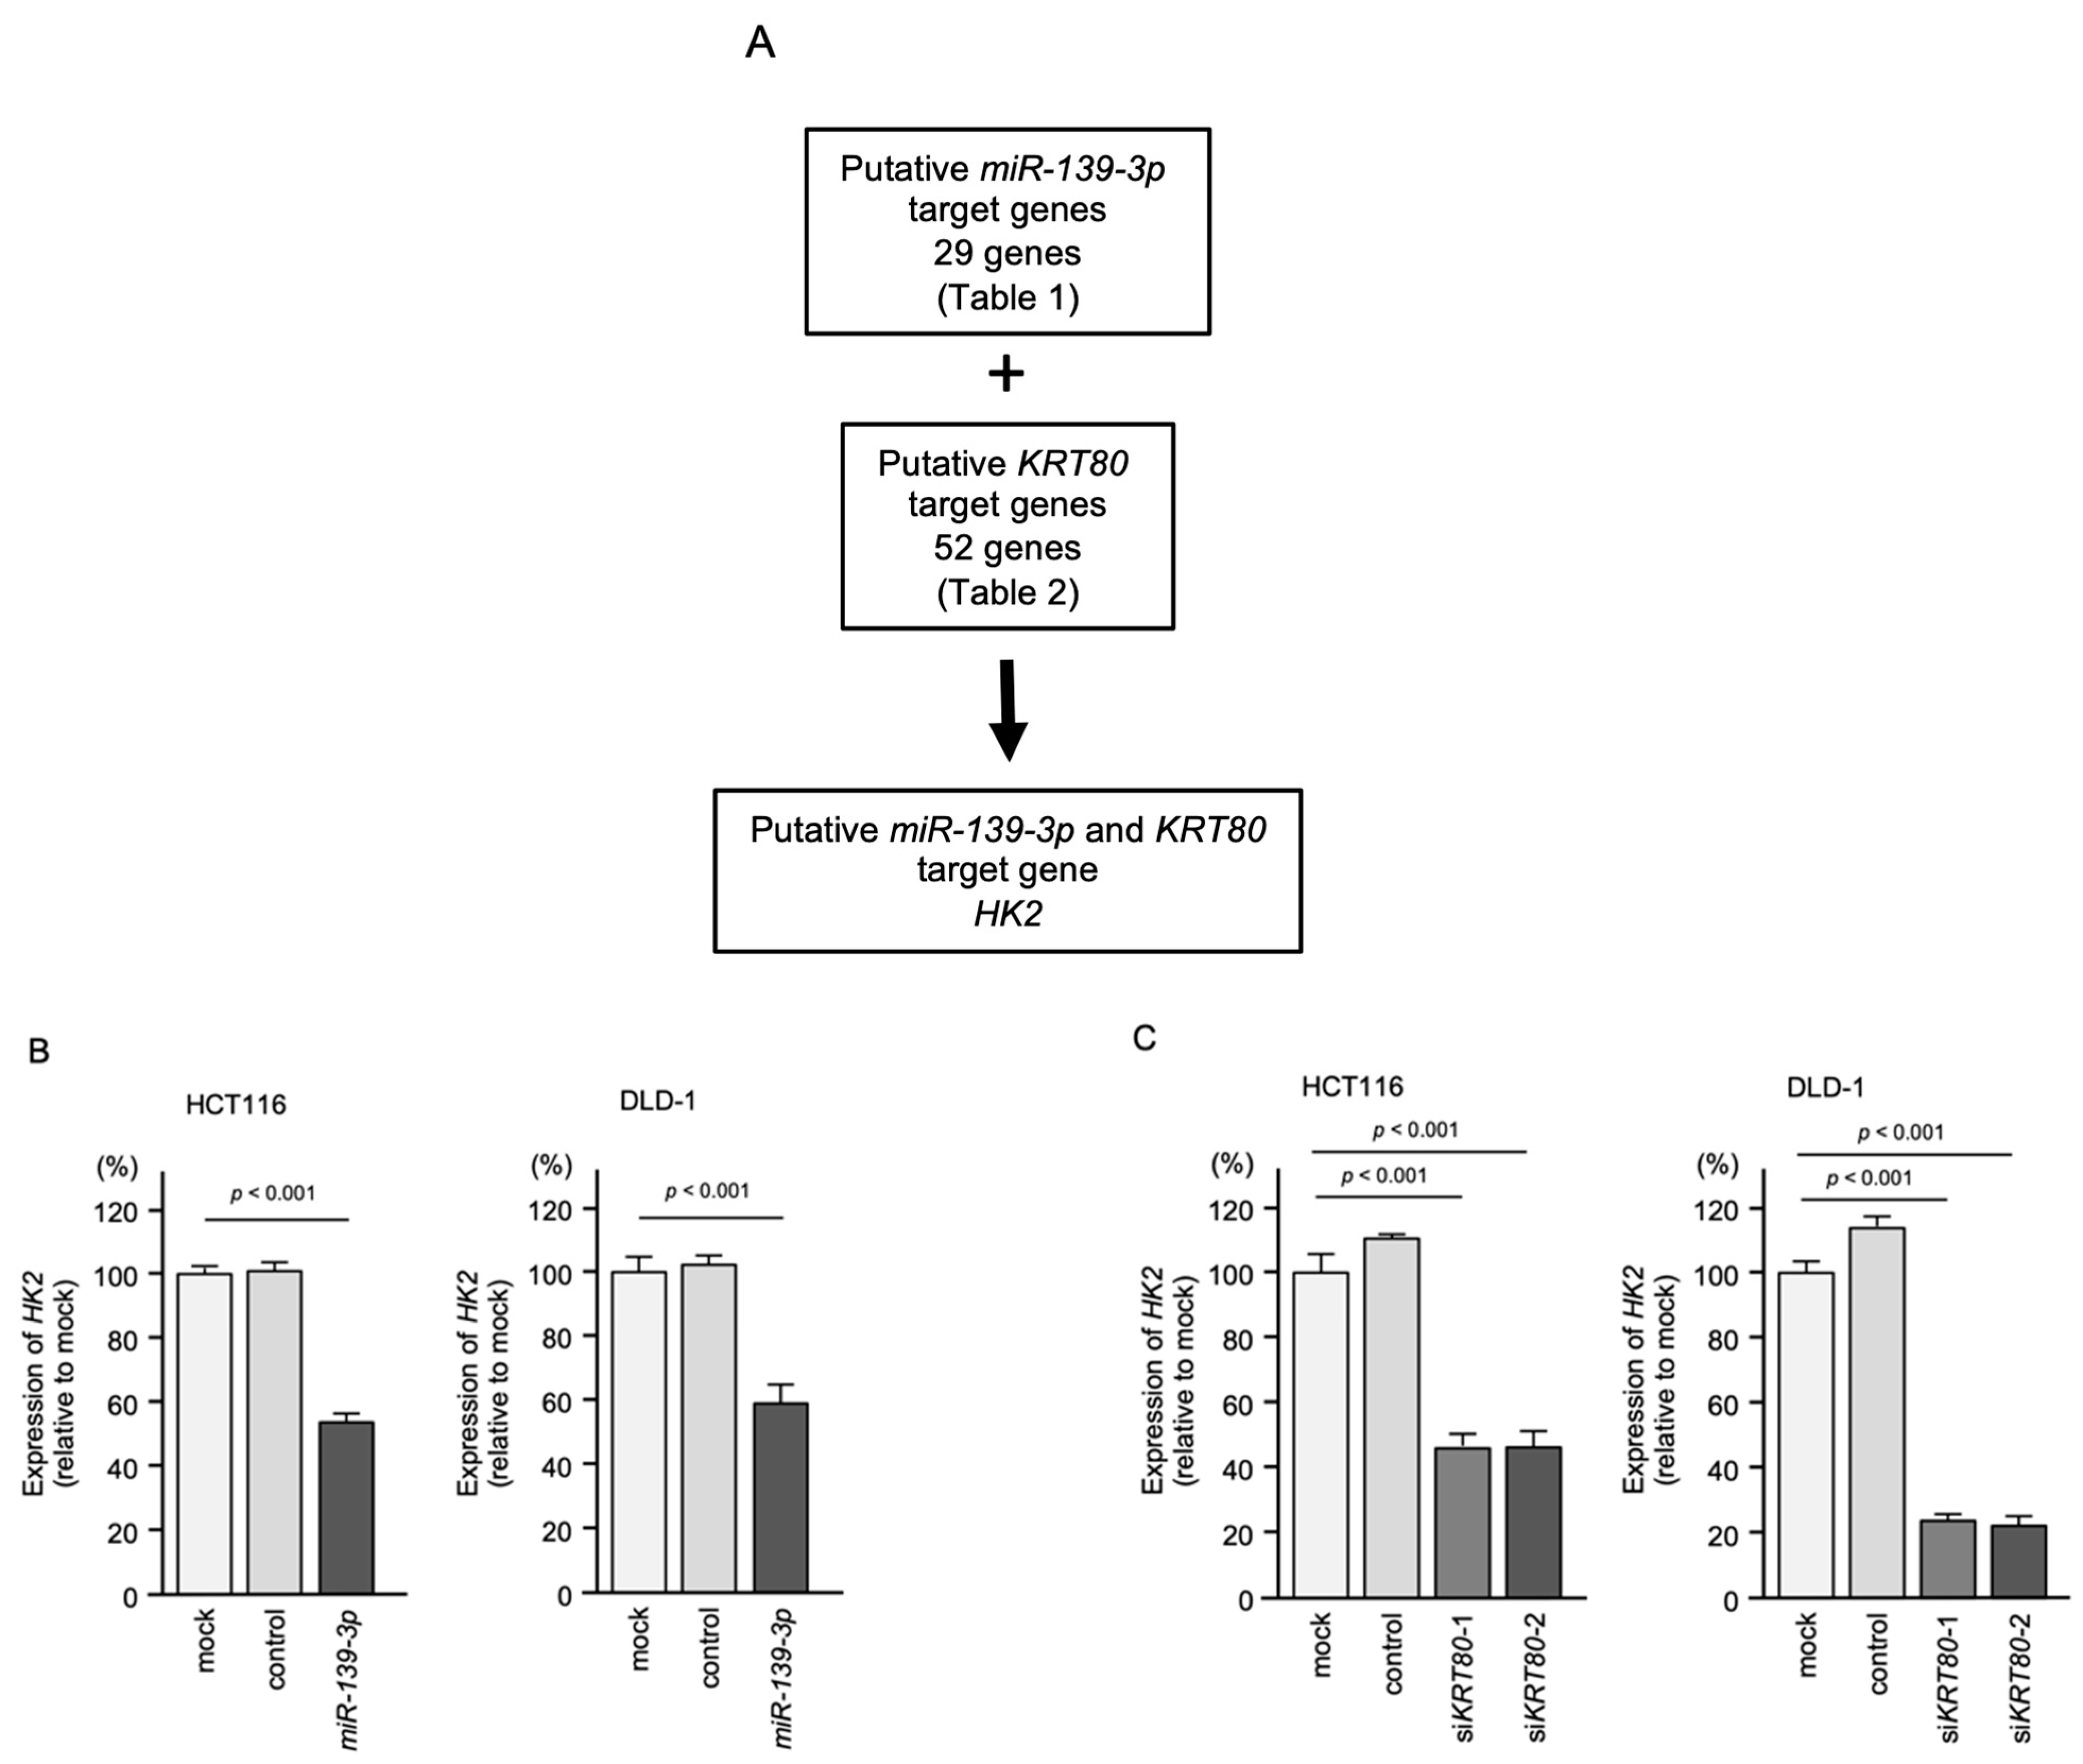
2.7. KRT80-Mediated RNA Networks in CRC Cells

To explore KRT80-regulated RNA networks in CRC, we performed comprehensive gene expression analyses in KRT80-knockdown CRC cells. A total of 52 genes were identified as downregulated in both KRT80-knockdown CRC cell lines (log2 fold change < −1.0: Table 2). Our expression data were deposited in the GEO database (GEO accession number: GSE208785).
In this study, we focused on hexokinase 2 (HK2) because it was identified as a miR-139-3p target in CRC cells (Table 1). HK2 was commonly regulated by miR-139-3p and KRT80 in CRC cells (Figure 7A). Moreover, HK2 was directly regulated by miR-139-3p in CRC cells, by RIP assay and dual luciferase reporter assay (Figure S6). In addition, HK2 expression was upregulated in CRC tissues (Figure S3), and a vast number of studies showed that aberrant expression of HK2 enhances cancer cell malignant transformation in various types of cancers. Our results showed that HK2 expression was reduced in cells transfected with siKRT80 (Figure 7B) or miR-139-3p (Figure 7C).

2.8. Expression of Target Genes in Clinical Specimens and Correlation

In the analysis using surgical specimens (27 paired normal and cancerous tissues), we observed marked suppression of miR-139-3p and marked upregulation of KRT80 in cancer tissues (Figure 1C and Figure S7A). In addition, a negative correlation was observed between the expression of miR-139-3p and KRT80 in CRC specimens (Figure S7B). Contrary to the TCGA data analysis, we did not find any significant upregulation of HK2 in our cancerous samples.

3. Discussion

Because CRC is a heterogeneous disease, as indicated by our genome-wide transcriptome analysis, it is necessary to search for diagnostic markers and therapeutic target molecules in an individualized manner. Recently, we determined the miRNA expression signature of CRC using RNA sequencing [17]. In that study, we found that miR-490-3p acted as a tumor-suppressive miRNA in CRC cells, and expression of its gene targets (IRAK1, FUT1, and GPRIN2) was significantly predictive of 5-year overall survival in CRC patients [17]. This new miRNA expression signature of CRC will be a useful tool for elucidating the molecular pathogenesis of this disease.
Aberrant expression of miRNAs is frequently observed in several types of cancers [14,15,16]. A vast number of studies showed that epigenetic modification (histone modifications and promoter DNA methylation) is closely involved in the silencing of miRNAs expression in cancer cells [23,24,25,26]. A recent study showed that miR-139 was epigenetically silenced by histone H3 lysine 27 trimethylation (H3K27me3) in lung cancer cells [25]. Our present data (TSA and 5-aza-dC treatment) showed that both events of histone deacetylation and DNA methylation were closely involved in the silencing of miR-139-3p on CRC cells. It has been shown that miR-139-3p silencing plays a pivotal role in human oncogenesis.
Our recent studies revealed that some passenger strands of miRNAs are closely involved in the molecular pathogenesis of a wide range of human cancers, e.g., miR-30c-2-3p, miR-101-5p, miR-143-5p, and miR-145-3p [19,21,27,28]. Based on our CRC signature, we focused on miR-139-3p (the passenger strand derived from pre-miR-139) in this study. We have analyzed the passenger stand miR-139-3p in several types of cancers and found that it acts as a tumor-suppressive miRNA in bladder cancer, renal cell carcinoma, and head and neck squamous cell carcinoma by targeting several genes closely linked to cancer pathogenesis [29,30,31]. Here, the function of miR-139-3p in CRC cells was clarified and found to be consistent with previous reports. As we have discussed, our in vitro assays showed that miR-139-3p acted as a tumor suppressive miRNA in CRC cells. However, the endogenous expression levels of passenger strands of miRNAs are little, and the full picture of the functions of passenger strands of miRNAs in vivo remains unknown. In order to investigate the in vivo functions of miRNAs, it is essential to generate and analyze cells that constitutively express miRNAs or cells in which miRNA expression is completely knocked out.
Several oncogenic signaling pathways are activated in CRC cells, of which PI3K/AKT/mTOR signaling is frequently activated [32,33,34,35]. Therefore, inhibiting activation of this signaling pathway is an attractive strategy for CRC treatment [32,36,37,38]. The AKT serine/threonine kinase is activated by phosphatidylinositol-3 kinase (PI3K) or phosphoinositide-dependent kinases via phosphorylation of Thr308 or Ser473 in AKT and activated AKT phosphorylates various downstream protein substrates (e.g., mTOR, glycogen synthase kinase 3 beta, and forkhead box protein O1) [39]. Aberrant expression and activation of AKT have been observed in many types of cancers, including CRC [40]. Notably, ectopic expression of miR-139-3p inhibited the phosphorylation of AKT in CRC cells in this study.
Next, we searched for target genes regulated by miR-139-3p in CRC cells, particularly those involved in AKT phosphorylation. A unique feature of miRNAs is that they regulate different sets of genes depending on the cancer cell type.
We identified 29 genes as tumor-suppressive targets of miR-139-3p in CRC cells. Of these, we focused on KRT80 because its expression was significantly different between cancer and normal tissues. Ideally, a therapeutic target molecule for cancer is not expressed in normal cells. Expression levels of KRT80 in normal tissues were assessed using previous large-scale transcriptional analysis data [41]. Expression of KRT80 was detected in skin, esophagus, and salivary glands. In contrast, KRT80 was hardly expressed in other tissues (Figure S8).
We showed that aberrant expression of KRT80 enhanced the malignant phenotypes of cancer cells (i.e., proliferation, migration, and invasion). Interestingly, overexpression of KRT80 induced EMT-related genes and activated the AKT signaling through phosphorylation of AKT (Ser 473) [22]. Considering our present data and previous reports, it was strongly suggested that the miR-139-3p/KRT80/p-AKT axis influences the migration and invasive abilities of CRC cells. In ovarian cancer, overexpression of KRT80 induced the expression of genes related to epithelial–mesenchymal transition and activated both MEK and ERK [42]. In gastric cancer, overexpression of the circular RNA CircPIP5K1A induced expression of KRT80 and activated the PI3K/AKT pathway via miR-671-5p adsorption [43]. Moreover, KRT80 expression was significantly correlated with clinical parameters, such as lymph node metastasis and pathological stage, in CRC and ovarian cancer [22,42]. Together, these data suggest that KRT80 is a potential therapeutic target for CRC.
We also investigated genes affected by KRT80 in CRC cells. In CRC cells, the expression of several genes was suppressed after the knockdown of KRT80 expression. Among these genes, we focused on HK2. The four members of the HK family (HK1-4) in mammals catalyze the conversion of glucose to glucose-6-phosphate, and they are involved in the first and rate-limiting step of glycolysis [44,45,46]. Previous studies reported that Akt and HK2 are overexpressed in cancer cells and that there is a positive correlation between activation of the PI3K/Akt/mTORC1 pathway and HK2 expression [47,48,49]. These findings indicate that simultaneous inhibition of glycolysis and the AKT/mTOR signaling pathway is effective in suppressing the growth of cancer cells [50].

4. Materials and Methods

4.1. Clinical Specimens Used to Evaluate miR-139-5p and miR-139-3p Expression

Fifty-four clinical specimens (27 CRC tissues and 27 normal colon tissues) were used to evaluate the expression status of miR-139-5p/3p. All specimens used in this study were obtained by surgical resection at Kagoshima University Hospital between 2014 and 2017. Normal colon tissue was collected from adjacent sites to the specimen from which each CRC tissue sample was taken. All patients provided written informed consent for the use of their specimens. This study was conducted in accordance with the guidelines of the Declaration of Helsinki and was approved by the Ethics Committee of Kagoshima University (approval number 160038 (28–65); date of 19 March 2021). The clinical information was described in our previous study [17].

4.2. CRC Cell Lines and Cell Culture

Two CRC cell lines, HCT116 and DLD-1, were used in this study. HCT116 cells were obtained from the RIKEN Cell Bank (Tsukuba, Ibaraki, Japan), and DLD-1 cells were obtained from the Cell Resource Center for Biomedical Research Bank (Sendai, Miyagi, Japan). HCT116 was cultured in DMEM medium supplemented with 10% concentration of fetal bovine serum (FBS), and DLD-1 was cultured in RPMI-1640 medium, also supplemented with 10% concentration of fetal bovine serum (FBS).

4.3. RNA Extraction and Quantitative Real-Time Reverse-Transcription PCR (qRT-PCR)

The protocols used for RNA extraction and qRT-PCR were described in our previous studies [51,52]. In brief, Total RNA was isolated from cell lines using TRIzol reagent according to the manufacturer’s protocol. RNA samples were reverse transcribed using the High-Capacity cDNA Reverse Transcription Kit (Applied Biosystems, Waltham, MA, USA). qPCR was performed using PCR Master Mix (Applied Biosystems, Waltham, MA, USA) and Fast SYBR Gren Master Mix (Applied Biosystems, Waltham, MA, USA), StepOnePlus real-time PCR system (Applied Biosystems, Waltham, MA, USA). Gene expressions were quantified relatively by the delta-delta Ct method (used GUSB as internal control). TaqMan assays used in this study are summarized in Table S2. The sequences of primers for SYBR green assays are summarized in Table S3.

4.4. Regulation of miR-139-3p Expression by DNA Demethylation

Cells were treated with 5-Aza-2′-deoxycytidine (5-aza-dC; Wako, Osaka, Japan) at concentrations of 0.5, 1,2,5, and 10 μmol/L for 96 h. Cells were first cultured in growth medium; after 24 h of incubation, the medium was replaced with fresh medium containing 5-aza-dC or Dimethyl sulfoxide (DMSO, negative control), and cells were incubated for another 48 h; after 48 h of treatment, the medium was again replaced with fresh medium containing 5-aza-dC or DMSO and cells were cultured for additional 48 h. After 120 h treatment, total RNA was isolated. The expression levels of miR-139-3p were measured by qRT-PCR.

4.5. Regulation of miR-139-3p Expression by Histone Deacetylation

Cells were treated with Tricostatin A (TSA; Wako, Osaka, Japan) at 0.1 or 0.5 μmol/L concentration for 24 h. Cells were first grown in growth medium. After 24 h of incubation, the medium was replaced with fresh medium containing TSA or DMSO and the cells were incubated for an additional 24 h. After 48 h treatment, total RNA was isolated. Expression levels of miR-139-3p were measured by qRT-PCR.

4.6. Transfection of miRNAs and siRNAs into CRC Cells

The protocols used for transient transfection of miRNAs and siRNAs were described in our previous studies [51,52]. The miRNA precursors and siRNAs used in this report were detailed in Table S2. Opti-MEM (Gibco, Carlsbad, CA, USA) and LipofectamineTM RNAiMax Transfection Reagent (Invitrogen, Waltham, MA, USA) were used for miRNA and siRNA transfection of miRNAs and siRNAs into CRC cell lines. All miRNA precursors and siRNAs were transfected into the CRC cell line at 10 nM. Mock transfection consisted of cells without precursors or siRNAs. Control groups were transfected with the negative control precursor.

4.7. Functional Analyses (Tumor Suppression and Promotion Assays) in CRC Cell Lines

The tumor-suppressive functions of miRNAs were evaluated by transient transfection assays using mature miR-139-5p and miR-139-3p. The tumor-promoting functions of KRT80 (loss-of-function assays) were assessed by siRNA transfection assays using siRNAs targeting KRT80. Functional assays (proliferation, migration, and invasion assays) were performed according to procedures of previous studies [51,52]. Briefly, for proliferation assays, HCT116 or DLD-1 cells were transferred into 96-well plates at 3.0 × 10³ cells/well. Cell proliferation was assessed using XTT assay kit II (Sigma-Aldrich, St. Louis, MO, USA) 72 h after the transfection procedure. For the migration and invasion assay, HCT116 and DLD-1 cells were transfected in 6-well plates at 3.0 × 10⁵ cells/well; 48 h later, transfected HCT116 and DLD-1 cells were added to each chamber at 1.0 × 10⁵ cells/well. Corning BioCoatTM cell culture chambers (Corning, Corning, NY, USA) were used for the migration assay and Corning BioCoat Matrigel Invasion Chambers were used for the invasion assay. cells on the underside of the chamber membrane were stained and counted for analysis. All experiments were performed in triplicate. The details of the reagents used in these analyses are listed in Table S2.

4.8. Identification of Putative Targets Regulated by miR-139-3p in CRC Cells

To identify oncogenic targets controlled by miR-139-3p in CRC cells, data were merged from the following sources to narrow down the targets: (1) Target Scan Human 8.0 database (http://www.targetscan.org/vert_80, accessed on 6 August 2021) [53], (2) gene expression data from miR-139-3p transfected CRC cells (GEO accession number, GSE155659), and (3) gene expression database from CRC clinical tissues using the GEPIA2 platform (http://gepia2.cancer-pku.cn/#index; accessed on 10 April 2022) [54].

4.9. RIP Assay

The assay for RIP was performed according to previous studies [55]. Briefly, CRC cells were cultured in 6-well dish at 3.0 × 10⁵/well concentration. Negative control miRNA precursors and miR-139-3p precursors were transfected. After 12 h, immunoprecipitation was performed using the MagCaptureTM microRNA Isolation Kit, Human Ago2, obtained from FUJIFILM Wako Pure Chemical Corporation (Wako, Osaka, Japan) according to the manufacturer’s protocol. Expression levels of KRT80 and HK2 bound to Ago2 were measured by qRT-PCR. TaqMan assays used in this study are summarized in Table S2. The sequences of primers for SYBR green assays are summarized in Table S3.

4.10. Dual-Luciferase Reporter Assay

The dual-luciferase reporter assay was performed to determine whether miR-139-3p binds directly to the 3′-UTR of KRT80. A partial wild-type sequence, including the seed sequence, of the KRT80 3′-UTR, was inserted into the psiCHECK-2 vector (C8021; Promega, Madison, WI, USA). Alternatively, the same KRT80 3′-UTR sequence but with the miR-139-3p binding site deleted was also inserted into the same vector to create the deletion-type construct. The design of each vector cloning sequence into wild-type and deletion-type were shown in Figures S9 and S10 mRNA sequences of KRT80 and HK2 were cited from National Center for Biotechnology Information database [56]. The dual-luciferase reporter assay was performed according to previous studies [17,52]. The reagents used in the assay are listed in Table S2.

4.11. Western Blot and Immunohistochemical Analyses

The procedures for Western blot and immunohistochemical analyses were performed according to our previous studies [51,52]. In brief, 72 h after transfection, cells were collected, and lysates were prepared. Next, 18 μg/lane of protein lysate was separated on e-PAGEL (ATTO, Tokyo, Japan), transferred to PVDF membranes, and incubated with primary antibody overnight at 4 °C and with secondary antibody for 1 h at room temperature. GAPDH was used as an internal control. The antibodies used are listed in Table S2, and the clinical specimens evaluated by immunohistochemistry are shown in Table S4.

4.12. Statistical Analyses

JMP Pro 15 (SAS Institute Inc., Cary, NC, USA) was used for the statistical analyses. Differences between two groups were assessed using Welch’s t-test and those among multiple groups using Dunnett’s test. Spearman’s test was used for the correlation analyses. A p-value less than 0.05 was considered statistically significant.

5. Conclusions

Based on the miRNA expression signature of CRC obtained by RNA sequencing, the expression of miR-139-3p (the passenger strand) was significantly reduced in CRC tissues. Functional assays revealed that expression of miR-139-3p attenuated cancer cell malignant phenotypes, indicating that miR-139-3p acts as a tumor suppressor in CRC cells. KRT80 was identified as a direct target of miR-139-3p, and aberrant expression of KRT80 was confirmed in CRC clinical specimens. Moreover, HK2 expression was regulated by both miR-139-3p and KRT80 in CRC cells. Exploration of miRNA-regulated molecular networks provides important information for identifying therapeutic targets for CRC.

Supplementary Materials

The following are available online at www.mdpi.com/article/10.3390/ijms231911616/s1.

Author Contributions

Conceptualization, R.Y. and N.S.; data curation, R.Y., Y.H. and Y.K.; formal analysis, R.Y. and Y.H.; funding acquisition, N.S., Y.H., T.I., Y.K. and T.O.; investigation, R.Y., Y.H., M.W. and K.T.; methodology, N.S.; project administration, N.S.; resources, T.I., Y.K. and T.O.; supervision, T.O.; validation, S.A. and Y.G.; visualization, R.Y. and Y.K.; writing—original draft preparation, R.Y. and Y.K.; writing—review and editing, S.M. and N.S. All authors have read and agreed to the published version of the manuscript.

Funding

The present study was supported by KAKENHI Grant Number 20H03753, 21K08783, 21K09577, 21K15597, 21K16426, and 22K16514.

Institutional Review Board Statement

The study was conducted according to the guidelines of the Declaration of Helsinki and approved by the Ethics Committee of Kagoshima University (approval no. 160038 28-65, date of approval: 19 March 2021).

Informed Consent Statement

Written prior informed consent and approval were obtained from all patients who were diagnosed with CRC and resected at Kagoshima University Hospital.

Data Availability Statement

The data presented in this study are available on request from the corresponding author.

Conflicts of Interest

The authors declare no conflict of interest.

References

  1. Sung, H.; Ferlay, J.; Siegel, R.L.; Laversanne, M.; Soerjomataram, I.; Jemal, A.; Bray, F. Global Cancer Statistics 2020: GLOBOCAN Estimates of Incidence and Mortality Worldwide for 36 Cancers in 185 Countries. CA Cancer J. Clin. 2021, 71, 209–249. [Google Scholar] [CrossRef] [PubMed]
  2. Siegel, R.L.; Miller, K.D.; Goding Sauer, A.; Fedewa, S.A.; Butterly, L.F.; Anderson, J.C.; Cercek, A.; Smith, R.A.; Jemal, A. Colorectal cancer statistics, 2020. CA Cancer J. Clin. 2020, 70, 145–164. [Google Scholar] [CrossRef] [Green Version]
  3. Valderrama-Treviño, A.I.; Barrera-Mera, B.; Ceballos-Villalva, J.C.; Montalvo-Javé, E.E. Hepatic Metastasis from Colorectal Cancer. Euroasian J. Hepato-Gastroenterol. 2017, 7, 166–175. [Google Scholar] [CrossRef] [PubMed]
  4. The Cancer Genome Atlas Network. Comprehensive molecular characterization of human colon and rectal cancer. Nature 2012, 487, 330–337. [Google Scholar] [CrossRef] [PubMed] [Green Version]
  5. Grady, W.M.; Markowitz, S.D. The molecular pathogenesis of colorectal cancer and its potential application to colorectal cancer screening. Dig. Dis. Sci. 2015, 60, 762–772. [Google Scholar] [CrossRef] [Green Version]
  6. Leslie, A.; Carey, F.A.; Pratt, N.R.; Steele, R.J. The colorectal adenoma-carcinoma sequence. Br. J. Surg. 2002, 89, 845–860. [Google Scholar] [CrossRef] [PubMed] [Green Version]
  7. Guinney, J.; Dienstmann, R.; Wang, X.; De Reyniès, A.; Schlicker, A.; Soneson, C.; Marisa, L.; Roepman, P.; Nyamundanda, G.; Angelino, P.; et al. The consensus molecular subtypes of colorectal cancer. Nat. Med. 2015, 21, 1350–1356. [Google Scholar] [CrossRef] [PubMed]
  8. Anfossi, S.; Babayan, A.; Pantel, K.; Calin, G.A. Clinical utility of circulating non-coding RNAs—An update. Nat. Rev. Clin. Oncol. 2018, 15, 541–563. [Google Scholar] [CrossRef]
  9. Esteller, M. Non-coding RNAs in human disease. Nat. Rev. Genet. 2011, 12, 861–874. [Google Scholar] [CrossRef]
  10. Panni, S.; Lovering, R.C.; Porras, P.; Orchard, S. Non-coding RNA regulatory networks. Biochim. Biophys. Acta Gene Regul. Mech. 2020, 1863, 194417. [Google Scholar] [CrossRef]
  11. Anastasiadou, E.; Jacob, L.S.; Slack, F.J. Non-coding RNA networks in cancer. Nat. Rev. Cancer 2018, 18, 5–18. [Google Scholar] [CrossRef]
  12. Ha, M.; Kim, V.N. Regulation of microRNA biogenesis. Nat. Rev. Mol. Cell Biol. 2014, 15, 509–524. [Google Scholar] [CrossRef]
  13. He, L.; Hannon, G.J. MicroRNAs: Small RNAs with a big role in gene regulation. Nat. Rev. Genet. 2004, 5, 522–531. [Google Scholar] [CrossRef]
  14. Ding, L.; Lan, Z.; Xiong, X.; Ao, H.; Feng, Y.; Gu, H.; Yu, M.; Cui, Q. The Dual Role of MicroRNAs in Colorectal Cancer Progression. Int. J. Mol. Sci. 2018, 19, 2791. [Google Scholar] [CrossRef] [Green Version]
  15. Schetter, A.J.; Okayama, H.; Harris, C.C. The role of microRNAs in colorectal cancer. Cancer J. 2012, 18, 244–252. [Google Scholar] [CrossRef] [Green Version]
  16. Xie, N.; Meng, Q.; Zhang, Y.; Luo, Z.; Xue, F.; Liu, S.; Li, Y.; Huang, Y. MicroRNA-142-3p suppresses cell proliferation, invasion and epithelial-to-mesenchymal transition via RAC1-ERK1/2 signaling in colorectal cancer. Mol. Med. Rep. 2021, 24, 568. [Google Scholar] [CrossRef]
  17. Hozaka, Y.; Kita, Y.; Yasudome, R.; Tanaka, T.; Wada, M.; Idichi, T.; Tanabe, K.; Asai, S.; Moriya, S.; Toda, H.; et al. RNA-Sequencing Based microRNA Expression Signature of Colorectal Cancer: The Impact of Oncogenic Targets Regulated by miR-490-3p. Int. J. Mol. Sci. 2021, 22, 9876. [Google Scholar] [CrossRef]
  18. Shimomura, H.; Okada, R.; Tanaka, T.; Hozaka, Y.; Wada, M.; Moriya, S.; Idichi, T.; Kita, Y.; Kurahara, H.; Ohtsuka, T.; et al. Role of miR-30a-3p Regulation of Oncogenic Targets in Pancreatic Ductal Adenocarcinoma Pathogenesis. Int. J. Mol. Sci. 2020, 21, 6459. [Google Scholar] [CrossRef]
  19. Shimonosono, M.; Idichi, T.; Seki, N.; Yamada, Y.; Arai, T.; Arigami, T.; Sasaki, K.; Omoto, I.; Uchikado, Y.; Kita, Y.; et al. Molecular pathogenesis of esophageal squamous cell carcinoma: Identification of the antitumor effects of miR1453p on gene regulation. Int. J. Oncol. 2019, 54, 673–688. [Google Scholar] [CrossRef] [PubMed] [Green Version]
  20. Shinden, Y.; Hirashima, T.; Nohata, N.; Toda, H.; Okada, R.; Asai, S.; Tanaka, T.; Hozaka, Y.; Ohtsuka, T.; Kijima, Y.; et al. Molecular pathogenesis of breast cancer: Impact of miR-99a-5p and miR-99a-3p regulation on oncogenic genes. J. Hum. Genet. 2021, 66, 519–534. [Google Scholar] [CrossRef]
  21. Wada, M.; Goto, Y.; Tanaka, T.; Okada, R.; Moriya, S.; Idichi, T.; Noda, M.; Sasaki, K.; Kita, Y.; Kurahara, H.; et al. RNA sequencing-based microRNA expression signature in esophageal squamous cell carcinoma: Oncogenic targets by antitumor miR-143-5p and miR-143-3p regulation. J. Hum. Genet. 2020, 65, 1019–1034. [Google Scholar] [CrossRef] [PubMed]
  22. Li, C.; Liu, X.; Liu, Y.; Liu, X.; Wang, R.; Liao, J.; Wu, S.; Fan, J.; Peng, Z.; Li, B.; et al. Keratin 80 promotes migration and invasion of colorectal carcinoma by interacting with PRKDC via activating the AKT pathway. Cell Death Dis. 2018, 9, 1009. [Google Scholar] [CrossRef] [Green Version]
  23. Mossman, D.; Kim, K.T.; Scott, R.J. Demethylation by 5-aza-2′-deoxycytidine in colorectal cancer cells targets genomic DNA whilst promoter CpG island methylation persists. BMC Cancer 2010, 10, 366. [Google Scholar] [CrossRef] [Green Version]
  24. Wang, X.; Gao, H.; Ren, L.; Gu, J.; Zhang, Y.; Zhang, Y. Demethylation of the miR-146a promoter by 5-Aza-2′-deoxycytidine correlates with delayed progression of castration-resistant prostate cancer. BMC Cancer 2014, 14, 308. [Google Scholar] [CrossRef] [PubMed] [Green Version]
  25. Watanabe, K.; Amano, Y.; Ishikawa, R.; Sunohara, M.; Kage, H.; Ichinose, J.; Sano, A.; Nakajima, J.; Fukayama, M.; Yatomi, Y.; et al. Histone methylation-mediated silencing of miR-139 enhances invasion of non-small-cell lung cancer. Cancer Med. 2015, 4, 1573–1582. [Google Scholar] [CrossRef] [Green Version]
  26. Desjobert, C.; Carrier, A.; Delmas, A.; Marzese, D.M.; Daunay, A.; Busato, F.; Pillon, A.; Tost, J.; Riond, J.; Favre, G.; et al. Demethylation by low-dose 5-aza-2′-deoxycytidine impairs 3D melanoma invasion partially through miR-199a-3p expression revealing the role of this miR in melanoma. Clin. Epigenet. 2019, 11, 9. [Google Scholar] [CrossRef] [PubMed]
  27. Tanaka, T.; Okada, R.; Hozaka, Y.; Wada, M.; Moriya, S.; Satake, S.; Idichi, T.; Kurahara, H.; Ohtsuka, T.; Seki, N. Molecular Pathogenesis of Pancreatic Ductal Adenocarcinoma: Impact of miR-30c-5p and miR-30c-2-3p Regulation on Oncogenic Genes. Cancers 2020, 12, 2731. [Google Scholar] [CrossRef]
  28. Toda, H.; Seki, N.; Kurozumi, S.; Shinden, Y.; Yamada, Y.; Nohata, N.; Moriya, S.; Idichi, T.; Maemura, K.; Fujii, T.; et al. RNA-sequence-based microRNA expression signature in breast cancer: Tumor-Suppressive miR-101-5p regulates molecular pathogenesis. Mol. Oncol. 2020, 14, 426–446. [Google Scholar] [CrossRef] [Green Version]
  29. Koma, A.; Asai, S.; Minemura, C.; Oshima, S.; Kinoshita, T.; Kikkawa, N.; Koshizuka, K.; Moriya, S.; Kasamatsu, A.; Hanazawa, T.; et al. Impact of Oncogenic Targets by Tumor-Suppressive miR-139-5p and miR-139-3p Regulation in Head and Neck Squamous Cell Carcinoma. Int. J. Mol. Sci. 2021, 22, 9947. [Google Scholar] [CrossRef]
  30. Okada, R.; Goto, Y.; Yamada, Y.; Kato, M.; Asai, S.; Moriya, S.; Ichikawa, T.; Seki, N. Regulation of Oncogenic Targets by the Tumor-Suppressive miR-139 Duplex (miR-139-5p and miR-139-3p) in Renal Cell Carcinoma. Biomedicines 2020, 8, 599. [Google Scholar] [CrossRef]
  31. Yonemori, M.; Seki, N.; Yoshino, H.; Matsushita, R.; Miyamoto, K.; Nakagawa, M.; Enokida, H. Dual tumor-suppressors miR-139-5p and miR-139-3p targeting matrix metalloprotease 11 in bladder cancer. Cancer Sci. 2016, 107, 1233–1242. [Google Scholar] [CrossRef] [Green Version]
  32. Kim, A.; Lee, J.E.; Lee, S.S.; Kim, C.; Lee, S.J.; Jang, W.S.; Park, S. Coexistent mutations of KRAS and PIK3CA affect the efficacy of NVP-BEZ235, a dual PI3K/MTOR inhibitor, in regulating the PI3K/MTOR pathway in colorectal cancer. Int. J. Cancer 2013, 133, 984–996. [Google Scholar] [CrossRef]
  33. Lee, J.; Hong, H.K.; Peng, S.B.; Kim, T.W.; Lee, W.Y.; Yun, S.H.; Kim, H.C.; Liu, J.; Ebert, P.J.; Aggarwal, A.; et al. Identifying metastasis-initiating miRNA-target regulations of colorectal cancer from expressional changes in primary tumors. Sci. Rep. 2020, 10, 14919. [Google Scholar] [CrossRef]
  34. Sanchez-Vega, F.; Mina, M.; Armenia, J.; Chatila, W.K.; Luna, A.; La, K.C.; Dimitriadoy, S.; Liu, D.L.; Kantheti, H.S.; Saghafinia, S.; et al. Oncogenic Signaling Pathways in The Cancer Genome Atlas. Cell 2018, 173, 321–337.e310. [Google Scholar] [CrossRef] [Green Version]
  35. Stefani, C.; Miricescu, D.; Stanescu, S., II; Nica, R.I.; Greabu, M.; Totan, A.R.; Jinga, M. Growth Factors, PI3K/AKT/mTOR and MAPK Signaling Pathways in Colorectal Cancer Pathogenesis: Where Are We Now? Int. J. Mol. Sci. 2021, 22, 10260. [Google Scholar] [CrossRef]
  36. Canavese, M.; Ngo, D.T.; Maddern, G.J.; Hardingham, J.E.; Price, T.J.; Hauben, E. Biology and therapeutic implications of VEGF-A splice isoforms and single-nucleotide polymorphisms in colorectal cancer. Int. J. Cancer 2017, 140, 2183–2191. [Google Scholar] [CrossRef] [Green Version]
  37. Napolitano, S.; Matrone, N.; Muddassir, A.L.; Martini, G.; Sorokin, A.; De Falco, V.; Giunta, E.F.; Ciardiello, D.; Martinelli, E.; Belli, V.; et al. Triple blockade of EGFR, MEK and PD-L1 has antitumor activity in colorectal cancer models with constitutive activation of MAPK signaling and PD-L1 overexpression. J. Exp. Clin. Cancer Res. 2019, 38, 492. [Google Scholar] [CrossRef] [Green Version]
  38. Therkildsen, C.; Bergmann, T.K.; Henrichsen-Schnack, T.; Ladelund, S.; Nilbert, M. The predictive value of KRAS, NRAS, BRAF, PIK3CA and PTEN for anti-EGFR treatment in metastatic colorectal cancer: A systematic review and meta-analysis. Acta Oncol. 2014, 53, 852–864. [Google Scholar] [CrossRef] [Green Version]
  39. Moafian, Z.; Maghrouni, A.; Soltani, A.; Hashemy, S.I. Cross-talk between non-coding RNAs and PI3K/AKT/mTOR pathway in colorectal cancer. Mol. Biol. Rep. 2021, 48, 4797–4811. [Google Scholar] [CrossRef]
  40. Song, M.; Bode, A.M.; Dong, Z.; Lee, M.H. AKT as a Therapeutic Target for Cancer. Cancer Res. 2019, 79, 1019–1031. [Google Scholar] [CrossRef] [Green Version]
  41. Fagerberg, L.; Hallstrom, B.M.; Oksvold, P.; Kampf, C.; Djureinovic, D.; Odeberg, J.; Habuka, M.; Tahmasebpoor, S.; Danielsson, A.; Edlund, K.; et al. Analysis of the human tissue-specific expression by genome-wide integration of transcriptomics and antibody-based proteomics. Mol. Cell Proteom. 2014, 13, 397–406. [Google Scholar] [CrossRef] [PubMed] [Green Version]
  42. Liu, O.; Wang, C.; Wang, S.; Hu, Y.; Gou, R.; Dong, H.; Li, S.; Li, X.; Lin, B. Keratin 80 regulated by miR-206/ETS1 promotes tumor progression via the MEK/ERK pathway in ovarian cancer. J. Cancer 2021, 12, 6835–6850. [Google Scholar] [CrossRef] [PubMed]
  43. Song, H.; Xu, Y.; Xu, T.; Fan, R.; Jiang, T.; Cao, M.; Shi, L.; Song, J. CircPIP5K1A activates KRT80 and PI3K/AKT pathway to promote gastric cancer development through sponging miR-671-5p. Biomed. Pharmacother. 2020, 126, 109941. [Google Scholar] [CrossRef] [PubMed]
  44. John, S.; Weiss, J.N.; Ribalet, B. Subcellular localization of hexokinases I and II directs the metabolic fate of glucose. PLoS ONE 2011, 6, e17674. [Google Scholar] [CrossRef] [Green Version]
  45. Mathupala, S.P.; Ko, Y.H.; Pedersen, P.L. Hexokinase II: Cancer’s double-edged sword acting as both facilitator and gatekeeper of malignancy when bound to mitochondria. Oncogene 2006, 25, 4777–4786. [Google Scholar] [CrossRef] [Green Version]
  46. Roberts, D.J.; Tan-Sah, V.P.; Smith, J.M.; Miyamoto, S. Akt phosphorylates HK-II at Thr-473 and increases mitochondrial HK-II association to protect cardiomyocytes. J. Biol. Chem. 2013, 288, 23798–23806. [Google Scholar] [CrossRef] [Green Version]
  47. Bhaskar, P.T.; Nogueira, V.; Patra, K.C.; Jeon, S.M.; Park, Y.; Robey, R.B.; Hay, N. mTORC1 hyperactivity inhibits serum deprivation-induced apoptosis via increased hexokinase II and GLUT1 expression, sustained Mcl-1 expression, and glycogen synthase kinase 3beta inhibition. Mol. Cell Biol. 2009, 29, 5136–5147. [Google Scholar] [CrossRef] [Green Version]
  48. Franke, T.F.; Yang, S.I.; Chan, T.O.; Datta, K.; Kazlauskas, A.; Morrison, D.K.; Kaplan, D.R.; Tsichlis, P.N. The protein kinase encoded by the Akt proto-oncogene is a target of the PDGF-activated phosphatidylinositol 3-kinase. Cell 1995, 81, 727–736. [Google Scholar] [CrossRef] [Green Version]
  49. Robey, R.B.; Hay, N. Mitochondrial hexokinases, novel mediators of the antiapoptotic effects of growth factors and Akt. Oncogene 2006, 25, 4683–4696. [Google Scholar] [CrossRef] [Green Version]
  50. Pusapati, R.V.; Daemen, A.; Wilson, C.; Sandoval, W.; Gao, M.; Haley, B.; Baudy, A.R.; Hatzivassiliou, G.; Evangelista, M.; Settleman, J. mTORC1-Dependent Metabolic Reprogramming Underlies Escape from Glycolysis Addiction in Cancer Cells. Cancer Cell 2016, 29, 548–562. [Google Scholar] [CrossRef] [Green Version]
  51. Idichi, T.; Seki, N.; Kurahara, H.; Fukuhisa, H.; Toda, H.; Shimonosono, M.; Yamada, Y.; Arai, T.; Kita, Y.; Kijima, Y.; et al. Involvement of anti-tumor miR-124-3p and its targets in the pathogenesis of pancreatic ductal adenocarcinoma: Direct regulation of ITGA3 and ITGB1 by miR-124-3p. Oncotarget 2018, 9, 28849–28865. [Google Scholar] [CrossRef] [PubMed] [Green Version]
  52. Yonemori, K.; Seki, N.; Idichi, T.; Kurahara, H.; Osako, Y.; Koshizuka, K.; Arai, T.; Okato, A.; Kita, Y.; Arigami, T.; et al. The microRNA expression signature of pancreatic ductal adenocarcinoma by RNA sequencing: Anti-Tumour functions of the microRNA-216 cluster. Oncotarget 2017, 8, 70097–70115. [Google Scholar] [CrossRef] [PubMed] [Green Version]
  53. Agarwal, V.; Bell, G.W.; Nam, J.W.; Bartel, D.P. Predicting effective microRNA target sites in mammalian mRNAs. eLife 2015, 4, e05005. [Google Scholar] [CrossRef] [PubMed]
  54. Tang, Z.; Kang, B.; Li, C.; Chen, T.; Zhang, Z. GEPIA2: An enhanced web server for large-scale expression profiling and interactive analysis. Nucleic Acids Res. 2019, 47, W556–W560. [Google Scholar] [CrossRef] [Green Version]
  55. Minemura, C.; Asai, S.; Koma, A.; Kikkawa, N.; Kato, M.; Kasamatsu, A.; Uzawa, K.; Hanazawa, T.; Seki, N. Identification of Antitumor miR-30e-5p Controlled Genes; Diagnostic and Prognostic Biomarkers for Head and Neck Squamous Cell Carcinoma. Genes 2022, 13, 1225. [Google Scholar] [CrossRef]
  56. Sayers, E.W.; Beck, J.; Bolton, E.E.; Bourexis, D.; Brister, J.R.; Canese, K.; Comeau, D.C.; Funk, K.; Kim, S.; Klimke, W.; et al. Database resources of the National Center for Biotechnology Information. Nucleic Acids Res. 2021, 49, D10–D17. [Google Scholar] [CrossRef]
Figure 1. Expression of miR-139-5p and miR-139-3p in CRC clinical specimens. (A) Volcano plot of the miRNA expression signature based on miRNA sequencing (GEO accession number: GSE183437). The log2 fold-change (FC) is plotted on the x-axis and the log10 p-value on the y-axis. The blue points represent the downregulated miRNAs with log2 FC < −2.0 and p < 0.05. The red points represent the upregulated miRNAs with log2 FC > 2.0 and p < 0.05. Downregulated expressions of miR-139-5p and miR-139-3p are plotted. (B) Chromosomal location of pre-miR-139 in the human genome. The mature sequences of miR-139-5p (the guide sequence) and miR-139-3p (the passenger strand) are shown. (C) Expression levels of miR-139-5p and miR-139-3p validated in CRC clinical specimens and CRC cell lines (HCT116 and DLD-1). The expression of both miRNAs was significantly downregulated in cancer tissues (p < 0.001). (D) Spearman’s rank test showed positive correlations between miR-139-5p and miR-139-3p expression levels in clinical specimens (r = 0.559, p < 0.001).
Ijms 23 11616 g001
Figure 2. Tumor-suppressive functions of miR-139-5p and miR-139-3p in CRC cells (HCT116 and DLD-1). (A) Cell proliferation assessed by XTT assay. At 72 h after transient transfection of miRNAs, cancer cell viability was analyzed. (B) Cell migration ability assessed using a membrane culture system. At 48 h after miRNA transfection, the cells were seeded into the migration chambers. (C) Cell invasion ability assessed by Matrigel invasion assay. At 48 h after miRNA transfection, the cells were seeded into the invasion chambers. (N.S.: not significant compared to mock group.).
Ijms 23 11616 g002
Figure 3. Search strategy for oncogenes regulated by miR-139-3p in CRC cells. To identify miR-139-3p targets in CRC cells, we assessed the TargetScan database and gene expression data from miR-139-3p-transfected HCT116 cells (GEO accession number: GSE155659). To evaluate genes upregulated in CRC clinical specimens, we used the GEPIA2 database. A total of 29 genes were identified as potential oncogenic targets regulated by miR-139-3p in CRC cells.
Ijms 23 11616 g003
Figure 4. Regulation of KRT80 expression by miR-139-3p in CRC cells. (A) Reduced mRNA and protein levels of KRT80 in miR-139-3p-transfected CRC cells. At 72 h after miR-139-3p transfection, the cells were subjected to real-time PCR and Western blot analyses. (B) RNA immunoprecipitation assay of RISC-incorporated KRT80 mRNA using an Ago2 antibody. Real-time PCR data indicated that KRT80 mRNA was incorporated into RISC. Schematic illustration showed miR-139-3p and KRT80 were incorporated into RISC. (C) TargetScan database analysis of the putative miR-139-3p binding site in the 3′UTR of KRT80. Dual-luciferase reporter assays showed reduced luminescence activity after co-transfection of the wild-type vector and miR-139-3p in HCT116 cells (left panel). Normalized data were calculated as the Renilla/Firefly luciferase activity ratio (N.S.: not significant compared with the mock group).
Ijms 23 11616 g004
Figure 5. Functional assays in CRC cells after siRNA-mediated KRT80 knockdown. (A) Cell proliferation assessed by XTT assay at 72 h after siRNA transfection. (B) Cell migration assessed using a membrane culture system at 48 h after seeding miRNA-transfected cells into the chambers. (C) Cell invasion assessed by Matrigel invasion assays at 48 h after seeding miRNA-transfected cells into the chambers. (D) Western blot analysis of AKT and phosphorylated AKT at 72 h after siKRT80 and miR-139-3p transfection.
Ijms 23 11616 g005
Figure 6. Immunohistochemical staining of KRT80 in CRC clinical specimens. Hematoxylin and eosin (HE) staining and KRT80 immunohistochemical staining in two colorectal cancer patients: (A) female aged 75 years with stage IV CRC, (B) male aged 82 years with stage IIIC CRC. The slides on the left show HE staining, and those on the right side show KRT80 immunohistochemical staining at 40× (upper) and 200× (lower) magnifications. KRT80 immunohistochemical staining showed that staining was confined to cancer tissues, with no staining in the stroma or mucus components.
Ijms 23 11616 g006
Figure 7. Regulation of HK2 expression by miR-139-3p and KRT80 in CRC cells. (A) Identification of genes commonly regulated by miR-139-3p and KRT80 in CRC cells. (B) Reduced expression of HK2 after miR-139-3p transfection in CRC cells (HCT116 and DLD-1). At 72 h after miRNA transfection, the cells were subjected to real-time PCR. (C) Reduced expression of HK2 after transfection of siRNAs targeting KRT80 in CRC cells (HCT116 and DLD-1). At 72 h after siRNA transfection, the cells were subjected to real-time PCR.
Ijms 23 11616 g007
Table 1. Candidate gene targets of miR-139-3p significantly overexpressed in CRC cells.
Entrez
Gene ID
Gene SymbolGene NameNo. of
Binding Sites
miR-139-3p-Transfected HCT116 Cells
log2 FC < −2
9768KIAA0101KIAA01012−3.773
6541SLC7A1Solute carrier family 7 (cationic amino acid transporter, y+ system), member 14−3.072
23094SIPA1L3Signal-induced proliferation-associated 1 like 32−2.961
79628SH3TC2SH3 domain and tetratricopeptide repeats 21−2.921
201232SLC16A13Solute carrier family 16, member 131−2.905
27286SRPX2Sushi-repeat containing protein, X-linked 21−2.901
118932ANKRD22Ankyrin repeat domain 221−2.901
3099HK2Hexokinase 21−2.729
57116ZNF695Zinc finger protein 6952−2.525
3352HTR1D5-hydroxytryptamine (serotonin) receptor 1D, G protein-coupled1−2.510
140893RBBP8NLRBBP8 N-terminal like1−2.509
4171MCM2Minichromosome maintenance complex component 21−2.475
201266SLC39A11Solute carrier family 39, member 111−2.474
90861HN1LHematological and neurological expressed 1-like1−2.441
57402S100A14S100 calcium binding protein A141−2.394
8884SLC5A6Solute carrier family 5 (sodium/multivitamin and iodide cotransporter), member 61−2.371
55612FERMT1Fermitin family member 11−2.359
9721GPRIN2G protein regulated inducer of neurite outgrowth 21−2.358
54552GNL3LGuanine nucleotide binding protein-like 3 (nucleolar)-like1−2.252
5653KLK6Kallikrein-related peptidase 61−2.251
157285SGK223Tyrosine-protein kinase sgk2231−2.224
144501KRT80Keratin 801−2.193
154796AMOTAngiomotin1−2.126
9052GPRC5AG protein-coupled receptor, family C, group 5, member A1−2.114
54815GATAD2AGATA zinc finger domain containing 2A1−2.113
3898LAD1Ladinin 11−2.046
414ARSDArylsulfatase D1−2.023
90381TICRRTOPBP1-interacting checkpoint and replication regulator1−2.022
10189ALYREFAly/REF export factor1−2.006
FC: fold change.
Table 2. Genes downregulated by siKRT80 in CRC cells.
Entrez
Gene ID
Gene SymbolGene NamesiKRT80-1-Transfected HCT116 Cells
log2 FC < −1
siKRT80-2-Transfected HCT116 Cells
log2 FC < −1
4155MBPMyelin basic protein−4.259−3.823
5027P2RX7Purinergic receptor P2X 7−4.078−1.151
7274TTPAAlpha tocopherol transfer protein−2.983−1.257
51339DACT1Disheveled binding antagonist of beta catenin 1−2.745−1.248
5163PDK1Pyruvate dehydrogenase kinase 1−2.686−2.183
114088TRIM9Tripartite motif containing 9−2.641−1.383
54434SSH1Slingshot protein phosphatase 1−2.465−1.668
148418SAMD13Sterile alpha motif domain containing 13−2.444−1.292
284716RIMKLARibosomal modification protein rimk like family member A−2.323−1.662
144501KRT80Keratin 80−2.321−1.878
285735LINC00326Long intergenic non-protein coding RNA 326−2.257−1.868
9194SLC16A7Solute carrier family 16 member 7−2.221−1.022
112399EGLN3egl-9 family hypoxia inducible factor 3−2.209−1.350
256435ST6GALNAC3ST6 N-acetylgalactosaminide alpha-2,6-sialyltransferase 3−2.185−1.875
4907NT5E5′-nucleotidase ecto−2.087−1.564
100287314LINC00941Long intergenic non-protein coding RNA 941−2.077−1.532
254128NIFK-AS1NIFK antisense RNA 1−2.049−1.204
3099HK2Hexokinase 2−1.916−3.518
1956EGFREpidermal growth factor receptor−1.872−1.096
7378UPP1Uridine phosphorylase 1−1.854−1.023
51384WNT16Wnt family member 16−1.835−1.759
115330GPR146G protein-coupled receptor 146−1.827−1.710
170384FUT11fucosyltransferase 11−1.818−1.129
2113ETS1ETS proto-oncogene 1, transcription factor−1.754−1.284
861RUNX1RUNX family transcription factor 1−1.720−1.209
10397NDRG1N-myc downstream regulated 1−1.666−1.856
22989MYH15Myosin heavy chain 15−1.634−1.744
N.A.lnc-OR10H1-1lnc-OR10H1-1:1−1.576−1.277
644316FLJ43315asparagine synthetase pseudogene−1.568−1.405
4781NFIBnuclear factor i b−1.565−1.333
25886POC1APOC1 centriolar protein A−1.549−1.338
N.A.lnc-CLEC2D-7lnc-CLEC2D-7:1−1.447−1.571
51175TUBE1Tubulin epsilon 1−1.383−1.488
10549PRDX4Peroxiredoxin 4−1.373−1.158
843CASP10Caspase 10−1.347−1.054
3613IMPA2Inositol monophosphatase 2−1.320−1.712
100505933ADD3-AS1ADD3 antisense RNA 1−1.296−1.095
4783NFIL3Nuclear factor, interleukin 3 regulated−1.267−1.184
57834CYP4F11Cytochrome P450 family 4 subfamily F member 11−1.265−1.522
11199ANXA10Annexin A10−1.262−2.649
64946CENPHCentromere protein H−1.251−1.236
8614STC2Stanniocalcin 2−1.243−1.373
286144TRIQKTriple qxxk/R motif containing−1.194−1.351
2035EPB41Erythrocyte membrane protein band 4.1−1.167−1.156
28996HIPK2Homeodomain interacting protein kinase 2−1.138−1.166
4233METMET proto-oncogene, receptor tyrosine kinase−1.130−1.247
100506211MIR210HGMIR210 host gene−1.109−1.795
23015GOLGA8AGolgin A8 family member A−1.068−1.087
23516SLC39A14Solute carrier family 39 member 14−1.063−1.441
84986ARHGAP19Rho gtpase activating protein 19−1.062−1.035
255082CASC2Cancer susceptibility 2−1.045−1.546
100507065LOC100507065Uncharacterized LOC100507065−1.032−1.425
FC: fold change, N.A.: not available.
Publisher’s Note: MDPI stays neutral with regard to jurisdictional claims in published maps and institutional affiliations.

