Article

Genome-Wide Identification and Characterization of Banana Ca2+-ATPase Genes and Expression Analysis under Different Concentrations of Ca2+ Treatments

1
College of Horticulture, Fujian Agriculture and Forestry University, Fuzhou 350002, China
2
College of Horticulture, Shanxi Agricultural University, Taigu 030801, China
3
Shaanxi Rural Science and Technology Development Center, Xi’an 710000, China
4
Key Laboratory of Genetic Improvement of Bananas, Hainan Province, Haikou Experimental Station, Chinese Academy of Tropical Agricultural Sciences, Haikou 570102, China
*
Authors to whom correspondence should be addressed.
These authors contributed equally to this work.
Int. J. Mol. Sci. 2022, 23(19), 11914; https://doi.org/10.3390/ijms231911914
Submission received: 30 August 2022 / Revised: 3 October 2022 / Accepted: 4 October 2022 / Published: 7 October 2022
(This article belongs to the Special Issue Advances in Research for Fruit Crop Breeding and Genetics)

Abstract

:
Ca2+-ATPases have been confirmed to play very important roles in plant growth and development and in stress responses. However, studies on banana (Musa acuminata) Ca2+-ATPases are very limited. In this study, we identified 18 Ca2+-ATPase genes from banana, including 6 P-IIA or ER (Endoplasmic Reticulum) type Ca2+-ATPases (MaEACs) and 12 P-IIB or Auto-Inhibited Ca2+-ATPases (MaACAs). The MaEACs and MaACAs could be further classified into two and three subfamilies, respectively. This classification is well supported by their gene structures, which are encoded by protein motif distributions. The banana Ca2+-ATPases were all predicted to be plasma membrane-located. The promoter regions of banana Ca2+-ATPases contain many cis-acting elements and transcription factor binding sites (TFBS). A gene expression analysis showed that banana Ca2+-ATPases were differentially expressed in different organs. By investigating their expression patterns in banana roots under different concentrations of Ca2+ treatments, we found that most banana Ca2+-ATPase members were highly expressed under 4 mM and 2 mM Ca2+ treatments, but their expression decreased under 1 mM and 0 mM Ca2+ treatments, suggesting that their downregulation might be closely related to reduced Ca accumulation and retarded growth under low Ca2+ and Ca2+ deficiency conditions. Our study will contribute to the understanding of the roles of Ca2+-ATPases in banana growth and Ca management.

1. Introduction

Calcium (Ca2+), one of the most important essential elements and secondary messengers in plants, plays a very important role in regulating the various stages of plants, such as growth and development and responses to various stresses [1]. For the maintenance of the Ca2+ level balance in cytosolic and the rapid, transient responses to both biotic and abiotic stresses, plants have evolved a series of mechanisms [2]. Ca2+-ATPases have been confirmed to play very important roles in sensing the transient Ca2+ level changes and in the maintenance of cytosolic Ca2+ homeostasis [3]. According to their subcellular localizations and structures, Ca2+-ATPases can be further divided into P-IIA or ER (Endoplasmic Reticulum) type Ca2+-ATPases (ECAs) and P-IIB or Auto-Inhibited Ca2+-ATPases (ACAs) [4]. Ca2+-ATPases are highly conserved in plants [5]. The ACA subfamily member usually contains an N-terminal auto-inhibitory domain which is required for the high affinity calmodulin (CaM) binding, whereas the ECAs lack the N-terminal domain [6,7]. Moreover, the ER-located ECAs are of high specificity to the substrate ATP, while the membrane localized ACAs can hydrolyze both GTP and ITP [8].
The Lycopersicon LeECA1 gene was the first Ca2+-ATPase gene cloned from plant. Its expression level increased dramatically under 50 mM NaCl condition [9]. From then on, Ca2+-ATPases were continuously discovered in many plants and were found to be widely involved in many cellular and physiological processes of plants. For instance, the Arabidopsis (Arabidopsis thaliana) AtACA9 was reported to be required for normal pollen tube growth and fertilization. Pollens of the ataca9 mutant showed much lower growth potential, higher aborted fertilization frequency and a >80% reduction of seed set [10]. AtACA10 has been reported to play an important role in regulating reproductive development, including adult phase growth and inflorescence development [11]. Moreover, the ateca1-1 mutant displayed Ca2+ deficiency symptoms such as smaller plant size, shorter roots, small yellowish leaves and lack of bolts [12] under low Ca2+ conditions (0.2 to 0.4 mM). Similarly, the ateca3 mutant was slightly more sensitive than the wild-type when Ca2+ was omitted from the medium, and the fresh weight of ateca3-1 was significantly lower than that of the wild type plants [13].
In addition to their roles in plant growth and development, Ca2+-ATPases have also been repeatedly found to participate in plant stress responses. The AtACA8 gene is low temperature inducible, and the ataca8 mutant showed increased cold resistance and the higher expression of CBFs, CAMTA and ZAT12 transcription factor genes, as well as cold responsive genes such as UGE2 and GolS3 [14]. In rice (Oryza sativa L.), OsACA6 can improve plant salinity and drought stress tolerance by modulating the ROS scavenging pathway and enhancing the expression of stress-responsive genes [15]. Glycine Soja GsACA1-overexpression alfalfa plants exhibited higher tolerance to both carbonate alkaline and neutral salt stresses, and lower levels of membrane permeability and malondialdehyde (MDA) content, higher levels of superoxide dismutase (SOD) activity, proline (Pro) concentration and chlorophyll content under stress conditions [16]. Under Ca2+ deficiency and toxicity conditions, the expression of Triticum aestivum TaECA1 and TaECA3 significantly increased in both roots and shoots. And the expression levels of TaACA2, 3 and 4 in plants grown under Ca2+ deficiency and toxicity conditions differed significantly from plants grown under control conditions [3].
Banana (Musa spp.) is one of the most important fruit crops in the world. As a gigantic herb, the nutrient requirement of a banana tree is huge. However, due to the high temperature and rainy climate characteristic of their cultivation areas, banana trees often suffer greatly from various nutrient deficiencies [17]. Previous studies have shown that Nitrogen (N), Phosphorus (P), Potassium (K), Calcium (Ca), Magnesium (Mg), Sulfur (S) or Boron (B) deficiency in banana would result in leaf etiolation and root growth retardation [18]. Ca2+ is crucial for the growth and development of banana plants, and Ca2+ deficiency will cause malformation or carving of new banana leaves, significantly reduce the accumulation of dry matter in pseudostems and leaves, and inhibit growth of the whole banana plant [19]. The proper application of Ca fertilizer can improve photosynthesis ability and promote the growth and development of banana plants [20]. The crucial roles of Ca2+-ATPases in plant development and stress responses have been demonstrated in many species, but studies on banana Ca2+-ATPases genes is very limited. To provide a basis for future studies and applications of banana Ca2+-ATPases, genome-wide identification of this gene family was performed, their sequence characteristics were studied using a series of bioinformatics analyses, and their expression patterns in different parts of banana (including root, corm, pseudostem and leaf) were investigated using transcriptome data. Furthermore, we evaluated the effects of different concentrations of Ca2+ treatments on the growth of banana seedlings by measuring the aboveground part and root fresh weight, root number and root length, and the P, K, Ca, Mg and S contents in root, leaf and pseudostem. Moreover, to reveal the possible roles of Ca2+-ATPases in response to different Ca2+ levels, their expression patterns in banana roots under different concentrations of Ca2+ treatments (4 mM, 2 mM, 1 mM and 0 mM) were studied using a quantitative real time PCR (qRT-PCR). The results obtained in this study will be helpful for the understanding of the characteristics of the banana Ca2+-ATPase gene family and can provide insights into their roles in banana growth and development and stress responses.

2. Results

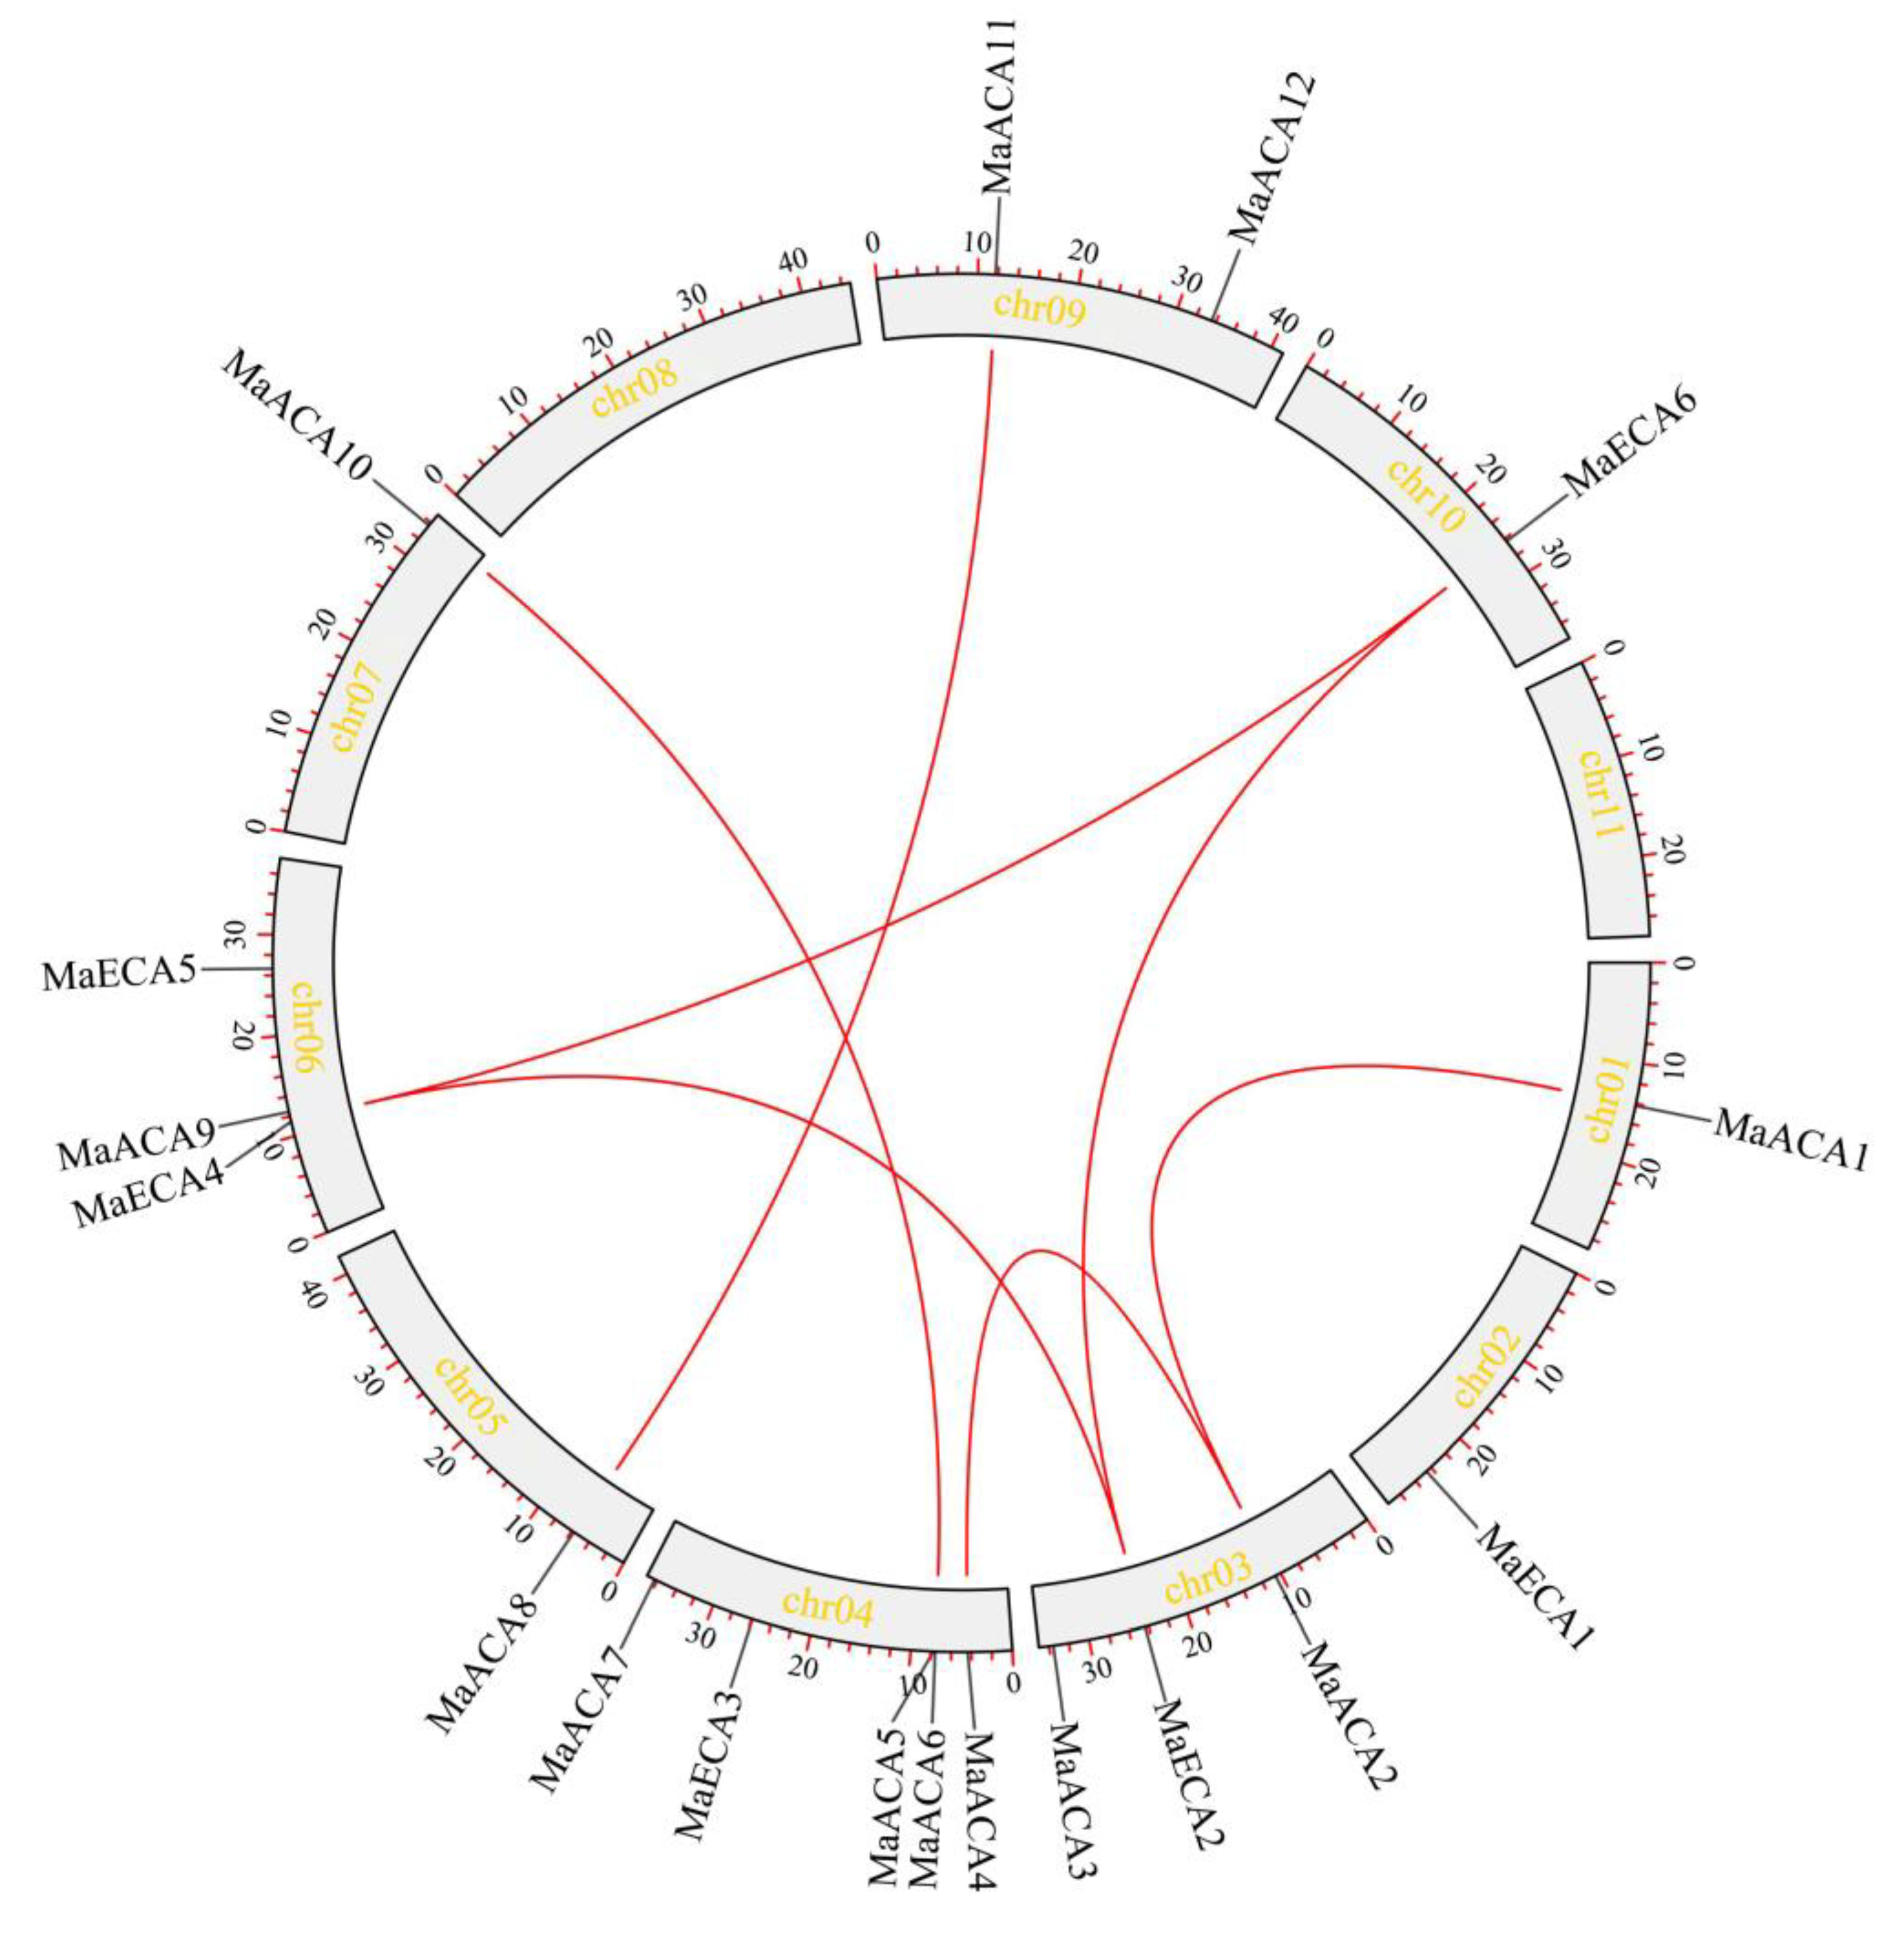
2.1. Identification and Characterization of Banana Ca2+-ATPase Gene Family Members

In total, 18 Ca2+-ATPase genes were identified from M. acuminata, including six MaEACs and 12 MaACAs (Table 1). According to their chromosomal location information, they were named as MaECA1~MaECA6 and MaACA1~MaACA12, respectively. Among them, MaACA9 and MaACA12 have two variable transcripts, MaACA3 has five transcripts, and these variable transcripts were named as MaACA9-1 and MaACA9-2, MaACA12-1 and MaACA12-2, and MaACA3-1~3-5, respectively. Banana Ca2+-ATPases consist of 942 to 1103 amino acids (aa) with a molecular weight ranging from 102,943.61 Da to 120,673.88 Da. The theoretical isoelectric point (pI) of Ca2+-ATPase proteins ranges from 5.19 to 8.87, and all of the MaECAs and seven of the MaACAs are acidic proteins, while the other five MaACAs (MaACA1, 2, 4, 11 and 12) are basic proteins. Their instability index ranges from 30.90 to 40.33. All of the banana Ca2+-ATPases are hydrophobic proteins with 6~11 transmembrane structures but without signal peptide. Protein subcellular localization prediction results showed that all banana Ca2+-ATPases were plasma membrane-located.
Banana Ca2+-ATPase genes are unevenly distributed on nine chromosomes (Figure 1). The most abundant of banana Ca2+-ATPase members are observed in chr04, with five members, followed by chr03, 06 and 09, with three, three, and two members, respectively, while chr01, 02, 07 and 10 each have only one member. Among the banana Ca2+-ATPases, there are seven segmental duplication gene pairs (MaACA1/MaACA2, MaACA2/MaACA4, MaACA6/MaACA10, MaACA8/MaACA11, MaECA2/MaECA4, MaECA2/MaECA6 and MaECA4/MaECA6) and no tandem duplication pair (Figure 1).

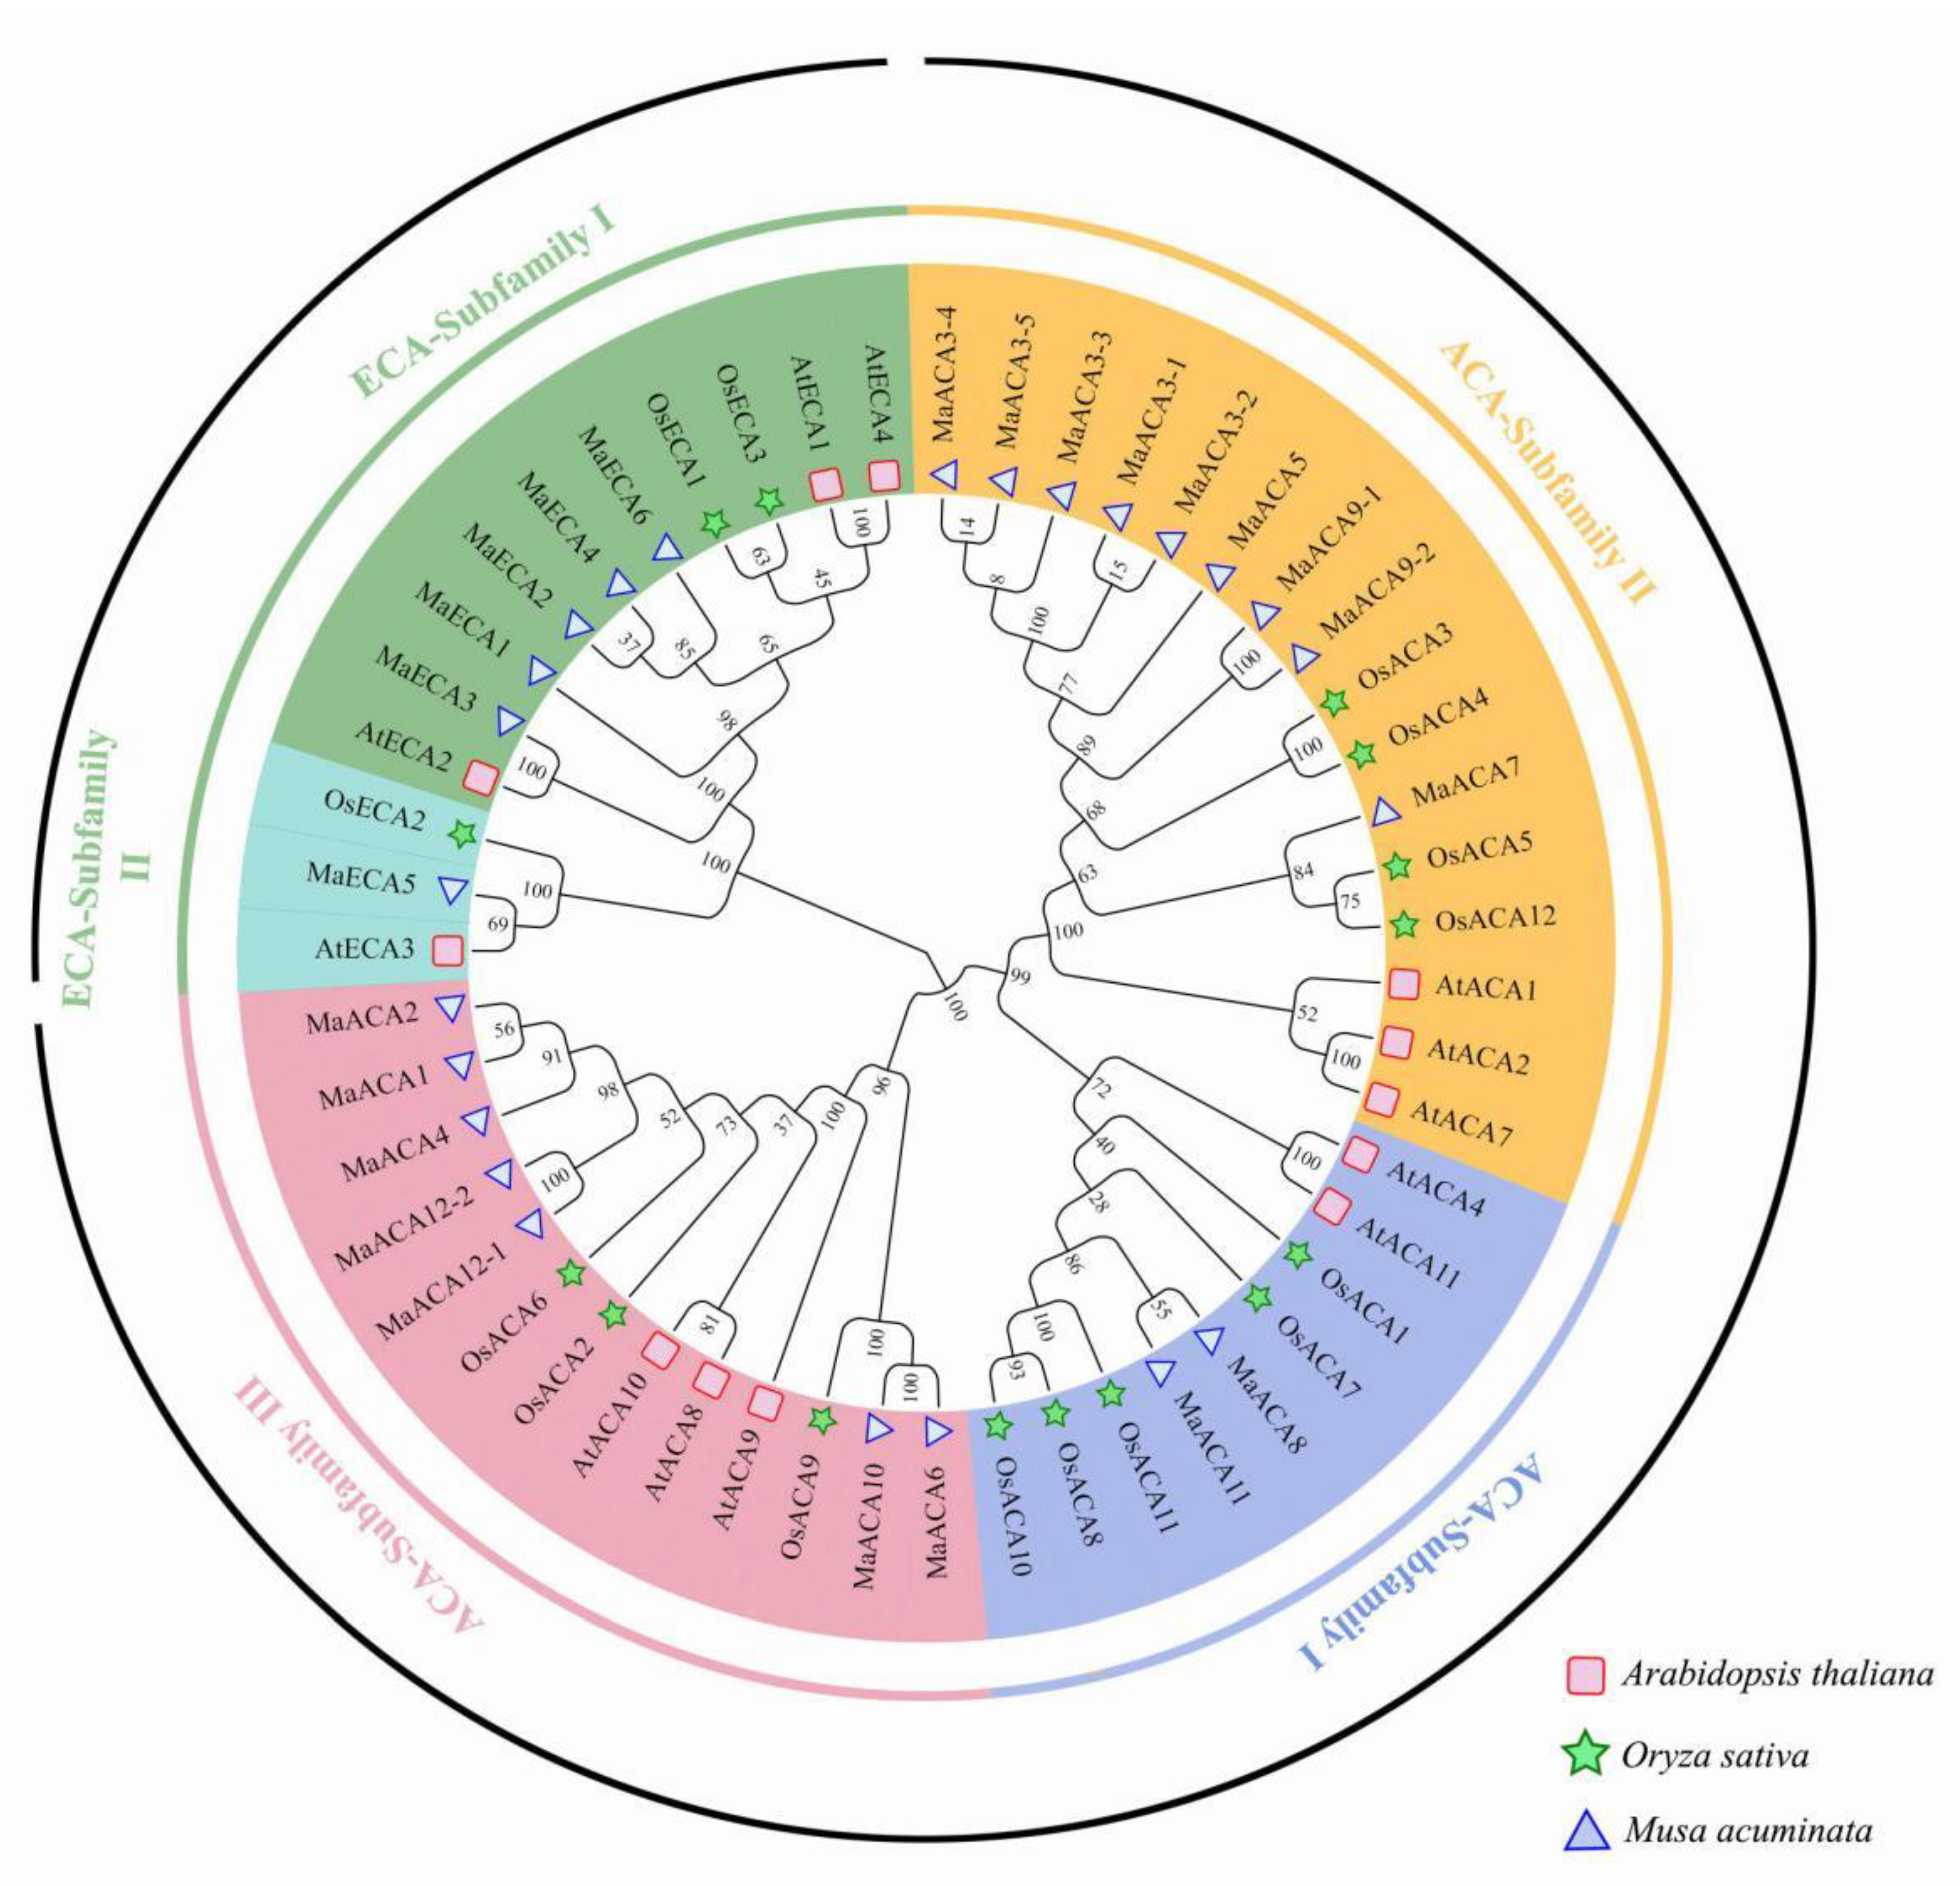
2.2. Phylogenetic Analysis of Ca2+-ATPase Genes

By using the Ca2+-ATPase protein sequences from Banana (18), Arabidopsis (15) and Rice (15), the phylogenetic relationships among Ca2+-ATPases were analyzed (Figure 2). Results showed that the Ca2+-ATPases could be divided into two groups, the ACA group and the ECA group, which could be further classified into three and two subfamilies, respectively. ACA Subfamily I-III included two, four and six banana Ca2+-ATPase members, and ECA Subfamily I-II included five and one banana Ca2+-ATPase members, respectively.

2.3. Conserved Motif and Gene Structure Analysis Results

A total of 15 motifs were identified in banana Ca2+-ATPases by using MEME (Figure 3a). A conserved motif analysis showed that all MaACAs were highly conserved (Figure 3a). Fourteen conserved motifs, except for motif 4, were found in all MaACAs. In addition, MaACA1 Subfamily III members contain two motif 6, and MaACA4 (Subfamily III) contain two motif 8. All of the MaACA1 Subfamily II members except for MaACA9-1 and MaACA9-2, contain two motif 5. Furthermore, MaACA5 (belonging to Subfamily II) contains two motif 2, while MaACA7 (Subfamily II) contains two motif 4. Motif 6 and 12 are lacking in both MaECA4 and MaECA6 of ECA Subfamily I. Motif 6, 10 and 12 are lacking in three ECA Subfamily I members, MaECA1, MaECA2 and MaECA3. In addition, MaECA1 (belonging to Subfamily I) contains two motif 15, and MaECA3 (belonging to Subfamily I) contains two motif 9. All the ECA members except MaECA5 contain all the identified motifs.
The exon-intron structures of banana Ca2+-ATPase genes from the same subfamily are found to be very similar in length and distribution (Figure 3b), indicating that they might originate from the same ancestor gene. The ACA subfamily I member genes have seven exons. All the ACA subfamily II members except MaACA3-1 (8 exons) have seven exons. The number of exons in ACA subfamily III genes varies greatly. MaACA6 has one exon, MaACA10 has two exons, MaACA12-2 has 35 exons and the other members have 34 exons. All members in ECA group I have eight exons, and the number of exons of MaECA5 in ECA Group II was 29.

2.4. Transcription Factor Binding Site (TFBS) and Cis-Acting Elements in Banana Ca2+-ATPase Promoters

In total, binding sites for 16 TF families (AP2, BBR-BPC, bZIP, C2H2, Dof, ERF, G2-like, HD-ZIP, HSF, MIKC-MADS, TALE, MYB, TCP, WRKY, MYB-related and Nin-like) were identified in the promoters of 7, 6, 1, 7, 4, 5, 1, 1, 2, 7, 7, 13, 1, 1, 1 and 3 family members, respectively. The binding sites for ERFs were found to be the largest in banana Ca2+-ATPase promoters, high up to 80, while the binding site number for bZIP, HD-ZIP, MYB, MYB-related and Nin-like was only one. In addition, there are significant differences in the TFBS number and distribution in the promoter regions of different banana Ca2+-ATPases. For instance, 59 TFBSs were found in MaECA1, while there is only one TFBS in the promoter region of MaACA2 and MaACA10 (Figure 4a).
Cis-acting element prediction results showed that 21 kinds of cis-acting elements were identified in the banana Ca2+-ATPase promoters, which can be further classified into five categories, including light-responsive, core elements, phytohormone-responsive, stress-responsive and growth and development related elements. Light responsive elements and core box (TATA-box and CAAT-box) are present in all promoters of banana Ca2+-ATPases. Among the phytohormone-responsive elements, the number of elements related to abscisic acid (ABA) and methyl jasmonate (MeJA) was the largest, both containing 15 elements, followed by gibberellin (GA), auxin and salicylic acid (SA) related elements, which contain 12, 11 and 8 elements, respectively. In addition, there are several types of stress-responsive elements on the banana Ca2+-ATPase promoters, including anaerobic induction, low-temperature, drought-inducibility and defense and stress, which account for 10, 10, 8 and 3 elements, respectively. Furthermore, many plant growth and development related cis-elements were also found in the banana Ca2+-ATPase promoters, including meristem expression, zein metabolism, endosperm expression, anoxic specific inducibility, wound responsive element, seed-specific, differentiation of the palisade mesophyll cells, MYB binding site involved in flavonoid biosynthetic genes regulation, and MYBHv1 binding site elements, accounting for 8, 8, 4, 5, 3, 1, 1, 1 and 5 elements, respectively (Figure 4b).

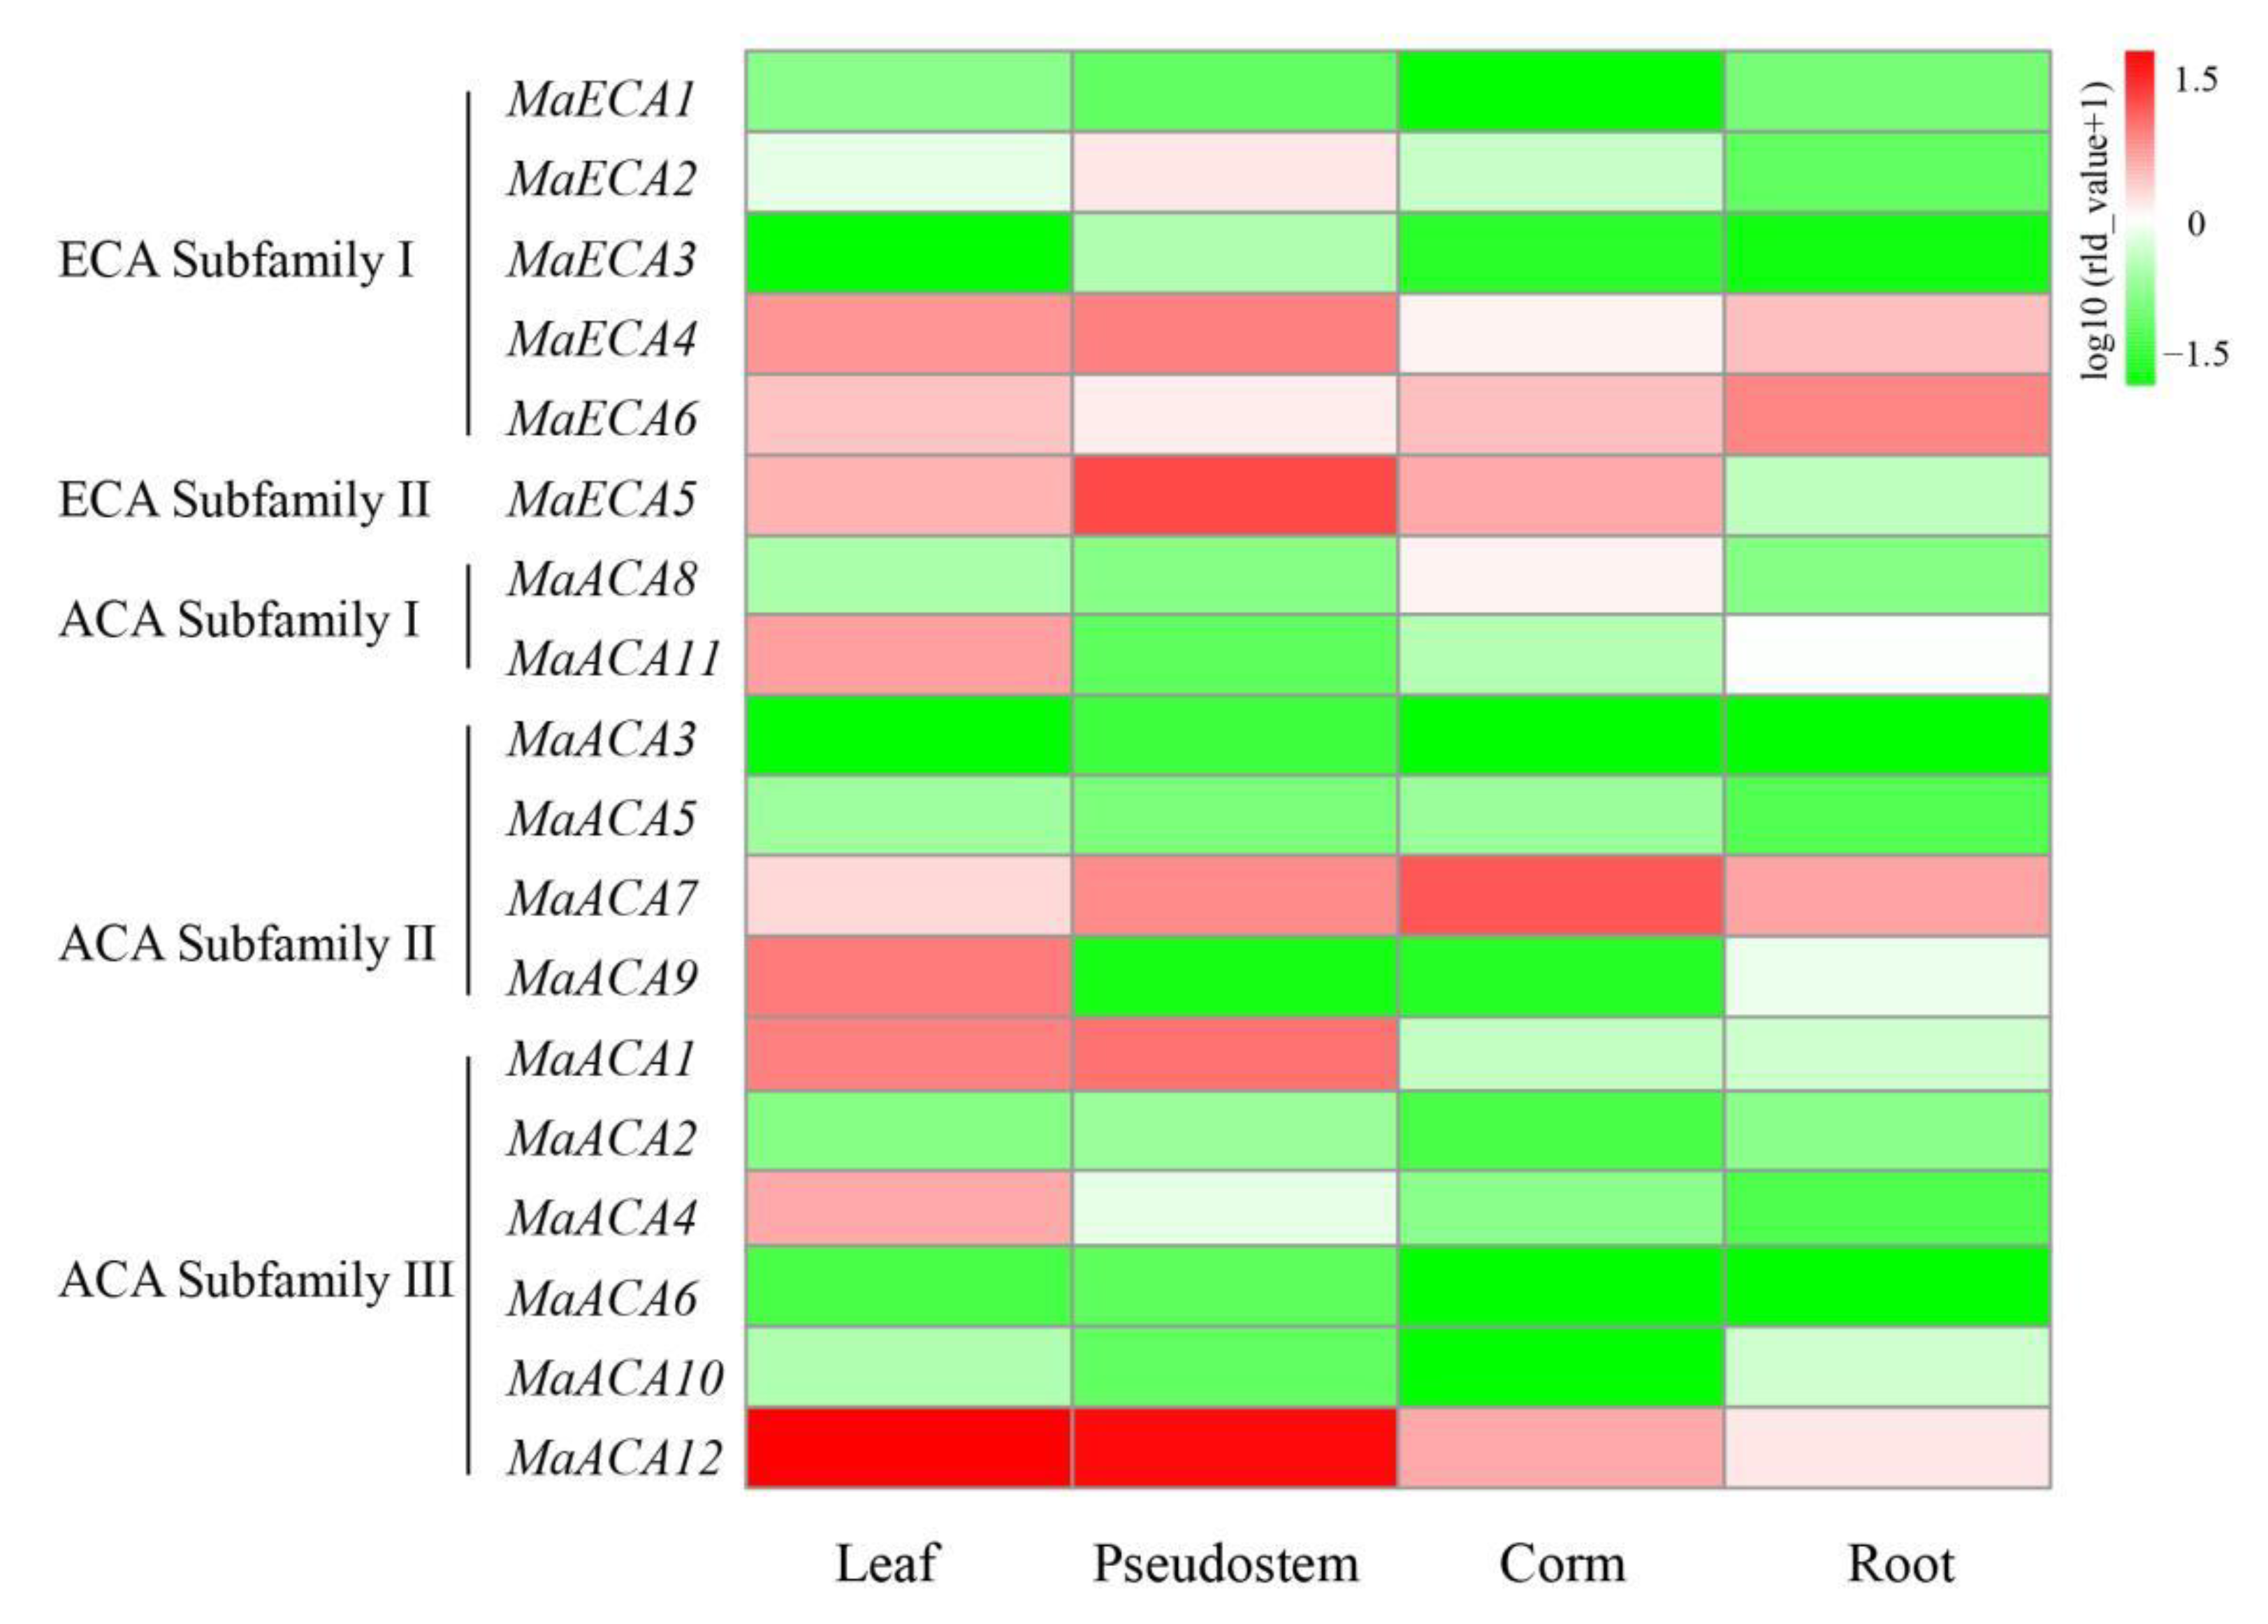
2.5. Expression Profiles of Ca2+-ATPase Genes in Different Banana Parts

According to our transcriptome data, the Ca2+-ATPase genes showed divergent expression patterns in different banana parts (Figure 5). In leaf, MaACA12 (belonging to ACA Subfamily III) was predominantly expressed, followed by MaACA1 (belonging to ACA Subfamily III), MaACA9 (belonging to ACA Subfamily II). In pseudostem, MaACA12 (belonging to ACA Subfamily III) was predominantly expressed, followed by MaECA5 (belonging to ECA Subfamily II), MaACA1 (belonging to ACA Subfamily III). MaACA7 (belonging to ACA Subfamily II), MaACA12 (belonging to ACA Subfamily III) and MaECA5 (belonging to ECA Subfamily II) were highly expressed in corn. MaECA6 (belonging to ECA Subfamily I), MaACA7 (belonging to ACA Subfamily II) and MaECA4 (belonging to ECA Subfamily I) were highly expressed in root. These results suggested that different Ca2+-ATPase family members might function differently in different organs.

2.6. Influences of Different Concentrations of Ca2+ Treatments on the Growth of Banana Seedling

Six months post treatment with Hoagland solutions containing different concentrations of Ca2+ (4 mM, 2 mM, 1 mM and 0 mM), the growth-related parameters of river sand cultured banana seedlings were measured (Figure 6). The aboveground part fresh weight of banana plants from the 2 mM and 1 mM group was about 1.40-fold and 1.37-fold of that of the 4 mM group, respectively. The aboveground part fresh weight of 0 mM group decreased by about 12.40% compared with 4 mM concentration (Figure 6a). The root fresh weights of 2 mM, 1 mM and 0 mM groups were all lower than that of the 4 mM group, which decreased by 8.47%, 30.49% and 48.63%, respectively (Figure 6b). Similarly, the root number and root length of 2 mM, 1 mM and 0 mM groups were all lower than that of the 4 mM group, which decreased by 21.23%, 14.54% and 24.54%, and 18.46%, 18.79% and 27.49%, respectively (Figure 6c,d). These results indicate that insufficient Ca2+ supply greatly affected the growth and root development of banana plants.

2.7. Influences of Different Concentrations of Ca2+ Treatments on the P, K, Ca, Mg and S Contents in Banana Root, Leaf and Pseudostem

The Ca content of the root, leaf and pseudostem decreased significantly with the reduction of Ca2+. The Ca content in root, leaf and pseudostem of the 2 mM group was only 88.02%, 70.40% and 87.68% of the 4 mM group, respectively. The Ca content in the three parts of the 1 mM group was only 51.07%, 51.09% and 83.33% of the 4 mM group, respectively. And the Ca content in the three tissues of the 0 mM group was only 61.64%, 52.83% and 73.47% of the 4 mM group, respectively (Figure 7a). Except the 1 mM group, the Ca content in root was lower than that in pseudostem, and the Ca content in different treatment groups all followed the order: root > pseudostem > leaf. Different concentrations of Ca2+ treatments also exhibited some influences on the K content in banana. Under 0 mM Ca2+ concentration treatment, the K content in banana leaf and pseudostem significantly increased (Figure 7b). The K content in different treatment groups all followed the order: pseudostem > leaf > root. With the decrease of Ca2+ concentrations, the P content in pesudostem increased and with the highest content in the 0 mM group, the P content in leaf showed a ‘rise-fall’ pattern and the highest P content was found in the 1 mM group. The P content in leaf and pseudostem of the 2 mM group is 1.84 and 1.71 times the 4 mM group, respectively. The P content in leaf and pseudostem of the 1 mM group is 2.16 and 2.02 times of the 4 mM group. And the P content in banana leaf and pseudostem of 0 mM group is 2.00 and 2.15 times the 4 mM group (Figure 7c). Moreover, it was found that the P content in root did not show obvious changes among different groups. The Mg content in pseudostems showed a ‘rise-fall’ pattern as the Ca2+ concentration decreased, and the highest Mg content was found in the 1 mM group. The Mg content in roots of the 0 mM group was the highest. The Mg content in leaves from different groups were found to be significantly lower than that in pseudostems and roots, and did not show significant difference among different groups (Figure 7d). The S contents in different banana parts all followed the order ‘root > leaf > pseudostem’ in all the treatment groups and the highest S contents were all found in the 2 mM group (Figure 7e).

2.8. The Expression Patterns of Banana Ca2+-ATPase Genes under Different Concentrations of Ca2+ Treatments

We further studied the influences of different concentrations of Ca2+ treatments on the expression of six banana Ca2+-ATPase genes, including two MaECAs (MaECA4 and MaECA6) and four MaACAs (MaACA1, MaACA7, MaACA8 and MaACA9), using qRT-PCR (Figure 8). Results showed that the relative expression levels of all these genes except MaACA1 in the 0 mM and 1 mM groups were lower than in the 2 mM and 4 mM groups. This indicated that both low Ca2+ (1 mM Ca2+) and Ca deficiency (0 mM Ca2+) suppressed the expression of banana Ca2+-ATPases. The expression levels of MaECA4 and MaACA7 in root of banana plants from the 2 mM group were significantly higher than that in the 4 mM group, but the expression of MaACA1 and MaACA10 were significantly lower than that in the 4 mM group. The expression of MaECA4, MaECA6, MaACA8 and MaACA10 in root of the 1 mM group were significantly lower than that in the 4 mM group. And the expression of MaECA4 was the lowest among all the four groups.

3. Discussion

3.1. Comprehensive Genome-Wide Identification and Characterization of Banana Ca2+-ATPase Gene Family

In this study, we identified a total of 18 Ca2+-ATPase genes from M. acuminata genome, including six MaEACs and 12 MaACAs. The number of banana Ca2+-ATPases was higher than that of Arabidopsis (15) and rice (15) [21], but less than that in soybean (29) [16]. Gene duplication is considered to be a key factor contributing to the gene family expansion and gene function diversification [22]. In Arabidopsis, no gene duplication event was observed in the Ca2+-ATPase family [21]. One segmental duplication gene pair (OsACA10 and OsACA11) and one tandem duplication gene pair (OsACA2 and OsACA3) were identified in the rice genome [23]. In soybean, however, gene duplications occur in almost all the family members [16]. In our present study, seven segmental duplication gene pairs were identified, indicating that the expansion of the banana Ca2+-ATPase gene family was mainly caused by segmental duplications.
Previous studies have revealed that plant Ca2+-ATPases are mainly localized in the plasma membrane as well as endo-membranes. OsACA6-GFP was exclusively observed in the plasma membrane [15]. In addition, AtECA3 has been reported to be localized in Golgi [13]. In our present study, all banana Ca2+-ATPases were predicted to be located in the plasma membrane, which was consistent with the results reported in some other plant species [4,10]. Protein subcellular location significantly determines the function of proteins. Therefore, it was predicted that the plasma membrane location of banana Ca2+-ATPases might be closely related to their functions in regulating intracellular Ca2+ homeostasis, which was achieved through transporting Ca2+ into extracellular space or sequestering Ca2+ in the ER and other organelles [24]. Similar to the gene structures of Ca2+-ATPase genes and conserved motifs of their encoded proteins in Solanaceae [25], Medicago sativa [26] and Brassica rapa [27], the banana Ca2+-ATPase members from the same subfamilies were found to be highly conserved. Moreover, the ACA group is found to be of higher conservation than the ECA group.
Transcription factors bind to the specific cis-acting elements and regulate the expression of a vast number of genes, which is an important epigenetic pathway [28]. In our study, many light responsive, core elements, phytohormone-responsive, stress responsive and growth and development related elements, as well as TFBSs for 16 kinds of transcription factors were found in the banana Ca2+-ATPase promoters. AP2/ERF, bZIP, C2H2, MYB and WRKY have been reported to play vital roles in regulating the growth, development and stress responses of banana [29,30,31]. Previous studies have shown that the promoter of AtACA8 contains various TFBS responses to low temperature, in consistence, the gene’s expression is responsive to low temperature [14]. Thus, it was hypothesized that the Ca2+-ATPase gene expression was regulated by many TFs and responds to a variety of stresses.

3.2. Ca2+ Deficiency Impairs Banana Growth and Nutrient Homeostasis

After treating the banana plants with different concentrations of Ca2+ (4, 2, 1 and 0 mM) for six months, we investigated the influences of Ca2+ levels on the growth of banana. The banana seedlings grown under 2, 1 and 0 mM Ca2+ showed shorter and less roots compared to plants from the 4 mM group. Consistently, similar results were also reported in wheat [3]. It is widely known that Ca2+ is an essential plant nutrient [32]. Previous studies have shown that Ca2+ deficiency can cause leaf-rot/wilting phenotype in Maize (Zea mays L.) [33]. In cabbage (Brassica oleracea L. var. Capitata), the fresh matter of aerial parts decreased up to 37% in plants under Ca2+ deficiency [34]. Ca2+ deficiency also caused the reduction of plant biomass and root growth in trifoliate (Poncirus trifoliate L.) rootstock seedlings [35]. In our study, compared with the aboveground part, the roots showed more significant difference among different groups, which could be manifested by the significant reduction of root length and root fresh weight. In addition, our study showed that 2, 1 and 0 mM Ca2+ treatments greatly affected the macro-elements accumulations in banana root, pseudostem and leaf. An excess or deficiency of nutrients in soil will destroy the ion homeostasis in plants, resulting in plant nutritional imbalance and retarded plant growth. Previous studies reported that different concentrations of exogenous Ca2+ treatments could affect the contents of K, Mg, Fe, Mn, Cu and Zn in leaf and the pericarp of pomegranate (Punica granatum L.) [36]. In our study, the Ca content in banana root, pseudostem and leaf decreased significantly as the Ca2+ concentration decreased. Furthermore, the P content in banana root, pseudostem and leaf and the S content in banana root increased significantly. It is possible that insoluble Ca3(PO4)2 and CaSO4 will be formed when Ca2+ coexists with PO43− or SO42−. Therefore, the absorption efficiency of P and S in banana will significantly increase after suffering Ca2+ deficiency, resulting in the P and S accumulation increase in banana organs [19]. In addition, our study showed that the decrease of Ca2+ concentration greatly influenced the Mg and the K accumulations in banana.

3.3. Low Ca2+ and Ca2+ Deficiency Treatments Significantly Inhibited the Expression of Many Ca2+-ATPase Genes

Studies have shown that Ca2+-ATPase exists in all membrane systems of plant cells, and the expression of Ca2+-ATPase is tissue specific [37]. In our study, each member of the Ca2+-ATPase family was expressed in at least one organ. MaECA4, 6 and MaACA7, 12 were highly expressed in root, pseudostem, corm, and leaves, which was consistent with the expression of AtACA8 and AtACA10 [4], indicating that the function of these genes differed significantly. In our study, MaACA4 and MaACA11 were found to be specifically expressed in banana leaves, and MaECA2 was specifically expressed in pseudocorm, indicating that their functions varied in different organs.
Ca2+-ATPases are considered to be required to maintain homeostatic levels of cytosolic Ca2+ and are widely believed to have roles in abiotic stresses via Ca2+ mediated signaling pathways. For instance, the expression of AtACA8 was up-regulated when plants were under cold stress [38]. Similarly, the expression of AtACA2 and AtACA4 were enhanced under salt stress [6]. In the study, qRT-PCR results showed that under 2 mM Ca2+ condition, the expression levels of some banana Ca2+-ATPase genes, such as MaECA4 and MaACA7, in banana root were both the highest, which was consistent with the previous study [3], while the expression of MaECA4, MaECA6, MaACA1, MaACA7, MaACA8 and MaACA10 declined under 1 mM and 0 mM Ca2+ concentration. The down-regulation of these banana Ca2+-ATPase genes indicated that they were responsive to low Ca2+ and Ca2+ deficiency conditions.

4. Materials and Methods

4.1. Identification of Banana Ca2+-ATPase Genes

The gDNA, CDS, and protein sequence files of Musa acuminata var. DH-Pahang were downloaded from the banana genome database (https://banana-genome-hub.southgreen.fr/blast, accessed on 10 January 2021). The HMMER software (version 3.0) (Sean Eddy, Cambridge, USA) [39] was applied to identify banana Ca2+-ATPase proteins using the Hidden Markov Model (HMM) file of Cation_ATPase_C (PF00690) (download from http://pfam.xfam.org/, accessed on 10 January 2021) with e-value ≤ 1 × 10⁻⁵. The conserved domain database (CDD, https://www.ncbi.nlm.nih.gov/cdd, accessed on 10 January 2021) was applied for the further confirmation of Ca2+-ATPases. The protein length, molecular weight, isoelectric point (pI) and instability index of banana Ca2+-ATPases were predicted using ExPASy ProtoParam (https://web.expasy.org/protparam/, accessed on 12 January 2021). To know whether their encoded proteins contain signal peptide and transmembrane structure or not, SignaIP 3.0 Server (http://www.cbs.dtu.dk/services/SignalP-3.0/, accessed on 12 January 2021) and TMHMM Server v.2.0 (http://www.cbs.dtu.dk/services/TMHMM/, accessed on 12 January 2021) was applied, respectively. For the subcellular localization analysis of banana Ca2+-ATPases, Wolf PSORT (https://wolfpsort.hgc.jp/, accessed on 20 January 2021) was used. For the self- and pairwise-alignment of Ca2+-ATPase proteins, the website for blast from NCBI (https://blast.ncbi.nlm.nih.gov/Blast.cgi, accessed on 20 January 2021) was used using e-value ≤ 1 × 10⁻¹⁰ as criterion. MCScanX (version 0.8) (Athens, Greece) was used for the gene collinear relationship analysis of the Ca2+-ATPase family members [40].

4.2. Phylogenetic Analysis

For the phylogenetic analysis of Ca2+-ATPases, the protein sequences of Arabidopsis and rice Ca2+-ATPases were downloaded from NCBI (http://www.ncbi.nlm.nih.gov/, accessed on 10 January 2021). MEGA 6.0 (Tokyo, Japan) [41] were used for the multiple sequence alignment and phylogenetic analysis, respectively. The phylogenetic tree was constructed using the Neighbor-Joining (NJ) method under parameters of Poisson model, Complete deletion and 1000 bootstrap replicates and was visualized using EvolView [42] (https://www.evolgenius.info/evolview/, accessed on 10 January 2021).

4.3. Gene Structure and Conserved Motifs Analysis

For gene structure analysis of banana Ca2+-ATPase genes, GSDS (http://gsds.cbi.pku.edu.cn/, accessed on 30 September 2022) was used. The conserved motif analysis of banana Ca2+-ATPases was performed using MEME (http://meme-suite.org/tools/meme, accessed on 30 September 2022) [43]. Furthermore, the gene structures of banana Ca2+-ATPase genes and conserved motifs of their encoded proteins were visualized using TBtools software 3.0 (Guangzhou, China) [44].

4.4. Promoter Analysis of the Banana Ca2+-ATPase Gene Promoters

The 2000 bp sequences upstream of the start codon of each banana Ca2+-ATPase genes were extracted from the banana genome database using TBtools software 3.0.(Guangzhou, China), PlantTFDB (http://planttfdb.cbi.pku.edu.cn/, accessed on 10 February 2021) and PlantCARE (http://bioinformatics.psb.ugent.be/webtools/plantcare/html/, accessed on 10 February 2021) was used to predict the transcription factor binding sites (TFBSs) and the cis-acting elements on promoters under default parameters, respectively.

4.5. Plant Materials and Treatment

The plant materials we used in this study are tissue-cultured ‘Tianbaojiao’ banana (Musa acuminata cv. Tianbaojiao) seedlings. To facilitate the rooting and growth of tissue-cultured seedlings, ten days’ Hoagland solution (with Ca2+ concentration of 4 mM) hardening [45] and Serendipita indica inoculation [46] were performed. Banana seedlings were then transferred into clean river sand in flower pots (with diameter and height of 14 cm and 11 cm, respectively), and cultured at 25 °C growth chamber with 60–80% relative humidity and 160 mol m−2s−1 of illumination for 12 h per day. Seedlings were fertilized with Hoagland solution (with Ca2+ concentration of 4 mM) twice a week. Uniform and well-growing river sand cultured ‘Tianbaojiao’ banana seedlings at the five-leaf stage were divided into four groups which were watered with Hoagland solution containing 4 mM, 2 mM, 1 mM and 0 mM Ca2+ twice a week [47,48], respectively. The composition of the Hoagland solution containing different concentrations of Ca2+ are shown in Table S1.

4.6. Measurements of Growth-Related Parameters and Microelement Contents

To study the influences of different concentrations of Ca2+ treatments on the banana plant growth and microelement accumulations, the root number (referring to the number of all primary roots) and length (referring to the length of the longest taproot of the plant), fresh weight of aboveground part and root were determined at six months post treatment. For each parameter, at least three replications were made. Moreover, inductively coupled plasma atomic emission spectrometry (ICP-MS AES) was applied for the determination of the P, K, Ca, Mg and S contents in leaf, pseudostem and root of banana seedlings from the four groups.

4.7. Gene Expression Analysis

The TPM values of Ca2+-ATPase genes were selected from root, corm, pseudostem, and leaf tissues of banana, and generated the plots by the R package pheatmap (version 1.0.12) (Raivo Kolde, Tartu, Estonia). To investigate the expression patterns of banana Ca2+-ATPase genes under the treatments of different concentrations of Ca2+, quantitative real time PCR (qRT-PCR) was used. An RNAprep Pure Plant Kit (TIANGEN, Beijing, China) was used for the isolation of total RNA from the roots of banana seedlings from the four groups. High quality RNA was used as a template for the cDNA synthesis using PrimeScript™ RT reagent Kit with gDNA Eraser (Perfect Real Time) (Takara, Beijing, China) according to the manual. The generated cDNA was diluted fivefold for subsequent experiments. The PCR reaction conditions used were 95 °C for 30 s; 95 °C for 5 s, and 59 °C for 20 s (40 cycles). Relative gene expression levels were determined using the 2∆∆Ct method by using MaCAC as an internal reference [49]. Statistical analysis and figure drawing was conducted using IBM SPSS Statistics 21 (International Business Machines Corporation, Armonk, USA) and GraphPad Prism 6.01 (Graphpad Software Inc, San Diego, USA) software, respectively. The primers used in this experiment are shown in Table S2.

5. Conclusions

In this study, we identified 18 Ca2+-ATPase genes from M. acuminata, including six MaEACs and 12 MaACAs. The expansion of this gene family was predicted to be caused mainly by segmental duplications. The gene structures of the banana Ca2+-ATPase genes from the same subfamily and motif distributions in their encoded proteins were much more similar, and all the banana Ca2+-ATPase proteins were predicted to be plasma membrane located. A gene expression analysis showed that the expression of banana Ca2+-ATPase genes in different organs varied greatly, and most members showed higher expression under 4 mM and 2 mM Ca2+ treatments, but significantly decreased expression under low Ca2+ (1 mM) and Ca2+ deficiency (0 mM) treatments. Therefore, it was concluded that the decreased expression of banana Ca2+-ATPase genes might be closely related to related to the reduced Ca accumulation and plant growth retardation caused by low Ca2+ and Ca2+ deficiency.

Supplementary Materials

The following supporting information can be downloaded at: https://www.mdpi.com/article/10.3390/ijms231911914/s1.

Author Contributions

Conceptualization, R.M. and N.T.; methodology, R.M. and N.T.; software, J.W., M.F., P.Q., B.W., S.X. and Y.X.; validation, B.W. and P.Q.; formal analysis, R.M., N.T. and J.W.; investigation, N.T. and B.W.; resources, C.C.; data curation, N.T.; writing—original draft preparation, R.M.; writing—review and editing, C.C. and P.L.; visualization, R.M., N.T. and J.W.; supervision, C.C. and P.L.; project administration, C.C. and P.L.; funding acquisition, C.C. and P.L. All authors have read and agreed to the published version of the manuscript.

Funding

This research was funded by the Construction of Plateau Discipline of Fujian Province (102/71201801101), the Fund for High-Level Talents of Shanxi Agricultural University (2021XG010), and the Reward Fund for PhDs and Postdoctors of Shanxi Province (SXBYKY2022004).

Institutional Review Board Statement

Not applicable.

Informed Consent Statement

Not applicable.

Data Availability Statement

The authors confirm that the data supporting the findings of this study are available within the article and its Supplementary Materials.

Conflicts of Interest

The authors declare no conflict of interest.

References

  1. Tang, R.; Luan, S. Regulation of calcium and magnesium homeostasis in plants: From transporters to signaling network. Curr. Opin. Plant Biol. 2017, 39, 97–105. [Google Scholar] [CrossRef] [PubMed]
  2. Case, R.; Eisner, D.; Gurney, A.; Jones, O.; Muallem, S.; Verkhratsky, A. Evolution of calcium homeostasis: From birth of the first cell to an omnipresent signalling system. Cell Calcium 2007, 42, 345–350. [Google Scholar] [CrossRef] [PubMed]
  3. Aslam, R.; Williams, L.; Bhatti, M.; Virk, N. Genome-wide analysis of wheat calcium ATPases and potential role of selected ACAs and ECAs in calcium stress. BMC Plant Biol. 2017, 17, 174. [Google Scholar] [CrossRef] [PubMed] [Green Version]
  4. Bonza, M.; De Michelis, M. The plant Ca2+-ATPase repertoire: Biochemical features and physiological functions. Plant Biol. 2011, 13, 421–430. [Google Scholar] [CrossRef] [PubMed]
  5. Pedersen, C.; Axelsen, K.; Harper, J.; Palmgren, M. Evolution of plant P-type ATPases. Front. Plant Sci. 2012, 3, 31. [Google Scholar] [CrossRef] [Green Version]
  6. Geisler, M.; Axelsen, K.; Harper, J.; Palmgren, M. Molecular aspects of higher plant P-Type Ca2+-ATPases. Biochim. Biophys. Acta 2000, 1465, 52–78. [Google Scholar] [CrossRef] [Green Version]
  7. Tuteja, N.; Mahajan, S. Calcium Signaling Network in Plants: An Overview. Plant Signal. Behav. 2007, 2, 79–85. [Google Scholar] [CrossRef] [Green Version]
  8. Axelsen, K.; Palmgren, M. Inventory of the superfamily of P-type ion pumps in Arabidopsis. Plant Physiol. 2001, 126, 696–706. [Google Scholar] [CrossRef] [Green Version]
  9. Wimmers, L.; Ewing, N.; Bennett, A. Higher plant Ca2+-ATPase: Primary structure and regulation of mRNA abundance by salt. Proc. Natl. Acad. Sci. USA 1992, 89, 9205–9209. [Google Scholar] [CrossRef] [Green Version]
  10. Schiøtt, M.; Romanowsky, S.; Bækgaard, L.; Jakobsen, M.; Palmgren, M.; Harper, J. A plant plasma membrane Ca2+ pump is required for normal pollen tube growth and fertilization. PNAS 2004, 101, 9502–9507. [Google Scholar] [CrossRef]
  11. George, L.; Romanowsky, S.; Harper, J.; Sharrock, R. The ACA10 Ca2+-ATPase Regulates Adult Vegetative Development and Inflorescence Architecture in Arabidopsis. Plant Physiol. 2008, 146, 716–728. [Google Scholar] [CrossRef] [PubMed] [Green Version]
  12. Wu, Z.; Liang, F.; Hong, B.; Young, J.; Sussman, M.; Harper, J.; Sze, H. An endoplasmic reticulum-bound Ca2+/Mn2+ pump, ECA1, supports plant growth and confers tolerance to Mn2+ stress. Plant Physiol. 2002, 130, 128–137. [Google Scholar] [CrossRef] [PubMed] [Green Version]
  13. Mills, R.; Doherty, M.; Lopez-Marques, R.; Weimar, T.; Dupree, P.; Palmgren, M.; Pittman, J.; Williams, L. ECA3, a Golgi-localized P2A-Type ATPase, plays a crucial role in manganese nutrition in Arabidopsis. Plant Physiol. 2008, 146, 116–128. [Google Scholar] [CrossRef] [PubMed] [Green Version]
  14. Zhang, J.; Li, W. Molecular mechanism of Ca2+-ATPase ACA8 gene in response to low temperature stress in Arabidopsis Thaliana. In Proceedings of the 15th General Assembly and the 80th Annual Conference of the Chinese Botanical Society, Nanchang, China, 13 October 2013. [Google Scholar]
  15. Huda, K.; Banu, M.; Garg, B.; Tula, S.; Tuteja, R.; Tuteja, N. OsACA6, a P-Type IIB Ca2+ATPase promotes salinity and drought stress tolerance in tobacco by ROS scavenging and enhancing the expression of stress-responsive genes. Plant J. 2013, 76, 997–1015. [Google Scholar] [CrossRef]
  16. Sun, M.; Jia, B.; Cui, N.; Wen, Y.; Duanmu, H.; Yu, Q.; Xiao, J.; Sun, X.; Zhu, Y. Functional characterization of a Glycine Soja Ca2+ATPase in salt-alkaline stress responses. Plant Mol. Biol. 2016, 90, 419–434. [Google Scholar] [CrossRef]
  17. Jordine, C. Metal deficiency in banana. Nature 1962, 194, 1161–1163. [Google Scholar] [CrossRef]
  18. Freitas, A.; Pozza, E.; Pozza, A.; Oliveira, M.; Silva, H.; Rocha, H.; Galvão, L. Impact of nutritional deficiency on Yellow Sigatoka of banana. Australas. Plant Pathol. 2015, 44, 583–590. [Google Scholar] [CrossRef]
  19. Chen, H. Study on Banana Nutrition Characteristics under N, P, K, Ca, Mg, S Deficiency and Banana Nutrition Diagnosis. Ph.D. Dissertation, South China Agricultural University, Guangdong, China, 2017. [Google Scholar]
  20. Yang, B.; Li, J.; Yao, L.; Li, G.; He, Z.; Tu, S. Effects of potassium, calcium and magnesium nutrition on growth and leaf physiological characteristics of banana. Soils Fertil. Sci. China 2010, 1, 29–36. [Google Scholar]
  21. Kamrul Huda, K.; Yadav, S.; Akhter Banu, M.; Trivedi, D.; Tuteja, N. Genome-wide analysis of plant-type II Ca2+ATPases gene family from rice and Arabidopsis: Potential role in abiotic stresses. Plant Physiol. Biochem. 2013, 65, 32–47. [Google Scholar] [CrossRef]
  22. Panchy, N.; Lehti-Shiu, M.; Shiu, S. Evolution of gene duplication in plants. Plant Physiol. 2016, 4, 2294–2316. [Google Scholar] [CrossRef] [Green Version]
  23. Goel, A.; Taj, G.; Pandey, D.; Gupta, S.; Kumar, A. Genome-wide comparative in silico analysis of calcium transporters of rice and sorghum. Genom. Proteom. Bioinf. 2011, 9, 138–150. [Google Scholar] [CrossRef]
  24. Møller, J.; Juul, B.; Le Maire, M. Structural organization, ion transport, and energy transduction of P-type ATPases. Biochim. Biophys. Acta 1996, 1286, 1–51. [Google Scholar] [CrossRef]
  25. Liu, Y.; Shu, Y.; Zhang, N.; Chen, X.; Wang, A. Identification and analysis of Ca2+-ATPase gene family in Solanaceae. Mol. Plant Breed. 2021, 19, 4268–4277. [Google Scholar] [CrossRef]
  26. Zhang, M.; Yang, J.; Sun, M.; Jia, B.; Sun, X. Screening and identification of environmental stress responsive Medicago sativa Ca2+ATPases based on gene family analyses. Plant Physiol. J. 2017, 53, 198–208. [Google Scholar] [CrossRef]
  27. Wang, J.; Wu, X.; Yang, L.; Ying, Q.; Huang, J. Genome-wide identification and expression analysis of ACA gene family in Brassica rapa. Scientia Agric. Sinica 2021, 54, 4851–4868. [Google Scholar] [CrossRef]
  28. Baillo, E.; Kimotho, R.; Zhang, Z.; Xu, P. Transcription factors associated with abiotic and biotic stress tolerance and their potential for crops improvement. Genes 2019, 10, 771. [Google Scholar] [CrossRef] [PubMed] [Green Version]
  29. Shivani; Awasthi, P.; Sharma, V.; Kaur, N.; Kaur, N.; Pandey, P.; Tiwari, S. Genome-wide analysis of transcription factors during somatic embryogenesis in banana (Musa spp.) cv. Grand Naine. PLoS ONE 2017, 12, e0182242. [Google Scholar] [CrossRef] [Green Version]
  30. Kuang, J.; Wu, C.; Guo, Y.; Walther, D.; Shan, W.; Chen, J.; Chen, L.; Lu, W. Deciphering transcriptional regulators of banana fruit ripening by regulatory network analysis. Plant Biotechnol. J. 2021, 19, 477–489. [Google Scholar] [CrossRef]
  31. Jia, C.; Wang, Z.; Wang, J.; Miao, H.; Zhang, J.; Xu, B.; Liu, J.; Jin, Z.; Liu, J. Genome-wide analysis of the banana WRKY transcription factor gene family closely related to fruit ripening and stress. Plants 2022, 11, 662. [Google Scholar] [CrossRef]
  32. El Habbasha, S.; Faten, M. Calcium: Physiological function, deficiency and absorption. Int. J. Chemtech Res. 2015, 8, 196–202. [Google Scholar]
  33. Wang, Y.; Martins, L.; Sermons, S.; Balint-Kurti, P. Genetic and physiological characterization of a calcium deficiency phenotype in maize. G3 Bethesda 2020, 10, 1963–1970. [Google Scholar] [CrossRef] [PubMed] [Green Version]
  34. Da Silva, D.; De Mello Prado, R.; Tenesaca, L.; Da Silva, J.; Mattiuz, B. Silicon attenuates calcium deficiency by increasing ascorbic acid content, growth and quality of cabbage leaves. Sci. Rep. 2021, 11, 1770. [Google Scholar] [CrossRef] [PubMed]
  35. Liu, Y.; Riaz, M.; Yan, L.; Zeng, Y.; Cuncang, J. Boron and calcium deficiency disturbing the growth of trifoliate rootstock seedlings (Poncirus trifoliate L.) by changing root architecture and cell wall. Plant Physiol. Biochem. 2019, 144, 345–354. [Google Scholar] [CrossRef] [PubMed]
  36. Yang, X.; Yin, Y.; Feng, L.; Wu, C.; Tang, H.; Jiao, Q. Effects of exogenous calcium on mineral contents in pomegranate leaves and pericarp during fruit development. J. Fruit Sci. 2017, 34, 111–118. [Google Scholar] [CrossRef]
  37. White, P.; Broadley, M. Calcium in plants. Ann. Bot. 2003, 92, 487–511. [Google Scholar] [CrossRef]
  38. Schiott, M.; Palmgren, M. Two plant Ca2+ pumps expressed in stomatal guard cells show opposite expression patterns during cold stress. Physiol. Plant. 2005, 124, 278–283. [Google Scholar] [CrossRef]
  39. Wheeler, T.; Eddy, S. nhmmer: DNA homology search with profile HMMs. Bioinformatics 2013, 29, 2487–2489. [Google Scholar] [CrossRef] [Green Version]
  40. Wang, Y.; Tang, H.; Debarry, J.; Tan, X.; Li, J.; Wang, X.; Lee, T.; Jin, H.; Marler, B.; Guo, H.; et al. MCScanX: A toolkit for detection and evolutionary analysis of gene synteny and collinearity. Nucleic Acids Res. 2012, 40, e49. [Google Scholar] [CrossRef] [Green Version]
  41. Tamura, K.; Stecher, G.; Peterson, D.; Filipski, A.; Kumar, S. MEGA6: Molecular Evolutionary Genetics Analysis version 6.0. Mol. Biol. Evol. 2013, 30, 2725–2729. [Google Scholar] [CrossRef] [Green Version]
  42. He, Z.; Zhang, H.; Gao, S.; Lercher, M.; Chen, W.; Hu, S. Evolview v2: An online visualization and management tool for customized and annotated phylogenetic trees. Nucleic Acids Res. 2016, 44, W236–W241. [Google Scholar] [CrossRef]
  43. Bailey, T.; Boden, M.; Buske, F.; Frith, M.; Grant, C.; Clementi, L.; Ren, J.; Li, W.; Noble, W. MEME SUITE: Tools for motif discovery and searching. Nucleic Acids Res. 2009, 37, W202–W208. [Google Scholar] [CrossRef] [PubMed]
  44. Chen, C.; Chen, H.; Zhang, Y.; Thormas, H.; Frank, M.; He, Y.; Xia, R. TBtools: An integrative toolkit developed for interactive analyses of big biological data. Mol. Plant 2020, 13, 1194–1202. [Google Scholar] [CrossRef] [PubMed]
  45. Tian, N.; Liu, F.; Sun, X.; Che, J.; Xiang, L.; Lai, Z.; Cheng, C. Effects of hydroponic culture hardening on the growth and photosynthetic characteristics of banana seedlings. Chin. J. Appl. Environ. Biol. 2020, 26, 582–589. [Google Scholar] [CrossRef]
  46. Cheng, C.; Li, D.; Qi, Q.; Sun, X.; Anue, M.; David, B.; Zhang, Y.; Hao, X.; Zhang, Z.; Lai, Z. The root endophytic fungus Serendipita indica improves resistance of banana to Fusarium oxysporum f. sp. cubense tropical race 4. Eur. J. Plant Pathol. 2020, 156, 87–100. [Google Scholar] [CrossRef]
  47. Sitko, K.; Gieron, Z.; Szopinski, M.; Zieleznik-Rusinowska, P.; Rusinowski, S.; Pogrzeba, M.; Daszkowska-Golec, A.; Kalaji, H.; Malkowski, E. Influence of short-term macronutrient deprivation in maize on photosynthetic characteristics, transpiration and pigment content. Sci. Rep. 2019, 9, 14181. [Google Scholar] [CrossRef] [Green Version]
  48. He, H.; Jin, X.; Ma, H.; Deng, Y.; Huang, J.; Yin, L. Changes of plant biomass partitioning, tissue nutrients and carbohydrates status in magnesium-deficient banana seedlings and remedy potential by foliar application of magnesium. Sci. Hortic. 2020, 268, 109377. [Google Scholar] [CrossRef]
  49. Chen, L.; Zhong, H.; Kuang, J.; Li, J.; Lu, W.; Chen, J. Validation of reference genes for RT-qPCR studies of gene expression in banana fruit under different experimental conditions. Planta 2011, 234, 377–390. [Google Scholar] [CrossRef]
Figure 1. Chromosome localization and collinear relationship of banana Ca2+-ATPase genes. The red line indicates the segmental duplication gene pairs.
Ijms 23 11914 g001
Figure 2. Phylogenetic analysis results based on the Ca2+-ATPases from Arabidopsis thaliana (At), Oryza sativa (Os) and Musa acuminata (Ma). Subfamily I-Subfamily V represents different Ca2+-ATPase subfamily, respectively.
Ijms 23 11914 g002
Figure 3. Motif distributions (a) in banana Ca2+-ATPase proteins and gene structures (b) of their corresponding genes.
Ijms 23 11914 g003
Figure 4. The predicted transcription factor binding sites (a) and cis-acting elements (b) on the promoters of banana Ca2+-ATPase genes.
Ijms 23 11914 g004
Figure 5. Heatmap for the expression of Ca2+-ATPase gene family members in different tissues. Red and green colors represent high and low expression levels, respectively.
Ijms 23 11914 g005
Figure 6. Effects of different concentrations of Ca2+ treatments on the aboveground part fresh weight (a), root fresh weight (b), root number (c) and root length (d). All data are displayed as mean ± standard deviation (SD) of at least three replicates. Different lowercase letters above columns represent significant difference at p < 0.05.
Ijms 23 11914 g006
Figure 7. Effect of the different concentrations of Ca2+ on Ca (a), K (b), P (c), Mg (d) and S (e) content in root, leaf and pseudostem of banana seedlings. All data are displayed as mean ± standard deviation (SD) of at least three replicates.
Ijms 23 11914 g007
Figure 8. Quantitative real time PCR results of Ca2+-ATPase genes in banana roots under different concentrations of Ca2+ treatments. All data are displayed as mean ± standard deviation (SD) of three replicates. Different lowercase letters above the columns represent significant difference at p < 0.05.
Ijms 23 11914 g008
Table 1. Physicochemical properties of the banana Ca2+-ATPase family proteins.
Gene IDGene NameChromosome LocationLength (aa)Molecular Weight/DapIInstability
Index
GRAVYSignal PeptideTransmembrane
Structure
Number
Protein
Subcellular
Localization
Prediction
P-type Ca2+-ATPaseIIA (ECA)
Ma02_g17850MaECA1chr02:24603794…24609861(+)1064116,317.605.2835.820.089NO7Plasma membrane
Ma03_g18840MaECA2chr03:24338682…24347596(−)1059115,754.375.3637.300.095NO9Plasma membrane
Ma04_g23800MaECA3chr04:25894068…25901262(+)1051116,158.695.4033.610.131NO8Plasma membrane
Ma06_g16960MaECA4chr06:11494289…11502009(−)1058115,980.525.1936.630.078NO7Plasma membrane
Ma06_g26060MaECA5chr06:26671312…26740153(+)1000109,753.565.8736.370.222NO8Plasma membrane
Ma10_g13570MaECA6chr10:26320460…26327228(+)1059115,636.055.2636.290.098NO9Plasma membrane
P-type Ca2+-ATPaseIIB (ACA)
Ma01_g18810MaACA1chr01:14159363…14175495(+)1095119,281.688.3638.100.050NO8Plasma membrane
Ma03_g13430MaACA2chr03:10547060…10561232(−)1090119,195.568.2736.890.040NO11Plasma membrane
Ma03_g31290MaACA3-1chr03:33555522…33560125(+)942102,943.615.9835.910.221NO6Plasma membrane
MaACA3-2 1016110,612.295.8434.990.207NO6Plasma membrane
MaACA3-3 1012110,180.845.8434.600.216NO6Plasma membrane
MaACA3-4 1017110,723.475.8435.530.213NO6Plasma membrane
MaACA3-5 1034112,541.575.8735.130.220NO6Plasma membrane
Ma04_g05840MaACA4chr04:4360063…4378280(+)1082118,244.808.4740.330.066NO7Plasma membrane
Ma04_g10940MaACA5chr04:7723372…7730223(+)1020111,212.015.8835.510.200NO6Plasma membrane
Ma04_g10640MaACA6chr04:7560089…7563361(+)1017111,767.315.7031.680.121NO7Plasma membrane
Ma04_g39050MaACA7chr04:36293787…36300960(+)1020111,518.145.9132.300.158NO6Plasma membrane
Ma05_g07830MaACA8chr05:5750563…5759010(+)1034114,138.106.7431.150.169NO10Plasma membrane
Ma06_g18390MaACA9-1chr06:12494351…12501092(−)1019111,002.405.2632.570.201NO6Plasma membrane
MaACA9-2 1012109,834.235.2234.650.242NO6Plasma membrane
Ma07_g27150MaACA10chr07:33645382…33649713(+)1024112,321.635.8534.050.091NO8Plasma membrane
Ma09_g16370MaACA11chr09:11747981…11758304(−)1035114,334.588.3030.900.144NO10Plasma membrane
Ma09_g21740MaACA12-1chr09:33595832…33627266(+)1078117,956.487.2838.830.070NO9Plasma membrane
MaACA12-2 1103120,673.888.8735.900.072NO9Plasma membrane
Publisher’s Note: MDPI stays neutral with regard to jurisdictional claims in published maps and institutional affiliations.

