
The Importance of Charge Transfer and Solvent Screening in the Interactions of Backbones and Functional Groups in Amino Acid Residues and Nucleotides


Abstract
:
1. Introduction
2. Methods
2.1. Modeling Protein–DNA Complex
2.2. Evaluation of Interactions
2.3. Definition of Fragments and Segments
3. Results and Discussion
3.1. Interactions between Residues
3.2. Charges of Residues
3.3. Components of Interactions
3.4. Contributions of Backbones and Functional Units
3.5. Comparison of Base Pairs
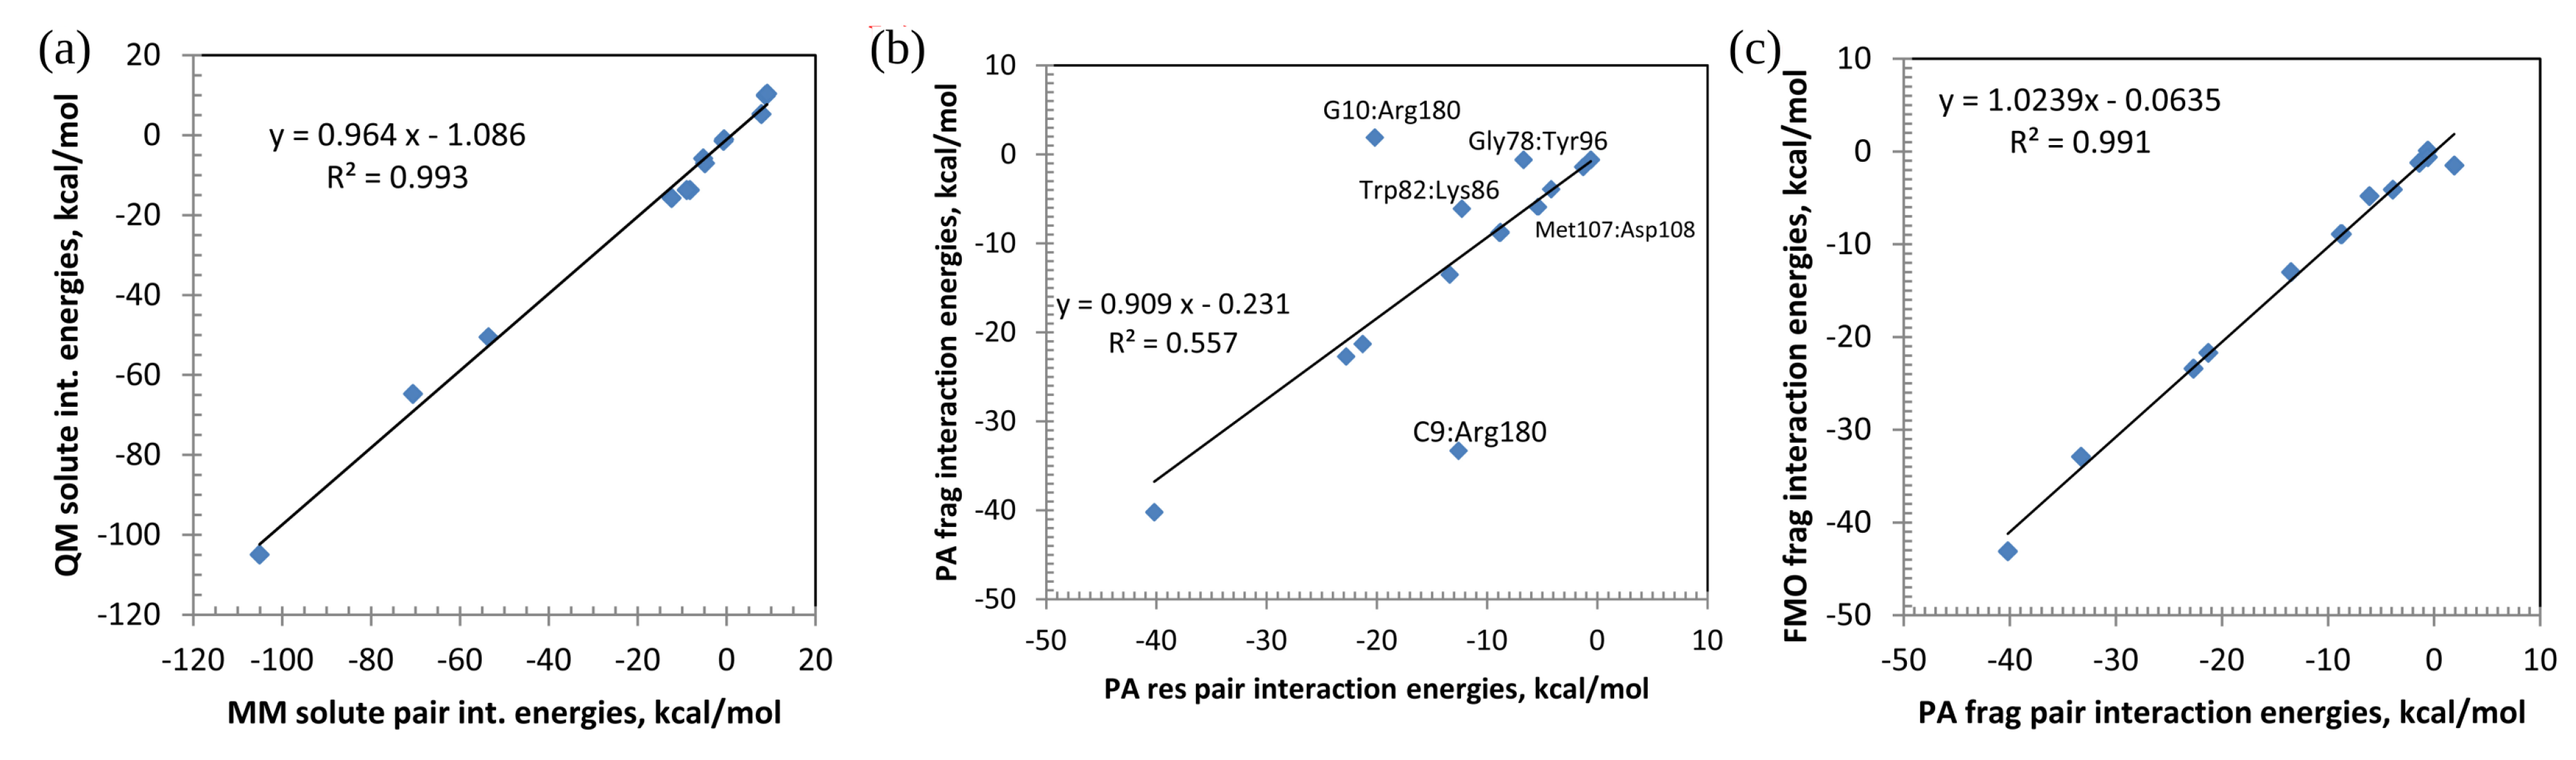
3.6. Comparison of Energies
3.7. Statistical Analysis of All Interactions in Topological Models
4. Conclusions
Supplementary Materials
Author Contributions
Funding
Data Availability Statement
Acknowledgments
Conflicts of Interest
References
- Geng, C.; Xue, L.C.; Roel-Touris, J.; Bonvin, A.M.J.J. Finding the ΔΔG Spot: Are Predictors of Binding Affinity Changes upon Mutations in Protein-Protein Interactions Ready for it? WIREs Comput. Mol. Sci. 2019, 9, e1410. [Google Scholar] [CrossRef] [Green Version]
- Gordon, M.S.; Fedorov, D.G.; Pruitt, S.R.; Slipchenko, L.V. Fragmentation Methods: A Route to Accurate Calculations on Large Systems. Chem. Rev. 2012, 112, 632–672. [Google Scholar] [CrossRef] [PubMed] [Green Version]
- Kitaura, K.; Ikeo, E.; Asada, T.; Nakano, T.; Uebayasi, M. Fragment Molecular Orbital Method: An Approximate Computational Method for Large Molecules. Chem. Phys. Lett. 1999, 313, 701–706. [Google Scholar] [CrossRef]
- Fedorov, D.G. The Fragment Molecular Orbital Method: Theoretical Development, Implementation in GAMESS, and Applications. WIREs Comput. Mol. Sci. 2017, 7, e1322. [Google Scholar] [CrossRef]
- Fukuzawa, K.; Tanaka, S. Fragment Molecular Orbital Calculations for Biomolecules. Curr. Opin. Struct. Biol. 2022, 72, 127–134. [Google Scholar] [CrossRef]
- Sawada, T.; Fedorov, D.G.; Kitaura, K. Role of the Key Mutation in the Selective Binding of Avian and Human Influenza Hemagglutinin to Sialosides Revealed by Quantum-Mechanical Calculations. J. Am. Chem. Soc. 2010, 132, 16862–16872. [Google Scholar]
- Morao, I.; Fedorov, D.G.; Robinson, R.; Southey, M.; Townsend-Nicholson, A.; Bodkin, M.J.; Heifetz, A. Rapid and Accurate Assessment of GPCR-Ligand Interactions Using the Fragment Molecular Orbital-Based Density-Functional Tight-Binding Method. J. Comput. Chem. 2017, 38, 1987–1990. [Google Scholar] [CrossRef] [Green Version]
- Kim, J.; Lim, H.; Moon, S.; Cho, S.Y.; Kim, M.; Park, J.H.; Park, H.W.; No, K.T. Hot Spot Analysis of YAP-TEAD Protein-Protein Interaction Using the Fragment Molecular Orbital Method and its Application for Inhibitor Discovery. Cancers 2021, 2021, 4246. [Google Scholar] [CrossRef]
- Tanaka, S.; Tokutomi, S.; Hatada, R.; Okuwaki, K.; Akisawa, K.; Fukuzawa, K.; Komeiji, Y.; Okiyama, Y.; Mochizuki, Y. Dynamic Cooperativity of Ligand-Residue Interactions Evaluated with the Fragment Molecular Orbital Method. J. Phys. Chem. B 2021, 125, 6501–6512. [Google Scholar] [CrossRef]
- Deb, I.; Wong, H.; Tacubao, C.; Frank, A.T. Quantum Mechanics Helps Uncover Atypical Recognition Features in the Flavin Mononucleotide Riboswitch. J. Phys. Chem. B 2021, 125, 8342–8350. [Google Scholar] [CrossRef]
- Xu, F.; Tanaka, S.; Watanabe, H.; Shimane, Y.; Iwasawa, M.; Ohishi, K.; Maruyama, T. Computational Analysis of the Interaction Energies between Amino Acid Residues of the Measles Virus Hemagglutinin and Its Receptors. Viruses 2018, 10, 236. [Google Scholar] [CrossRef] [PubMed]
- Fujii, M.; Tanaka, S. Interspecies Comparison of Interaction Energies between Photosynthetic Protein RuBisCO and 2CABP Ligand. Int. J. Mol. Sc. 2022, 23, 11347. [Google Scholar] [CrossRef] [PubMed]
- Nishimoto, Y.; Fedorov, D.G.; Irle, S. Density-Functional Tight-Binding Combined with the Fragment Molecular Orbital Method. J. Chem. Theory Comput. 2014, 10, 4801–4812. [Google Scholar] [CrossRef] [PubMed]
- Nishimoto, Y.; Fedorov, D.G. The Fragment Molecular Orbital Method Combined with Density-Functional Tight-Binding and the Polarizable Continuum Model. Phys. Chem. Chem. Phys. 2016, 18, 22047–22061. [Google Scholar] [CrossRef] [PubMed]
- Raha, K.; van der Vaart, A.J.; Riley, K.E.; Peters, M.B.; Westerhoff, L.M.; Kim, H.; Merz, K.M. Pairwise Decomposition of Residue Interaction Energies Using Semiempirical Quantum Mechanical Methods in Studies of Protein-Ligand Interaction. J. Am. Chem. Soc. 2005, 127, 6583–6594. [Google Scholar] [CrossRef] [PubMed]
- Phipps, M.J.S.; Fox, T.; Tautermann, C.S.; Skylaris, C.K. Energy Decomposition Analysis Approaches and their Evaluation on Prototypical Protein-Drug Interaction Patterns. Chem. Soc. Rev. 2015, 44, 3177–3211. [Google Scholar] [CrossRef] [Green Version]
- Yamamoto, Y.; Takei, K.; Arulmozhiraja, S.; Sladek, V.; Matsuo, N.; Han, S.i.; Matsuzaka, T.; Sekiya, M.; Tokiwa, T.; Shoji, M.; et al. Molecular Association Model of PPARa and its New Specific and Efficient Ligand, Pemafibrate: Structural Basis for SPPARMa. Biochem. Biophys. Res. Commun. 2018, 499, 239–245. [Google Scholar] [CrossRef] [PubMed]
- Mironov, V.; Shchugoreva, I.A.; Artyushenko, P.V.; Morozov, D.; Borbone, N.; Oliviero, G.; Zamay, T.N.; Moryachkov, R.V.; Kolovskaya, O.S.; Lukyanenko, K.A.; et al. Structure- and Interaction-Based Design of anti-SARS-CoV-2 Aptamers. Chem. Eur. J. 2022, 28, e202104481. [Google Scholar] [CrossRef]
- Yoshida, T.; Hirono, S. A 3D-QSAR Analysis of CDK2 Inhibitors Using FMO Calculations and PLS. Chem. Pharm. Bull. 2019, 67, 546–555. [Google Scholar] [CrossRef] [Green Version]
- Sladek, V.; Tokiwa, H.; Hitoshi, S.; Yasuteru, S. Protein Residue Networks from Energetic and Geometric Data: Are They Identical? J. Chem. Theory Comput. 2018, 14, 6623–6631. [Google Scholar] [CrossRef]
- Okuwaki, K.; Doi, H.; Fukuzawa, K.; Mochizuki, Y. Folding Simulation of Small Proteins by Dissipative Particle Dynamics (DPD) with Non-empirical Interaction Parameters Based on Fragment Molecular Orbital Calculations. Appl. Phys. Expr. 2020, 13, 017002. [Google Scholar] [CrossRef]
- Ishikawa, T.; Ishikura, T.; Kuwata, K. Theoretical Study of the Prion Protein Based on the Fragment Molecular Orbital Method. J. Comput. Chem. 2009, 30, 2594–2601. [Google Scholar] [CrossRef]
- Fedorov, D.G.; Kitaura, K. Pair Interaction Energy Decomposition Analysis for Density Functional Theory and Density-Functional Tight-Binding with an Evaluation of Energy Fluctuations in Molecular Dynamics. J. Phys. Chem. A 2018, 122, 1781–1795. [Google Scholar] [CrossRef] [PubMed]
- Takaba, K.; Watanabe, C.; Tokuhisa, A.; Akinaga, Y.; Ma, B.; Kanada, R.; Araki, M.; Okuno, Y.; Kawashima, Y.; Moriwaki, H.; et al. Protein-Ligand Binding Affinity Prediction of Cyclin-Dependent Kinase-2 Inhibitors by Dynamically Averaged Fragment Molecular Orbital-Based Interaction Energy. J. Comput. Chem. 2022, 43, 1362–1371. [Google Scholar] [CrossRef] [PubMed]
- Fedorov, D.G.; Kitaura, K. Subsystem Analysis for the Fragment Molecular Orbital Method and its Application to Protein-Ligand Binding in Solution. J. Phys. Chem. A 2016, 120, 2218–2231. [Google Scholar] [CrossRef]
- Bouchal, T.; Durník, I.; Illík, V.; Réblová, K.; Kulhánek, P. Importance of Base-Pair Opening for Mismatch Recognition. Nucleic Acids Res. 2020, 48, 11322–11334. [Google Scholar] [CrossRef]
- Morozov, D.; Mironov, V.; Moryachkov, R.V.; Shchugoreva, I.A.; Artyushenko, P.V.; Zamay, G.S.; Kolovskaya, O.S.; Zamay, T.N.; Krat, A.V.; Molodenskiy, D.S.; et al. The role of SAXS and Molecular Simulations in 3D Structure Elucidation of a DNA Aptamer against Lung Cancer. Mol. Ther. Nucl. Acids 2021, 25, 316–327. [Google Scholar] [CrossRef]
- Fedorov, D.G. Polarization Energies in the Fragment Molecular Orbital Method. J. Comput. Chem. 2022, 43, 1094–1103. [Google Scholar] [CrossRef]
- Ji, C.G.; Zhang, J.Z.H. Protein Polarization Is Critical to Stabilizing AF-2 and Helix-2’ Domains in Ligand Binding to PPAR-γ. J. Am. Chem. Soc. 2008, 130, 17129–17133. [Google Scholar] [CrossRef]
- Simmonett, A.C.; Pickard, F.C.; Shao, Y.; Cheatham, T.E.; Brooks, B.R. Efficient Treatment of Induced Dipoles. J. Chem. Phys. 2015, 143, 074115. [Google Scholar] [CrossRef] [Green Version]
- Corrigan, R.A.; Qi, G.; Thiel, A.C.; Lynn, J.R.; Walker, B.D.; Casavant, T.L.; Lagardere, L.; Piquemal, J.P.; Ponder, J.W.; Ren, P.; et al. Implicit Solvents for the Polarizable Atomic Multipole AMOEBA Force Field. J. Chem. Theory Comput. 2021, 17, 2323–2341. [Google Scholar] [CrossRef] [PubMed]
- Kim, Y.; Bui, Y.; Tazhigulov, R.N.; Bravaya, K.B.; Slipchenko, L.V. Effective Fragment Potentials for Flexible Molecules: Transferability of Parameters and Amino Acid Database. J. Chem. Theory Comput. 2020, 16, 7735–7747. [Google Scholar] [CrossRef] [PubMed]
- Fedorov, D.G. Solvent Screening in Zwitterions Analyzed with the Fragment Molecular Orbital Method. J. Chem. Theory Comput. 2019, 15, 5404–5416. [Google Scholar] [CrossRef] [PubMed]
- Monteleone, S.; Fedorov, D.G.; Townsend-Nicholson, A.; Southey, M.; Bodkin, M.; Heifetz, A. Hotspot Identification and Drug Design of Protein-Protein Interaction Modulators using the Fragment Molecular Orbital Method. J. Chem. Inf. Model. 2022, 62, 3784–3799. [Google Scholar] [CrossRef] [PubMed]
- Šponer, J.; Jurečka, P.; Hobza, P. Accurate Interaction Energies of Hydrogen-Bonded Nucleic Acid Base Pairs. J. Am. Chem. Soc. 2004, 126, 10142–10151. [Google Scholar] [CrossRef]
- Hobza, P.; Kabelac, M.; Sponer, J.; Mejzlik, P.; Vondrasek, J. Performance of Empirical Potentials (AMBER, CFF95, CVFF, CHARMM, OPLS, POLTEV), Semiempirical Quantum Chemical Methods (AM1, MNDO/M, PM3), and ab Initio Hartree–Fock Method for Interaction of DNA Bases: Comparison with Nonempirical beyond Hartree–Fock results. J. Comp. Chem. 1997, 18, 1136–1150. [Google Scholar]
- Asensio, A.; Kobko, N.; Dannenberg, J.J. Cooperative Hydrogen-Bonding in Adenine-Thymine and Guanine-Cytosine Base Pairs. Density Functional Theory and Møller-Plesset Molecular Orbital Study. J. Phys. Chem. A 2003, 107, 6441–6443. [Google Scholar] [CrossRef]
- Zubatiuk, T.; Kukuev, M.A.; Korolyova, A.S.; Gorb, L.; Nyporko, A.; Hovorun, D.; Leszczynski, J. Structure and Binding Energy of Double-Stranded A-DNA Mini-helices: Quantum-Chemical Study. J. Phys. Chem. B 2015, 119, 12741–12749. [Google Scholar] [CrossRef]
- Jurečka, P.; Hobza, P. True Stabilization Energies for the Optimal Planar Hydrogen-Bonded and Stacked Structures of Guanine···Cytosine, Adenine···Thymine, and Their 9- and 1-Methyl Derivatives: Complete Basis Set Calculations at the MP2 and CCSD(T) Levels and Comparison with Experiment. J. Am. Chem. Soc. 2003, 125, 15608–15613. [Google Scholar] [CrossRef]
- Cuyacot, B.J.R.; Durník, I.; Foroutan-Nejad, C.; Marek, R. Anatomy of Base Pairing in DNA by Interacting Quantum Atoms. J. Chem. Inf. Model. 2020, 61, 211–222. [Google Scholar] [CrossRef]
- Kudritskaya, Z.G.; Danilov, V.I. Quantum Mechanical Study of Bases Interactions in Various Associates in Atomic Dipole Approximation. J. Theor. Biol. 1976, 59, 303–318. [Google Scholar] [CrossRef]
- Yanson, I.K.; Teplitsky, A.B.; Sukhodub, L.F. Experimental Studies of Molecular Interactions Between Nitrogen Bases of Nucleic Acids. Biopolymers 1979, 18, 1149–1170. [Google Scholar] [CrossRef] [PubMed]
- Kyogoku, Y.; Lord, R.C.; Rich, A. An Infrared Study Of Thehydrogen - Bonding Specificity Of Hypoxanthine And Other Nucleic Acid Derivatives. Biochim. Biophys. Acta 1969, 179, 10–17. [Google Scholar] [CrossRef]
- Watanabe, T.; Inadomi, Y.; Fukuzawa, K.; Nakano, T.; Tanaka, S.; Nilsson, L.; Nagashima, U. DNA and Estrogen Receptor Interaction Revealed by Fragment Molecular Orbital Calculations. J. Phys. Chem. B 2007, 111, 9621–9627. [Google Scholar] [CrossRef] [PubMed]
- Watanabe, T.; Inadomi, Y.; Umeda, H.; Fukuzawa, K.; Tanaka, S.; Nakano, T.; Nagashima, U. Fragment Molecular Orbital (FMO) and FMO-MO Calculations of DNA: Accuracy Validation of Energy and Interfragment Interaction Energy. J. Comp. Theor. Nanosc. 2009, 6, 1328–1337. [Google Scholar] [CrossRef]
- Fukuzawa, K.; Kurisaki, I.; Watanabe, C.; Okiyama, Y.; Mochizuki, Y.; Tanaka, S.; Komeiji, Y. Explicit Solvation Modulates Intra- and Inter-Molecular Interactions within DNA: Electronic Aspects Revealed by the ab Initio Fragment Molecular Orbital (FMO) Method. Comp. Theor. Chem. 2015, 1054, 29–37. [Google Scholar] [CrossRef] [Green Version]
- Yamada, H.; Mochizuki, Y.; Fukuzawa, K.; Okiyama, Y.; Komeiji, Y. Fragment Molecular Orbital (FMO) Calculations on DNA by a Scaled Third-Order Møller-Plesset Perturbation (MP2.5) Scheme. Comp. Theor. Chem. 2017, 1101, 46–54. [Google Scholar] [CrossRef]
- Okiyama, Y.; Nakano, T.; Watanabe, C.; Fukuzawa, K.; Mochizuki, Y.; Tanaka, S. Fragment Molecular Orbital Calculations with Implicit Solvent Based on the Poisson-Boltzmann Equation: Implementation and DNA Study. J. Phys. Chem. B 2018, 122, 4457–4471. [Google Scholar] [CrossRef]
- Warren, J.J.; Pohlhaus, T.J.; Changela, A.; Iyer, R.R.; Modrich, P.L.; Beese, L.S. Structure of the Human MutSα DNA Lesion Recognition Complex. Mol. Cell 2007, 26, 579–592. [Google Scholar] [CrossRef]
- Bouchal, T.; Durník, I.; Kulhánek, P. Bending of Canonical and G/T Mismatched DNAs. J. Chem. Inf. Model. 2021, 61, 6000–6011. [Google Scholar] [CrossRef]
- Fedorov, D.G. Partition Analysis for Density-Functional Tight-Binding. J. Phys. Chem. A 2020, 124, 10346–10358. [Google Scholar] [CrossRef] [PubMed]
- Nakamura, T.; Yokaichiya, T.; Fedorov, D.G. Quantum-Mechanical Structure Optimization of Protein Crystals and Analysis of Interactions in Periodic Systems. J. Phys. Chem. Lett. 2021, 12, 8757–8762. [Google Scholar] [CrossRef] [PubMed]
- Nakamura, T.; Fedorov, D.G. The Catalytic Activity and Adsorption in Faujasite and ZSM-5 Zeolites: The Role of Differential Stabilization and Charge Delocalization. Phys. Chem. Chem. Phys. 2022, 24, 7739–7747. [Google Scholar] [CrossRef] [PubMed]
- Jacob, C.R.; Neugebauer, J. Subsystem Density-Functional Theory. WIREs Comput. Mol. Sci. 2014, 4, 325–362. [Google Scholar] [CrossRef]
- Cornell, W.D.; Cieplak, P.; Bayly, C.I.; Gould, I.R.; Merz, K.M.; Ferguson, D.M.; Spellmeyer, D.C.; Fox, T.; Caldwell, J.W.; Kollman, P.A. A Second Generation Force Field for the Simulation of Proteins, Nucleic Acids, and Organic Molecules. J. Am. Chem. Soc. 1995, 117, 5179–5197. [Google Scholar] [CrossRef] [Green Version]
- Ji, C.; Mei, Y.; Zhang, J.Z. Developing Polarized Protein-Specific Charges for Protein Dynamics: MD Free Energy Calculation of pKa Shifts for Asp26/Asp20 in Thioredoxin. Biophys. J. 2008, 95, 1080–1088. [Google Scholar] [CrossRef] [Green Version]
- Kato, K.; Masuda, T.; Watanabe, C.; Miyagawa, N.; Mizouchi, H.; Nagase, S.; Kamisaka, K.; Oshima, K.; Ono, S.; Ueda, H.; et al. High-Precision Atomic Charge Prediction for Protein Systems Using Fragment Molecular Orbital Calculation and Machine Learning. J. Chem. Inf. Model. 2020, 60, 3361–3368. [Google Scholar] [CrossRef]
- Grimme, S.; Ehrlich, S.; Goerigk, L. Effect of the Damping Function in Dispersion Corrected Density Functional Theory. J. Comp. Chem. 2011, 32, 1456–1465. [Google Scholar] [CrossRef]
- Gaus, M.; Goez, A.; Elstner, M. Parametrization and Benchmark of DFTB3 for Organic Molecules. J. Chem. Theory Comput. 2013, 9, 338–354. [Google Scholar] [CrossRef] [PubMed]
- Fedorov, D.G.; Kitaura, K. The Importance of Three-Body Terms in the Fragment Molecular Orbital Method. J. Chem. Phys. 2004, 120, 6832–6840. [Google Scholar] [CrossRef]
- Barca, G.M.J.; Bertoni, C.; Carrington, L.; Datta, D.; De Silva, N.; Deustua, J.E.; Fedorov, D.G.; Gour, J.R.; Gunina, A.O.; Guidez, E.; et al. Recent Developments in the General Atomic and Molecular Electronic Structure System. J. Chem. Phys. 2020, 152, 154102. [Google Scholar] [CrossRef] [PubMed] [Green Version]
- Case, D.A.; Babin, V.; Berryman, J.T.; Betz, R.M.; Cai, Q.; Cerutti, D.S.; Cheatham, T.E.; Darden, T.A.; Duke, R.E.; Gohlke, H.; et al. AMBER 14; Technical Report; University of California: San Francisco, CA, USA, 2022. [Google Scholar]
- Maier, J.A.; Martinez, C.; Kasavajhala, K.; Wickstrom, L.; Hauser, K.E.; Simmerling, C. ff14SB: Improving the Accuracy of Protein Side Chain and Backbone Parameters from ff99SB. J. Chem. Theory Comput. 2015, 11, 3696–3713. [Google Scholar] [CrossRef] [PubMed]
- Ivani, I.; Dans, P.D.; Noy, A.; Pérez, A.; Faustino, I.; Hospital, A.; Walther, J.; Andrio, P.; Goñi, R.; Balaceanu, A.; et al. Parmbsc1: A Refined Force Field for DNA Simulations. Nat. Meth. 2015, 13, 55–58. [Google Scholar] [CrossRef] [PubMed] [Green Version]
- Nguyen, H.; Roe, D.R.; Simmerling, C. Improved Generalized Born Solvent Model Parameters for Protein Simulations. J. Chem. Theory Comput. 2013, 9, 2020–2034. [Google Scholar] [CrossRef] [PubMed] [Green Version]
- Cournia, Z.; Allen, B.; Sherman, W. Relative Binding Free Energy Calculations in Drug Discovery: Recent Advances and Practical Considerations. J. Chem. Inf. Model. 2017, 57, 2911–2937. [Google Scholar] [CrossRef] [PubMed]
- King, E.; Qi, R.; Li, H.; Luo, R.; Aitchison, E. Estimating the Roles of Protonation and Electronic Polarization in Absolute Binding Affinity Simulations. J. Chem. Theory Comput. 2021, 17, 2541–2555. [Google Scholar] [CrossRef]
- Fedorov, D.G.; Kitaura, K. Energy Decomposition Analysis in Solution Based on the Fragment Molecular Orbital Method. J. Phys. Chem. A 2012, 116, 704–719. [Google Scholar] [CrossRef]
- Amin, M.; Küpper, J. Variations in Proteins Dielectric Constants. ChemistryOpen 2020, 9, 691–694. [Google Scholar] [CrossRef]
- Li, L.; Li, C.; Zhang, Z.; Alexov, E. On the Dielectric “Constant” of Proteins: Smooth Dielectric Function for Macromolecular Modeling and Its Implementation in DelPhi. J. Chem. Theory Comput. 2013, 9, 2126–2136. [Google Scholar] [CrossRef]
- Janeček, M.; Kührová, P.; Mlýnský, V.; Otyepka, M.; Šponer, J.; Banáš, P. W-RESP: Well-Restrained Electrostatic Potential-Derived Charges. Revisiting the Charge Derivation Model. J. Chem. Theory Comput. 2021, 17, 3495–3509. [Google Scholar] [CrossRef]
- Liebl, K.; Zacharias, M. Tumuc1: A New Accurate DNA Force Field Consistent with High-Level Quantum Chemistry. J. Chem. Theory Comput. 2021, 17, 7096–7105. [Google Scholar] [CrossRef] [PubMed]
- Gaus, M.; Cui, Q.; Elstner, M. DFTB3: Extension of the Self-Consistent-Charge Density-Functional Tight-Binding Method (SCC-DFTB). J. Chem. Theory Comput. 2011, 7, 931–948. [Google Scholar] [CrossRef] [PubMed]
- Fedorov, D.G. Electron Density from the Fragment Molecular Orbital Method Combined with Density-Functional Tight-Binding. Chem. Phys. Lett. 2021, 780, 138900. [Google Scholar] [CrossRef]
- Guerra, C.F.; Bickelhaupt, F.M.; Snijders, J.G.; Baerends, E.J. Hydrogen Bonding in DNA Base Pairs: Reconciliation of Theory and Experiment. J. Am. Chem. Soc. 2000, 122, 4117–4128. [Google Scholar] [CrossRef] [Green Version]
- Seeman, N.C.; Rosenberg, J.M.; Suddath, F.; Kim, J.J.P.; Rich, A. RNA Double-Helical Fragments at Atomic Resolution: I. The Crystal and Molecular Structure of Sodium Adenylyl-3’,5’-Uridine Hexahydrate. J. Mol. Biol. 1976, 104, 109–144. [Google Scholar] [CrossRef]
- Rosenberg, J.M.; Seeman, N.C.; Day, R.O.; Rich, A. RNA Double-Helical Fragments at Atomic Resolution: II. The Crystal Structure of Sodium Guanylyl-3’,5’-Cytidine Nonahydrate. J. Mol. Biol. 1976, 104, 145–167. [Google Scholar] [CrossRef]
- Schwalbe, C.H. June Sutor and the C–H···O Hydrogen Bonding Controversy. Crystallogr. Rev. 2012, 18, 191–206. [Google Scholar] [CrossRef]
- Helgaker, T.; Klopper, W.; Koch, H.; Noga, J. Basis-Set Convergence of Correlated Calculations on Water. J. Chem. Phys. 1997, 106, 9639–9646. [Google Scholar] [CrossRef]
- Vijayabaskar, M.; Vishveshwara, S. Interaction Energy Based Protein Structure Networks. Biophys. J. 2010, 99, 3704–3715. [Google Scholar] [CrossRef] [Green Version]
- Yao, X.Q.; Momin, M.; Hamelberg, D. Establishing a Framework of Using Residue-Residue Interactions in Protein Difference Network Analysis. J. Chem. Inf. Model. 2019, 59, 3222–3228. [Google Scholar] [CrossRef]
- Viloria, J.S.; Allega, M.F.; Lambrughi, M.; Papaleo, E. An Optimal Distance Cutoff for Contact-Based Protein Structure Networks Using Side-Chain Centers of Mass. Sci. Rep. 2017, 7, 2838–2848. [Google Scholar] [CrossRef] [PubMed] [Green Version]
- Tasdighian, S.; Paola, L.D.; Ruvo, M.D.; Paci, P.; Santoni, D.; Palumbo, P.; Mei, G.; Venere, A.D.; Giuliani, A. Modules Identification in Protein Structures: The Topological and Geometrical Solutions. J. Chem. Inf. Model. 2013, 54, 159–168. [Google Scholar] [CrossRef] [PubMed]
- Lim, H.; Chun, J.; Jin, X.; Kim, J.; Yoon, J.H.; No, K.T. Investigation of Protein-Protein Interactions and Hot Spot Region between PD-1 and PD-L1 by Fragment Molecular Orbital Method. Sci. Rep. 2019, 9, 16727. [Google Scholar] [CrossRef] [Green Version]
- Yao, X.Q.; Hamelberg, D. From Distinct to Differential Conformational Dynamics to Map Allosteric Communication Pathways in Proteins. J. Phys. Chem. B 2022, 126, 2612–2620. [Google Scholar] [CrossRef] [PubMed]
- Yao, X.Q.; Hamelberg, D. Residue–Residue Contact Changes during Functional Processes Define Allosteric Communication Pathways. J. Chem. Theory Comput. 2022, 18, 1173–1187. [Google Scholar] [CrossRef] [PubMed]
- Doshi, U.; Holliday, M.J.; Eisenmesser, E.Z.; Hamelberg, D. Dynamical Network of Residue-Residue Contacts Reveals Coupled Allosteric Effects in Recognition, Catalysis, and Mutation. Proc. Natl. Acad. Sci. USA 2016, 113, 4735–4740. [Google Scholar] [CrossRef] [PubMed] [Green Version]
- Calvó-Tusell, C.; Maria-Solano, M.A.; Osuna, S.; Feixas, F. Time Evolution of the Millisecond Allosteric Activation of Imidazole Glycerol Phosphate Synthase. J. Am. Chem. Soc. 2022, 144, 7146–7159. [Google Scholar] [CrossRef]
- Osuna, S. The Challenge of Predicting Distal Active Site Mutations in Computational Enzyme Design. WIREs Comput. Mol. Sci. 2020, 11, e1502. [Google Scholar] [CrossRef]
- Guzzi, P.H.; Paola, L.D.; Giuliani, A.; Veltri, P. PCN-Miner: An open-source extensible tool for the analysis of Protein Contact Networks. Bioinformatics 2022, 38, 4235–4237. [Google Scholar] [CrossRef]
- Tanaka, S.; Watanabe, C.; Honma, T.; Fukuzawa, K.; Ohishi, K.; Maruyama, T. Identification of Correlated Inter-Residue Interactions in Protein Complex Based on the Fragment Molecular Orbital Method. J. Mol. Graph. Modell. 2020, 100, 107650. [Google Scholar] [CrossRef]
- Sladek, V.; Yamamoto, Y.; Harada, R.; Shoji, M.; Shigeta, Y.; Sladek, V. pyProGA-A PyMOL Plugin for Protein Residue Network Analysis. PLoS ONE 2021, 16, e0255167. [Google Scholar] [CrossRef] [PubMed]
- Bossomaier, T.; Barnett, L.; Harré, M.; Lizier, J.T. An Introduction to Transfer Entropy: Information Flow in Complex Systems; Springer International Publishing: Berlin/Heidelberg, Germany, 2016. [Google Scholar] [CrossRef]
- Ben-Naim, A. A Farewell to Entropy: Statistical Thermodynamics Based on Information; World Scientific: Singapore, 2008. [Google Scholar]
- Bastian, M.; Heymann, S.; Jacomy, M. Gephi: An Open Source Software for Exploring and Manipulating Networks; Technical Report; Gephi, WebAtlas: London, UK, 2009. [Google Scholar]
- Diez, G.; Nagel, D.; Stock, G. Correlation-Based Feature Selection to Identify Functional Dynamics in Proteins. J. Chem. Theory Comput. 2022, 18, 5079–5088. [Google Scholar] [CrossRef] [PubMed]
- Cheatham, T.E.; Young, M.A. Molecular Dynamics Simulation of Nucleic Acids: Successes, Limitations, and Promise. Biopolymers 2000, 56, 232–256. [Google Scholar] [CrossRef]
- Galindo-Murillo, R.; Cheatham, T.E.; Hopkins, R.C. Exploring Potentially Alternative Non-canonical DNA Duplex Structures through Simulation. J. Biomol. Struct. Dyn. 2018, 37, 2201–2210. [Google Scholar] [CrossRef]
- Waters, J.T.; Lu, X.J.; Galindo-Murillo, R.; Gumbart, J.C.; Kim, H.D.; Cheatham, T.E.; Harvey, S.C. Transitions of Double-Stranded DNA between the A- and B-Forms. J. Phys. Chem. B 2016, 120, 8449–8456. [Google Scholar] [CrossRef] [Green Version]
- Rajasekaran, T.; Freestone, G.C.; Galindo-Murillo, R.; Lugato, B.; Rico, L.; Salinas, J.C.; Gaus, H.; Migawa, M.T.; Swayze, E.E.; Cheatham, T.E.; et al. Backbone Hydrocarbon-Constrained Nucleic Acids Modulate Hybridization Kinetics for RNA. J. Am. Chem. Soc. 2022, 144, 1941–1950. [Google Scholar] [CrossRef]
- Zgarbová, M.; Jurečka, P.; Banáš, P.; Otyepka, M.; Šponer, J.E.; Leontis, N.B.; Zirbel, C.L.; Šponer, J. Noncanonical Hydrogen Bonding in Nucleic Acids. Benchmark Evaluation of Key Base–Phosphate Interactions in Folded RNA Molecules Using Quantum-Chemical Calculations and Molecular Dynamics Simulations. J. Phys. Chem. A 2011, 115, 11277–11292. [Google Scholar] [CrossRef] [Green Version]
- Šimunková, M.; Štekláč, M.; Malček, M. Spectroscopic, Computational and Molecular Docking Study of Cu(II) Complexes with Flavonoids: From Cupric Ion Binding to DNA Intercalation. New J. Chem. 2021, 45, 10810–10821. [Google Scholar] [CrossRef]
- Galindo-Murillo, R.; Winkler, L.; Ma, J.; Hanelli, F.; Fleming, A.M.; Burrows, C.J.; Cheatham, T.E. Riboflavin Stabilizes Abasic, Oxidized G-Quadruplex Structures. Biochemistry 2022, 61, 265–275. [Google Scholar] [CrossRef]
- Šimunková, M.; Biela, M.; Štekláč, M.; Hlinčík, A.; Klein, E.; Malček, M. Cu(II) Complexes of Flavonoids in Solution: Impact of the Cu(II) Ion on the Antioxidant and DNA-Intercalating Properties. J. Mol. Liq. 2022, 359, 119230. [Google Scholar] [CrossRef]


| Pair | MM(Amber) | QM(PA) | QM(PA) | QM(PA) | QM(FMO) |
|---|---|---|---|---|---|
| (State,Unit) | Solute,Res | Solute,Res | Solution,Res | Solution,Frag | Solution,Frag |
| (Unit Charge) | Integer | Fractional | Fractional | Fractional | Integer |
| (Definition) | in Equation (4) | in Equation (3) | in Equation (2) | in Equation (2) | in Equation (1) |
| C7:G24 | |||||
| A13:T18 | |||||
| G6:C25 | |||||
| A3:T28 | |||||
| A2:T29 | |||||
| G8:T23 | |||||
| G10:Arg180 | |||||
| C9:Arg180 | |||||
| G24:Phe101 | |||||
| C7:Phe101 | |||||
| Gly78:Tyr96 | |||||
| Trp82:Lys86 | |||||
| Trp82:Met107 | |||||
| Lys86:Asp108 | |||||
| Met107:Asp108 | 5 |
| Residue | MM(total) b | QM(res,total) | QM(frag,total) | MM(funct) b | QM(res,funct) |
|---|---|---|---|---|---|
| A2 | |||||
| A3 | |||||
| G6 | |||||
| C7 | |||||
| G8 | |||||
| C9 | |||||
| G10 | |||||
| A13 | |||||
| T18 | |||||
| T23 | |||||
| G24 | |||||
| C25 | |||||
| T28 | |||||
| T29 | |||||
| Gly78 c | |||||
| Trp82 | |||||
| Lys86 | |||||
| Tyr96 | |||||
| Phe101 | |||||
| Met107 | |||||
| Asp108 | |||||
| Arg180 |
| MM(res) a | QM(PA,res) b | ||||
|---|---|---|---|---|---|
| Pair | |||||
| C7:G24 | |||||
| A13:T18 | |||||
| G6:C25 | |||||
| A3:T28 | |||||
| A2:T29 | |||||
| G8:T23 | |||||
| G10:Arg180 | |||||
| C9:Arg180 | |||||
| G24:Phe101 | |||||
| C7:Phe101 | |||||
| Gly78:Tyr96 | |||||
| Trp82:Lys86 | |||||
| Trp82:Met107 | |||||
| Lys86:Asp108 | |||||
| Met107:Asp108 | |||||
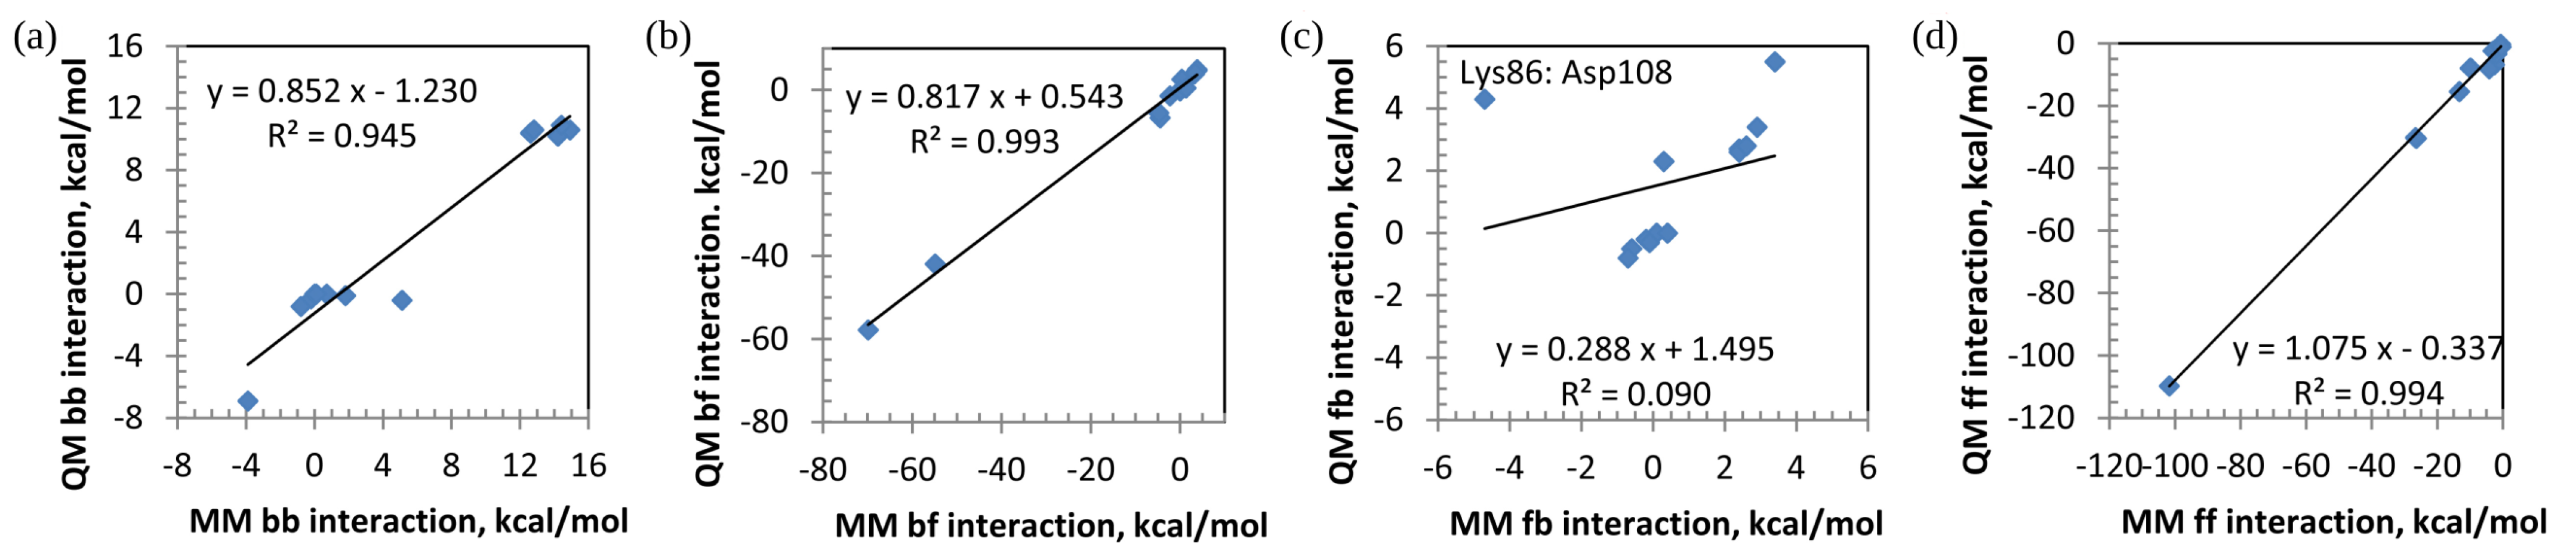
| MM(res,vacuum) | QM(res,solute) | QM(res,solution) | ||||||||||
|---|---|---|---|---|---|---|---|---|---|---|---|---|
| Pair | bb | bf | fb | ff | bb | bf | fb | ff | bb | bf | fb | ff |
| C7:G24 | ||||||||||||
| A13:T18 | ||||||||||||
| G6:C25 | ||||||||||||
| A3:T28 | ||||||||||||
| A2:T29 | ||||||||||||
| G8:T23 | ||||||||||||
| G10:Arg180 | ||||||||||||
| C9:Arg180 | ||||||||||||
| G24:Phe101 | ||||||||||||
| C7:Phe101 | ||||||||||||
| Gly78:Tyr96 | ||||||||||||
| Trp82:Lys86 | ||||||||||||
| Trp82:Met107 | ||||||||||||
| Lys86:Asp108 | ||||||||||||
| Met107:Asp108 | ||||||||||||
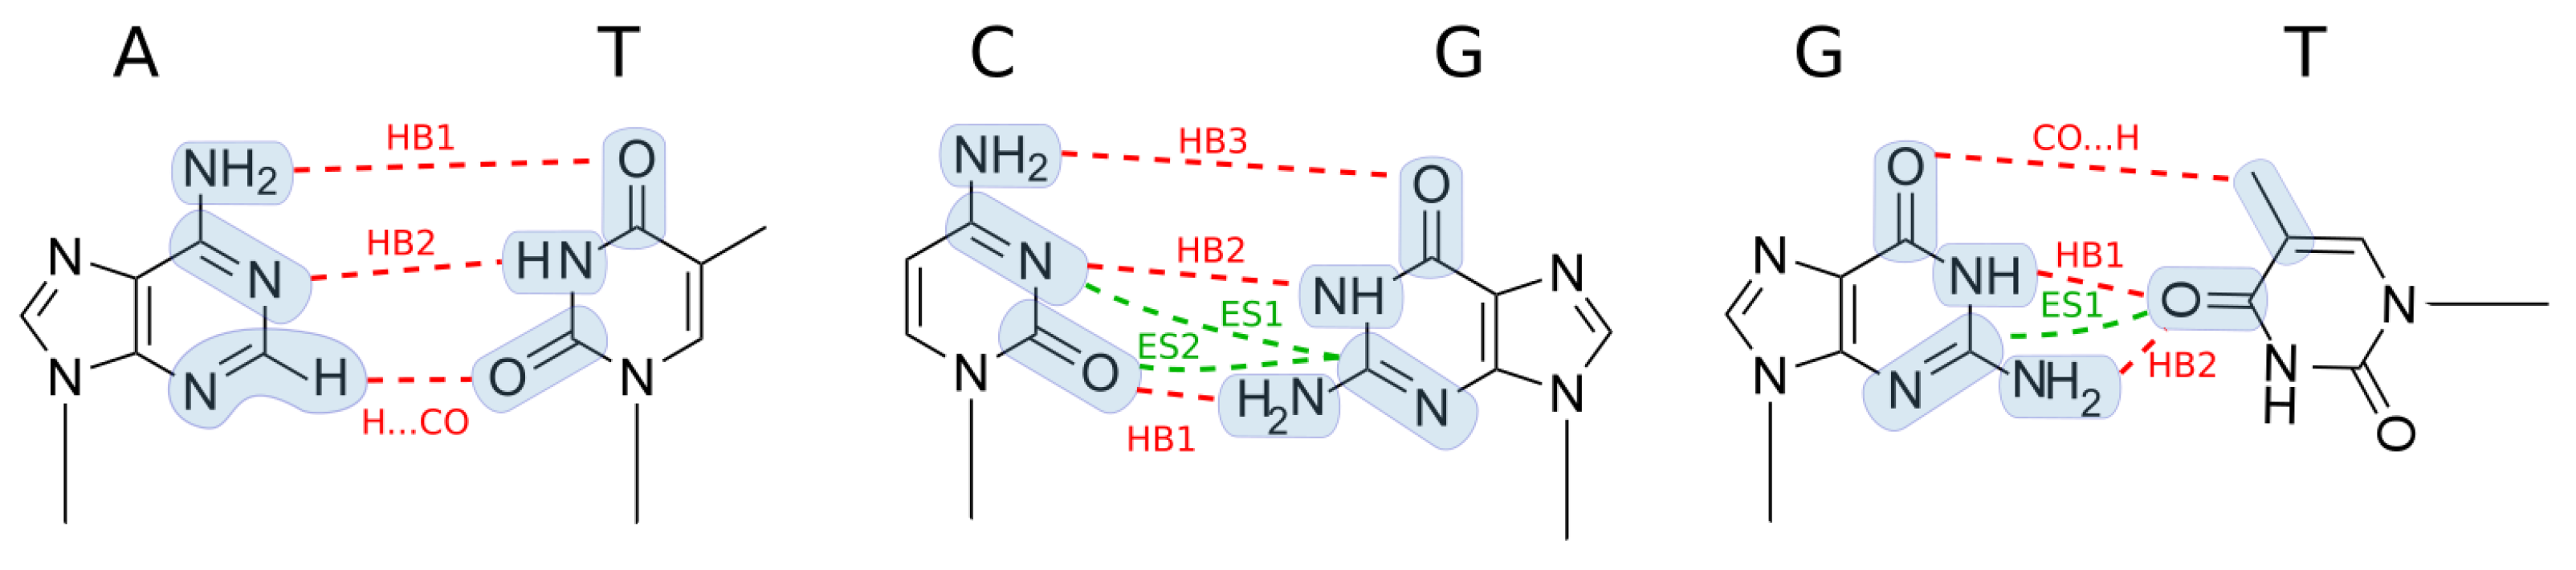
| Bond | A13:T18 | C7:G24 | G8:T23 |
|---|---|---|---|
| HB1 | |||
| HB2 | |||
| HB3 | |||
| CO⋯H | |||
| ES1 | |||
| ES2 | |||
| rest | |||
| total |
| Pair | Bond | A | B | Amber b | MP2/TRVPP c | BP86/TZ2P d | Expt. e |
|---|---|---|---|---|---|---|---|
| A13:T18 | HB1 | N6 | O4 | ||||
| HB2 | N1 | N3 | |||||
| CO⋯H | C2 | O2 | |||||
| C7:G24 | HB1 | N1 | N3 | ||||
| HB2 | O6 | N4 | |||||
| HB3 | O2 | N2 | |||||
| G8:T23 | HB1 | O4 | N1 | ||||
| HB2 | O4 | N2 | |||||
| CO⋯H | C7 | O6 |
| Embedding | Pair | Solvent | Method | Reference | C:G | A:T | G:T |
|---|---|---|---|---|---|---|---|
| none b | nucleotides | vacuum b | AMBER | this work | |||
| embedded c | nucleotides | water | M06-2X/6-31G(d,p)/PCM | [38] | |||
| embedded | nucleotides | water | FMO2-DFTB3/PCM | this work | |||
| none | bases | vacuum | AMBER (parameters of Ref. [55]) | [36] | |||
| none b | bases | vacuum b | AMBER | this work | |||
| none | bases | vacuum | CNDO-CI | [41] | |||
| none | bases | vacuum | B3LYP/6-31G ** | [35] | |||
| none | bases | vacuum | B3LYP/D95 ** | [37] | |||
| none | bases | vacuum | RI-MP2/a[TQ]Z d | [35,39] | |||
| none | bases | vacuum | MP2/D95 ** | [37] | |||
| none | bases | vacuum | IQA/M06-2X e | [40] | |||
| embedded | bases | water f | FMO2-MP2/6-31G * | [46] | −51 g | ||
| embedded | bases | vacuum | FMO2-MP3/CP/MCP/dzp | [47] | |||
| embedded | bases | vacuum | FMO2-CCSD(T)/MCP/dzp | [47] | |||
| embedded | bases | water | FMO2-DFTB3/PCM | this work | |||
| none | bases h | none | Experiment(enthalpy) | [42] | |||
| none | bases | none | Experiment(enthalpy) | [43] |
| Graph 1 | Graph 2 | All | nuc–nuc | nuc–aa | aa–aa | |
|---|---|---|---|---|---|---|
| FMO solution frag | PA solution res | MI | 0.1004 | 0.5269 | 0.0754 | 0.1040 |
| 0.4009 | 0.9268 | 0.5794 | 0.3728 | |||
| 0.4207 | 0.9432 | 0.6592 | 0.3872 | |||
| FMO solution frag | PA solution frag | MI | 0.1647 | 0.5249 | 0.0868 | 0.1813 |
| 0.6666 | 0.9271 | 0.7873 | 0.6491 | |||
| 0.6899 | 0.9397 | 0.7592 | 0.6748 | |||
| PA solution res | MM solute res | MI | 0.0684 | 0.1669 | 0.0604 | 0.0859 |
| 0.0868 | 0.2233 | 0.0500 | 0.1315 | |||
| 0.2732 | 0.2936 | 0.4643 | 0.3079 | |||
| FMO solution frag | MM solute res | MI | 0.0459 | 0.1672 | 0.0486 | 0.0548 |
| 0.0582 | 0.2236 | 0.0402 | 0.0838 | |||
| 0.1922 | 0.2993 | 0.4249 | 0.2039 |
Publisher’s Note: MDPI stays neutral with regard to jurisdictional claims in published maps and institutional affiliations. |
© 2022 by the authors. Licensee MDPI, Basel, Switzerland. This article is an open access article distributed under the terms and conditions of the Creative Commons Attribution (CC BY) license (https://creativecommons.org/licenses/by/4.0/).
Share and Cite
Sladek, V.; Fedorov, D.G. The Importance of Charge Transfer and Solvent Screening in the Interactions of Backbones and Functional Groups in Amino Acid Residues and Nucleotides. Int. J. Mol. Sci. 2022, 23, 13514. https://doi.org/10.3390/ijms232113514
Sladek V, Fedorov DG. The Importance of Charge Transfer and Solvent Screening in the Interactions of Backbones and Functional Groups in Amino Acid Residues and Nucleotides. International Journal of Molecular Sciences. 2022; 23(21):13514. https://doi.org/10.3390/ijms232113514
Chicago/Turabian StyleSladek, Vladimir, and Dmitri G. Fedorov. 2022. "The Importance of Charge Transfer and Solvent Screening in the Interactions of Backbones and Functional Groups in Amino Acid Residues and Nucleotides" International Journal of Molecular Sciences 23, no. 21: 13514. https://doi.org/10.3390/ijms232113514