
Micro-RNAs in Response to Active Forms of Vitamin D3 in Human Leukemia and Lymphoma Cells

 , , , , , , and
Abstract
:
1. Introduction
2. Results
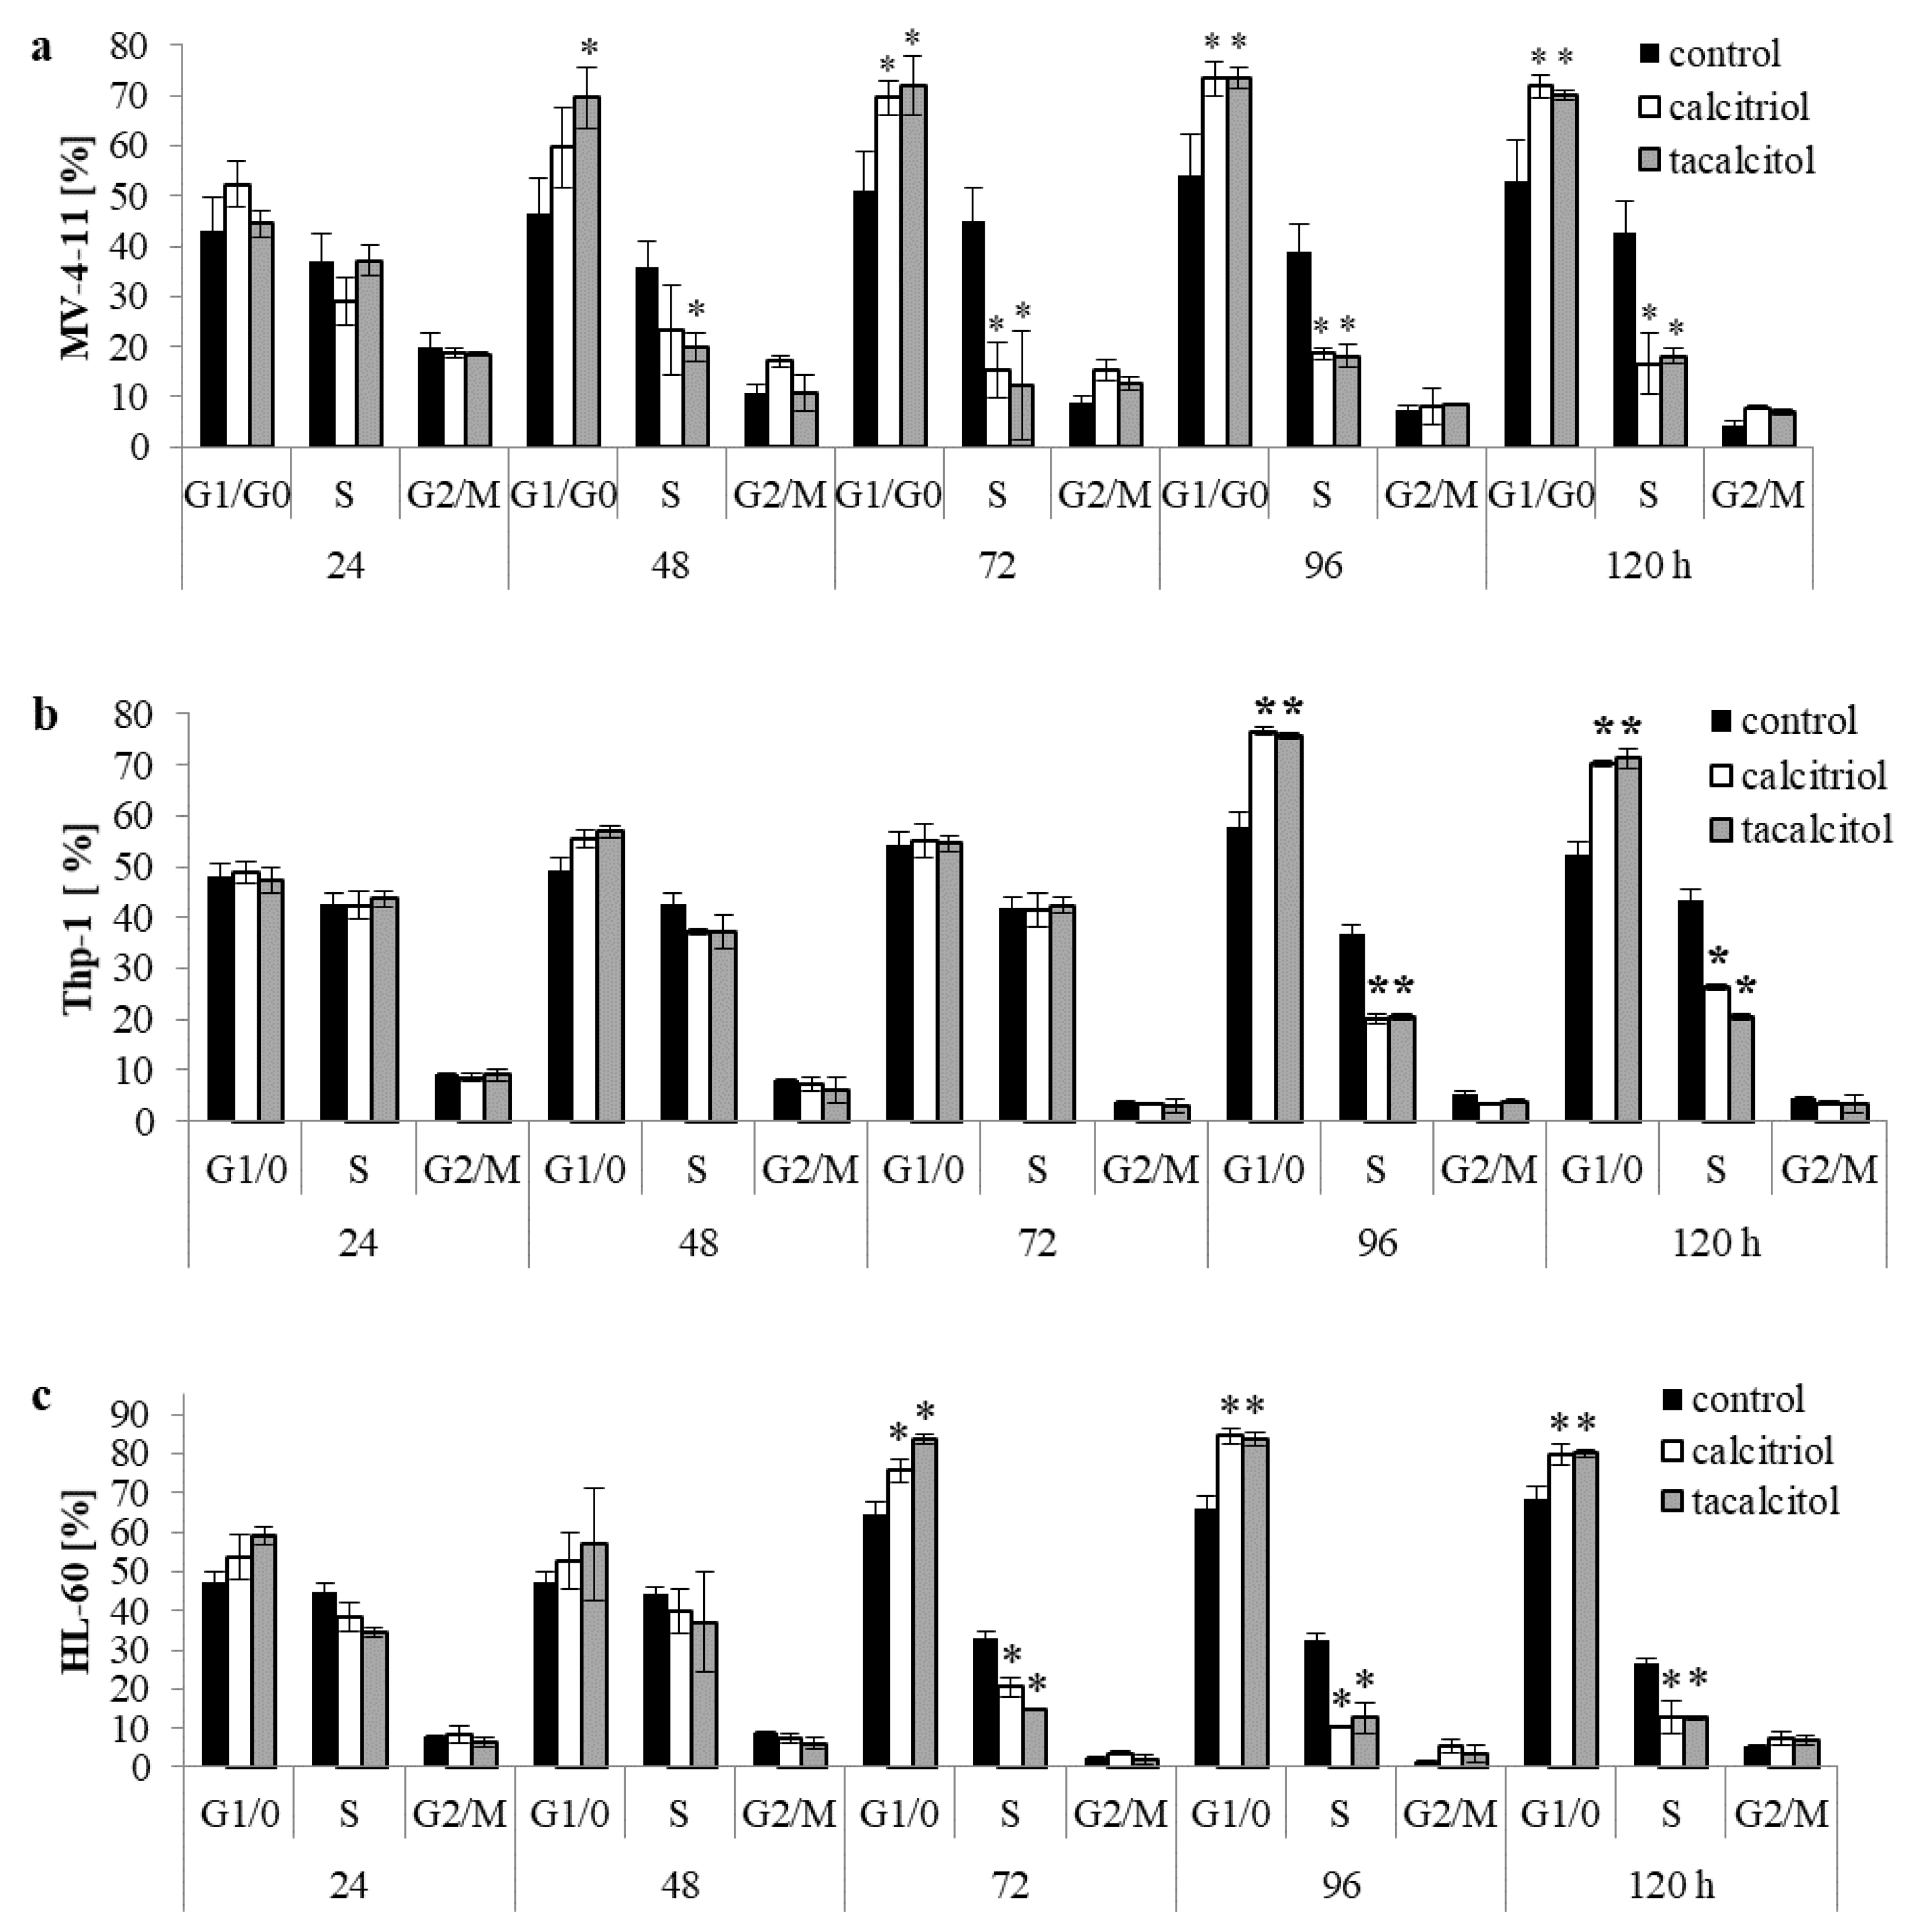
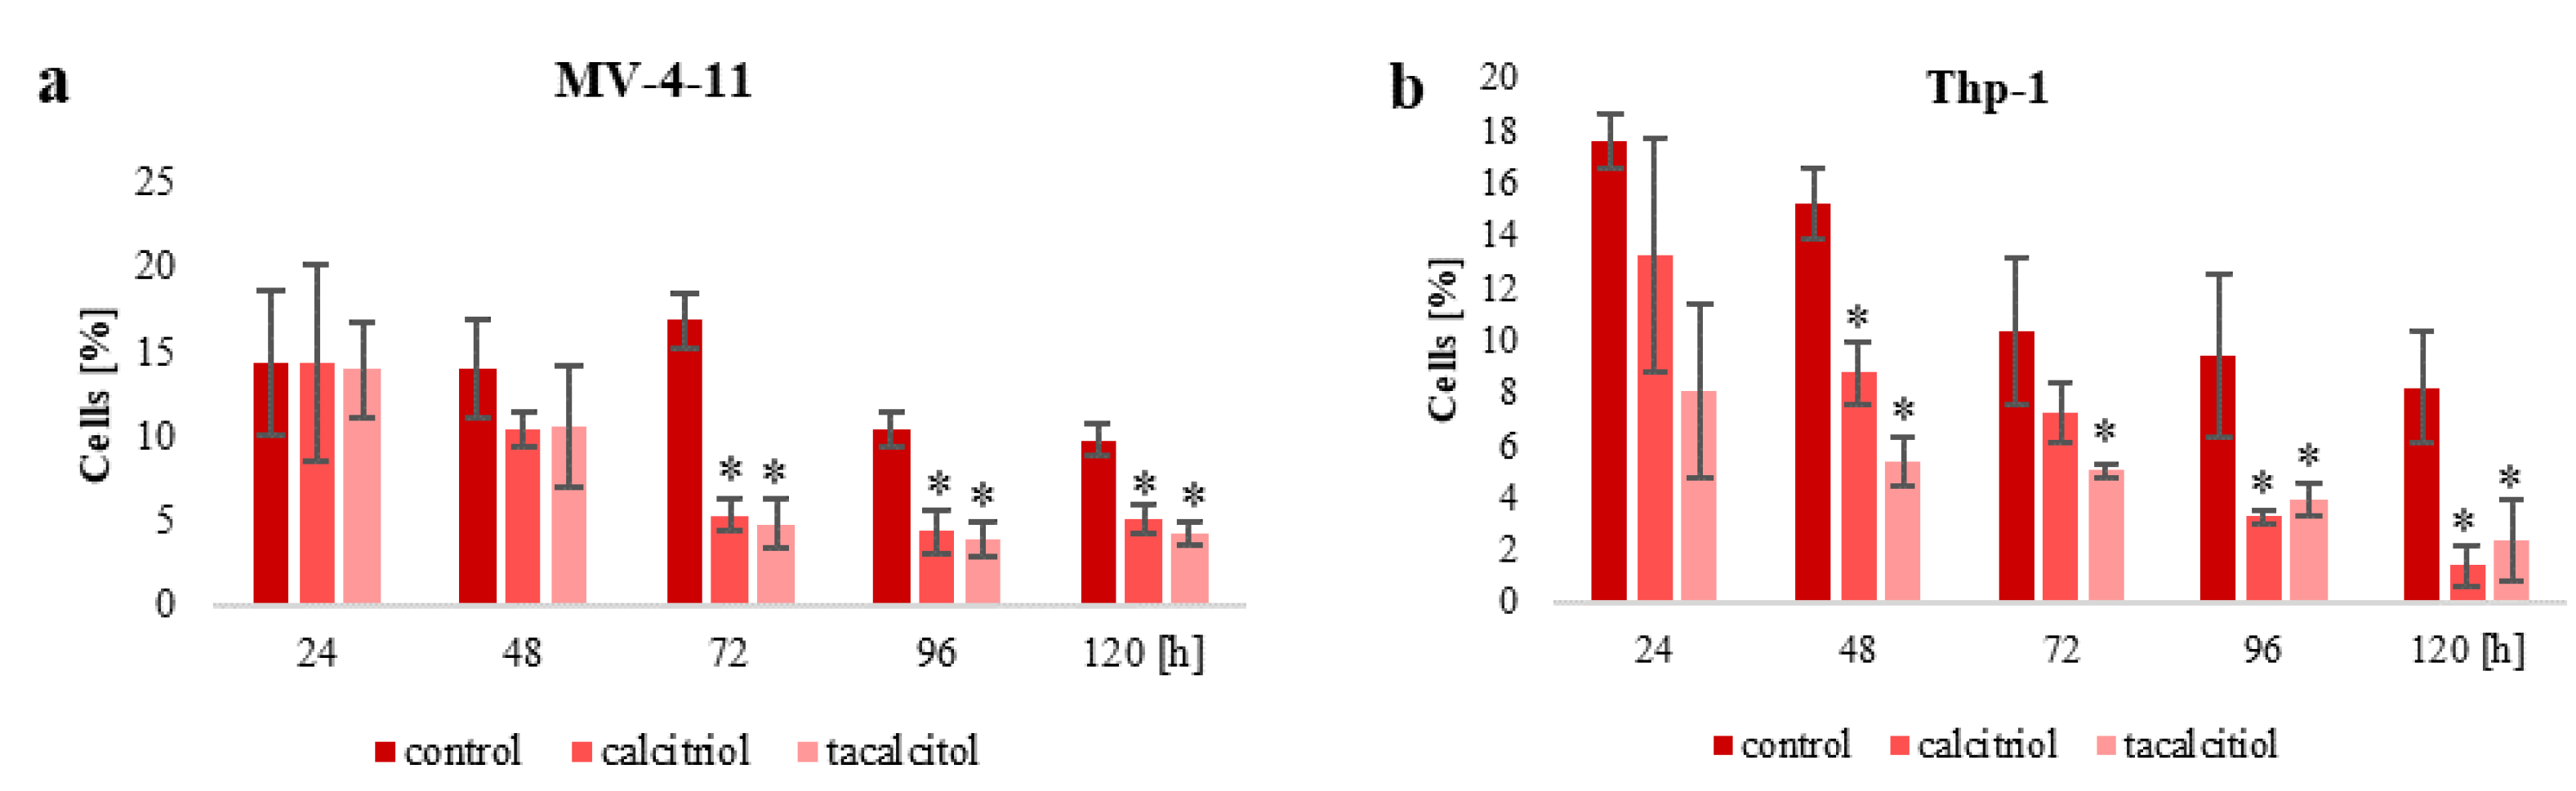
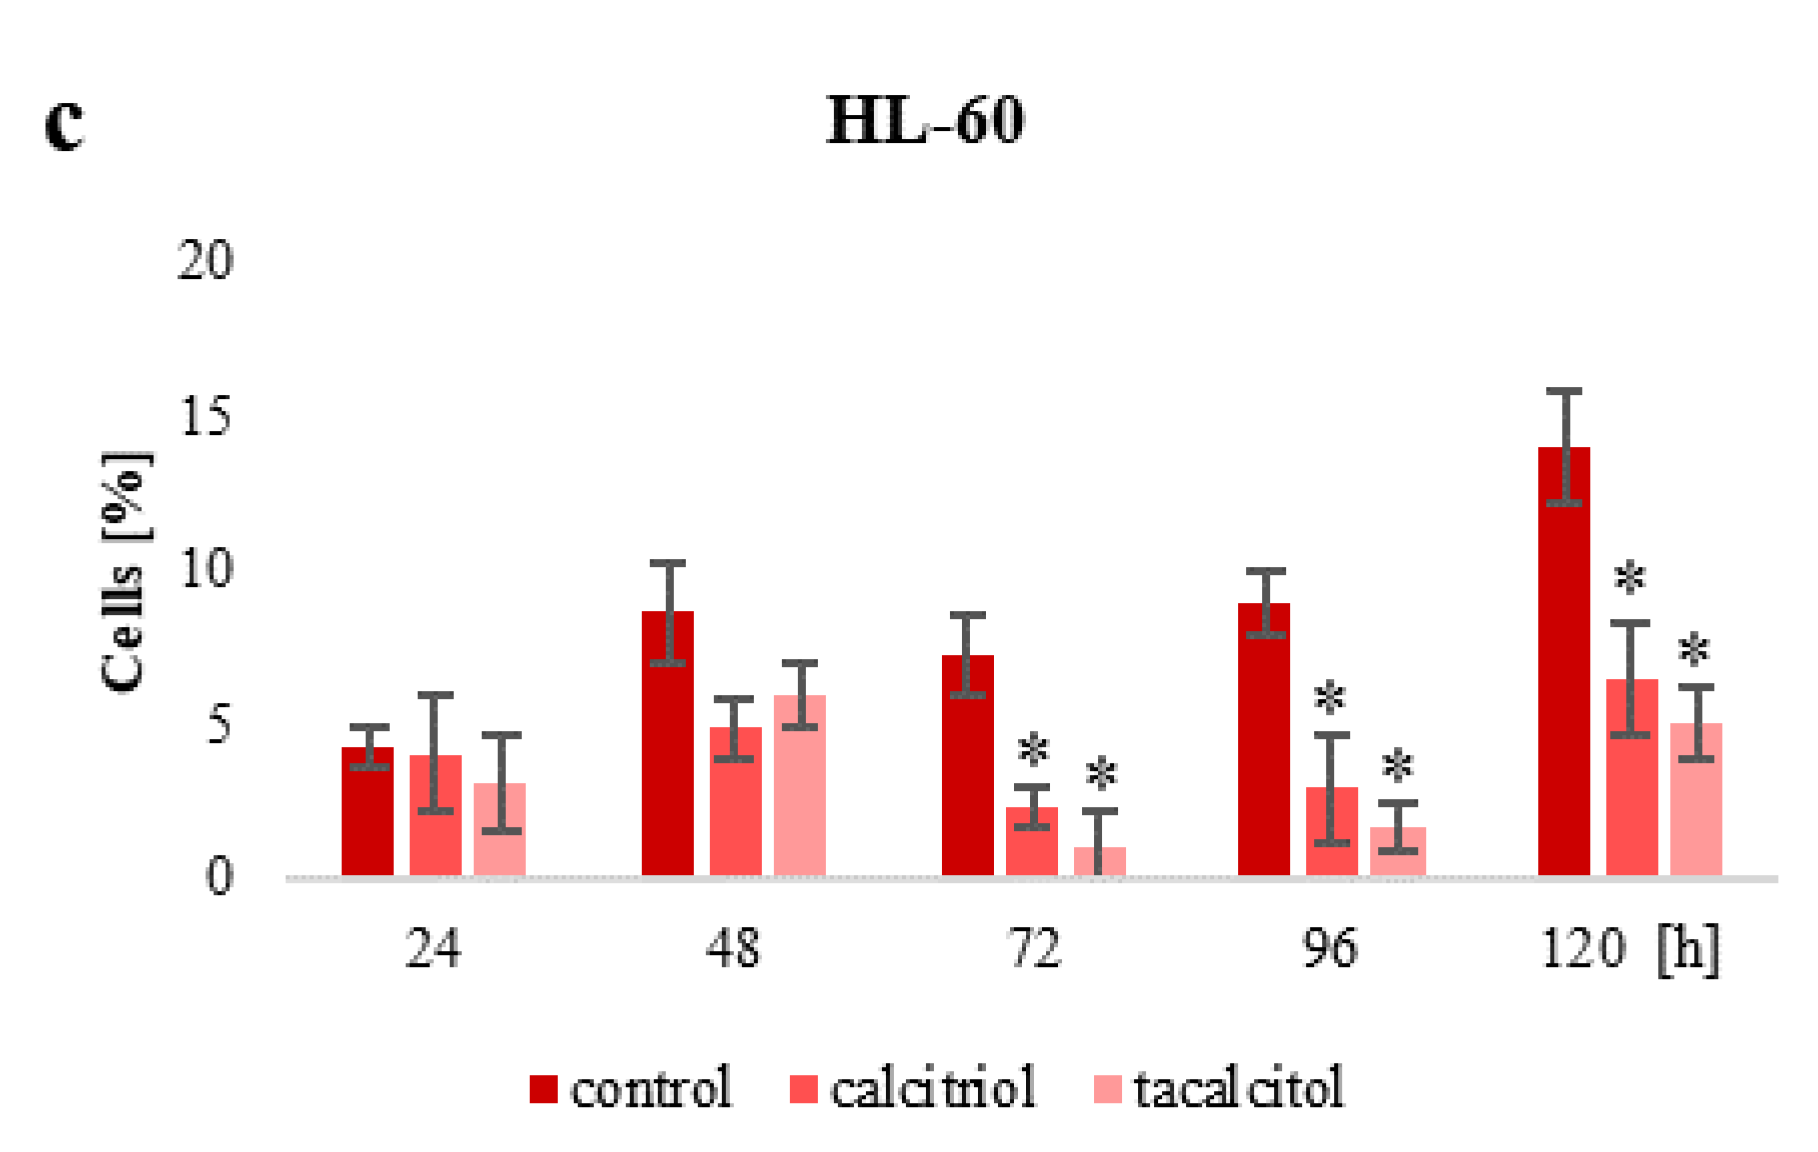
2.1. Calcitriol and Tacalcitol Effect on the Cell Cycle in Human Leukemia and Lymphoma
2.2. Population of Aneuploid Cells and Response to Calcitriol and Tacalcitol
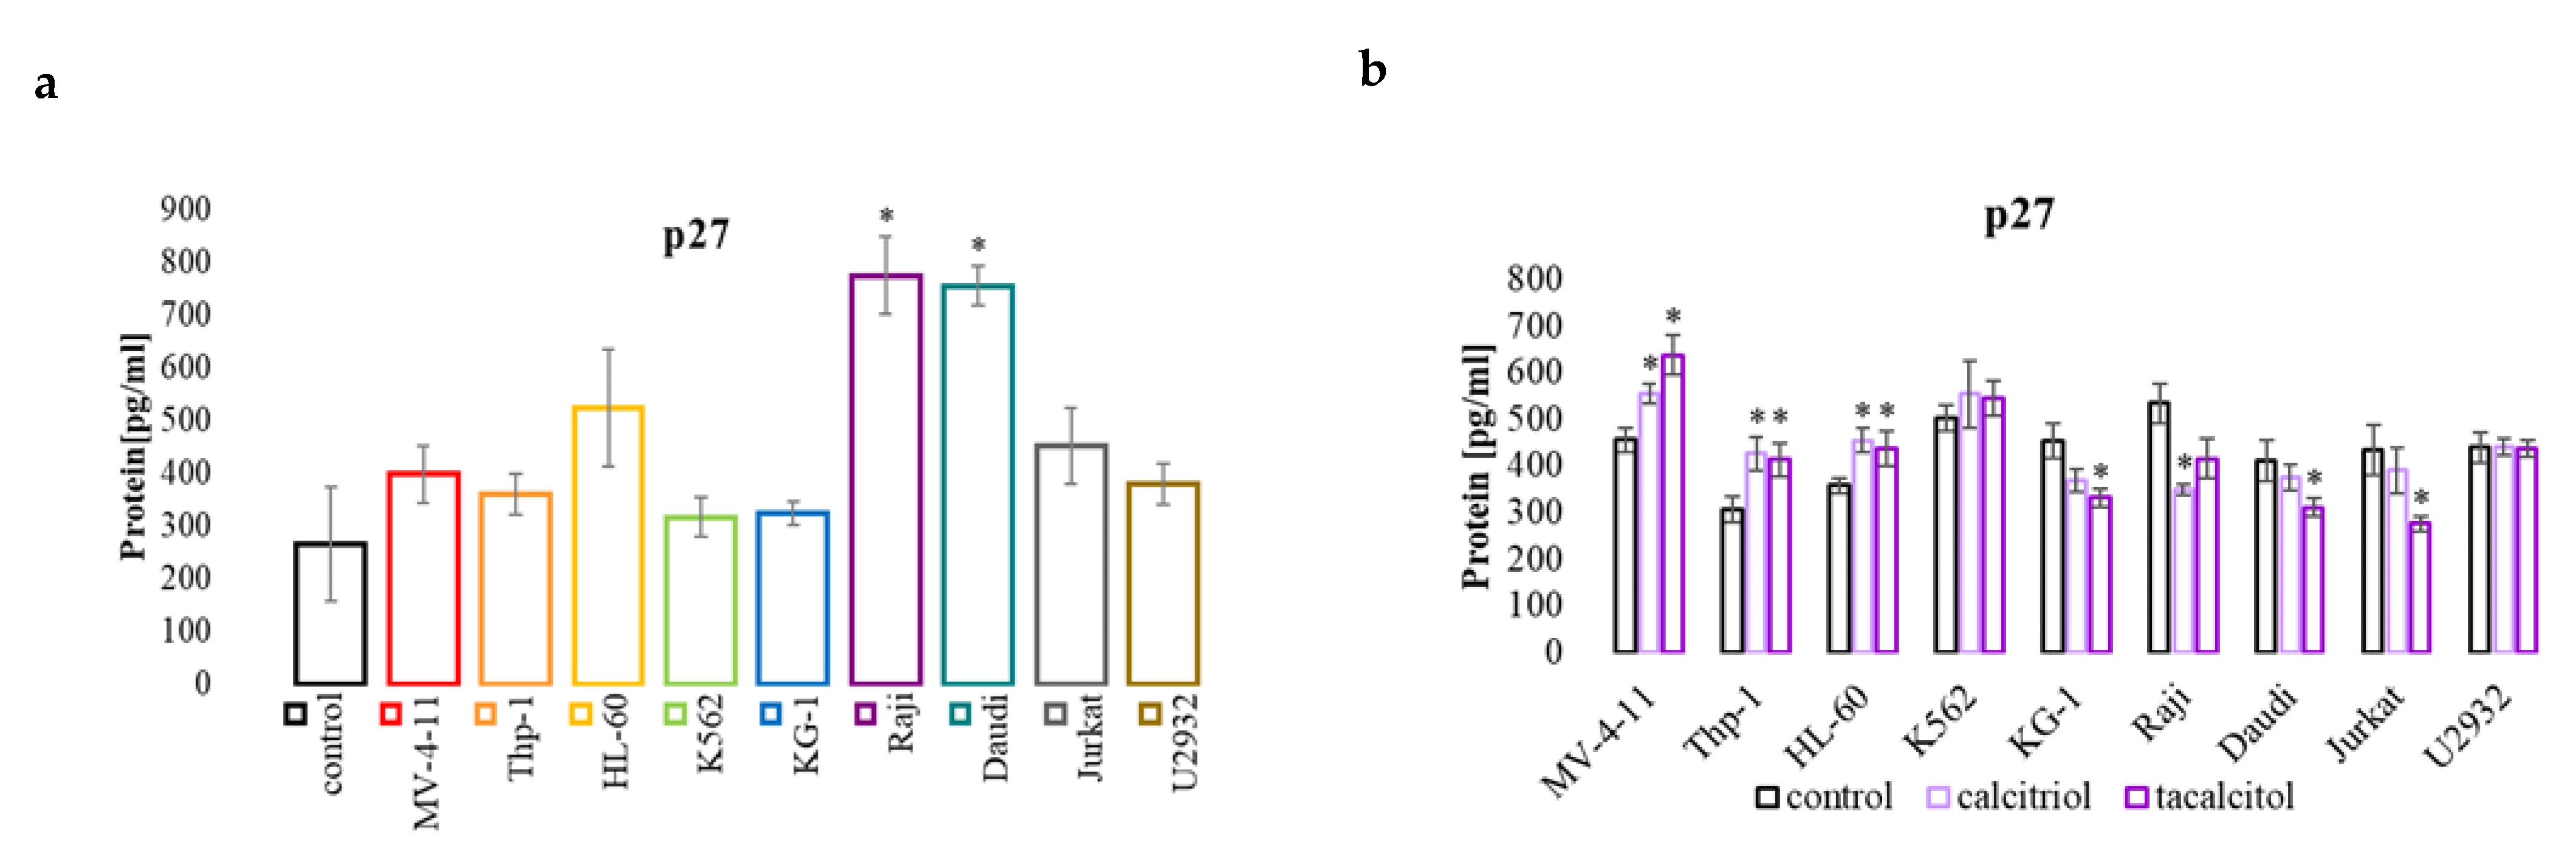
2.3. miR-181b and p27 Protein Involved in Cell Cycle
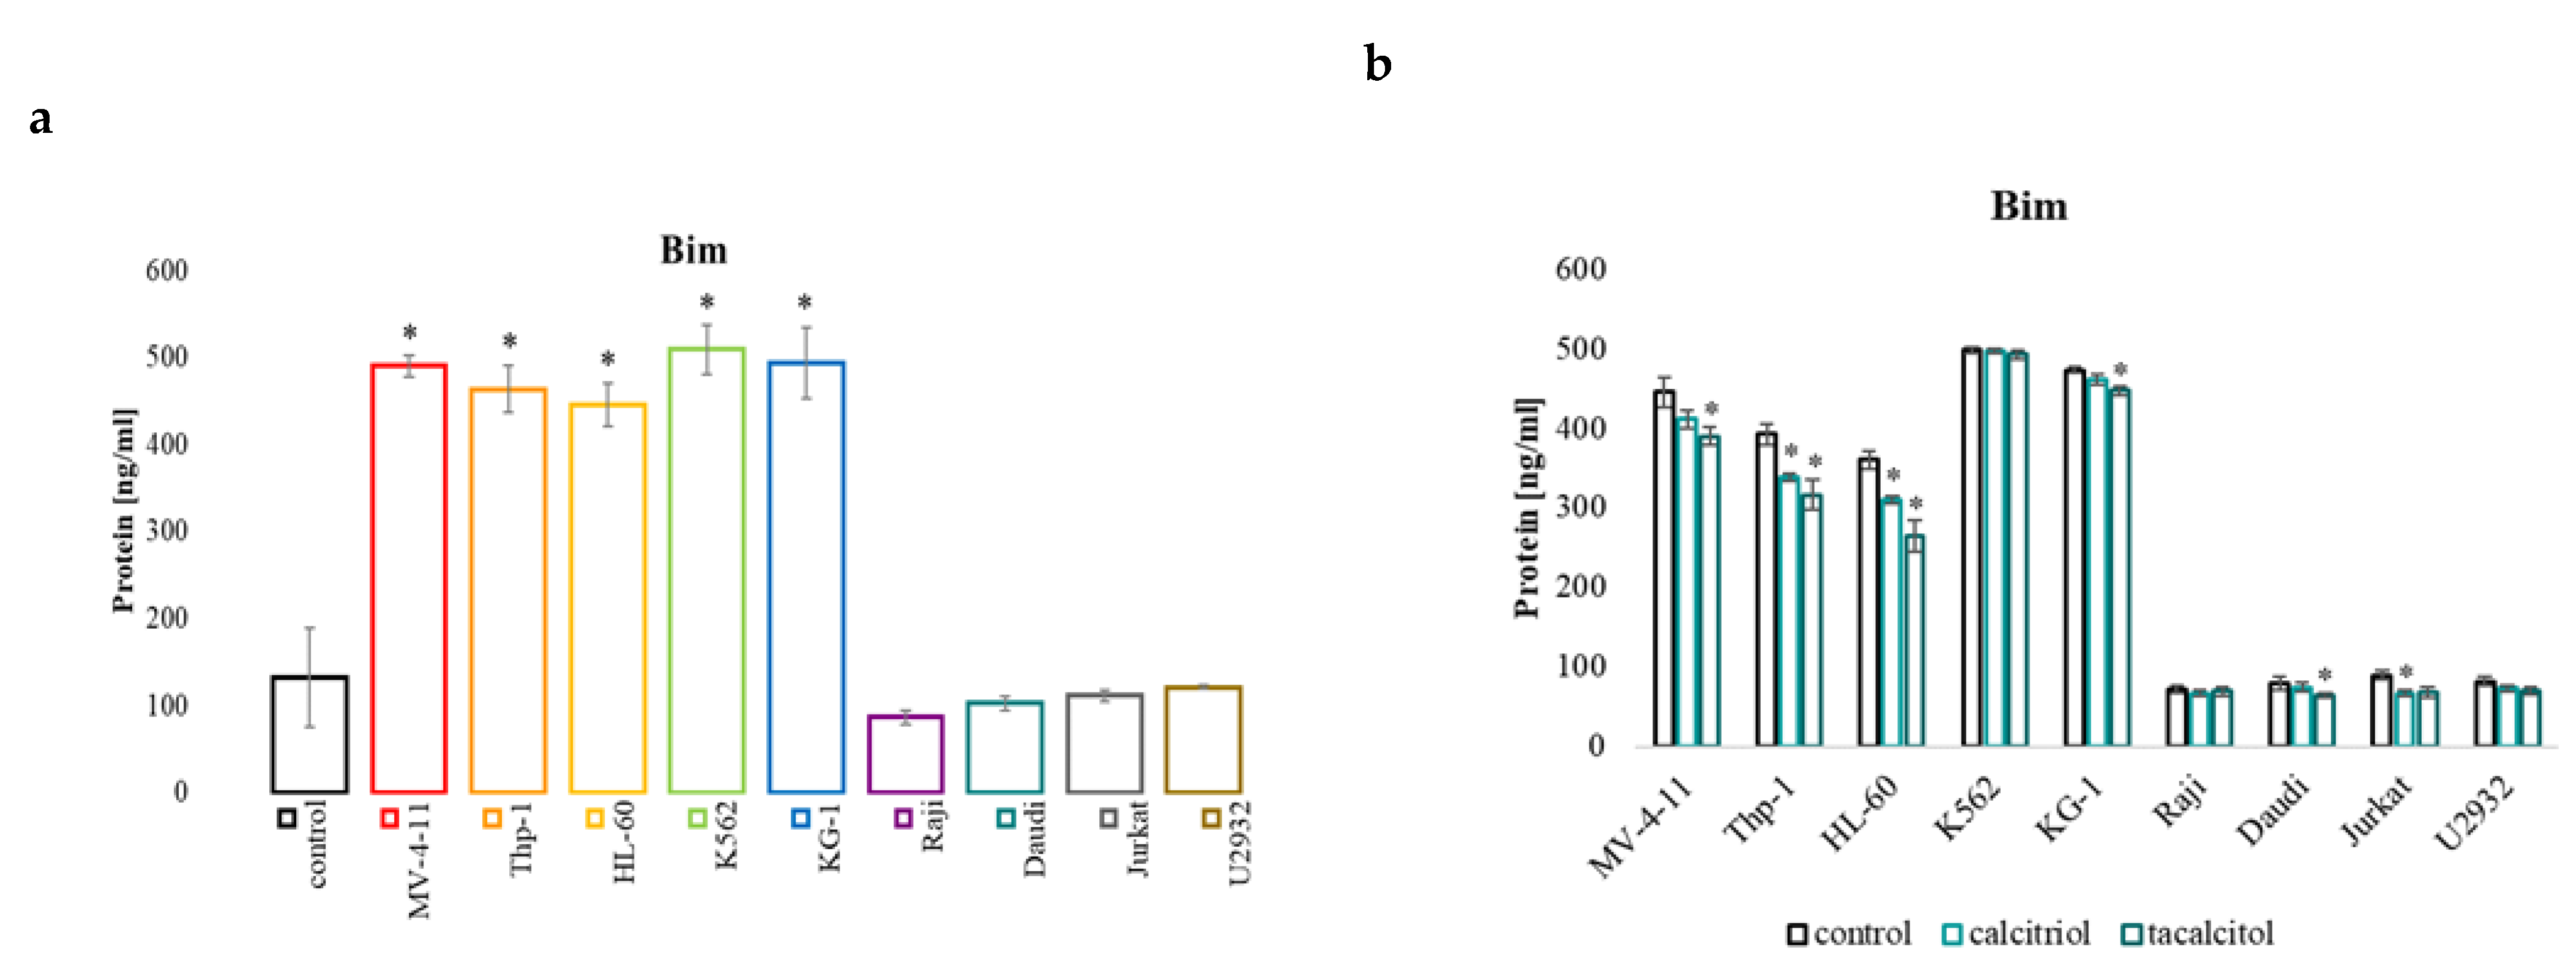
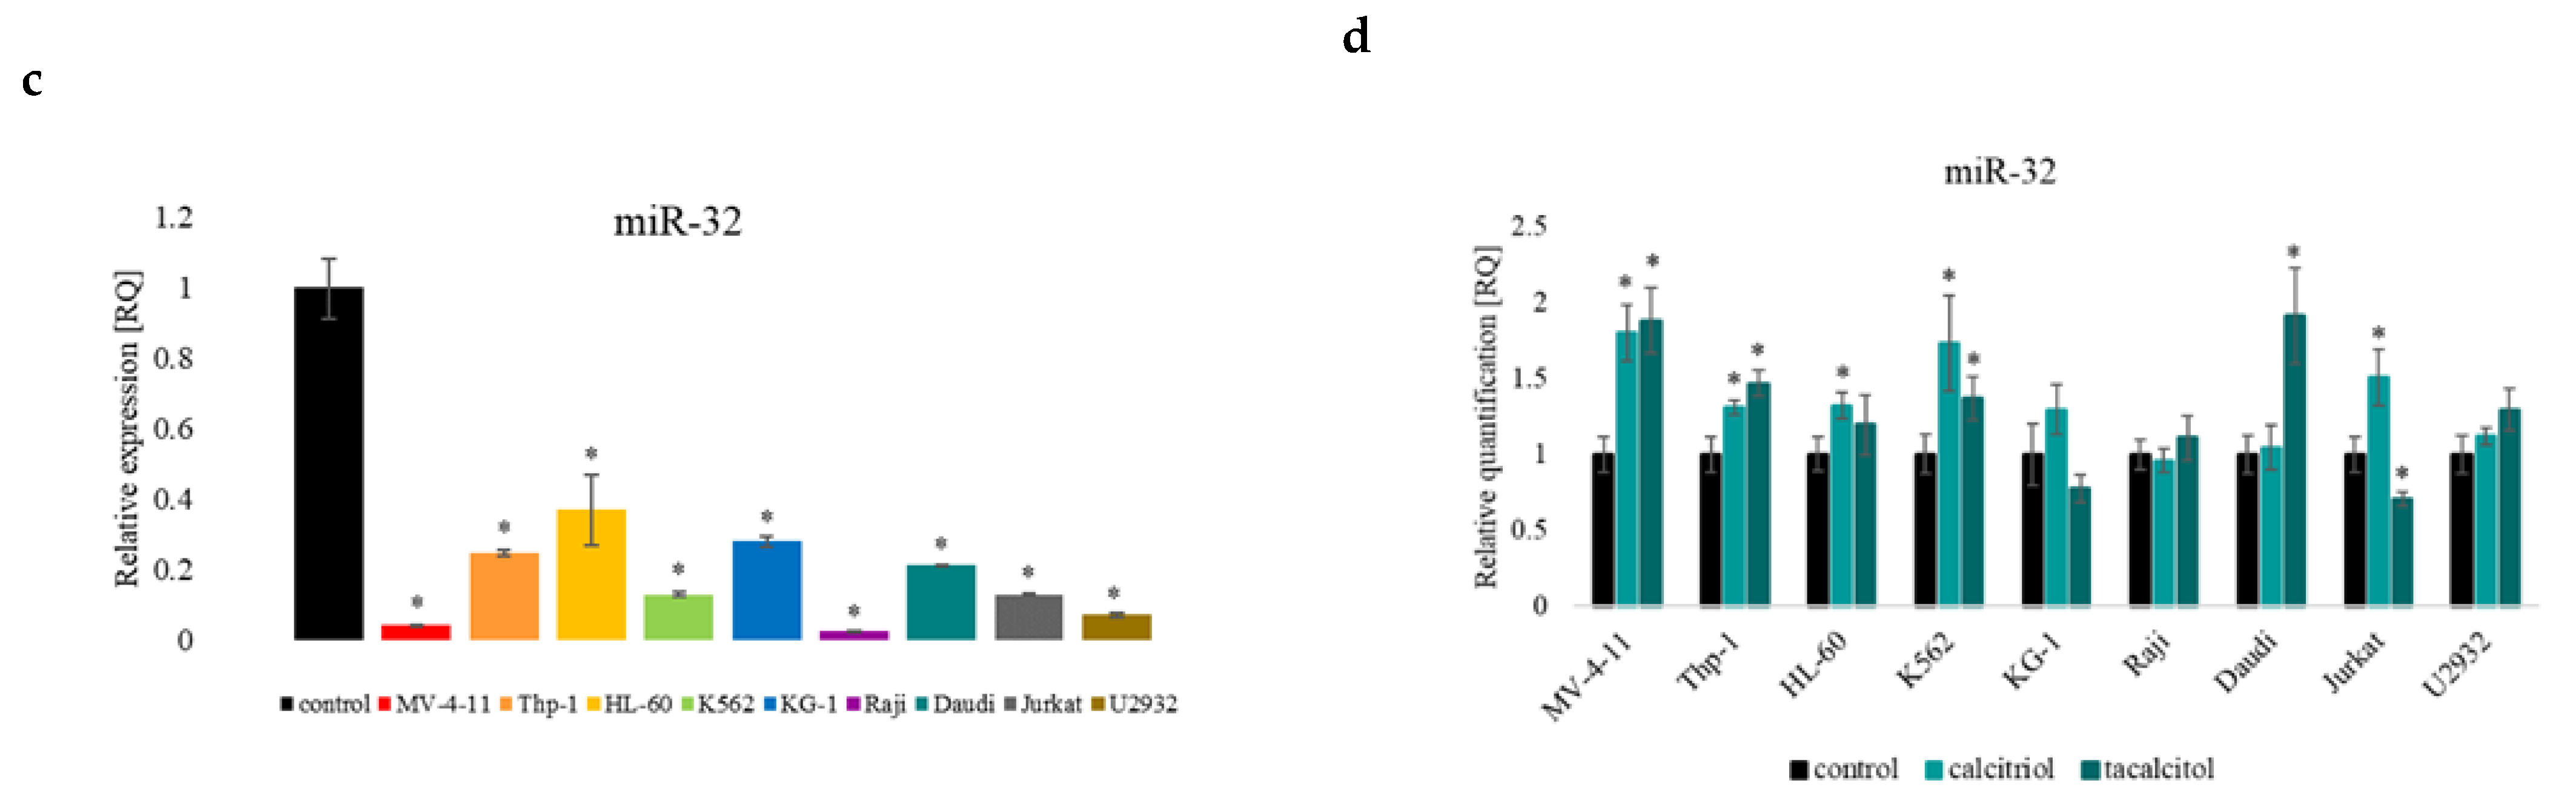
2.4. miR-32b and Pro-Apoptotic Bim Protein
2.5. miR-125b and Regulated Proteins: Pro-Apoptotic Protein Bak1, NFκB, and p53, and CYP24A1
2.5.1. miR-125b
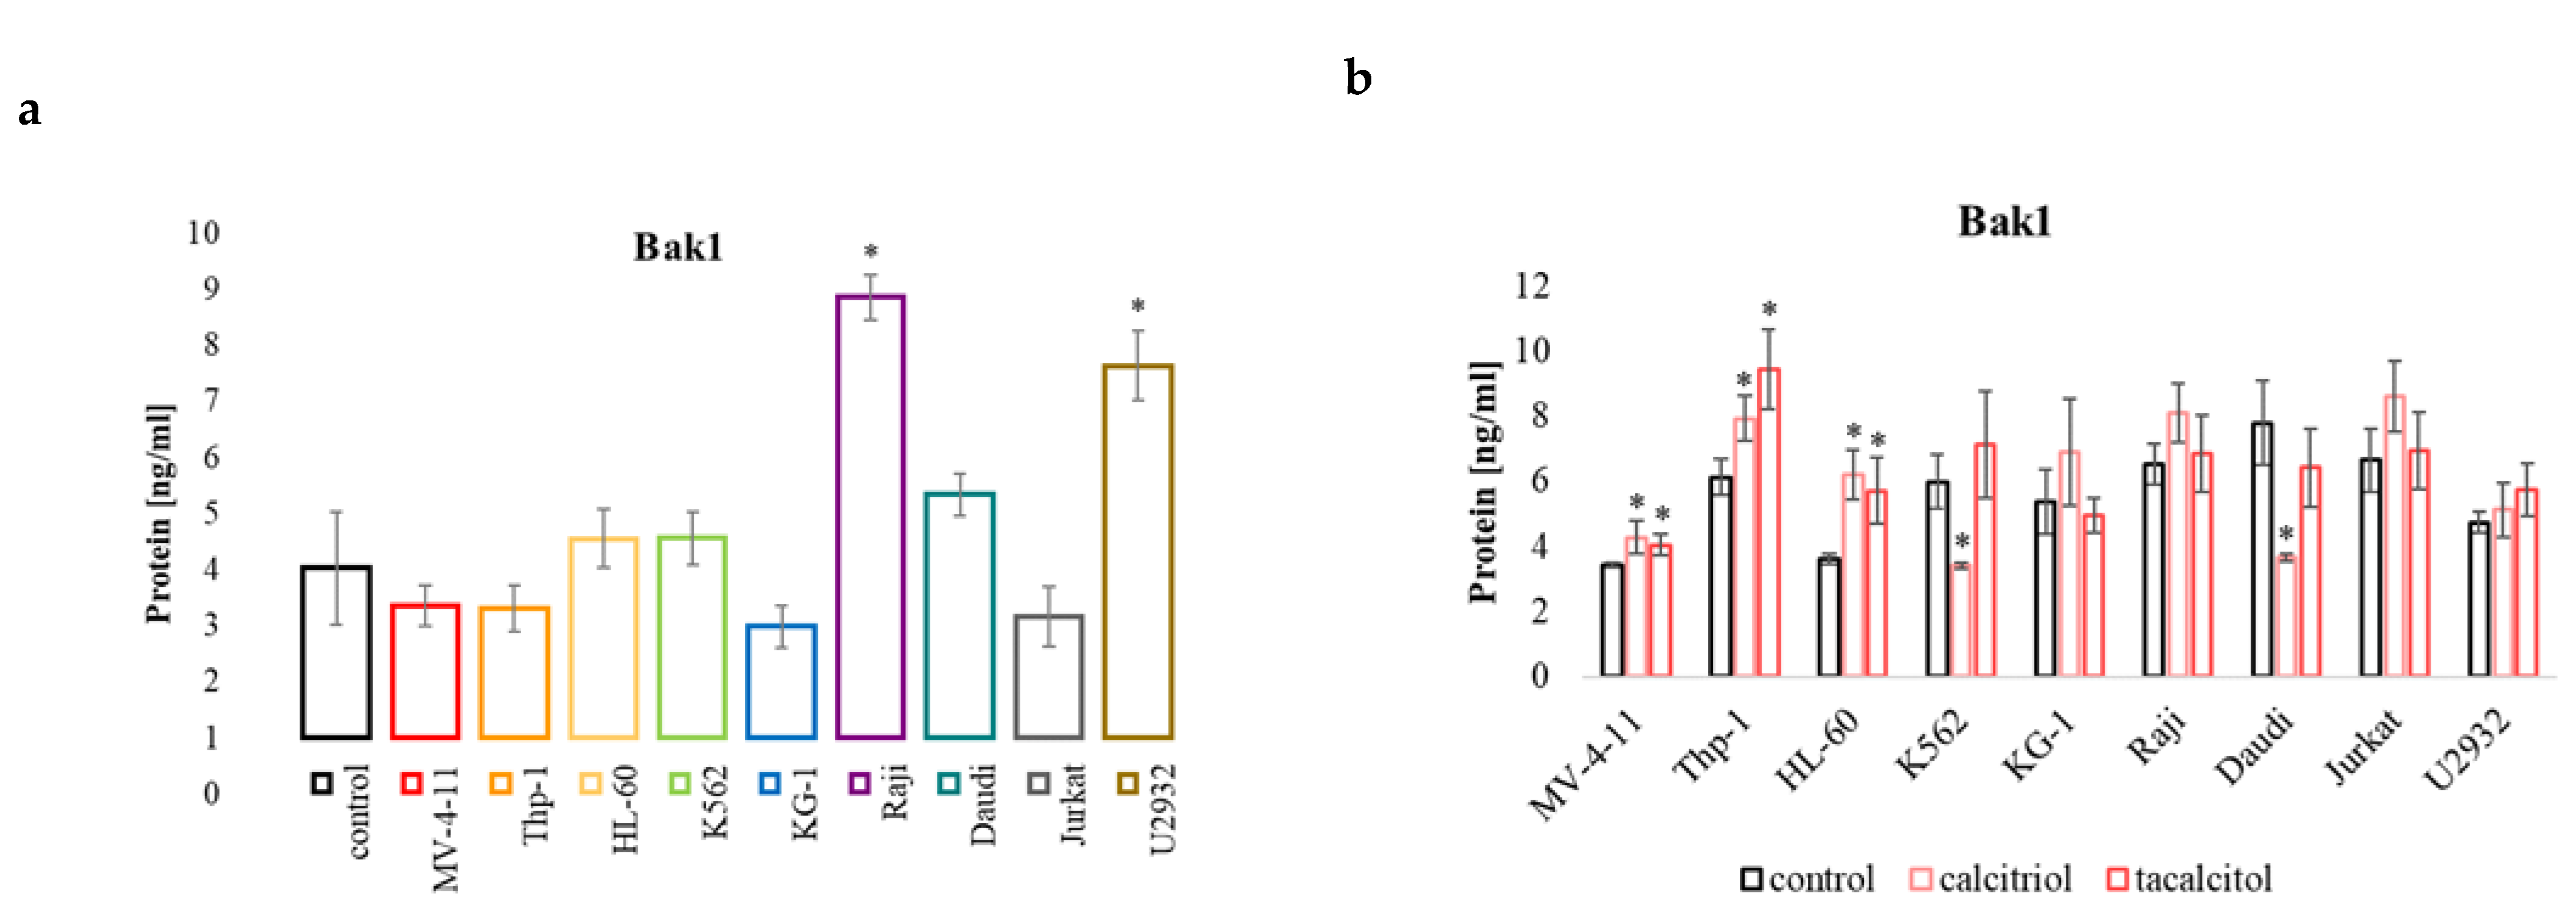
2.5.2. Bak1
2.5.3. NFκB Protein
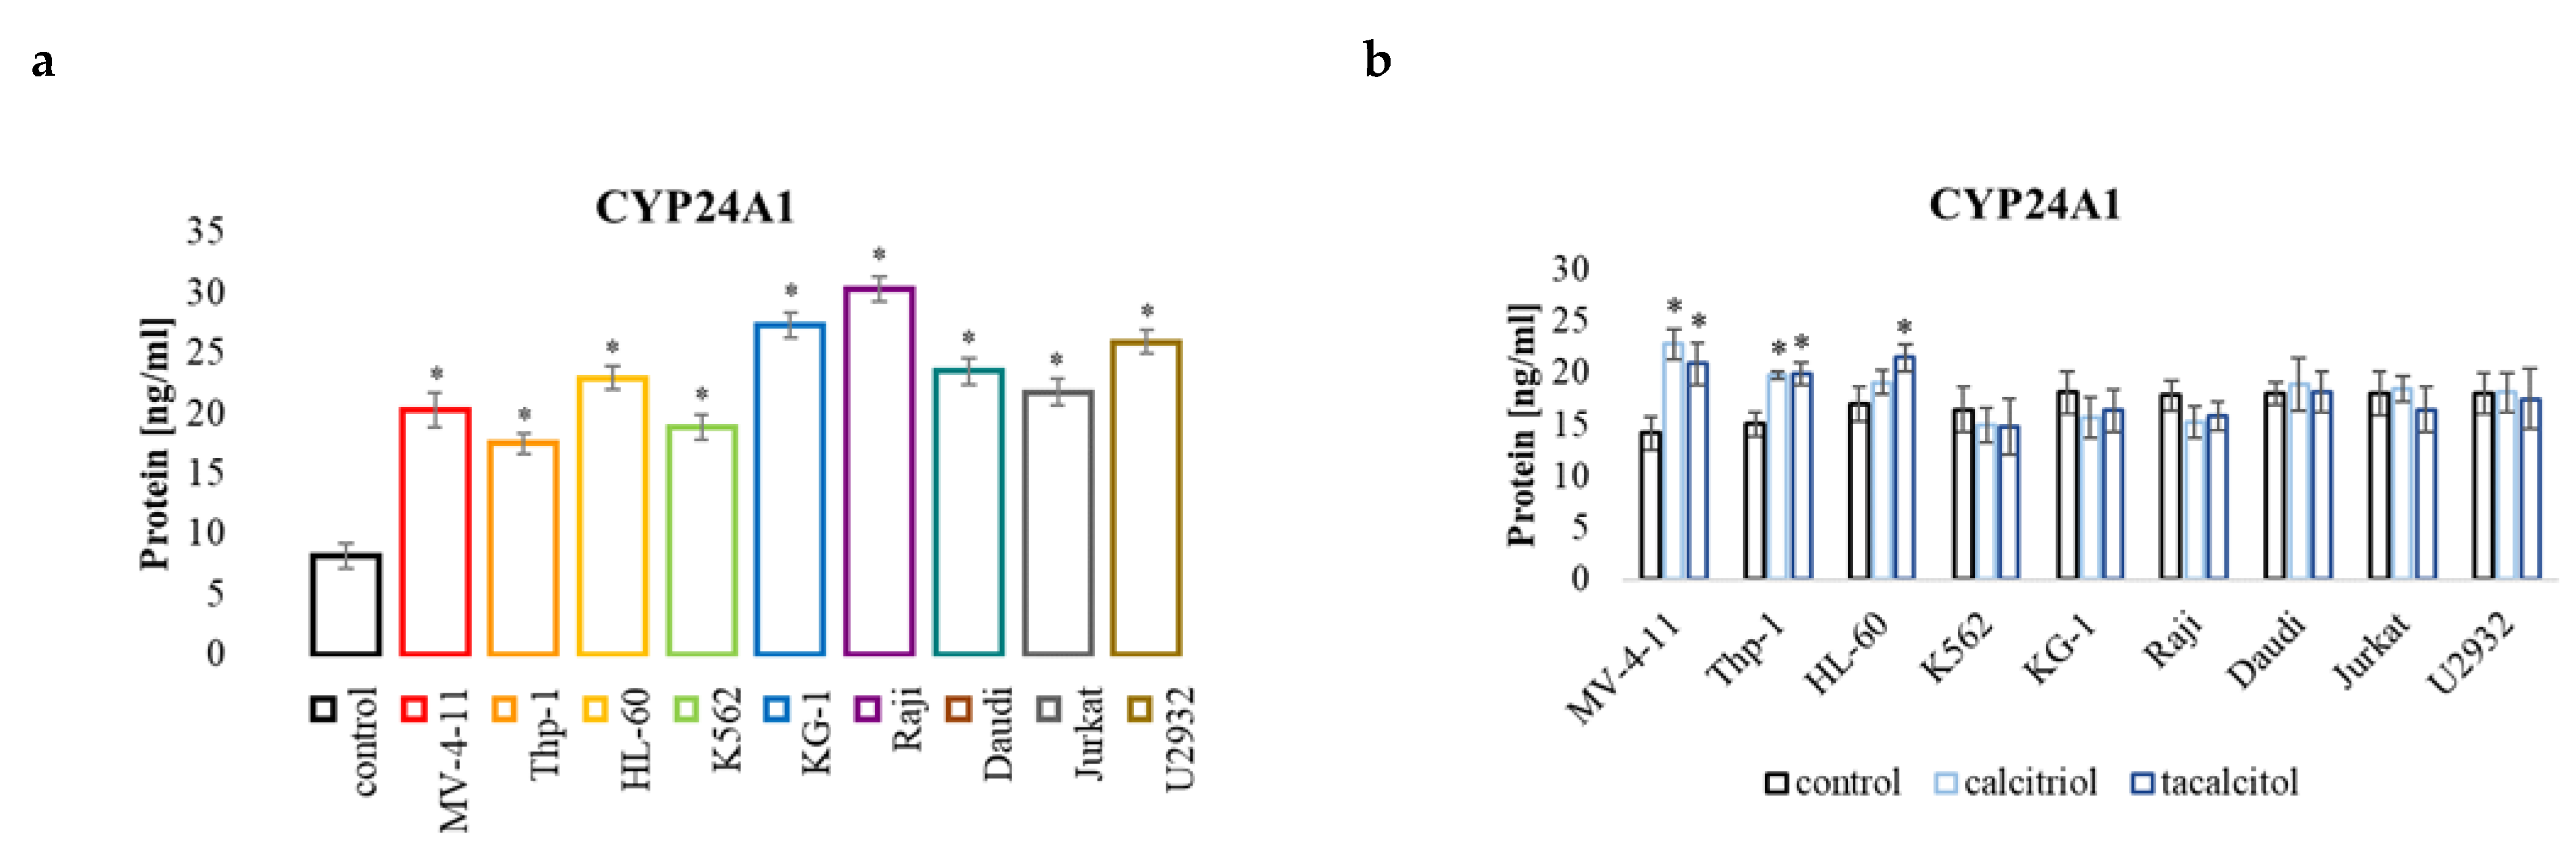
2.5.4. CYP24A1
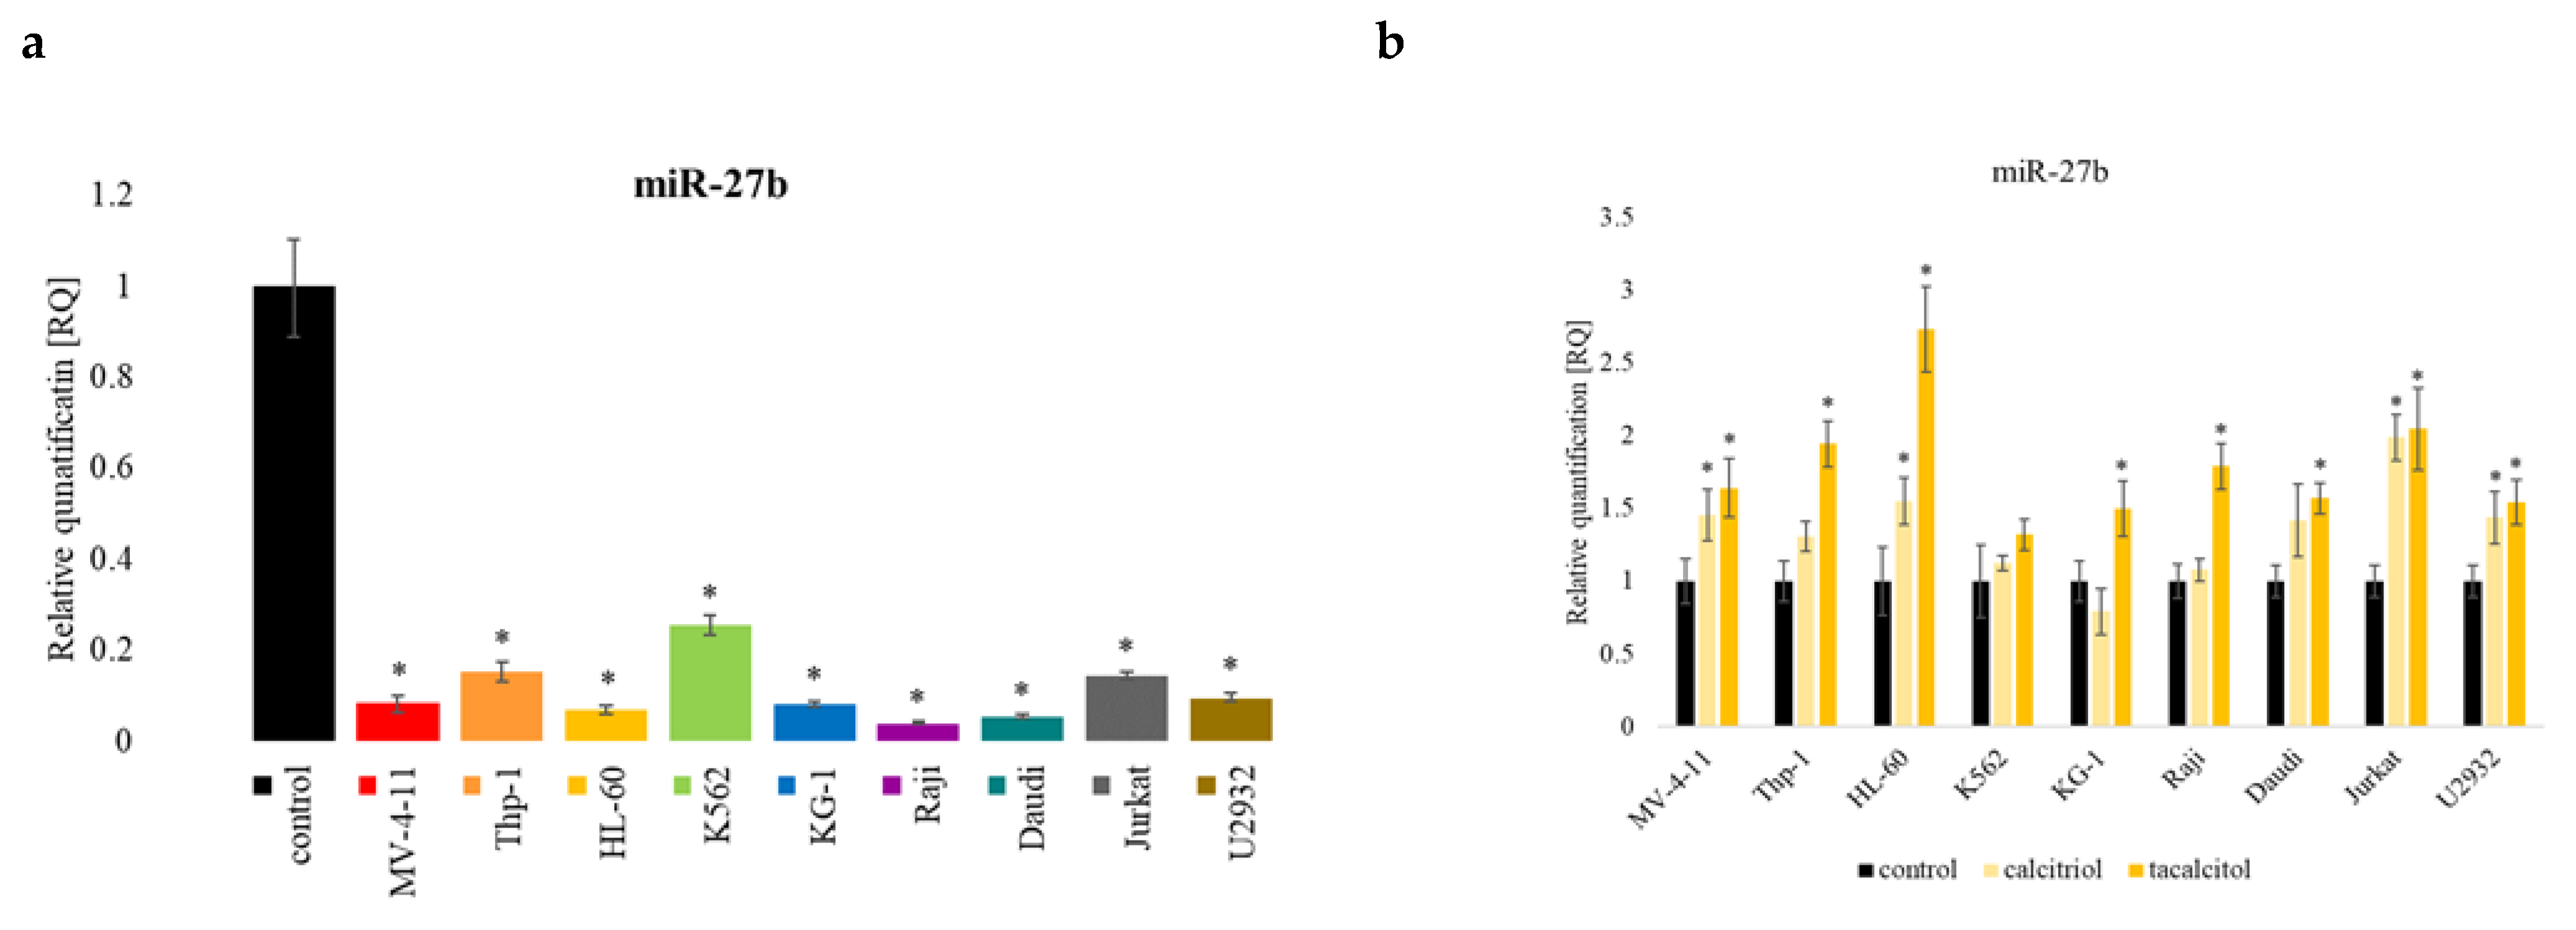
2.6. miR-27b
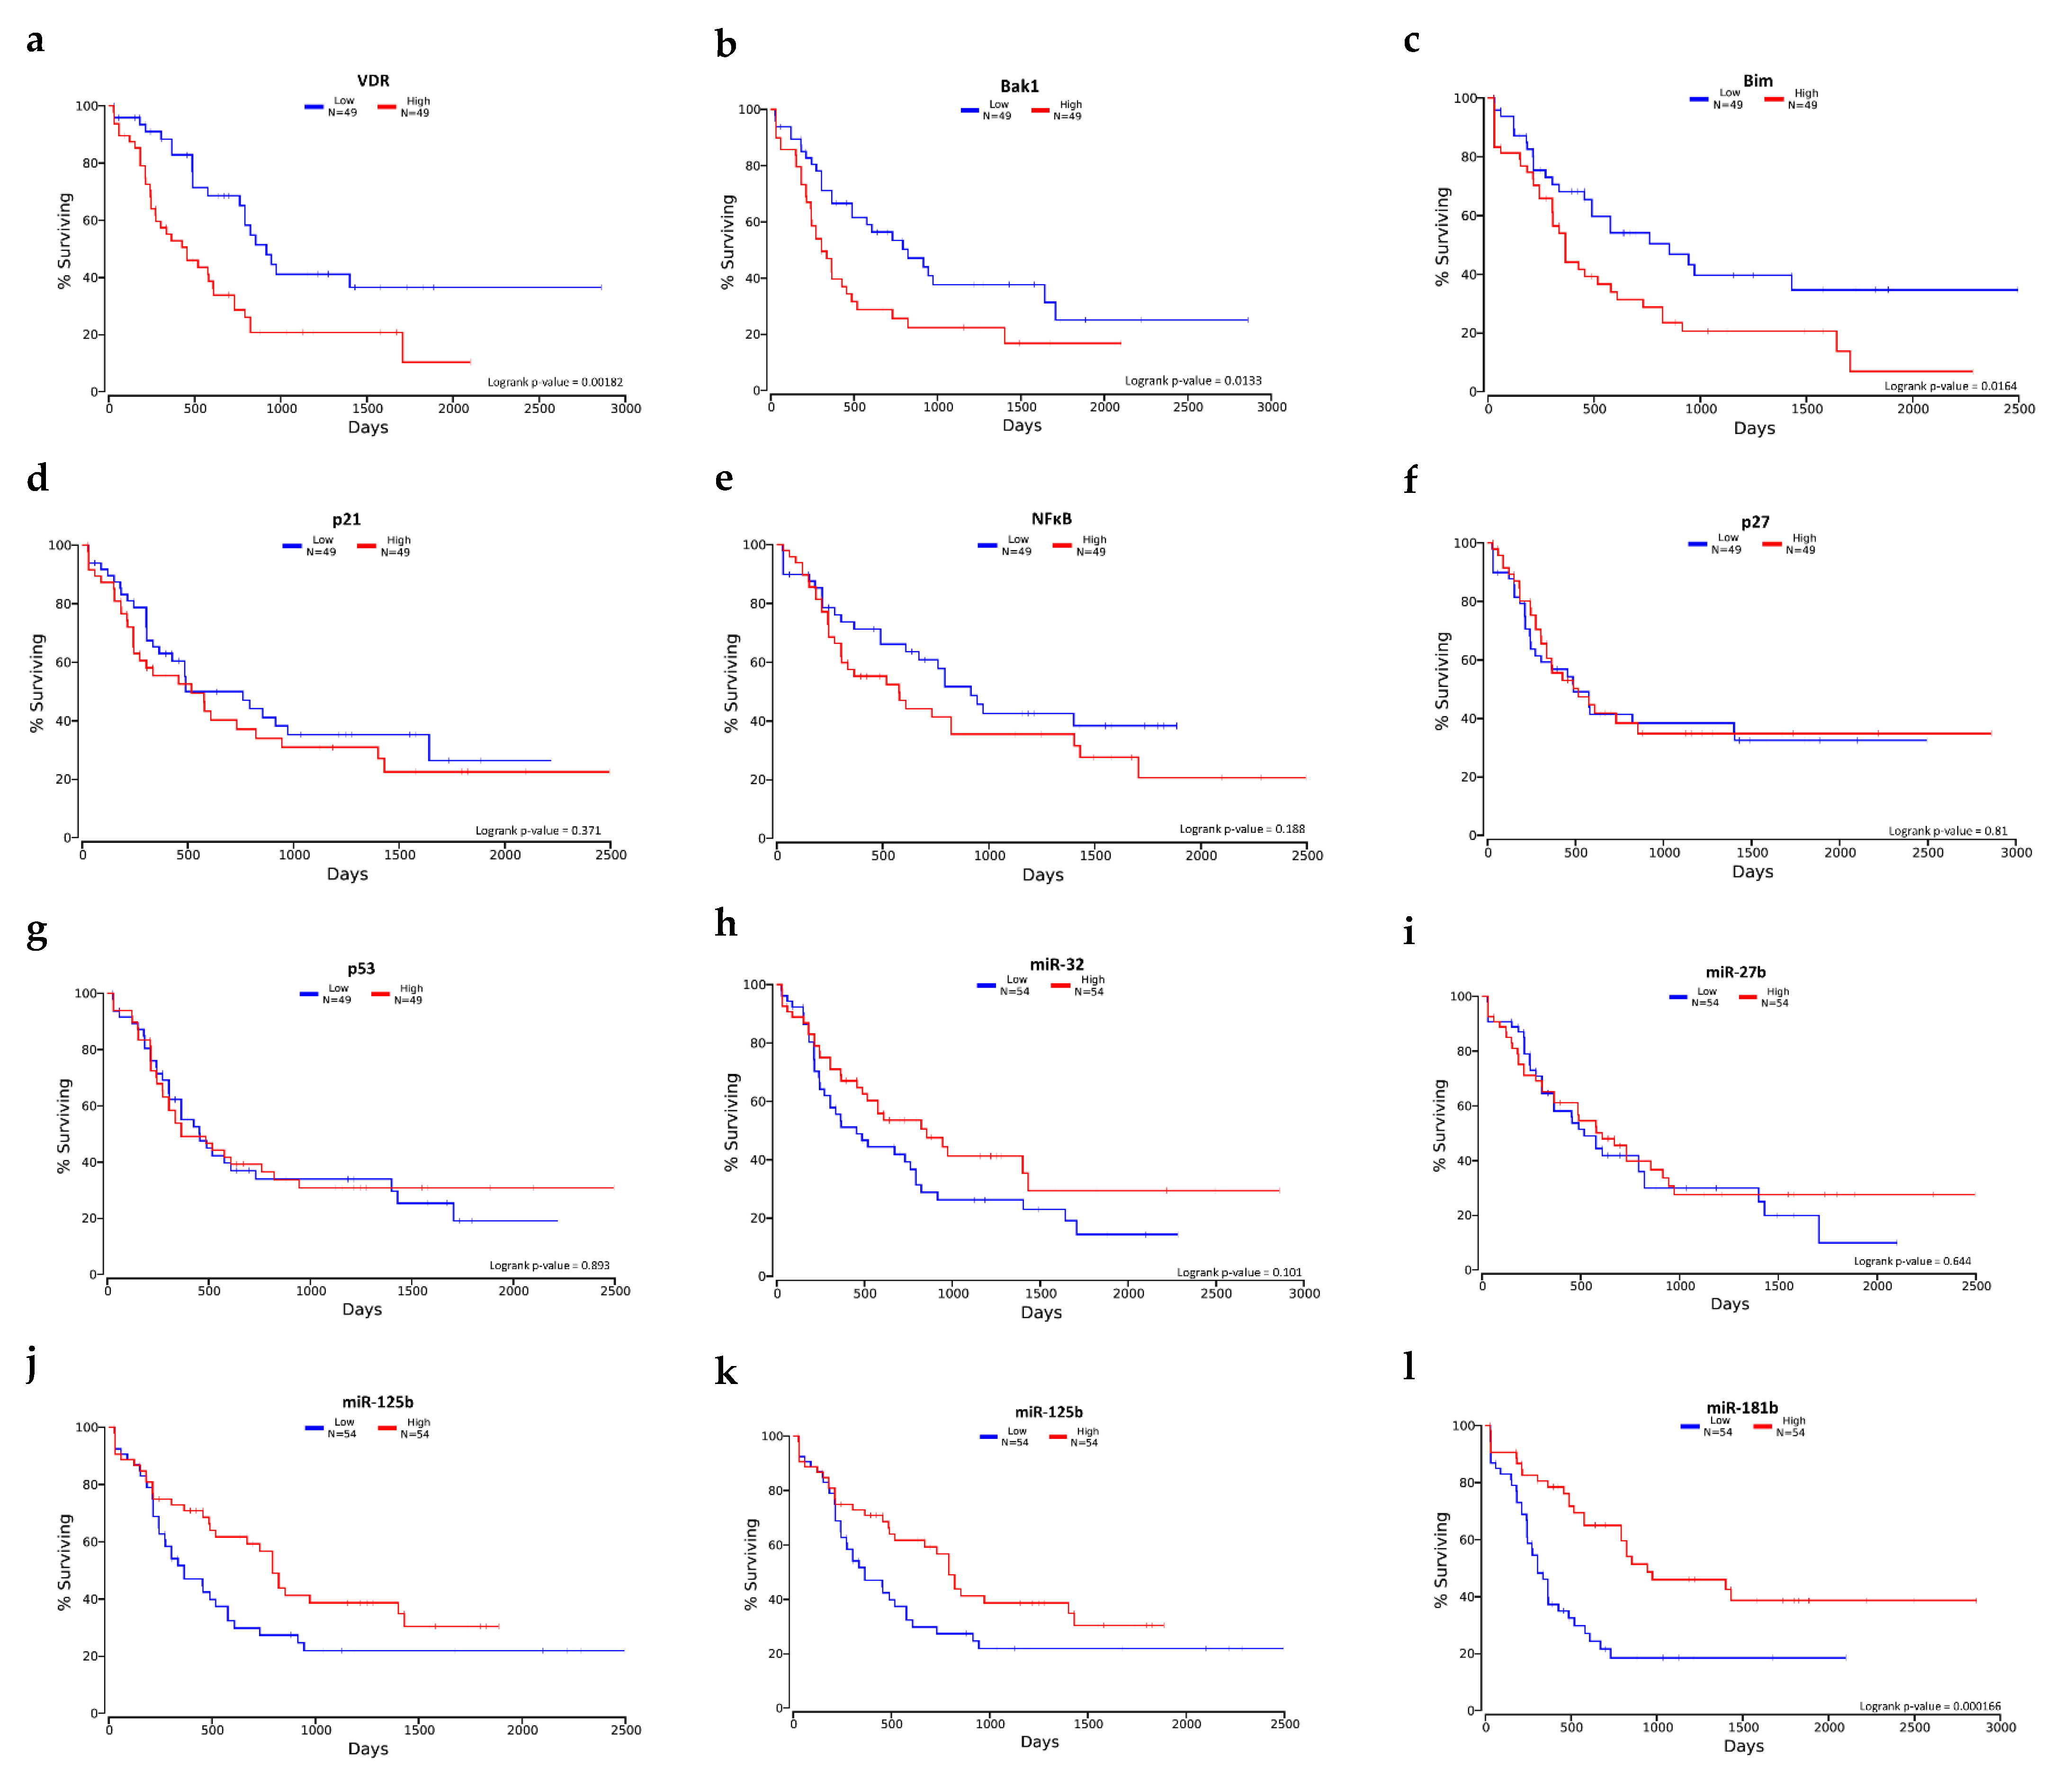
2.7. Selected mRNA and miRNA Expression Level and Overall Survival
3. Discussion
3.1. Active Forms of Vitamin D3 Affect the Cell Cycle of Human Leukemia and Lymphoma Cells
3.2. Population of Aneuploid Cells in Human Leukemia and Lymphoma Cells and Response to Active Forms of Vitamin D3
3.3. Pro-Apoptotic Proteins Bim and Bak1 in the Response of Human Leukemia and Lymphoma Cells to Calcitriol and Tacalcitol
3.4. miR-125b and Proteins Involved in Cell Proliferation and Survival: NFκB and p53
NFkB
3.5. miR-125b and miR-27b in the Regulation of Classic Vitamin D Receptor and CYP24A1
4. Materials and Methods
4.1. Human Leukemia and Lymphoma Cell Lines
4.2. Human Normal Blood Cells
4.3. Calcitriol and Tacalcitol
4.4. Real-Time PCR
4.5. ELISA Tests
4.6. Cell Cycle Analysis and Aneuploids Population
4.7. Statistical Analysis
4.8. Overall Survival Analysis
5. Conclusions
Supplementary Materials
Author Contributions
Funding
Institutional Review Board Statement
Informed Consent Statement
Data Availability Statement
Conflicts of Interest
References
- Hamadani, M.; Awan, F.T. Remission induction, consolidation and novel agents in development for adults with acute myeloid leukaemia. Hematol. Oncol. 2010, 28, 3–12. [Google Scholar] [CrossRef] [PubMed]
- Schlenk, R.F.; Fröhling, S.; Hartmann, F.; Fischer, J.T.; Glasmacher, A.; del Valle, F.; Grimminger, W.; Götze, K.; Waterhouse, C.; Schoch, R.; et al. Phase III study of all-trans retinoic acid in previously untreated patients 61 years or older with acute myeloid leukemia. Leukemia 2004, 18, 1798–1803. [Google Scholar] [CrossRef] [PubMed] [Green Version]
- Di Febo, A.; Laurenti, L.; Falcucci, P.; Tosti, M.E.; Fianchi, L.; Pagano, L.; Leone, G. All-trans Retinoic Acid in Association with Low Dose Cytosine Arabinoside in the Treatment of Acute Myeoid Leukemia in Elderly Patients. Am. J. Ther. 2007, 14, 351–355. [Google Scholar] [CrossRef] [PubMed]
- Zhu, J.; Chen, Z.; Lallemand-Breitenbach, V.; de Thé, H. How acute promyelocytic leukaemia revived arsenic. Nat. Rev. Cancer 2002, 2, 705–714. [Google Scholar] [CrossRef] [PubMed]
- Sanz, M.A.; Montesinos, P. How we prevent and treat differentiation syndrome in patients with acute promyelocytic leukemia. Blood 2014, 123, 2777–2782. [Google Scholar] [CrossRef]
- Deeb, K.K.; Trump, D.L.; Johnson, C.S. Vitamin D signalling pathways in cancer: Potential for anticancer therapeutics. Nat. Rev. Cancer 2007, 7, 684–700. [Google Scholar] [CrossRef]
- Woloszynska-Read, A.; Johnson, C.S.; Trump, D.L. Vitamin D and cancer: Clinical aspects. Best Pract. Res. Clin. Endocrinol. Metab. 2011, 25, 605–615. [Google Scholar] [CrossRef] [Green Version]
- Gounaris-Shannon, S.; Newbury, S.; Chevassut, T. MicroRNAs—Key Players in Haematopoiesis. Curr. Signal Transduct. Ther. 2013, 8, 91–98. [Google Scholar] [CrossRef]
- Fazi, F.; Rosa, A.; Fatica, A.; Gelmetti, V.; De Marchis, M.L.; Nervi, C.; Bozzoni, I. A minicircuitry comprised of microRNA-223 and transcription factors NFI-A and C/EBPalpha regulates human granulopoiesis. Cell 2005, 123, 819–831. [Google Scholar] [CrossRef] [Green Version]
- Xiao, C.; Calado, D.P.; Galler, G.; Thai, T.H.; Patterson, H.C.; Wang, J.; Rajewsky, N.; Bender, T.P.; Rajewsky, K. MiR-150 controls B cell differentiation by targeting the transcription factor c-Myb. Cell 2007, 131, 146–159. [Google Scholar] [CrossRef] [Green Version]
- Fontana, L.; Pelosi, E.; Greco, P.; Racanicchi, S.; Testa, U.; Liuzzi, F.; Croce, C.M.; Brunetti, E.; Grignani, F.; Peschle, C. MicroRNAs 17-5p-20a-106a control monocytopoiesis through AML1 targeting and M-CSF receptor upregulation. Nat. Cell Biol. 2007, 9, 775–787. [Google Scholar] [CrossRef] [PubMed]
- Mohri, T.; Nakajima, M.; Takagi, S.; Komagata, S.; Yokoi, T. MicroRNA regulates human vitamin D receptor. Int. J. Cancer 2009, 125, 1328–1333. [Google Scholar] [CrossRef] [PubMed]
- Pan, Y.Z.; Gao, W.; Yu, A.M. MicroRNAs regulate CYP3A4 expression via direct and indirect targeting. Drug Metab. Dispos. 2009, 37, 2112–2117. [Google Scholar] [CrossRef] [PubMed] [Green Version]
- Wang, L.; Gao, Z.; Wang, L.; Gao, Y. Loss of miR-125b contributes to upregulation of CYP24 in uraemic rats. Nephrology 2016, 21, 1063–1068. [Google Scholar] [CrossRef]
- Sun, Y.M.; Lin, K.Y.; Chen, Y.Q. Diverse functions of miR-125 family in different cell contexts. J. Hematol. Oncol. 2013, 6, 1–8. [Google Scholar] [CrossRef] [Green Version]
- Alemdehy, M.F.; Erkeland, S.J. MicroRNAs: Key players of normal and malignant myelopoiesis. Undefined 2012, 19, 261–267. [Google Scholar] [CrossRef]
- Gong, J.; Zhang, J.P.; Li, B.; Zeng, C.; You, K.; Chen, M.X.; Yuan, Y.; Zhuang, S.M. MicroRNA-125b promotes apoptosis by regulating the expression of Mcl-1, Bcl-w and IL-6R. Oncogene 2013, 32, 3071–3079. [Google Scholar] [CrossRef] [Green Version]
- Surdziel, E.; Cabanski, M.; Dallmann, I.; Lyszkiewicz, M.; Krueger, A.; Ganser, A.; Scherr, M.; Eder, M. Enforced expression of miR-125b affects myelopoiesis by targeting multiple signaling pathways. Blood 2011, 117, 4338–4348. [Google Scholar] [CrossRef] [Green Version]
- Yokoi, T.; Nakajima, M. Toxicological Implications of Modulation of Gene Expression by MicroRNAs. Toxicol. Sci. 2011, 123, 1–14. [Google Scholar] [CrossRef] [Green Version]
- Ge, X.; Yuan, L.; Wei, J.; Nguyen, T.; Tang, C.; Liao, W.; Li, R.; Yang, F.; Zhang, F.; Zhao, B.; et al. Vitamin D/VDR signaling induces miR-27a/b expression in oral lichen planus. Sci. Rep. 2020, 10, 310. [Google Scholar] [CrossRef]
- Giangreco, A.A.; Vaishnav, A.; Wagner, D.; Finelli, A.; Fleshner, N.; Van Der Kwast, T.; Vieth, R.; Nonn, L. Tumor Suppressor microRNAs, miR-100 and-125b, Are Regulated by 1,25-dihydroxyvitamin D in Primary Prostate Cells and in Patient Tissue. Cancer Prev. Res. 2013, 6, 483–494. [Google Scholar] [CrossRef] [PubMed] [Green Version]
- Akbari Moqadam, F.; Lange-Turenhout, E.A.M.; Ariës, I.M.; Pieters, R.; den Boer, M.L. MiR-125b, miR-100 and miR-99a co-regulate vincristine resistance in childhood acute lymphoblastic leukemia. Leuk. Res. 2013, 37, 1315–1321. [Google Scholar] [CrossRef] [PubMed]
- Kim, S.W.; Ramasamy, K.; Bouamar, H.; Lin, A.P.; Jiang, D.; Aguiar, R.C.T. MicroRNAs miR-125a and miR-125b constitutively activate the NF-κB pathway by targeting the tumor necrosis factor alpha-induced protein 3 (TNFAIP3, A20). Proc. Natl. Acad. Sci. USA 2012, 109, 7865–7870. [Google Scholar] [CrossRef] [PubMed] [Green Version]
- Le, M.T.N.; The, C.; Shyh-Chang, N.; Xie, H.; Zhou, B.; Korzh, V.; Lodish, H.F.; Lim, B. MicroRNA-125b is a novel negative regulator of p53. Genes Dev. 2009, 23, 862–876. [Google Scholar] [CrossRef] [PubMed] [Green Version]
- Wang, X.; Gocek, E.; Liu, C.-G.; Studzinski, G.P. MicroRNAs181 regulate the expression of p27Kip1 in human myeloid leukemia cells induced to differentiate by 1,25-dihydroxyvitamin D3. Cell Cycle 2009, 8, 736–741. [Google Scholar] [CrossRef] [PubMed] [Green Version]
- Cuesta, R.; Martínez-Sánchez, A.; Gebauer, F. miR-181a regulates cap-dependent translation of p27(kip1) mRNA in myeloid cells. Mol. Cell. Biol. 2009, 29, 2841–2851. [Google Scholar] [CrossRef] [Green Version]
- Rots, N.Y.; Iavarone, A.; Bromleigh, V.; Freedman, L.P. Induced differentiation of U937 cells by 1,25-dihydroxyvitamin D3 involves cell cycle arrest in G1 that is preceded by a transient proliferative burst and an increase in cyclin expression. Blood 1999, 93, 2721–2729. [Google Scholar] [CrossRef]
- Min, D.; Lv, X.B.; Wang, X.; Zhang, B.; Meng, W.; Yu, F.; Hu, H. Downregulation of miR-302c and miR-520c by 1,25(OH)2D3 treatment enhances the susceptibility of tumour cells to natural killer cell-mediated cytotoxicity. Br. J. Cancer 2013, 109, 723–730. [Google Scholar] [CrossRef] [Green Version]
- Gocek, E.; Wang, X.; Liu, X.; Liu, C.G.; Studzinski, G.P. MicroRNA-32 upregulation by 1,25-dihydroxyvitamin D3 in human myeloid leukemia cells leads to Bim targeting and inhibition of AraC-induced apoptosis. Cancer Res. 2011, 71, 6230. [Google Scholar] [CrossRef] [Green Version]
- Salvatori, B.; Iosue, I.; Mangiavacchi, A.; Loddo, G.; Padula, F.; Chiaretti, S.; Peragine, N.; Bozzoni, I.; Fazi, F.; Fatica, A. The microRNA-26a target E2F7 sustains cell proliferation and inhibits monocytic differentiation of acute myeloid leukemia cells. Cell Death Dis. 2012, 3, e413. [Google Scholar] [CrossRef]
- Iosue, I.; Quaranta, R.; Masciarelli, S.; Fontemaggi, G.; Batassa, E.M.; Bertolami, C.; Ottone, T.; Divona, M.; Salvatori, B.; Padula, F.; et al. Argonaute 2 sustains the gene expression program driving human monocytic differentiation of acute myeloid leukemia cells. Cell Death Dis. 2013, 4, e926. [Google Scholar] [CrossRef] [Green Version]
- Bueno, M.J.; Malumbres, M. MicroRNAs and the cell cycle. Biochim. Biophys. Acta 2011, 1812, 592–601. [Google Scholar] [CrossRef] [PubMed] [Green Version]
- Raut, S.K.; Singh, G.B.; Rastogi, B.; Saikia, U.N.; Mittal, A.; Dogra, N.; Singh, S.; Prasad, R.; Khullar, M. miR-30c and miR-181a synergistically modulate p53–p21 pathway in diabetes induced cardiac hypertrophy. Mol. Cell. Biochem. 2016, 417, 191–203. [Google Scholar] [CrossRef] [PubMed]
- Bartel, D.P. MicroRNAs: Genomics, Biogenesis, Mechanism, and Function. Cell 2004, 116, 281–297. [Google Scholar] [CrossRef] [Green Version]
- Costinean, S.; Zanesi, N.; Pekarsky, Y.; Tili, E.; Volinia, S.; Heerema, N.; Croce, C.M. Pre-B cell proliferation and lymphoblastic leukemia/high-grade lymphoma in E(mu)-miR155 transgenic mice. Proc. Natl. Acad. Sci. USA 2006, 103, 7024–7029. [Google Scholar] [CrossRef] [PubMed] [Green Version]
- Esquela-Kerscher, A.; Slack, F.J. Oncomirs—microRNAs with a role in cancer. Nat. Rev. Cancer 2006, 6, 259–269. [Google Scholar] [CrossRef]
- Vasilatou, D.; Papageorgiou, S.; Pappa, V.; Papageorgiou, E.; Dervenoulas, J. The role of microRNAs in normal and malignant hematopoiesis. Eur. J. Haematol. 2010, 84, 1–16. [Google Scholar] [CrossRef]
- Calin, G.A.; Cimmino, A.; Fabbri, M.; Ferracin, M.; Wojcik, S.E.; Shimizu, M.; Taccioli, C.; Zanesi, N.; Garzon, R.; Aqeilan, R.I.; et al. MiR-15a and miR-16-1 cluster functions in human leukemia. Proc. Natl. Acad. Sci. USA 2008, 105, 5166. [Google Scholar] [CrossRef] [Green Version]
- Ma, J.; Dong, C.; Ji, C. MicroRNA and drug resistance. Cancer Gene Ther. 2010, 17, 523–531. [Google Scholar] [CrossRef] [Green Version]
- Calin, G.A.; Croce, C.M. MicroRNA signatures in human cancers. Nat. Rev. Cancer 2006, 6, 857–866. [Google Scholar] [CrossRef]
- O’Connell, R.M.; Chaudhuri, A.A.; Rao, D.S.; Gibson, W.S.J.; Balazs, A.B.; Baltimore, D. MicroRNAs enriched in hematopoietic stem cells differentially regulate long-term hematopoietic output. Proc. Natl. Acad. Sci. USA 2010, 107, 14235–14240. [Google Scholar] [CrossRef] [PubMed] [Green Version]
- Pan, Y.; Meng, M.; Zhang, G.; Han, H.; Zhou, Q. Oncogenic microRNAs in the genesis of leukemia and lymphoma. Curr. Pharm. Des. 2014, 20, 5260–5267. [Google Scholar] [CrossRef] [PubMed]
- Tagawa, H.; Ikeda, S.; Sawada, K. Role of microRNA in the pathogenesis of malignant lymphoma. Cancer Sci. 2013, 104, 801–809. [Google Scholar] [CrossRef]
- Pereira, F.; Larriba, M.J.; Muñoz, A. Vitamin D and colon cancer. Endocr. Relat. Cancer 2012, 19, 67–81. [Google Scholar] [CrossRef] [PubMed] [Green Version]
- Kawa, S.; Nikaido, T.; Aoki, Y.; Zhai, Y.; Kumagai, T.; Furihata, K.; Fujii, S.; Kiyosawa, K. Vitamin D analogues up-regulate p21 and p27 during growth inhibition of pancreatic cancer cell lines. Br. J. Cancer 1997, 76, 884–889. [Google Scholar] [CrossRef] [Green Version]
- Boulaire, J.; Fotedar, A.; Fotedar, R. The functions of the cdk-cyclin kinase inhibitor p21(WAF1). Pathol. Biol. 2000, 48, 190–202. [Google Scholar]
- Trynda, J.; Turlej, E.; Milczarek, M.; Pietraszek, A.; Chodyński, M.; Kutner, A.; Wietrzyk, J. Antiproliferative Activity and in Vivo Toxicity of Double-Point Modified Analogs of 1,25-Dihydroxyergocalciferol. Int. J. Mol. Sci. 2015, 16, 24873–24894. [Google Scholar] [CrossRef] [Green Version]
- Don, M.J.; Chang, Y.H.; Chen, K.K.; Ho, L.K.; Chau, Y.P. Induction of CDK inhibitors (p21(WAF1) and p27(Kip1)) and Bak in the beta-lapachone-induced apoptosis of human prostate cancer cells. Mol. Pharmacol. 2001, 59, 784–794. [Google Scholar] [CrossRef] [Green Version]
- Dey, P. Aneuploidy and malignancy: An unsolved equation. J. Clin. Pathol. 2004, 57, 1245–1249. [Google Scholar] [CrossRef]
- Gordon, D.J.; Resio, B.; Pellman, D. Causes and consequences of aneuploidy in cancer. Nat. Rev. Genet. 2012, 13, 189–203. [Google Scholar] [CrossRef]
- Tang, Y.C.; Williams, B.R.; Siegel, J.J.; Amon, A. Identification of aneuploidy-selective antiproliferation compounds. Cell 2011, 144, 499–512. [Google Scholar] [CrossRef] [PubMed] [Green Version]
- Cory, S.; Huang, D.C.S.; Adams, J.M. The Bcl-2 family: Roles in cell survival and oncogenesis. Oncogene 2003, 22, 8590–8607. [Google Scholar] [CrossRef] [PubMed] [Green Version]
- Hanahan, D.; Weinberg, R.A. Hallmarks of cancer: The next generation. Cell 2011, 144, 646–674. [Google Scholar] [CrossRef] [PubMed] [Green Version]
- Johnstone, R.W.; Ruefli, A.A.; Lowe, S.W. Apoptosis: A link between cancer genetics and chemotherapy. Cell 2002, 108, 153–164. [Google Scholar] [CrossRef] [Green Version]
- Cory, S.; Adams, J.M. The Bcl2 family: Regulators of the cellular life-or-death switch. Nat. Rev. Cancer 2002, 2, 647–656. [Google Scholar] [CrossRef]
- Kale, J.; Osterlund, E.J.; Andrews, D.W. BCL-2 family proteins: Changing partners in the dance towards death. Cell Death Differ. 2017, 25, 65–80. [Google Scholar] [CrossRef] [Green Version]
- Zeng, Q.H.; Xu, L.; Liu, X.D.; Liao, W.; Yan, M. xia [miR-125b promotes proliferation of human acute myeloid leukemia cells by targeting Bak1]. Zhonghua Xue Ye Xue Za Zhi 2013, 34, 1010–1014. [Google Scholar] [CrossRef]
- Zhou, M.; Liu, Z.; Zhao, Y.; Ding, Y.; Liu, H.; Xi, Y.; Xiong, W.; Li, G.; Lu, J.; Fodstad, O.; et al. MicroRNA-125b confers the resistance of breast cancer cells to paclitaxel through suppression of pro-apoptotic Bcl-2 antagonist killer 1 (Bak1) expression. J. Biol. Chem. 2010, 285, 21496–21507. [Google Scholar] [CrossRef] [Green Version]
- Kong, F.; Sun, C.; Wang, Z.; Han, L.; Weng, D.; Lu, Y.; Chen, G. miR-125b confers resistance of ovarian cancer cells to cisplatin by targeting pro-apoptotic Bcl-2 antagonist killer 1. J. Huazhong Univ. Sci. Technol. Med. Sci. 2011, 31, 543–549. [Google Scholar] [CrossRef]
- Taylor, M.A.; Sossey-Alaoui, K.; Thompson, C.L.; Danielpour, D.; Schiemann, W.P. TGF-β upregulates miR-181a expression to promote breast cancer metastasis. J. Clin. Investig. 2013, 123, 150–163. [Google Scholar] [CrossRef] [Green Version]
- Tan, T.T.; Degenhardt, K.; Nelson, D.A.; Beaudoin, B.; Nieves-Neira, W.; Bouillet, P.; Villunger, A.; Adams, J.M.; White, E. Key roles of BIM-driven apoptosis in epithelial tumors and rational chemotherapy. Cancer Cell 2005, 7, 227–238. [Google Scholar] [CrossRef] [PubMed] [Green Version]
- Ambs, S.; Prueitt, R.L.; Yi, M.; Hudson, R.S.; Howe, T.M.; Petrocca, F.; Wallace, T.A.; Liu, C.G.; Volinia, S.; Calin, G.A.; et al. Genomic profiling of microRNA and messenger RNA reveals deregulated microRNA expression in prostate cancer. Cancer Res. 2008, 68, 6162–6170. [Google Scholar] [CrossRef] [PubMed] [Green Version]
- Ryan, K.M.; Ernst, M.K.; Rice, N.R.; Vousden, K.H. Role of NF-kappaB in p53-mediated programmed cell death. Nature 2000, 404, 892–897. [Google Scholar] [CrossRef]
- Hayden, M.S.; West, A.P.; Ghosh, S. NF-κB and the immune response. Oncogene 2006, 25, 6758–6780. [Google Scholar] [CrossRef] [Green Version]
- Xia, Y.; Shen, S.; Verma, I.M. NF-κB, an active player in human cancers. Cancer Immunol. Res. 2014, 2, 823–830. [Google Scholar] [CrossRef] [PubMed] [Green Version]
- Dolcet, X.; Llobet, D.; Pallares, J.; Matias-Guiu, X. NF-kB in development and progression of human cancer. Virchows Arch. 2005, 446, 475–482. [Google Scholar] [CrossRef]
- Zhou, R.; Hu, G.; Gong, A.Y.; Chen, X.M. Binding of NF-kappaB p65 subunit to the promoter elements is involved in LPS-induced transactivation of miRNA genes in human biliary epithelial cells. Nucleic Acids Res. 2010, 38, 3222. [Google Scholar] [CrossRef] [Green Version]
- Ma, X.; Becker Buscaglia, L.E.; Barker, J.R.; Li, Y. MicroRNAs in NF-κB signaling. J. Mol. Cell Biol. 2011, 3, 159. [Google Scholar] [CrossRef]
- Javelaud, D.; Wietzerbin, J.; Delattre, O.; Besançon, F. Induction of p21Waf1/Cip1 by TNFα requires NF-κB activity and antagonizes apoptosis in Ewing tumor cells. Oncogene 2000, 19, 61–68. [Google Scholar] [CrossRef] [Green Version]
- Pennington, K.N.; Taylor, J.A.; Bren, G.D.; Paya, C.V. IkappaB kinase-dependent chronic activation of NF-kappaB is necessary for p21(WAF1/Cip1) inhibition of differentiation-induced apoptosis of monocytes. Mol. Cell. Biol. 2001, 21, 1930–1941. [Google Scholar] [CrossRef] [Green Version]
- Chen, Y.; Zhang, J.; Ge, X.; Du, J.; Deb, D.K.; Li, Y.C. Vitamin D Receptor Inhibits Nuclear Factor κB Activation by Interacting with IκB Kinase β Protein. J. Biol. Chem. 2013, 288, 19450. [Google Scholar] [CrossRef] [PubMed] [Green Version]
- Fekrmandi, F.; Wang, T.T.; White, J.H. The hormone-bound vitamin D receptor enhances the FBW7-dependent turnover of NF-κB subunits. Sci. Rep. 2015, 5, 13002. [Google Scholar] [CrossRef] [PubMed] [Green Version]
- Sun, J.; Kong, J.; Duan, Y.; Szeto, F.L.; Liao, A.; Madara, J.L.; Yan, C.L. Increased NF-κB activity in fibroblasts lacking the vitamin D receptor. Am. J. Physiol.–Endocrinol. Metab. 2006, 291, 315–322. [Google Scholar] [CrossRef] [PubMed]
- Gleba, J.J.; Kłopotowska, D.; Banach, J.; Turlej, E.; Mielko, K.A.; Gębura, K.; Bogunia-Kubik, K.; Kutner, A.; Wietrzyk, J. Polymorphism of VDR Gene and the Sensitivity of Human Leukemia and Lymphoma Cells to Active Forms of Vitamin D. Cancers 2022, 14, 387. [Google Scholar] [CrossRef]
- Signature of VDR miRNAs and Epigenetic Modulation of Vitamin D Signaling in Melanoma Cell Lines–PubMed. Available online: https://pubmed.ncbi.nlm.nih.gov/22213330/ (accessed on 23 January 2022).
- Luo, W.; Hershberger, P.A.; Trump, D.L.; Johnson, C.S. 24-Hydroxylase in cancer: Impact on vitamin D-based anticancer therapeutics. J. Steroid Biochem. Mol. Biol. 2013, 136, 252–257. [Google Scholar] [CrossRef] [Green Version]
- Craig, T.A.; Zhang, Y.; Magis, A.T.; Funk, C.C.; Price, N.D.; Ekker, S.C.; Kumar, R. Detection of 1α,25-dihydroxyvitamin D-regulated miRNAs in zebrafish by whole transcriptome sequencing. Zebrafish 2014, 11, 207–218. [Google Scholar] [CrossRef] [Green Version]
- Peng, X.; Tiwari, N.; Roy, S.; Yuan, L.; Murillo, G.; Mehta, R.R.; Benya, R.V.; Mehta, R.G. Regulation of CYP24 splicing by 1,25-dihydroxyvitamin D3 in human colon cancer cells. J. Endocrinol. 2012, 212, 207–215. [Google Scholar] [CrossRef] [Green Version]
- Anaya, J. OncoLnc: Linking TCGA survival data to mRNAs, miRNAs, and lncRNAs. PeerJ Comput. Sci. 2016, 2016, e67. [Google Scholar] [CrossRef] [Green Version]


Publisher’s Note: MDPI stays neutral with regard to jurisdictional claims in published maps and institutional affiliations. |
© 2022 by the authors. Licensee MDPI, Basel, Switzerland. This article is an open access article distributed under the terms and conditions of the Creative Commons Attribution (CC BY) license (https://creativecommons.org/licenses/by/4.0/).
Share and Cite
Gleba, J.J.; Kłopotowska, D.; Banach, J.; Mielko, K.A.; Turlej, E.; Maciejewska, M.; Kutner, A.; Wietrzyk, J. Micro-RNAs in Response to Active Forms of Vitamin D3 in Human Leukemia and Lymphoma Cells. Int. J. Mol. Sci. 2022, 23, 5019. https://doi.org/10.3390/ijms23095019
Gleba JJ, Kłopotowska D, Banach J, Mielko KA, Turlej E, Maciejewska M, Kutner A, Wietrzyk J. Micro-RNAs in Response to Active Forms of Vitamin D3 in Human Leukemia and Lymphoma Cells. International Journal of Molecular Sciences. 2022; 23(9):5019. https://doi.org/10.3390/ijms23095019
Chicago/Turabian StyleGleba, Justyna Joanna, Dagmara Kłopotowska, Joanna Banach, Karolina Anna Mielko, Eliza Turlej, Magdalena Maciejewska, Andrzej Kutner, and Joanna Wietrzyk. 2022. "Micro-RNAs in Response to Active Forms of Vitamin D3 in Human Leukemia and Lymphoma Cells" International Journal of Molecular Sciences 23, no. 9: 5019. https://doi.org/10.3390/ijms23095019