Article

Mechanistic Insights into the Anti-Proliferative Action of Gut Microbial Metabolites against Breast Adenocarcinoma Cells

1
NICM Health Research Institute, Western Sydney University, Penrith, NSW 2751, Australia
2
Pharmacognosy Department, Faculty of Pharmacy, Cairo University, Cairo 11562, Egypt
3
Innovation Centre, Victor Chang Cardiac Research Institute, Sydney, NSW 2010, Australia
4
School of Science, Western Sydney University, Penrith, NSW 2751, Australia
*
Author to whom correspondence should be addressed.
Int. J. Mol. Sci. 2023, 24(20), 15053; https://doi.org/10.3390/ijms242015053
Submission received: 7 August 2023 / Revised: 26 September 2023 / Accepted: 6 October 2023 / Published: 10 October 2023
(This article belongs to the Special Issue Molecular Research in Human Microbiome 2.0)

Abstract

:
The gut microbiota undergoes metabolic processes to produce by-products (gut metabolites), which play a vital role in the overall maintenance of health and prevention of disease within the body. However, the use of gut metabolites as anticancer agents and their molecular mechanisms of action are largely unknown. Therefore, this study evaluated the anti-proliferative effects of three key gut microbial metabolites—sodium butyrate, inosine, and nisin, against MCF7 and MDA-MB-231 breast adenocarcinoma cell lines. To determine the potential mechanistic action of these gut metabolites, flow cytometric assessments of apoptotic potential, reactive oxygen species (ROS) production measurements and proteomics analyses were performed. Sodium butyrate exhibited promising cytotoxicity, with IC50 values of 5.23 mM and 5.06 mM against MCF7 and MDA-MB-231 cells, respectively. All three metabolites were found to induce apoptotic cell death and inhibit the production of ROS in both cell lines. Nisin and inosine indicated a potential activation of cell cycle processes. Sodium butyrate indicated the possible initiation of signal transduction processes and cellular responses to stimuli. Further investigations are necessary to ascertain the effective therapeutic dose of these metabolites, and future research on patient-derived tumour spheroids will provide insights into the potential use of these gut metabolites in cancer therapy.

1. Introduction

The role of gut microbiota in the treatment of breast cancer is a relatively new area of oncology research. Several metabolites (also known as postbiotics) produced by the gut microbiota have shown potential anti-proliferative activity against cancer cells as well as synergies with standard anticancer drugs by enhancing their activity and reducing side effects [1]. Short-chain fatty acids (SCFAs), produced by different bacterial species, are the most abundant type of metabolites within the human gut, with butyrate being the most common SCFA produced by the Firmicutes [1]. This group of metabolites are derived from the breakdown of dietary fibre, in which fermentation of non-digestible carbohydrates results in the production of SCFAs [2]. Nisin is produced via bacterial fermentation of food products, such as yoghurt by the Gram-positive Lactobacillus lactis, and is the most produced bacteriocin in the human gut [1]. Under normal physiological conditions, nisin limits colonisation by Gram-positive bacterial species within the gut in a phenomenon known as ‘colonisation resistance’, and triggers changes in the cellular membrane potential of the entire cell [1]. Inosine is produced via the metabolic conversion of adenosine by the adenosine deaminase enzyme [1] and also by certain gut microbial species including Bifidobacterium pseudolongum [3]. Sodium butyrate is the sodium salt of butyrate and was selected for the present study instead of butyric acid as the latter, when administered orally, is unable to reach the lower gastrointestinal tract (GIT) due to its absorption in the upper GIT [4]. Butyrate also possesses unfavourable pharmacological properties, including a short half-life and multigram doses required to achieve therapeutic concentrations in animal models [5]. The molecular mechanisms of action of these gut microbial metabolites have not been investigated in depth against breast cancer cells.
The MCF7 human breast adenocarcinoma cell line is one of the most utilised breast cancer cells in cancer research. The MCF7 cell line is highly invasive and dependent on oestrogen and progesterone hormones and expresses substantial levels of the oestrogen receptor (ER) alpha, which is clinically representative of common invasive breast cancers that characteristically express ER [6]. Additionally, the MCF7 human breast cancer cell line is representative of the in vivo mammary gland structure, due to its ability to form directionally oriented microtissues containing a luminal space when grown as a 3D cell culture model [7]. Due to these factors, the MCF7 cell line has been used extensively in breast cancer-related studies and is ideal for evaluating the activity of potential antiproliferative activity of drugs. The application of this cell line in preclinical breast cancer research has been instrumental in determining new potential anticancer agents and contributing to improvements in patient outcomes [6]. Triple-negative breast cancers (TNBCs) account for approximately 15 to 20% of all breast cancer cases and have a poor prognosis, which warrants investigation to define targeted therapies [8]. The MDA-MB-231 is a TNBC cell line, representing a highly aggressive form of breast cancer with limited treatment options and low survival rates [9]. The MDA-MB-231 cells are oestrogen-independent and demonstrate representative epithelial to mesenchymal transition (EMT) associated with metastatic breast cancer progression [9]. It is also characterised by the non-expression of progesterone receptors and the lack of overexpression of HER2, and typically associated with BRCA1/2 germline mutations that hereditarily predispose young women to breast cancer [8]. This cell line is used less commonly in in vitro research compared to the MCF7 breast cancer cell line; however, it is a preferred cell line for use in xenograft animal models [10]. In immune-compromised mice, these breast cancer cells present with preferential growth in the mammary fat pad of this animal model and initiate spontaneous metastasis within the host lymph nodes that are derived from primary tumours [10]. The action of MDA-MB-231 cells in xenograft animal models is clinically representative of the mechanism in which these cancerous cells act in the human host, due to the coordination of EMT in breast cancer metastasis [9]. To determine the potential cytotoxicity of the selected gut metabolites against healthy breast tissue, the metabolites were also tested against the normal breast epithelial MCF10A cell line.
This study was designed to gain a mechanistic understanding of sodium butyrate, nisin and inosine against the oestrogen-dependent MCF7 and triple negative MDA-MB-231 human breast adenocarcinoma cell lines using cellular, molecular and proteomics assays.

2. Results and Discussion

2.1. Anti-Proliferative Activity of the Three Gut Microbial Metabolites against the MCF7 and MDA-MB-231 Human Breast Adenocarcinoma Cells

The cell viability of the MCF7 cells following a 72-h treatment with different concentrations of sodium butyrate, nisin and inosine was evaluated using the Alamar Blue assay. This assay determined that sodium butyrate exhibited the most substantial anti-proliferative activity in a dose-dependent manner (p < 0.0001), followed by inosine and nisin (Table 1). As observed with the MCF7 cell line, the most effective metabolite in inhibiting MDA-MB-231 cell viability was sodium butyrate, followed by inosine (p < 0.0001) and nisin (p < 0.0001) (Table 1). All three metabolites demonstrated dose-dependent cell growth inhibition in the range of 0.03125–3 mg/mL.
At 3 mg/mL (27.25 mM) and 2 mg/mL (18.17 mM), sodium butyrate exhibited MCF7 anti-proliferative activity of 81.73 ± 4.81% and 70.86 ± 7.24%, respectively. Previously, sodium butyrate at 2.5 mM was found to inhibit the growth of the MCF7 cells by 85–90% [11]. Another in vitro study previously observed only 34% growth inhibition of the MCF7 cells with 1 mM of butyrate [12]. In our study, the IC50 value of sodium butyrate against the MCF7 cells was found to be 0.576 mg/mL (5.23 mM) using the Alamar Blue assay (Table 1), with an R2 value of 0.9513, which is demonstrative of the reliability of the obtained results. Based on the R2 value, the findings of the cell viability study for sodium butyrate were statistically relevant, as this value was above the confidence interval (CI) of 95%. Previous preclinical research has also ascertained the IC50 value of sodium butyrate against the MCF7 breast cancer cell line with the following values: 1.26 mM [13] and 2.5 mM after 24 h [14], and 0.5 mM after 9 days exposure [11]. Earlier studies on the anticancer potential of gut metabolites have primarily utilised the MTT assay; however, the present study used the Alamar Blue assay to understand the anti-proliferative effects of these metabolites. The Alamar Blue assay is non-toxic and does not require lysed cells, unlike the MTT assay, and has been found to demonstrate more sensitivity towards certain compounds compared to MTT [15]. Similar to the MCF7 cell line, sodium butyrate presented with a mean inhibition of 80.8% at 3 mg/mL (R2 = 0.9315; IC50 = 0.557 mg/mL or 5.06 mM) against the MDA-MB-231 cells. Sodium butyrate has been assessed against the MDA-MB-231 cells previously, but to a lesser extent than MCF7 cells. Nonetheless, the anti-proliferative activity of sodium butyrate in the present study correlated with previous findings on the MDA-MB-231 cells [11,14]. The inhibitory percentage values were dose-dependent, where doses more than 0.5 mg/mL showed >50% cell growth inhibition and less than 0.25 mg/mL displayed <50% cell growth inhibition. Previously, sodium butyrate exhibited 85–90% inhibition against the MDA-MB-231 cells at 2.5 mM (0.275 mg/mL) with an IC50 value of 0.6 mM (0.066 mg/mL) [11]. That study utilised the Burton assay to measure the antiproliferative effect through variation of DNA content [11], whereas the Alamar Blue assay used in our study measures the metabolic activity of the cells. This could account for the discrepancies in activity observed between that study and the present study. Another factor of consideration in the assessment of butyrate as an anticancer agent is the ‘butyrate paradox’ phenomenon, in which low concentrations of butyrate can be carcinogenic, whereas higher concentrations of butyrate have anticancer effects [16]. Whilst the sodium salt of butyrate has not been explicitly studied clinically, SCFAs have been investigated in clinical settings against colorectal and breast cancer, as well as solid cancer tumour types [17,18,19]. Specifically, butyrate and propionate have been assessed clinically in the context of breast cancer, in which it was observed that patients with premenopausal breast cancer presented with a reduction in SCFA-producing bacteria and key SCFA-producing enzymes compared to healthy premenopausal women, which could serve as a diagnostic tool in premenopausal breast cancer [17]. As sodium butyrate is considered a more stable form of butyrate [4], further studies evaluating its efficacy in preclinical settings are necessary before clinical investigation.
Inosine demonstrated the growth inhibition value of 47.78% ± 8.89 at 3 mg/mL, respectively (R2 = 0.8027), with an IC50 value of 2.743 mg/mL (10.23 mM) against the MCF7 cells (Table 1). Whilst the cell inhibition percentages were significantly lower than sodium butyrate (p < 0.05), this study is amongst the first to assess the anti-proliferative activity of inosine against the MCF7 breast cancer cells and serves as a foundation for future research regarding its use as a natural anticancer agent. A previous study assessed inosine against the MCF7 and MDA-MB-231 breast cancer cells; however, the purpose of the study was to explore its cytoprotective role in breast cancer hypoxic conditions, which is different from the scope of the current study [20]. The authors reported that inosine, not adenosine, was the primary cytoprotective compound in breast cancer hypoxic conditions [20]. Inosine was the second most effective gut microbial metabolite in inhibiting the growth of the MDA-MB-231 cells dose-dependently (Table 1) in this study. At 3 and 2 mg/mL, inosine initiated 48.85% and 36.09% mean cell growth inhibition, respectively, with an IC50 value of 3.262 mg/mL (12.16 mM). The R2 value determined in the cell inhibition effect of inosine against the MDA-MB-231 cells was 0.9485, indicating that the data fit the regression model in the goodness-of-fit test. As with the MCF7 cell line, inosine has been assessed against the MDA-MB-231 cell line previously; however, the purpose of that study was to determine the role of inosine in breast cancer hypoxic conditions [20]. Therefore, our study is amongst the first to assess the anti-proliferative potential of inosine against the MDA-MB-231 cell line and will provide a framework for future investigation on this gut microbial metabolite and its bioactivity. Similar to sodium butyrate, inosine has not been examined in clinical settings.
Nisin has been primarily investigated against colorectal cancer cell lines; however, a few in vitro studies have previously observed high cytotoxicity and inhibition of cell proliferation against the MCF7 cells [21,22]. Nisin presented with cell inhibition values of 14.34% and 13.31% at 3 mg/mL (894.44 μM) and 2 mg/mL (596.29 μM), respectively (Table 1), against MCF7 cells in the present study. These findings contrasted with previous in vitro studies, which reported that nisin exhibited high cytotoxicity and selectivity against the MCF7 cells in a concentration-dependent manner using the MTT assay, but showed broad IC50 values of 5 μM (0.0168 mg/mL) [21] and 105.46 μM (0.354 mg/mL) [22]. The significant difference in the activity of nisin observed between our study and the literature could be attributed to the fact that the two prior studies utilised the MTT assay to assess the cell viability of nisin, whereas in the present study, the Alamar Blue assay was used. Similar to sodium butyrate and inosine, nisin has not been specifically studied clinically as an anticancer agent. However, other bacteriocins including the azurin-p28 peptide have been assessed against the central nervous system (CNS) tumours and p53(+) metastatic solid tumours clinically [23,24]. The potential anti-proliferative activity of nisin against the MDA-MB-231 breast cancer cells was not investigated before. In the present study, nisin presented with significantly lower (p < 0.05) cell growth inhibition activity compared to sodium butyrate and inosine at the 1–3 mg/mL range against the MDA-MB-231 cells (Table 1). At its highest tested concentration of 3 mg/mL (894.44 μM), the mean cell growth inhibition of nisin against the MDA-MB-231 cells was 24.46%. The anti-proliferative activity of nisin against the MDA-MB-231 cells was similar to that of the MCF7 cells.

2.2. Cytotoxicity of Gut Metabolites against Normal MCF10A Human Breast Epithelial Cells

The cytotoxicity of drugs to normal breast tissue due to the lack of selectivity is a serious concern in anticancer drug discovery. In addition to determining the cytotoxicity of sodium butyrate, nisin and inosine against the MCF7 and MDA-MB-231 breast cancer cells, their potential cytotoxicity against the normal MCF10A human breast epithelial cells was also evaluated using the Alamar Blue assay (Table 1). At the highest tested concentration of 3 mg/mL, nisin, inosine, and sodium butyrate demonstrated cytotoxicity against the MCF10A breast epithelial cells, with cell growth inhibition values of 69.43%, 87.64%, and 89.23%, respectively. Nisin, inosine, and sodium butyrate displayed IC50 values of 1.63 mg/mL (485.98 μM; R2 < 0.5), 0.655 mg/mL (2.44 mM; R2 = 0.7489), and 0.655 mg/mL (5.95 mM; R2 = 0.8740), respectively, against the MCF10A cells. The IC50 values of nisin and inosine against the MCF10A cells were lower than those for the MCF7 cells. These findings are contradictory to a previous in vitro study which identified that nisin expressed selective cytotoxicity for the MCF7 cells [21]. Comparatively, the IC50 value of sodium butyrate against the MCF10A cells (0.655 mg/mL; 5.95 mM) was greater than that of the MCF7 (0.576 mg/mL; 5.23 mM) and MDA-MB-231 (0.557 mg/mL; 5.06 mM) cells. This indicated that sodium butyrate had a greater cytotoxicity against the breast cancer cells than the normal breast epithelial cells. These findings warrant further investigation, as limited research has been conducted regarding the potential cytotoxicity of gut microbial metabolites to normal breast tissue. Compared to the current 2D cell assay, these gut metabolites may present differently in 3D cell culture or animal models, as they are more clinically representative. The appropriate administration route to avoid cytotoxicity to normal cells is another important consideration. Overall, future studies will need to determine the potential risk of gut metabolite administration to normal breast tissue and approaches to avoid cytotoxicity.

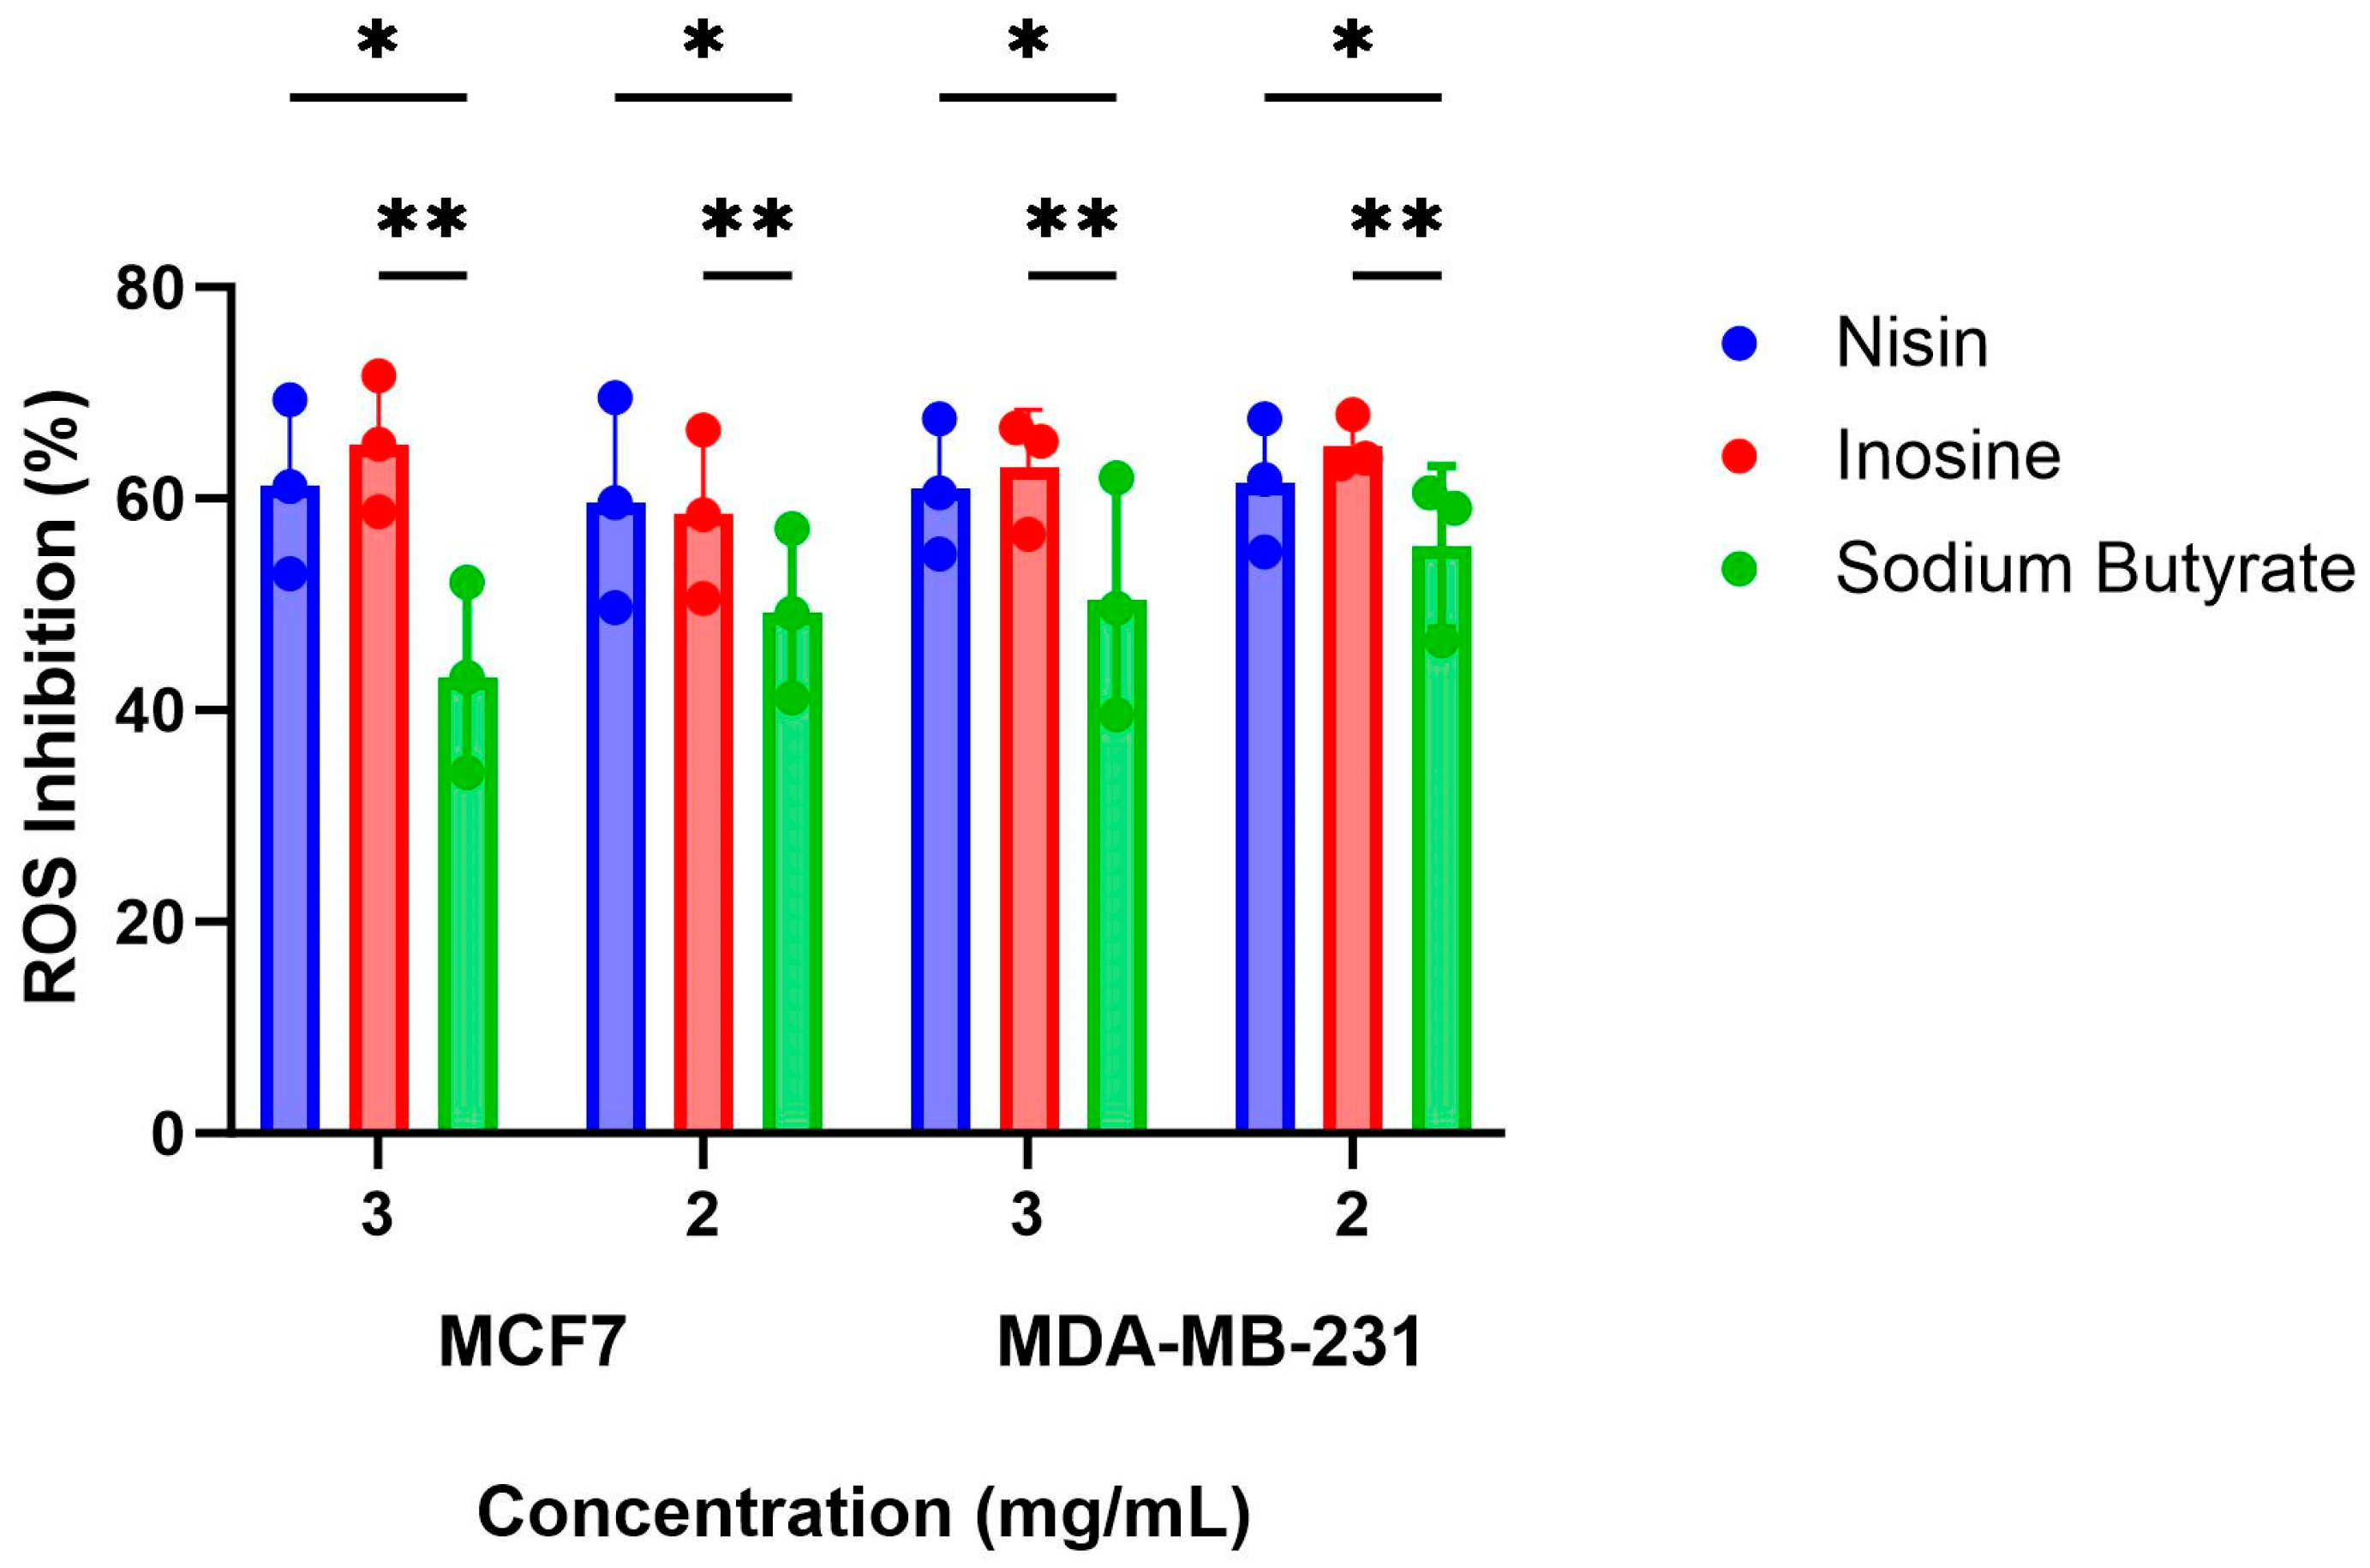
2.3. Inhibition of ROS Production by the Gut Metabolites in the MCF7 and MDA-MB-231 Cells

The increased production of ROS within a host can lead to carcinogenesis due to the initiation of DNA damage in normal cells and consequent apoptosis, whereas lower concentrations of ROS contribute to signalling processes involved in maintaining physiological homeostasis [25]. Previous studies have shown that the MCF7 cells produce high basal levels of intracellular ROS [26]. Therefore, identifying whether nisin, inosine, and sodium butyrate contribute to an increase in production of ROS was fundamental to assess a potential aggravating risk factor to the progression of breast cancer. Overall, the three gut metabolites were found to inhibit the production of ROS in the MCF7 cells in comparison to the negative control after 4 h of treatment (Figure 1). The positive control doxorubicin (DOX; 1 μM) increased the production of ROS by 11.22% compared to the negative control. The inhibitory effect of nisin on ROS production was found to be 61.14% and 59.63% at 3 and 2 mg/mL, respectively, compared to the negative control. Inosine demonstrated ROS inhibition values of 65.18% and 58.52% at 3 and 2 mg/mL, respectively, whereas sodium butyrate showed ROS inhibition values of 43.12% (3 mg/mL) and 49.16% (2 mg/mL) compared to the negative control. At 3 mg/mL, inosine exhibited significantly more ROS inhibition than did sodium butyrate (p = 0.0126). Previously, sodium butyrate was observed to increase levels of ROS after 48 h at 1, 5, and 10 mM, which initiated the induction of apoptosis in the MCF7 cells [27]. Our study assessed the impact of higher concentrations of sodium butyrate (27.25 and 18.17 mM) on ROS production by the MCF7 cells after 24 h of treatment compared to the previous study. Another study also observed that inosine increased the intracellular ROS levels in the Caco-2 colon cancer cells after 3 h at various concentrations [28].
This study also assessed whether the three gut microbial metabolites increased or decreased the abundance of ROS within the MDA-MB-231 breast cancer cell line after 4 h of treatment. Compared to the negative control (supplementary buffer), all three gut metabolites inhibited the production of ROS in the MDA-MB-231 cells (Figure 1). Nisin inhibited the production of ROS by 60.97% and 61.47% at 3 mg/mL (894.44 μM) and 2 mg/mL (596.29 μM), respectively. Inosine showed statistically similar (p > 0.05) ROS inhibition values of 62.94% and 65.03% at the two highest concentrations of 3 (11.18 mM) and 2 (7.46 mM) mg/mL, respectively. Compared to inosine at 3 and 2 mg/mL, sodium butyrate at 3 mg/mL (27.25 mM) had a significantly lower (p < 0.05; Figure 1) ROS inhibitory effect (50.37% inhibition). These findings are consistent with the MCF7 anti-proliferative data. The impact of sodium butyrate on the ROS levels of the MDA-MB-231 cells has not been assessed to date. The effect of DOX (1 μM) on the production of ROS was assessed as the positive control in this study and was found to increase the production of ROS by 22.58% in the MDA-MB-231 cells compared to the negative control.

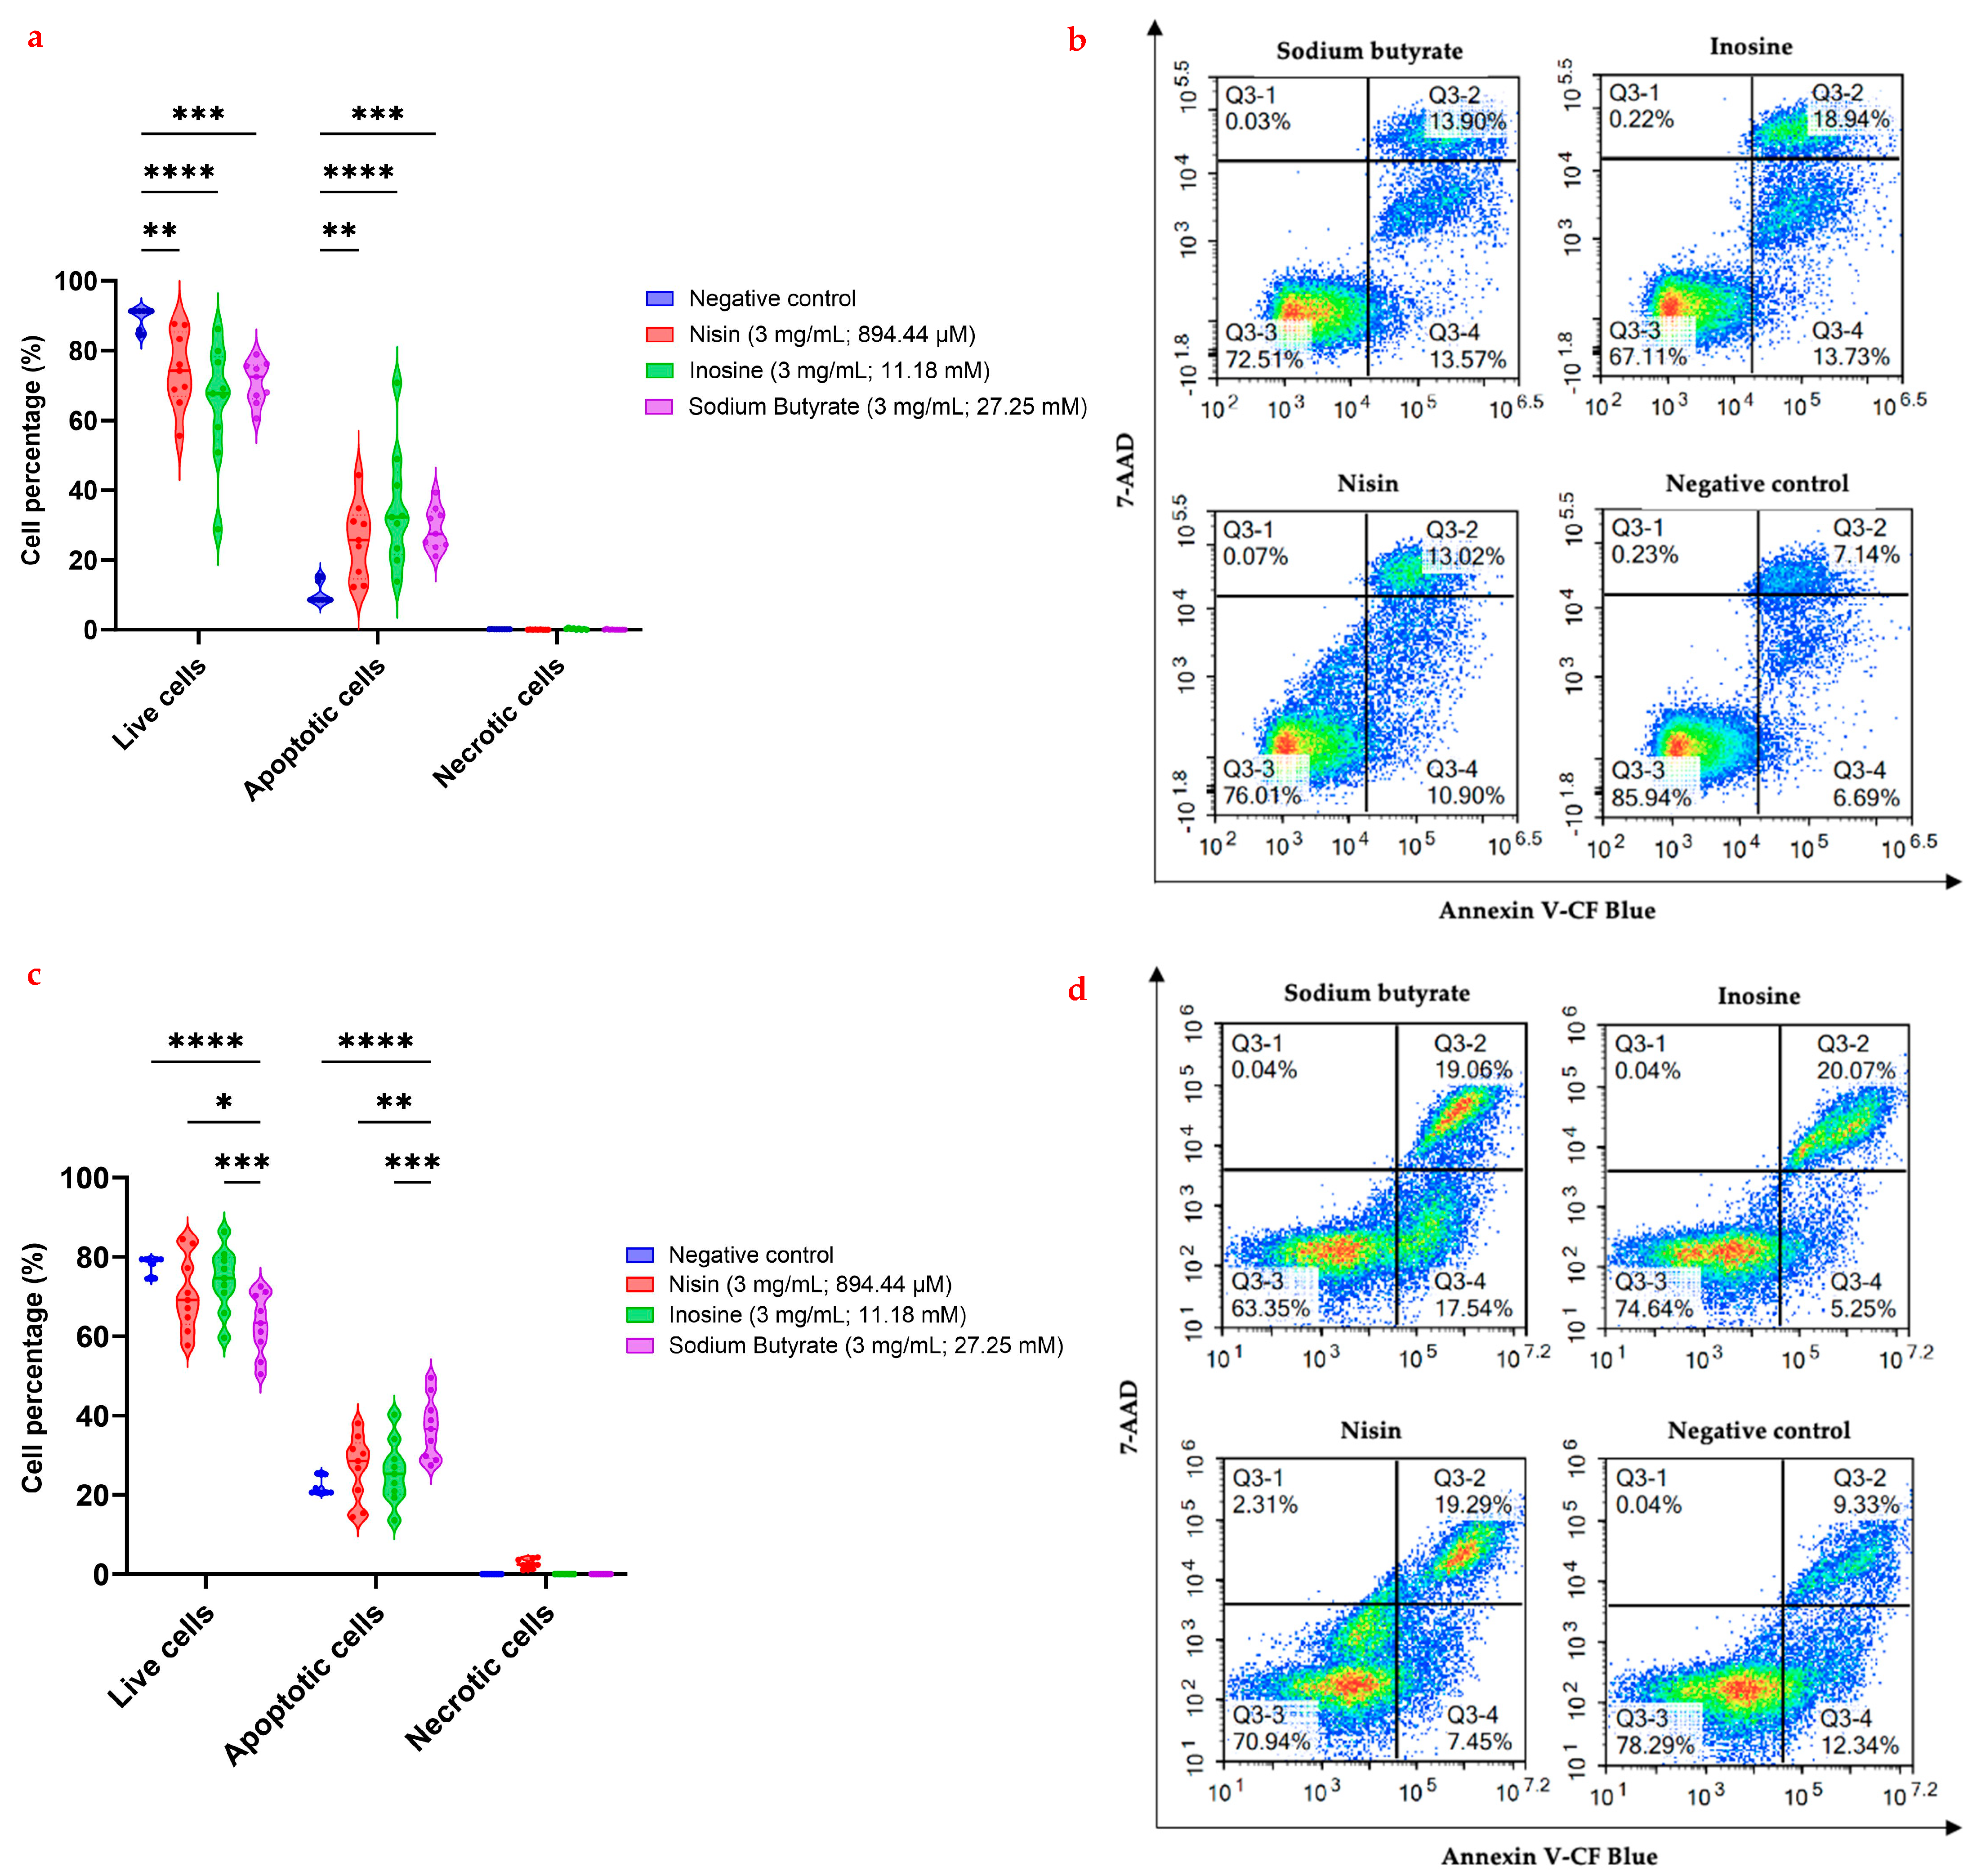
2.4. Flow Cytometric Analysis of Apoptosis in the MCF7 and MDA-MB-231 Cells Using Annexin V-CF Blue and 7-AAD

Apoptosis is a form of programmed cell death that, amongst numerous biological properties, functions to prevent cancer in the removal of cancerous cells from the host [29]. Given the significant role apoptotic cell death plays in cancer inhibition, targeting this molecular action is a primary aim of many novel anticancer agents. To ascertain whether the three gut microbial metabolites did initiate apoptosis in the MCF7 and MDA-MB-231 breast cancer cells after 24 h of treatment, the annexin V-CF blue and 7-AAD flow cytometric assay was utilized (Figure 2).
Of the three gut microbial metabolites, sodium butyrate treatment (3 mg/mL; 27.25 mM) after 24 h exhibited significantly more (p < 0.001; Figure 2a,b) early- and late-stage apoptotic cell death compared to the negative control, with a combined apoptotic initiation of 28.95% against the MCF7 cells. Previous studies identified that sodium butyrate induced cell cycle arrest in the G2 or G2/M phases against MCF7 breast cancer cells [11,14,30]. These studies on MCF7 cells reported that the mechanisms involved in cell cycle arrest included the inhibition of cell growth in a p53-independent manner and induction of apoptotic cell death via the Fas/Fas L system [14], and the inhibition of histone H1 kinase activity with increased levels of p21waft [30]. Another study identified that sodium butyrate induced apoptosis dose-dependently, i.e., a higher concentration (5 mM) led to a higher apoptotic induction [13]. Sodium butyrate was also found to initiate apoptotic cell death via cell cycle arrest at the G1/G2 phase [13,31]. Other studies have found sodium butyrate induces apoptosis through increased expression of 15-lipoxygenase-1 (15-Lox-1) [32], decreased intracellular glutathione levels [33], increased p21waf1/cip1 levels and interactions with PCNA [34], increased expression of death receptors [35], increased levels of Fas signalling via the Fas/Fas L system independently of p53 [14], and the induction of cell cycle arrest in the G2/M growth phase [11]. Morphological changes in the MCF7 cells when treated with sodium butyrate indicative of apoptosis were also reported previously, which was further validated by the observation that levels of the Bcl-2 protein were reduced by higher concentrations of sodium butyrate, correlating with the increased levels of apoptosis [36].
In the present study, sodium butyrate displayed the combined early- and late-stage apoptotic MDA-MB-231 cell percentage of 36.93% after 24 h treatment at 3 mg/mL (27.25 mM) (Figure 2d), which correlated with the anti-proliferative activity data (80.8% cell growth inhibition at 27.25 mM after 72 h). Furthermore, sodium butyrate exhibited significantly more early- and late-stage apoptotic MDA-MB-231 cells compared to the negative control (p < 0.0001), nisin (p = 0.0024), and inosine (p = 0.0007). In contrast to these findings, previous studies did not observe any induction of apoptosis by sodium butyrate in the MDA-MB-231 cells, although the MCF7 cells underwent apoptosis after sodium butyrate treatment of 2.5 mM for 48 h [14]. Interestingly, although the authors did not observe apoptosis induction in the MDA-MB-231 cells, sodium butyrate was found to induce cell cycle arrest in the G2/M phase [14]. Likewise, a study by Lallemand et al. (1999) acknowledged that sodium butyrate induced cell cycle arrest in the G2/M phase [30]. Another in vitro study was also unable to detect the initiation of apoptosis by sodium butyrate at 2.5 mM after 9 days using the gel electrophoresis and flow cytometric analyses in the oestrogen-independent cell lines including the MDA-MB-231 cells [11]. These findings may be ascribed to the butyrate paradox, in which lower concentrations of sodium butyrate show carcinogenic effects, whereas higher concentrations are required to demonstrate anticancer effects. The discrepancies observed between our study and previous reports could be associated with the high concentrations of sodium butyrate and treatment time point used in our study. In addition to these studies, other in vitro studies assessing the activity of sodium butyrate against the MDA-MB-231 cell line did not investigate its apoptotic induction potential [30,37]. Interestingly, the initiation of cell cycle arrest in the G2/M growth phase leading to the induction of apoptotic cell death in pyruvate carboxylase-knockdown MDA-MB-231 cells was observed previously [38]. As such, the present study may be the first to investigate the induction of MDA-MB-231 apoptotic cell death by sodium butyrate using flow cytometric analyses.
To date, there are no studies assessing the induction of apoptosis by inosine in the MCF7 cancer cells. In the present study, inosine at 3 mg/mL (11.18 mM) demonstrated significantly more (p < 0.0001; Figure 2a,b) apoptotic cell death compared to the negative control, with 34.83% of the MCF7 cells in the early- and late-stage apoptosis after 24 h of treatment. The initiation of apoptotic cell death by inosine is indicative of its anticancer potential; however, further investigation is required to assess its impact on cell cycle, as well as the potential signalling pathways involved in this activity. Earlier studies reported that inosine exhibited cytoprotective effects on normal breast cells during hypoxic conditions in breast cancer; however, that study did not examine the potential anticancer properties of inosine against the MCF7 cells [20]. As such, the present study is one of the first to report on both the cytotoxicity and the induction of apoptosis by inosine in the MCF7 cells. Inosine was not previously investigated for its action against the MDA-MB-231 cells with no reports on its potential apoptotic activity. We observed that inosine initiated early- and late-stage apoptotic cell death by 25.82% after 24 h at 3 mg/mL (11.18 mM); however, no statistical difference was observed compared to the negative control (p > 0.05). A previous study discussed the molecular pathways involved in the induction of apoptosis by biologically similar compounds (adenosine and ATP) to inosine and reported the cytoprotective action of inosine in breast cancer hypoxic conditions [20]. As the current study only measures the activity of inosine against the MDA-MB-231 cells after 24 h of treatment, future studies can evaluate its impact at different time points. Furthermore, the action of inosine on the MDA-MB-231 cell cycle should also be explored.
Nisin at 3 mg/mL (894.44 μM) showed significantly more (p < 0.01; Figure 2a,b) combined early- and late-stage apoptotic cell death (25.73%) in the MCF7 cells compared to the negative control. This finding is not in line with the anti-proliferative activity findings for nisin in the present study. This discrepancy can be attributed to the differences in the time-points of the two assays. Notably, the anti-proliferative activity was measured after 72 h whilst the flow cytometry assessment was performed after 24 h. Flow cytometric assessment at different time points, including at 72 h, may provide further insights into the apoptotic potential of nisin. The current findings on the induction of apoptosis by nisin were in line with the existing studies [21,22]. Earlier, an in vitro study observed apoptotic cell death-related morphological changes in the MCF7 cells following treatment with nisin with no cell lysis [21]. However, that study only utilized visual observations with an optical microscope of the cells upon treatment [21]. Despite extensive preclinical research investigating the anticancer action of nisin against other cancer types, limited in vitro studies have assessed its activity against breast cancer. Notably, previous studies did not report the cytotoxic or apoptotic potential of nisin against the MDA-MB-231 cells. In the flow cytometric analyses, nisin induced combined early- and late-stage apoptosis in the MDA-MB-231 cells by 26.77% after 24 h at 3 mg/mL (894.44 μM), with no statistical difference observed compared to the negative control (p > 0.05). Interestingly, nisin was observed to initiate small levels of necrotic cell death (2.56%). A previous study acknowledged that calcium influx accompanied, but did not cause, neuronal necrosis [39], which could account for the induction of calcium influx and necrotic cell death by nisin in the MCF7 cells in the present study. However, no studies to date have investigated the effect of nisin on necrosis against breast cancer cells or other cancer types. Notably, necrosis was not observed with the other two gut microbial metabolites in either the MCF7 or the MDA-MB-231 cells in this study. However, the positive control, doxorubicin, displayed 40.12% necrosis in the present study, which was expected based on previous literature [40].

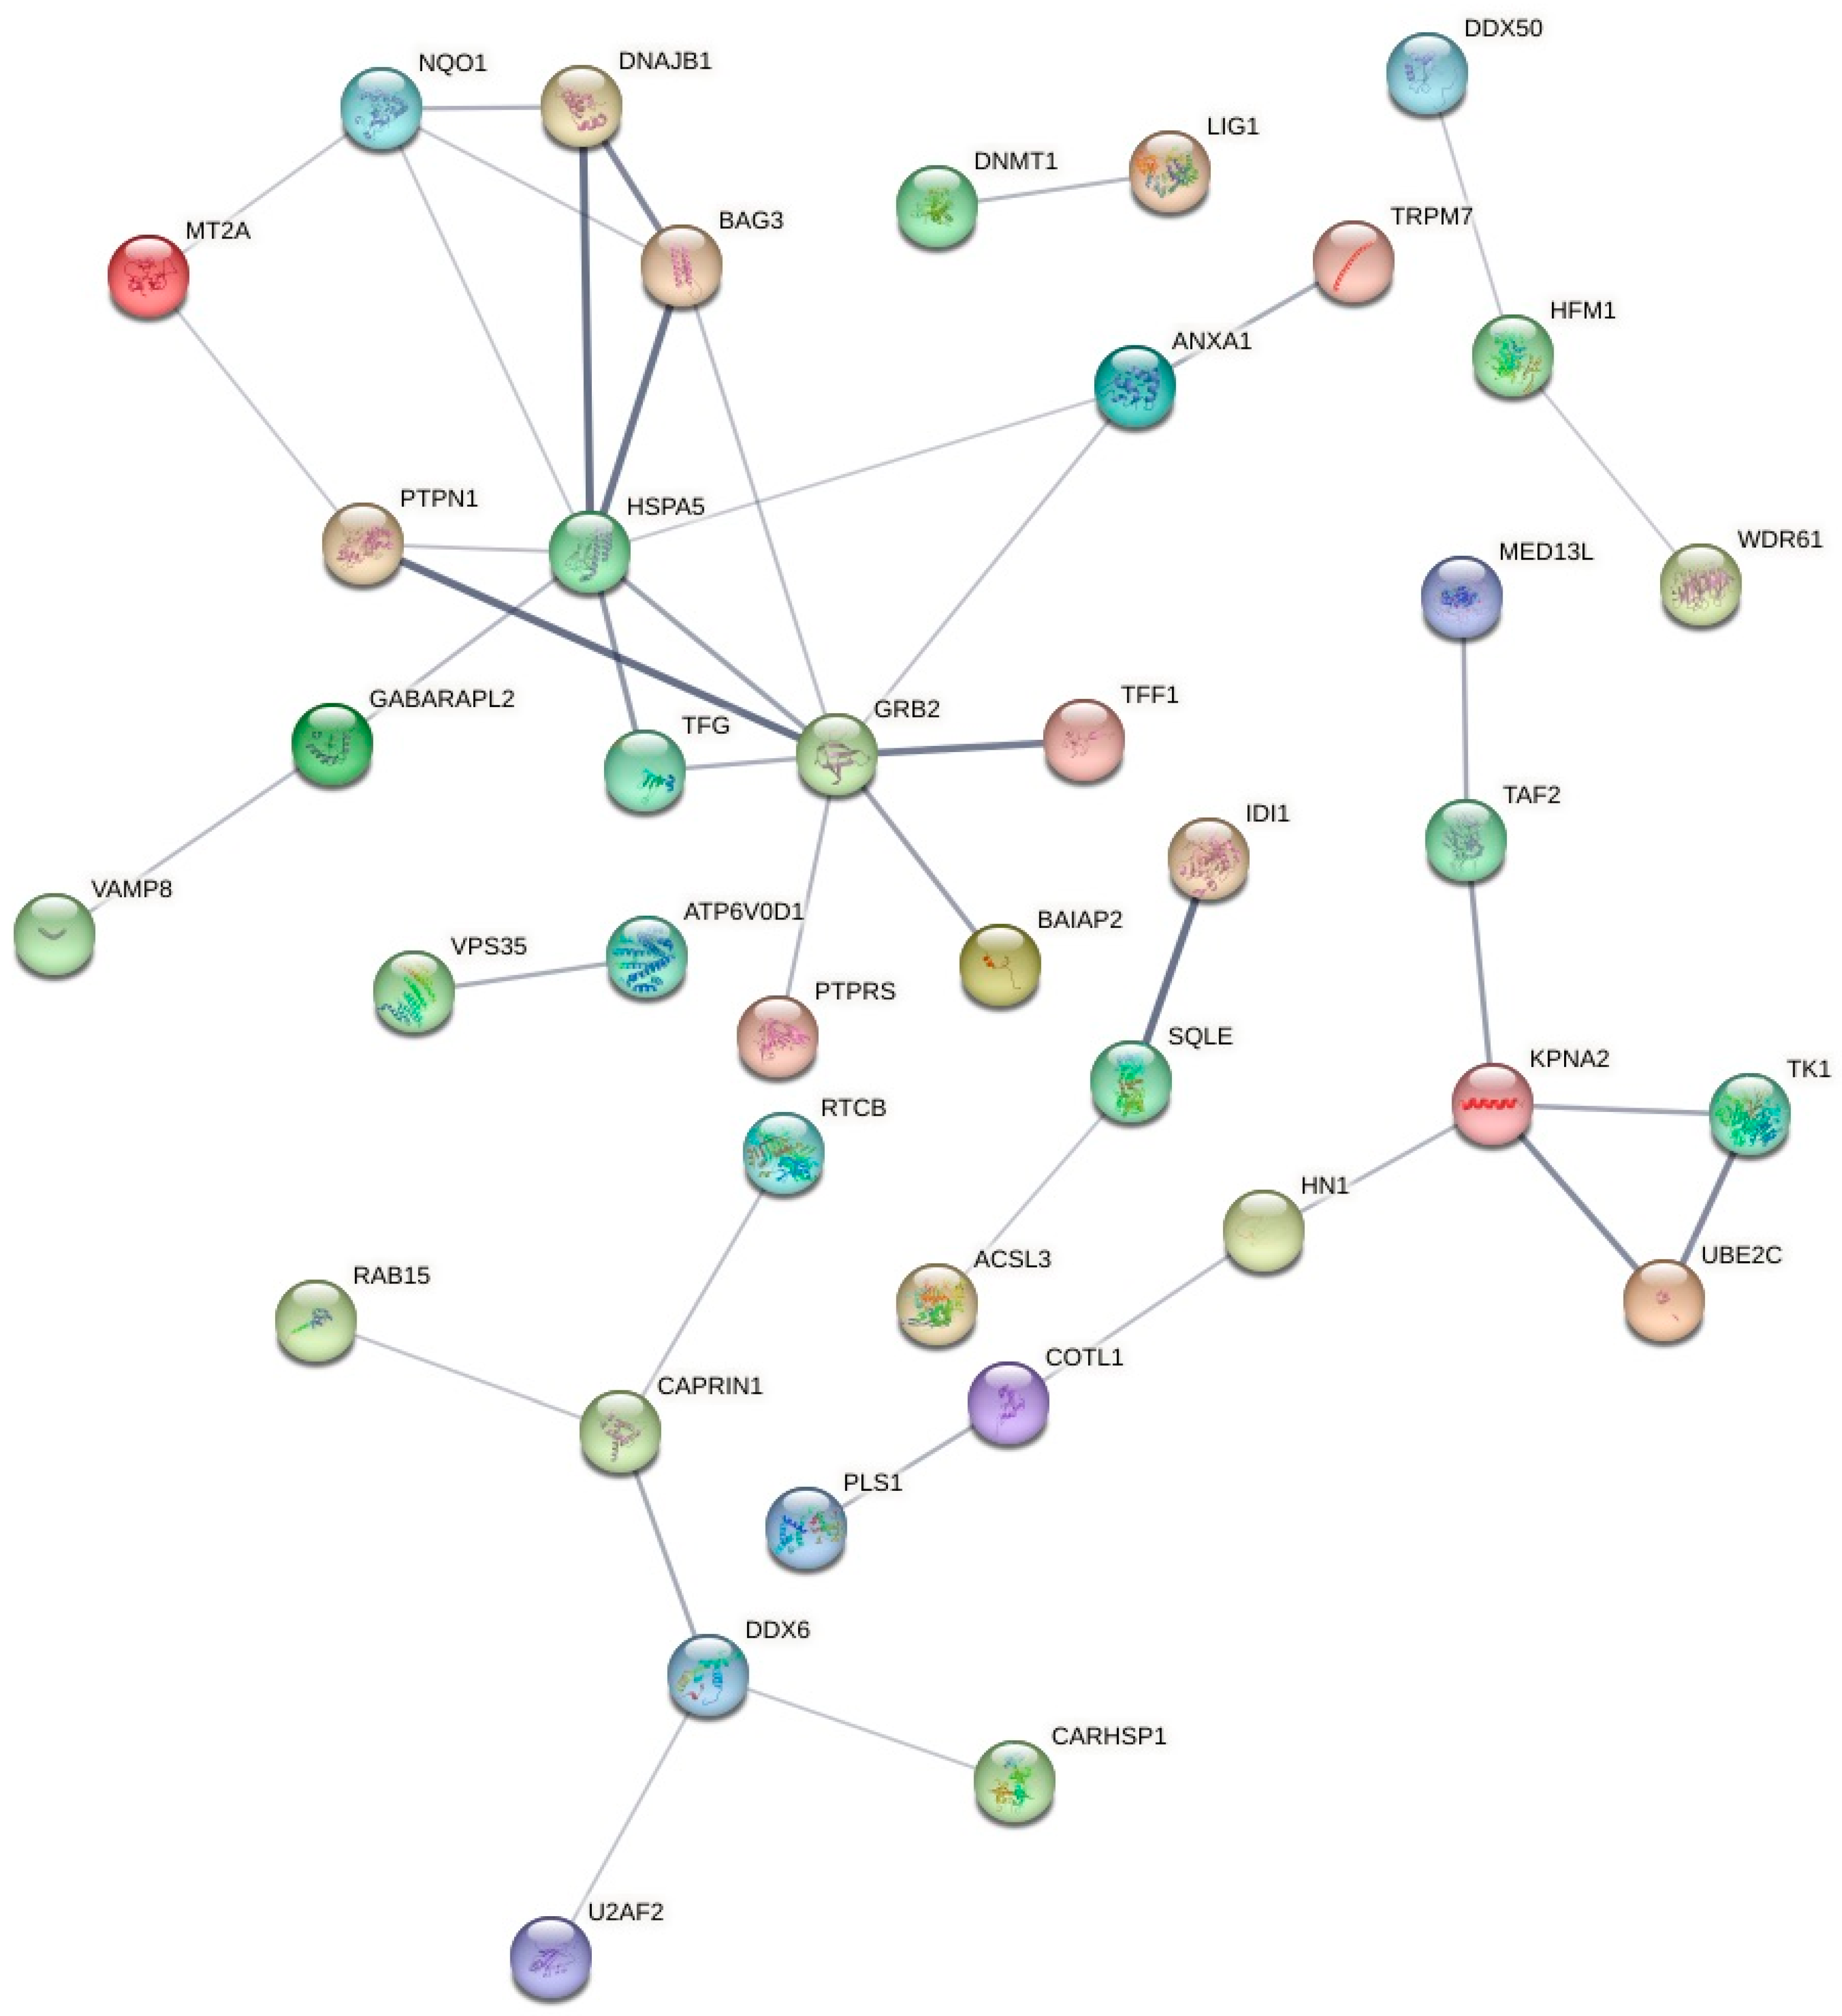
2.5. Proteomic Label-Free Bottom-up Quantification via Nano-UPLC-qTOF-MS

To quantify significant proteins involved in the anticancer action of the tested metabolites against the MCF7 cells, the raw proteomics data were filtered based on the following parameters: a p-value of at least ≤ 0.05, q-value ≤ 0.05, |log2fold change| ≥ 2, and unique peptide number of >0 were considered significant and included for further pathway analyses. The MCF7 breast cancer cell line was utilised, as most studies on gut microbial metabolites against breast cancer have been performed on this cell line. The resulting statistically significant proteins were further categorised based on their upregulation or downregulation by the metabolite treatments. To understand the molecular pathways involved based on the quantified proteins, several online software programs were implemented to specify the potential pathways triggered by the metabolites, including g:Profiler (Ensembl version 107, Ensembl Genomes version 54, Wormbase ParaSite version 17), Reactome (version 83), UniProt (release 2022_04), and STRING (version 12.0).

2.5.1. Protein Identification and Quantification in the MCF7 Cells after the Treatment with Sodium Butyrate

Whilst studies have assessed the anticancer potential of sodium butyrate on the MCF7 cell line, the molecular mechanisms of action involved have not been studied extensively, with most studies utilizing fewer specific assays and technologies [11,14,30,34,35,41,42,43,44,45,46]. Reports have consistently indicated high levels of cytotoxicity by sodium butyrate at varying concentrations against the MCF7 breast cancer cell line [11,13,14,30,31,32,33,34,35,36,41], with several studies reaching similar conclusions regarding its molecular mechanisms of action. In the present study, sodium butyrate was determined to be the most effective gut microbial metabolite against the MCF7 and MDA-MB-231 breast cancer cell lines with induction of apoptosis and inhibition of ROS production. It also displayed less cytotoxicity toward the normal MCF10A human breast epithelial cells. In the proteomics analyses, sodium butyrate exhibited minimal modulation of cell cycle processes, in comparison to nisin and inosine; however, it significantly regulated the activity of signal transduction and metabolic processes in the MCF7 cells. Specifically, PSAP (prosaposin) demonstrated extensive potential activity both stand-alone and in conjunction with the expression of other genes upon sodium butyrate treatment. The upregulation of PSAP as a stand-alone effect potentially activated surfactant metabolism, and its combined upregulation with GRB2 initiated a probable signal regulatory protein family interaction within the MCF7 cells. Additionally, the combined effect of PSAP with six other upregulated genes indicates a potential initiation of platelet activation, signalling, and aggregation. Further experimental data will be required to validate these findings. The upregulation of PSAP, PYGB, CYB5R1, NEU1, and COTL1, in combination with the downregulation of VAMP8, PYCARD, IRAG2, and OSTF1, indicated a potential initiation of neutrophil degranulation (Table 2). Of note, the combined upregulation of GRB2 and PTPN1, coupled with the downregulation of LIG1, initiated a possible negative regulation of MET activity. The strong association between these genes can be seen in Figure 3. In addition, the combined upregulation of GRB2 and PTPRS potentially initiated signalling by NTRK3 (TRKC).
PSAP is a pleiotropic growth factor that has been identified to be upregulated in breast cancer cell lines; however, the precise role of this secreted protein in breast cancer is currently undetermined [47]. An in vivo study assessed the activity of this gene against the MCF7 and the T47D breast cancer cells in four-week-old female v/v mice, and the overexpression of PSAP was found to increase the ER α-mediated signalling axis and consequently to contribute to the development and progression of these specific breast cancer types [47]. That animal study observed that upregulation of PSAP increased the level of ERα protein expression dose-dependently in the tested cell lines and enhanced ERα-mediated transcription in an oestrogen-independent manner [47]. However, it was also determined that PSAP significantly encouraged tumour growth in the mice in comparison to the control treatment and potentially activated cell proliferation within the selected cell lines [47]. Interestingly, our study did not observe interactions between the PSAP gene and oestrogen receptor-related pathways; however, it did determine the action of PSAP in initiating multiple signalling pathways within the MCF7 cell line. Comparatively, an in vitro study identified that increased expression of the PSAP protein can inhibit the metastatic process via stimulation of p53 activity in MDA-MB-231 breast cancer cells, whereas inhibition of PSAP expression led to an increase in metastasis [48]. Whilst the findings of the two studies [47,48] differed in the action of PSAP in the context of breast cancer, both studies recognised that PSAP can serve as a biomarker in the malignancy signature of breast cancer, which could further be utilised as a therapeutic target for anticancer agents. Similarly, GRB2 (growth factor receptor-bound protein-2) was previously found to be markedly overexpressed in specific breast cancer cell lines, including the MCF7 cells, whereas it was significantly downregulated in normal breast epithelial tissue [49]. The authors identified that GRB2 activated the Ras signalling pathway, which regulated the growth factor sensitivity of human breast cancer cell lines [49]. It is well known that GRB2 is responsible for significant cellular functions, and its inhibition blocks cell proliferation and transformation of multiple cell types and impairs developmental processes in various organisms [50]. GRB2 also links the epidermal growth factor receptor tyrosine kinase to the activation of Ras signalling and ERK1 and ERK2, two Ras downstream kinases [50]. GRB2 requires further investigation into its effect on other kinases based on its significant role in signal transduction [50]. The recognition of the vital role of GRB2 in signal transduction processes is consistent with the findings of the present study demonstrating its role in initiating negative regulation of MET activity, signalling by NTRK3, cell-to-cell communication, platelet signalling and aggregation, and signalling of regulatory family protein interactions. A previous study assessed the effect of a GRB2-targeted therapeutic miR-27b-3p on the MDA-MB-231 and the MCF7 breast cancer cells to inactivate the MAPK/ERK and PI3K/AKT signalling pathways [51]. The GRB2-targeted therapeutic was observed to inhibit cell proliferation and colony formation in the tested breast cancer cell lines, including the MCF7, and was found to induce controlled apoptotic cell death and activated synergistic action with paclitaxel [51]. Notably, the GRB2-targeted therapeutic demonstrated potential in combatting multi-drug chemoresistance commonly seen with standard drugs for breast cancer [51]. The present study also observed that the combined activity of the upregulation of KPNA2 and downregulation of TFF1 potentially influenced oestrogen-dependent gene expression, which is a strong factor of consideration when examining the activity of sodium butyrate against oestrogen-dependent breast cancer types, including the MCF7. This probable combined activity of KPNA2 and TFF1 is consistent with the findings of a previous study that assessed the regulation of gene expression in HER-2-negative breast cancer patients, and observed the upregulation of KPNA2 and downregulation of TFF1 [52]. The oestrogen hormone can modulate gene expression via binding to oestrogen receptors (ERs), which bind to DNA and can alter DNA transcription [53]. This is a notable physiological function by the oestrogen hormone, and the modulation of oestrogen-dependent gene expression by sodium butyrate is a significant finding in the examination of this compound against the oestrogen-dependent MCF7 cells.

2.5.2. Protein Identification and Quantification in the MCF7 Cells after the Treatment with Inosine

As there is no existing research on the activity of inosine against the MCF7 cells, the present study is the first to report on the molecular pathways activated in this cell type after inosine treatment. Overall, inosine regulated the expression of proteins involved in the modulation of cell cycle processes in the MCF7 cells. Similar to nisin, inosine potentially initiated the downregulation of the PLK1 gene, which was involved in multiple cell cycle-related pathways, as depicted in Figure 4. As a stand-alone interaction, the downregulation of PLK1 indicated a probable initiation of both polo-like kinase-mediated events and mitotic metaphase/anaphase transition. The combined interaction of the downregulation of PLK1 and SMC3 implied the activation of mitotic telophase/cytokinesis processes, the upregulation of RRM2 and TK1 and the downregulation of PLK1 and SMC3 potentially activated mitotic processes within the cell cycle of MCF7 cells after inosine treatment. Notably, the combined upregulation of RRM2 and TK1 indicates a potential initiation of G1/S-specific transcription, G1/S transition, and mitotic G1 phase and G1/S transition, which may imply that treatment with inosine induced cell cycle arrest in the G1/S growth phases. This could be confirmed with future cell cycle-specific assays. Furthermore, the increased expression of the P08243 protein, initiating expression of ASNS, in the MCF7 cells by inosine treatment could indicate the activation of multiple pathways, including ATF4 activation of genes in response to endoplasmic reticulum stress, response of EIF2AK1 (HRI) to heme deficiency, and PERK regulation. Significant interactions between genes following inosine treatment in the MCF7 cells are visually represented by the STRING network in Figure 4 and are also outlined in relation to their molecular activities in Table 2.
As aforementioned, upregulation of the PLK1 gene was found to be associated with poor prognosis in breast cancer patients and may serve as a biomarker for diagnosis [54], whereas downregulation of this gene correlated with the induction of cell cycle arrest in the G2/M growth phase and inhibited the proliferation of the MCF7 breast cancer cells [55]. Our findings demonstrated that inosine potentially downregulated PLK1, indicating its potential interactions with the cell cycle processes that could contribute to apoptosis in the MCF7 cells. The upregulation of the RRM2 (ribonucleotide reductase subunit 2) upon inosine treatment was another key observation against the MCF7 cells, as it potentially activated multiple cell cycle processes in combination with the increased gene expression of TK1, specifically in the G1/S growth phase of the cell cycle as indicated by the Reactome analyses. RRM2 has been identified as a potential proliferation biomarker in different cancer types, including breast cancer, due to its high expression [56,57]. An in vitro study assessed the activity of an RRM2-targeted drug treatment against human cervical cancer cells, in which it was observed that the downregulation of RRM2 correlated with the induction of apoptotic cell death and cell cycle arrest, and these findings were further supported by subsequent in vivo studies assessing the role of RRM2 [57]. These findings conflict with the observations of our study, as we found an upregulation of RRM2 in the MCF7 cells and the induction of apoptotic cell death upon inosine treatment. Another study assessed the activity of RRM2 in an adrenocortical cancer cell line and reported that it had a greater upregulation in the S phase compared to the G1 phase, which caused a block in the S phase and an increase in cell abundance within the G1 phase [56]. The probable initiation of activity within the G1 and S cell cycle phases by the upregulation of the RRM2 correlated with the observations of the present study. As with the previous studies on different cancer types, expression of RRM2 was found to be increased in breast cancer patients in comparison to normal breast tissue [58,59]. The identification of RRM2 as the malignancy signature indicates a potential therapeutic target for new anticancer therapies. A previous study also observed that downregulation of RRM2 correlated with an inhibition in cell proliferation and growth in breast cancer cell lines, including triple negative and luminal subtypes, which demonstrated the potential premise of implementing RRM2 inhibitors as therapeutic agents in cancer [58]. Upregulation of the RRM2 was coupled with an upregulation of the TK1 (Thymidine kinase 1), contributing to the potential modulation of the cell cycle molecular pathway. TK1 has served as a biomarker of cell proliferation and has demonstrated promising prognostic value in early-stage breast cancer patients [60], and increased gene expression of TK1 was associated with disease progression and poor treatment outcomes in specific breast cancer types [61], which indicated a potential use of this gene to monitor treatment outcomes in breast cancer patients and act as a therapeutic target. TK1 regulates cell cycle and plays a significant role in DNA synthesis under normal physiological conditions; however, previous studies on its potential as a biomarker for breast cancer progression did not extensively report its cell cycle regulation in a tumour microenvironment. Whilst the utilisation of this gene as a prognostic breast cancer indicator has been explored, the molecular pathways associated with this gene are not well understood. Furthermore, SMC3 was observed to be downregulated by the inosine treatment in the MCF7 cells in the present study. The impact of an SMC3 inhibitor in the MCF7 cell line was also evaluated previously, and it was observed that SMC3 downregulation induced apoptotic cell death and inhibited cell proliferation and cell cycle progression at G1 [62]. Whilst the previous studies on the role of SMC3 in cohesin complex and other cohesin subunits are available in the literature [62], further investigation is warranted to understand its fundamental role in breast cancer.

2.5.3. Protein Identification and Quantification in the MCF7 Cells after the Treatment with Nisin

As nisin induced apoptotic cell death in the MCF7 cells, the differential expression of key proteins in the MCF7 cells after 24 h of treatment with nisin was analysed using label-free LC-MS/MS proteomics. A comprehensive summary of the molecular action of nisin is depicted in Figure 5, indicating that nisin stimulated the dynein–dynactin complex and kinase-binding processes in the MCF7 cells. As molecular studies on the anticancer activity of nisin against the MCF7 cells is limited, the present study provided novel insights into the molecular pathways activated by nisin in this cell type. Nisin potentially triggered the activation of multiple components of the cell cycle in the MCF7 cells. It was found to upregulate the Q9HC77 and A0A7P0Z4C3 proteins, which could initiate the upregulation of the DCTN1 (dynactin subunit 1) and CENPJ (centromeric protein J) genes, and downregulated P53350 protein, which instigated the downregulation of the polo-like kinase 1 (PLK1) gene. The collective upregulation and downregulation of these specific genes could be associated with the initiation of G2/M transition and mitotic G2-G2/M growth phases within the cell cycle, as well as mitotic metaphase/anaphase transition by the PLK1 gene individually, as determined by the Reactome (version 83) software. The combined activity of the DYNC1LI1, DCTN1, CENPJ, and PLK1 genes potentially further triggered mitotic prometaphase within the MCF7 cells. These observations indicate a strong effect on the cell cycle by nisin.
Under normal physiological conditions, the CENPJ gene is associated with the gamma–tubulin complex [63] and it maintains normal spindle morphology and centrosome integrity during cell division processes [64]. A study observed that the increased expression of CENPJ led to the induction of apoptosis and inhibition of cell proliferation in HeLa cells, in which cell cycle arrest was initiated in the G2/M phase [65]. These previous preclinical findings are of particular significance, as the present study also identified potential activity in the G2/M cell cycle growth phase following the overexpression of CENPJ, as well as observing the induction of MCF7 apoptotic cell death by nisin. In another preclinical study, the inhibition of apoptotic cell death was observed to be associated with the repression of caspase-3 by the DCTN1 gene [66]. In an in vitro study assessing dynactin subunits in hepatocellular carcinoma (HCC), the DCTN1 subunit was found to have no impact on the prognosis of HCC, despite this gene being upregulated in HCC patients in comparison to normal tissue, and the increased levels of the dynactin subunits correlated with the occurrence of AFP-negative expression in HCC patients [67]. Whilst that study did not provide a detailed overview of the DCTN1 gene activity in relation to cancer, it acknowledged that the DCTN2 subunit promoted cell cycle progression as an oncogene in HCC [67], which indicated that it promoted cell cycle in a cancer microenvironment and could serve as a therapeutic target. DCTN1 was also identified to be upregulated in colon adenocarcinoma tissue in comparison to normal tissue [68]. Notably, a study by Wang et al. [68] also determined that gene expression of specific dynactin subunits, including DCTN1, was directly related to the cell cycle, apoptosis, and metastatic pathways, which correlated with the findings of the present study, indicating that the potential upregulation of this gene was linked with the initiation of multiple cell cycle processes. The increase in cell division processes and growth of the MCF7 cells could also account for the high cell viability values after 72 h of treatment with nisin observed in the Alamar Blue assay in the present study. Furthermore, nisin possibly downregulated the expression of the PLK1 gene in the MCF7 cells. Previously, PLK1 was reported to regulate cell cycle in the MCF7 cells and was upregulated during mitotic processes [55], which correlated with the findings of the present study on the role of this gene in potentially activating mitotic prometaphase, as well as metaphase/anaphase transition. The effect of PLK1 overexpression on the cell cycle progression includes perturbations to cytokinesis, an increase in larger cells with fragmented nuclei, and delayed mitotic progression [69]. Interestingly, another study identified that PLK1 offered therapeutic potential in oestrogen-receptor positive breast cancer cell lines, including the MCF7; however, the overexpression correlated with poorer prognosis in breast cancer patients, including the MDA-MB-231 cell line [54]. The impact of the PLK1 inhibitor RO3280 on the cell proliferation and molecular pathways of breast cancer cell lines was also assessed earlier, and the MCF7 cell line was found to be the most sensitive to the treatment and produced the most promising results [55]. The inhibitor was observed to inhibit cell proliferation, induced cell cycle arrest in the G2/M phase and apoptotic cell death, caused DNA damage, and also reduced the mitochondrial membrane potential in the MCF7 cells [55]. These findings are in line with the present study, as the nisin treatment acted as a potential PLK1 inhibitor against the MCF7 cells and potentially initiated regulation of PLK1 activity at the G2/M transition of the cell cycle. Based on the present findings and previous preclinical research, more in vitro and in vivo studies are necessary to elucidate the potential therapeutic role of nisin in breast cancer.

3. Materials and Methods

3.1. Preparation of Gut Microbial Metabolite

The gut microbial metabolites nisin, inosine, and sodium butyrate and positive standard doxorubicin (DOX) were purchased from Sigma Aldrich, Castle Hill, NSW, Australia. Stock concentrations of 6.5 mg/mL (1.94 mM), 15 mg/mL (55.92 mM), and 500 mg/mL (4.54 M) for nisin, inosine, and sodium butyrate, respectively, were prepared in sterile Milli-Q water based on their solubility. A stock concentration of 1 mM DOX was prepared in sterile DMSO.

3.2. Determination of Cancer Cell Viability against MCF7 and MDA-MB-231 Cells, and Potential Cytotoxicity on the MCF10A Human Breast Epithelial Cells

The MCF7 (RRID:CVCL_0031) human breast adenocarcinoma, MDA-MB-231 (RRID:CVCL_0062) human breast adenocarcinoma and the MCF10A (RRID:CVCL_0598) human breast epithelial cells were purchased from the American Type Culture Collection (ATCC, Manassas, VA, USA) and cultured and maintained in the PC2 Pharmacology Laboratory at the NICM Health Research Institute (NICM HRI), Western Sydney University as per the previously described method [70]. Briefly, the MCF7 and MDA-MB-231 cells were grown in DMEM (Dulbecco’s Modified Eagle Medium; Lonza Australia, Mount Waverley, VIC, Australia) comprised of 4.5 g L−1 glucose, L-glutamine, and sodium pyruvate supplemented with 10% fetal bovine serum (FBS; In Vitro Technologies, Lane Cove West, NSW, Australia) and 1% penicillin-streptomycin (Sigma-Aldrich, NSW, Australia). The MCF10A cells were grown in MEGM (Mammary Epithelial Cell Growth Medium; Lonza Australia, Mount Waverley, VIC, Australia) comprised of 2.00 mL BPE, 0.50 mL hEGF, 0.50 mL insulin, 0.50 mL hydrocortisone, and 0.50 mL GA-1000 (Lonza Australia, Mount Waverley, VIC, Australia). Normal FBS-containing DMEM and MEGM media were used as the negative controls for the breast cancer and the normal breast cells, respectively, whereas 1 μM of DOX was used as the positive control. In a 96-well plate, 100 μL of MCF7, MDA-MB-231, and MCF10A was seeded in each well at a cell count of 1 × 10⁵/mL and incubated overnight at 37 °C in the presence of 5% CO2 to adhere to the base of the well. These cells were then treated with different concentrations of sodium butyrate, nisin and inosine (in triplicate) for 72 h, ranging from 0.03125–3 mg/mL. To determine the potential anti-proliferative activity of the gut metabolites against the breast cancer and normal breast epithelial cells, the study utilised the Alamar Blue assay at the end of the 72-h period [70]. This assay measures the level of oxidation during cellular respiration which is directly proportional to the number of viable cells [70]. Following the 72-h incubation period, the media was removed from the wells and 100 μL of the Alamar Blue dye (0.1 mg/mL) was added to each well and incubated for 3 h at 37 °C in the presence of 5% CO2. The fluorescence was measured using a microplate spectrophotometer (BMG CLARIOstar, Mornington, VIC, Australia) at an emission wavelength at 595 nm and an excitation wavelength at 555 nm. The cell viability of the cell lines was calculated as a percentage of the negative control (DMEM for breast cancer cells and MEGM normal breast epithelial cells).

3.3. Reactive Oxygen Species (ROS) Assay

Elevated levels of ROS contribute to carcinogenesis and tumour metastasis [40], which illustrates the significance of ROS detection in the proposed study. The intracellular ROS level in the MCF7 and MDA-MB-231 breast cancer cells after treatment with sodium butyrate, nisin and inosine was evaluated using the DCFDA (2′,7′-dichlorofluorescein diacetate) Cellular ROS Detection Assay Kit (#ab113851; Abcam, Melbourne, VIC, Australia) according to the manufacturer’s protocol and as per the method described by Alsherbiny, Bhuyan [40]. In a 96-well plate, 100 μL of MCF7 and MDA-MB-231 cells was seeded in each well at a cell count of 2.5 × 10⁵/mL and incubated overnight at 37 °C in the presence of 5% CO2 to adhere to the base of the well. The MCF7 and MDA-MB-231 cells were stained with DCFDA fluorogenic dye and incubated for 45 min at 37 °C in the presence of 5% CO2. Following incubation, the wells were washed with 1× buffer and treated with the two concentrations (2 and 3 mg/mL) of the three gut metabolites. DOX (1 μM) was used as the positive drug control, tert-butyl hydrogen peroxide (TBHP; 250 μM) as the control for ROS production, and supplementary buffer (provided with the kit) as the negative control. The cells were then incubated for 4 h at 37 °C in the presence of 5% CO2. The fluorescence was measured using a microplate spectrophotometer (BMG CLARIOstar, Mornington, VIC, Australia) at an emission wavelength at 535 nm and an excitation wavelength at 485 nm.

3.4. Flow Cytometric Analysis Evaluation of the Apoptotic Profiles of the Cells

Based on the cell viability data, flow cytometry was used for the evaluation of apoptosis in the MCF7 and MDA-MB-231 cells after treatment with sodium butyrate, nisin and inosine as per the protocols described earlier using an annexin V and 7-AAD-based kit (#ab214663, Abcam, Melbourne, VIC, Australia) [40,71]. Annexin V detects phosphatidylserine on the external membrane of apoptotic cells, whereas 7-AAD is a DNA fluorescent and dead-cell marker that indicates any disruption of cell membrane structural integrity [71]. Apoptosis is an early-occurring molecular event, and most studies determined the induction of apoptosis within 24 h to accurately detect both early- and late-stage apoptotic death [40,72].
The MCF7 and MDA-MB-231 cells were cultured in T75 cell culture flasks using DMEM with 10% FBS at a seeding density of 1 × 10⁵/mL and were incubated overnight at 37 °C in the presence of 5% CO2 to adhere to the back wall of the flask. The media was aspirated and replaced with fresh FBS-containing media, and the cultured flasks were then treated with the highest concentration of each gut metabolite (3 mg/mL), DOX at a concentration of 1 μM as the positive control and non-FBS-containing media as the negative control and incubated for 24 h. Following the 24-h incubation period, the suspension cell media contained in each flask was collected. The adherent cells remaining in each flask were then treated with 0.25% w/v of trypsin (TrypLE™ Express Enzyme, Thermo Fisher Scientific, North Ryde, NSW, Australia) for 5 min, neutralized and combined with the suspension cell media. The cell media was then centrifuged at 500× g for 5 min at room temperature (RT) to collect the cell pellet. The pellet was resuspended in 1 mL of PBS and centrifuged at 500× g for 5 min, and this step was then repeated. Harvested cell pellets were resuspended in 0.5 mL of 1× binding buffer at a final cell concentration of 1 × 10⁶ cells/mL, and 5 μL of annexin V-CF blue and 7-AAD staining solutions were added to each 200 μL of cell suspension. The cells were then incubated at 37 °C in the presence of 5% CO2 in darkness at RT for 15 min, after which 400 μL of 1× binding buffer was added. Then, 200 μL of the new suspension was added to a 96-well V-bottom plate in triplicate for each treatment. The cells were then analysed by ACEA Biosciences Novocyte 3000 flow cytometer (ACEA Biosciences Inc., San Diego, CA, USA).
The NovoExpress (version 1.5.0, ACEA Biosciences Inc., San Diego, CA, USA) software was implemented for analysis and processing. Furthermore, cells were gated on FSC vs. SSC to exclude the debris near the origin and cell aggregates. To determine which cells were viable and which were undergoing apoptotic cell death, dot-plots of annexin V-CF in Pacific Blue vs. 7-AAD fluorescence in PerCP were gated in a quadrant, in which the lower-left quadrant indicated live cells (+Annexin V and −7-AAD), the lower-right quadrant early apoptotic cells (+Annexin V and −7-AAD), the upper-right quadrant late apoptotic cells (+Annexin V and +7-AAD), and the upper-left quadrant necrotic cells (−Annexin V and +7-AAD).

3.5. Proteomics Analyses

3.5.1. Cell Culture, Treatment, and Protein Extraction

The MCF7 cells were cultured in T75 cell culture flasks using DMEM with 10% FBS at a seeding density of 1 × 10⁵/mL and were incubated overnight at 37 °C in the presence of 5% CO2 to adhere to the back wall of the flask. The media was aspirated and replaced with fresh DMEM with 10% FBS, and the cultured flasks were then treated with the highest concentration of each gut metabolite (3 mg/mL), and DMEM (no FBS) as the negative control and incubated for 24 h at 37 °C in the presence of 5% CO2. To gain a more comprehensive understanding of the potential molecular pathways activated, 3 mg/mL was chosen for the proteomics analyses, as all three metabolites presented with the greatest level of cytotoxicity at this concentration. In alignment with prior studies, the present proteomics study was completed after a 24 h treatment period to adequately capture all apoptosis-related protein changes. Following the 24-h incubation period, the suspension cell media contained in each flask was collected. The adherent cells remaining in each flask were then treated with 0.25% w/v of trypsin (TrypLE™ Express Enzyme, Thermo Fisher Scientific, North Ryde, NSW, Australia) for 5 min, neutralized and combined with the suspension cell media. The cell media was then centrifuged at 500× g for 5 min at RT to collect the cell pellet. The pellet was resuspended in 1 mL of PBS and centrifuged at 500× g for 5 min, and this step was then repeated. The cell pellets were then resuspended in 100 µL of lysis buffer (#1863441, Thermo Fisher Scientific, North Ryde, NSW, Australia) including 1 µL of universal nuclease and fully mass spectrometry (MS)-compatible Halt™ Protease and Phosphatase Inhibitor Cocktail, EDTA-Free (Thermo Fisher Scientific, North Ryde, NSW, Australia). The cells were pipetted up and down 10–15 times until the sample viscosity was reduced and the cell pellets were left on ice for 20 min with occasional vertexing for 10 s every 5 min, then centrifuged at 14,000 rpm for 20 min at 4 °C, and the lysate was collected.

3.5.2. Protein Quantification

Following lysate collection, PierceTM Rapid Gold BCA Protein Assay Kit (#A53226, Thermo Fisher Scientific, North Ryde, NSW, Australia) was used to determine the protein concentration of the cell lysate in triplicate against bovine serum albumin (BSA) standard according to the manufacturer’s protocol. Briefly, 1 μL of each sample replicate (n = 3) was diluted in the MilliQ water (at 1:20) with 20 μL of each standard and placed in a 96-well plate with 200 μL of working reagent per well. Samples were diluted to be within the operating range of 20–2000 μg/mL. The plate was mixed thoroughly on a plate shaker for 30 s and incubated at RT for 5 min, and then the absorbance was measured within 20 min at 480 nm using a microplate spectrophotometer (BMG CLARIOstar, Mornington, VIC, Australia). The blank absorbance was subtracted from all other readings of standards and samples, and sample concentration was determined against the established BSA standard calibration curve. Protein samples were stored at −80 °C for future use and further proteomic analysis.

3.5.3. Peptide Preparation and Clean up

The EasyPepTM Mini MS Sample Prep Kit was utilised as per the manufacturer’s protocol (Thermo Fisher Scientific, North Ryde, NSW, Australia) for chemical and enzymatic sample processing, using 100 μg of protein samples. Using lysis buffer (#1863441, Thermo Fisher Scientific, North Ryde, NSW, Australia), the final volume was adjusted to 100 μL in a microcentrifuge tube. The reduction and alkylation solutions were added at a volume of 50 μL each, gently mixed, and further incubated at 95 °C for 10 min using a heat block. The samples were cooled at RT, and 50 μL of the reconstituted trypsin/lys-C protease mixture was added to each sample, then incubated (with shaking) at 37 °C for 3 h. Following incubation, 50 μL of digestion stop solution was added and gently mixed. Peptide clean-up columns were implemented to remove both hydrophobic and hydrophilic contaminants. Following the clean-up, clean peptide samples were then dried using a vacuum centrifuge and resuspended in 100 μL 0.1% formic acid in water for the LCMS analysis, and gently placed in maximum recovery sample vials (Waters Corp., Milford, MA, USA).

3.5.4. Label-Free Bottom-Up Quantification via Nano-Ultra High-Performance Liquid Chromatography Coupled with Quadruple Time of Flight Mass Spectrometry (Nano-UPLC-qTOF-MS)

The LC-MS data for the present study were acquired according to the outline methodologies of two previous studies [40,72]. Briefly, a nanoACQUITY UPLC system (Waters Corp., Milford, MA, USA) coupled to a Synapt G2-S high-definition mass spectrometer (HDMS) (Waters Corp., Milford, MA, USA), operating in positive electron spray ion mode (ESI+) and equipped with a hybrid quadrupole time of flight (qTOF) analyser, was used to analyse tryptic peptides. Waters NanoLockSpray Exact Mass Ionisation Source was utilised to maintain mass accuracy. Further, 100 fg/mL Glu-fibrinopeptide B (GFP) dissolved in 50% aqueous acetonitrile containing 0.1% formic acid with a lock mass m/z of 758.84.26 was infused as lockspray solution at 0.5 μL/min and calibrated against a sodium iodide solution. For the chromatographic separation of peptides, the nanoEase M/Z BEH C18 (1.7 μM, 130 Å, 75 μm × 100 mm, Waters Corp., Milford, MA, USA) at 40 °C was utilised and coupled to a nanoEase M/Z Symmetry C18 Trap Column (100 Å, 5 µm, 180 µm × 20 mm, (Waters Corp., Milford, MA, USA). Milli-Q water and acetonitrile containing 0.1% formic acid were used as mobile phase A and B, respectively (LC-MS grade; Merck, Macquarie Park, NSW, Australia). An injection volume of 1 μL at 300 nL/min flow rate was used throughout the 50-min gradient. Samples were injected into the trapping column at 5 μL/min at 99% mobile phase A for 3 min before being eluted to the analytical column. An initial 1% of mobile phase B was ramped to 85% B over 50 min with the following gradient: 10% B at 2 min, 40% B at 40 min, and 85% B at 42 min. All samples were kept at 4 °C and were injected in triplicate. The ion source block temperature was set to 80 °C and capillary voltage was maintained at 3 kV. Ions were acquired with m/z between 50 and 2000, scanning time of 0.5 s, sample cone voltage and source offset at 30 V, nanoflow gas at 0.3 Bar, purge gas at 20 L/h and cone gas flow at 20 L/h. The data-independent acquisition (DIA) method by MSE multiplex mode was used for sample acquisition at a T-wave collision-induced dissociation cell filled with argon gas with MassLynx Mass Spectrometry Software (version 4.2, Waters Corp., Milford, MA, USA).

3.5.5. Data Processing and Availability

Progenesis QI software (version 2.0, Waters Corp., Milford, MA, USA) was used to import and further process the acquired MassLynx data. Automatic selection of alignment reference among QC samples was set, and peptides were identified against the Uniprot human proteome database (May 2022 version) using the ion-accounting method with 250 kDa protein mass maximum. One fragment per peptide or one peptide per protein together with 3 fragments per protein were set as the ion-matching requirements using relative quantification implementing the Hi-N method (n = 3). Auto peptide and fragment tolerance and less than 4% FDR were set for search tolerance parameters. Peptides with absolute mass error >20 ppm or single-charged were further filtered out. Pairwise comparisons of the identified proteins in the treated groups were carried out against the control group for cytotoxic potential exploration. In each experimental design, proteins with analysis of variance (ANOVA)-derived p-value at least ≤ 0.05 and q value ≤ 0.05 with |log2fold change| ≥ 2 were considered significant and included for further pathway analyses. Differentially expressed proteins identified by the quantitative processing of the LC-MS/MS analysis of the proteome tryptic digestion were analysed by STRING (https://string-db.org/, accessed on 14 November 2022) [73], g:Profiler (https://biit.cs.ut.ee/gprofiler/gost, accessed on 14 November 2022) [74], Reactome (https://reactome.org/, accessed on 14 November 2022) [75], and IMPaLA (http://impala.molgen.mpg.de/, accessed on 14 November 2022) [76] to identify the relevant pathways responsible for the action against the MCF7 breast cancer cells. The g:SCS algorithm was used for multiple-testing corrections in the g:Profiler platform with an adjusted p value of 0.05 threshold. The raw and processed data were further deposited to the ProteomeXchange Consortium via the PRoteomics IDEntifications (PRIDE) repository [77] with the dataset identifier 10.6019/PXD040482.

3.5.6. Statistical Analyses

The GraphPad Prism (version 9, La Jolla, CA, USA) was used to determine the IC50 (concentration that inhibits cell growth by 50%) values, as well as to compare the mean values between the control and treatment groups of the Alamar Blue, ROS and flow cytometry experiments. This included performing the independent samples t-test and one and two-way ANOVA. Data were further expressed as the mean ± SD. Statistical differences between the mean values in the experiments of at least p < 0.05 were considered statistically significant for the purpose of the study.

4. Conclusions

In recent years, preclinical research has been conducted to understand the anticancer potential of gut microbial metabolites, the by-products of residing gut microbiota. Specific gut microbial metabolites including SCFAs, bacteriocins, and natural purine nucleosides (such as inosine), have demonstrated potential anticancer activity against different cancer types including breast cancer. As a common SCFA, sodium butyrate has been one of the most extensively investigated gut metabolites against breast cancer, including the two studied cell lines of the present study, MCF7 and MDA-MB-231 adenocarcinoma cells. The present study observed that sodium butyrate inhibited the proliferation of both breast cancer cell lines with a maximum inhibitory percentage of 80% at 27.25 mM, which correlated with the previous preclinical studies on this metabolite. Nisin, one of the well-known bacteriocins, has also been investigated previously for its anticancer potential, but primarily against colorectal cancer cell lines. The findings of this study determined that nisin exhibited minimal cytotoxicity against breast cancer cells, which was in contrast with previous studies that observed high cytotoxicity by nisin against the MCF7 adenocarcinoma cells. Inosine has been minimally investigated for its anticancer potential with no studies against breast cancer cells. Inosine at 11.18 mM was found to demonstrate cell inhibition of 47.78% and 48.85% in the MCF7 and MDA-MB-231 cells, respectively. All three gut metabolites were also found to initiate cytotoxicity in normal MCF10A human breast epithelial cells. However, sodium butyrate induced lower cytotoxicity in the MCF10A cells than in the MCF7 and MDA-MB-231 adenocarcinoma cells, which warrants further investigation in animal models. All three selected gut metabolites were found to significantly inhibit the production of ROS in both breast cancer cell lines, which is a promising aspect, as an increase in ROS production can be associated with an increased risk of cancer development and metastasis. Additionally, sodium butyrate was observed to initiate apoptotic cell death in both cell lines. As apoptosis is a desired hallmark feature for prospective anticancer agents, our findings provided meaningful insights for future in vivo and clinical studies on sodium butyrate. In the present study, proteomics analyses were also performed for the MCF7 adenocarcinoma cells, and sodium butyrate was found to potentially activate several signal transduction pathways underpinning the observed anti-proliferative activity. Comparatively, nisin and inosine indicated the potential activation of cell cycle processes in the MCF7 cells. Given the promising findings of the present study, future studies must implement cell viability, flow cytometric and proteomics assays to understand the impact of different timepoints and doses of these metabolites against breast cancer cells. Additionally, future research should prioritize the use of 3D cell culture such as spheroids, representing a more accurate preclinical model to assess the activity of potential anticancer drugs in comparison to 2D cell culture. Collectively, the present study provides a strong foundation for future preclinical research to ascertain effective therapeutic doses and administration routes of the selected gut microbial metabolites, as well as how these metabolites interact with the gut microbiota, the tumour microenvironment, and the immune system.

Supplementary Materials

The following supporting information can be downloaded at: https://www.mdpi.com/article/10.3390/ijms242015053/s1.

Author Contributions

K.J.: Conceptualisation, Methodology, Investigation, Data curation, Writing—original draft, Figures, Visualisation. M.A.A.: Methodology, Investigation, Data curation, Writing—original draft. D.C.: Writing—Review and Editing. C.-G.L.: Writing—Review and Editing. D.J.B.: Conceptualisation, Design, Methodology, Investigation, Data curation, Writing—original draft, Figures, Review and Editing, Visualisation, Funding acquisition, Supervision. All authors have read and agreed to the published version of the manuscript.

Funding

The APC was partially funded by the Open Access funding support from NICM Health Research Institute, Western Sydney University, Australia.

Institutional Review Board Statement

Not applicable.

Informed Consent Statement

Not applicable.

Data Availability Statement

The raw and processed data were deposited to the ProteomeXchange Consortium via the PRoteomics IDEntifications (PRIDE) repository [77] with the dataset identifier 10.6019/PXD040482. The raw data is also shared in the Supplementary File.

Acknowledgments

We acknowledge the support of Western Sydney University, Australia through the Master of Research Scholarship award (Kayla Jaye) and the Research Support Program Fellowship (Deep Jyoti Bhuyan) to conduct this research. The authors would also like to acknowledge Western Sydney University’s Mass Spectrometry Facility for providing access to its instrumentation and the assistance of Meena Mikhael (Facility Research Manager, Mass Spectrometry Unit, Western Sydney University) with the MS analyses.

Conflicts of Interest

As a medical research institute, NICM Health Research Institute receives research grants and donations from foundations, universities, government agencies, individuals, and industry. Sponsors and donors also provide untied funding for work to advance the vision and mission of the institute. The authors report no conflict of interest.

References

  1. Jaye, K.; Chang, D.; Li, C.G.; Bhuyan, D.J. Gut Metabolites and Breast Cancer: The Continuum of Dysbiosis, Breast Cancer Risk, and Potential Breast Cancer Therapy. Int. J. Mol. Sci. 2022, 23, 9490. [Google Scholar] [CrossRef] [PubMed]
  2. Jaye, K.; Li, C.G.; Chang, D.; Bhuyan, D.J. The role of key gut microbial metabolites in the development and treatment of cancer. Gut Microbes 2022, 14, 2038865. [Google Scholar] [CrossRef]
  3. Mager, L.F.; Burkhard, R.; Pett, N.; Cooke, N.C.; Brown, K.; Ramay, H.; Paik, S.; Stagg, J.; Groves, R.A.; Gallo, M. Microbiome-derived inosine modulates response to checkpoint inhibitor immunotherapy. Science 2020, 369, 1481–1489. [Google Scholar] [CrossRef] [PubMed]
  4. Bedford, A.; Gong, J. Implications of butyrate and its derivatives for gut health and animal production. Anim. Nutr. 2018, 4, 151–159. [Google Scholar] [CrossRef]
  5. Steliou, K.; Boosalis, M.S.; Perrine, S.P.; Sangerman, J.; Faller, D.V. Butyrate histone deacetylase inhibitors. BioResearch Open Access 2012, 1, 192–198. [Google Scholar] [CrossRef] [PubMed]
  6. Lee, A.V.; Oesterreich, S.; Davidson, N.E. MCF-7 cells—Changing the course of breast cancer research and care for 45 years. J. Natl. Cancer Inst. 2015, 107, djv073. [Google Scholar] [CrossRef]
  7. Vantangoli, M.M.; Madnick, S.J.; Huse, S.M.; Weston, P.; Boekelheide, K. MCF-7 human breast cancer cells form differentiated microtissues in scaffold-free hydrogels. PLoS ONE 2015, 10, e0135426. [Google Scholar] [CrossRef]
  8. Dubois, C.; Dufour, R.; Daumar, P.; Aubel, C.; Szczepaniak, C.; Blavignac, C.; Mounetou, E.; Penault-Llorca, F.; Bamdad, M. Development and cytotoxic response of two proliferative MDA-MB-231 and non-proliferative SUM1315 three-dimensional cell culture models of triple-negative basal-like breast cancer cell lines. Oncotarget 2017, 8, 95316. [Google Scholar] [CrossRef]
  9. Huang, Z.; Yu, P.; Tang, J. Characterization of triple-negative breast cancer MDA-MB-231 cell spheroid model. OncoTargets Ther. 2020, 13, 5395. [Google Scholar] [CrossRef]
  10. Jenkins, D.E.; Hornig, Y.S.; Oei, Y.; Dusich, J.; Purchio, T. Bioluminescent human breast cancer cell lines that permit rapid and sensitive in vivodetection of mammary tumors and multiple metastases in immune deficient mice. Breast Cancer Res. 2005, 7, R444. [Google Scholar] [CrossRef]
  11. Coradini, D.; Biffi, A.; Costa, A.; Pellizzaro, C.; Pirronello, E.; DiFronzo, G. Effect of sodium butyrate on human breast cancer cell lines. Cell Prolif. 1997, 30, 149–159. [Google Scholar] [CrossRef]
  12. Andrade, F.O.; Nagamine, M.K.; De Conti, A.; Chaible, L.M.; Fontelles, C.C.; Jordão, A.A., Jr.; Vannucchi, H.; Dagli, M.L.Z.; Bassoli, B.K.; Moreno, F.S.; et al. Efficacy of the dietary histone deacetylase inhibitor butyrate alone or in combination with vitamin A against proliferation of MCF-7 human breast cancer cells. Braz. J. Med. Biol. Res. 2012, 45, 841–850. [Google Scholar] [CrossRef] [PubMed]
  13. Semaan, J.; El-Hakim, S.; Ibrahim, J.N.; Safi, R.; Einar, A.A.; El Boustany, C. Comparative effect of sodium butyrate and sodium propionate on proliferation, cell cycle and apoptosis in human breast cancer cells MCF-7. Breast Cancer 2020, 27, 696–705. [Google Scholar] [CrossRef] [PubMed]
  14. Chopin, V.; Toillon, R.A.; Jouy, N.; Bourhis, X.L. Sodium butyrate induces P53-independent, Fas-mediated apoptosis in MCF-7 human breast cancer cells. Br. J. Pharmacol. 2002, 135, 79–86. [Google Scholar] [CrossRef]
  15. Hamid, R.; Rotshteyn, Y.; Rabadi, L.; Parikh, R.; Bullock, P. Comparison of alamar blue and MTT assays for high through-put screening. Toxicol. Vitr. 2004, 18, 703–710. [Google Scholar] [CrossRef] [PubMed]
  16. Louis, P.; Hold, G.L.; Flint, H.J. The gut microbiota, bacterial metabolites and colorectal cancer. Nat. Rev. Microbiol. 2014, 12, 661–672. [Google Scholar] [CrossRef]
  17. He, C.; Liu, Y.; Ye, S.; Yin, S.; Gu, J. Changes of intestinal microflora of breast cancer in premenopausal women. Eur. J. Clin. Microbiol. Infect. Dis. 2021, 40, 503–513. [Google Scholar] [CrossRef]
  18. Nomura, M.; Nagatomo, R.; Doi, K.; Shimizu, J.; Baba, K.; Saito, T.; Matsumoto, S.; Inoue, K.; Muto, M. Association of short-chain fatty acids in the gut microbiome with clinical response to treatment with nivolumab or pembrolizumab in patients with solid cancer tumors. JAMA Netw. Open 2020, 3, e202895. [Google Scholar] [CrossRef]
  19. Yusuf, F.; Adewiah, S.; Syam, A.F.; Fatchiyah, F. Altered profile of gut microbiota and the level short chain fatty acids in colorectal cancer patients. J. Phys. Conf. Ser. 2019, 1146, 012037. [Google Scholar] [CrossRef]
  20. Smith, D.M. Inosine Production and Cytoprotective Activity in a Gradient Model of Breast Cancer Hypoxia Nutrient Exclusion (CHyNE). Ph.D. Thesis, Texas Tech University, Lubbock, TX, USA, 2018. [Google Scholar]
  21. Akbari, V.; Avand, A. In Vitro Cytotoxic Activity of a Lactococcus Lactis Antimicrobial Peptide against Breast Cancer Cells. Iran. J. Pharm. Sci. 2017, 13, 82–83. [Google Scholar]
  22. Paiva, A.D.; de Oliveira, M.D.; de Paula, S.O.; Baracat-Pereira, M.C.; Breukink, E.; Mantovani, H.C. Toxicity of bovicin HC5 against mammalian cell lines and the role of cholesterol in bacteriocin activity. Microbiology 2012, 158, 2851–2858. [Google Scholar] [CrossRef] [PubMed]
  23. Lulla, R.R.; Goldman, S.; Yamada, T.; Beattie, C.W.; Bressler, L.; Pacini, M.; Pollack, I.F.; Fisher, P.G.; Packer, R.J.; Dunkel, I.J. Phase I trial of p28 (NSC745104), a non-HDM2-mediated peptide inhibitor of p53 ubiquitination in pediatric patients with recurrent or progressive central nervous system tumors: A Pediatric Brain Tumor Consortium Study. Neuro-Oncol. 2016, 18, 1319–1325. [Google Scholar] [CrossRef] [PubMed]
  24. Warso, M.; Richards, J.; Mehta, D.; Christov, K.; Schaeffer, C.; Bressler, L.R.; Yamada, T.; Majumdar, D.; Kennedy, S.; Beattie, C. A first-in-class, first-in-human, phase I trial of p28, a non-HDM2-mediated peptide inhibitor of p53 ubiquitination in patients with advanced solid tumours. Br. J. Cancer 2013, 108, 1061–1070. [Google Scholar] [CrossRef] [PubMed]
  25. Aggarwal, V.; Tuli, H.S.; Varol, A.; Thakral, F.; Yerer, M.B.; Sak, K.; Varol, M.; Jain, A.; Khan, M.A.; Sethi, G. Role of reactive oxygen species in cancer progression: Molecular mechanisms and recent advancements. Biomolecules 2019, 9, 735. [Google Scholar] [CrossRef]
  26. Tobar, N.; Cáceres, M.; Santibáñez, J.F.; Smith, P.C.; Martínez, J. RAC1 activity and intracellular ROS modulate the migratory potential of MCF-7 cells through a NADPH oxidase and NFκB-dependent mechanism. Cancer Lett. 2008, 267, 125–132. [Google Scholar] [CrossRef] [PubMed]
  27. Salimi, V.; Shahsavari, Z.; Safizadeh, B.; Hosseini, A.; Khademian, N.; Tavakoli-Yaraki, M. Sodium butyrate promotes apoptosis in breast cancer cells through reactive oxygen species (ROS) formation and mitochondrial impairment. Lipids Health Dis. 2017, 16, 208. [Google Scholar] [CrossRef] [PubMed]
  28. Ogura, J.; Kuwayama, K.; Sasaki, S.; Kaneko, C.; Koizumi, T.; Yabe, K.; Tsujimoto, T.; Takeno, R.; Takaya, A.; Kobayashi, M. Reactive oxygen species derived from xanthine oxidase interrupt dimerization of breast cancer resistance protein, resulting in suppression of uric acid excretion to the intestinal lumen. Biochem. Pharmacol. 2015, 97, 89–98. [Google Scholar] [CrossRef]
  29. Pfeffer, C.M.; Singh, A.T. Apoptosis: A target for anticancer therapy. Int. J. Mol. Sci. 2018, 19, 448. [Google Scholar] [CrossRef]
  30. Lallemand, F.; Courilleau, D.; Buquet-Fagot, C.; Atfi, A.; Montagne, M.-N.; Mester, J. Sodium butyrate induces G2 arrest in the human breast cancer cells MDA- MB-231 and renders them competent for DNA rereplication. Exp. Cell Res. 1999, 247, 432–440. [Google Scholar] [CrossRef]
  31. Liu, J.; Ma, L.; Li, L.; Sun, Y.; Wu, X.; Chen, L.; Wu, P. Histone deacetylase inhibitor sodium butyrate suppresses DNA double strand break repair induced by etoposide more effectively in MCF-7 cells than in HEK293 cells. BMC Biochem. 2015, 16, 2. [Google Scholar] [CrossRef]
  32. Salimi, V.; Shabani, M.; Tavakoli-Yaraki, M.; Nourbakhsh, M. Involvement of 15-lipoxygenase-1 in the regulation of breast cancer cell death induced by sodium butyrate. Cytotechnology 2016, 68, 2519–2528. [Google Scholar] [CrossRef] [PubMed]
  33. Louis, M.; Rosato, R.R.; Brault, L.; Osbild, S.; Battaglia, E.; Yang, X.-H.; Grant, S.; Bagrel, D. The histone deacetylase inhibitor sodium butyrate induces breast cancer cell apoptosis through diverse cytotoxic actions including glutathione depletion and oxidative stress. Int. J. Oncol. 2004, 25, 1701–1711. [Google Scholar] [CrossRef] [PubMed]
  34. Chopin, V.; Toillon, R.-A.; Le Bourhis, X.; Jouy, N. P21WAF1/CIP1 is dispensable for G1 arrest, but indispensable for apoptosis induced by sodium butyrate in MCF-7 breast cancer cells. Oncogene 2004, 23, 21–29. [Google Scholar] [CrossRef] [PubMed]
  35. Chopin, V.; Hondermarck, H.; Le Bourhis, X.; Slomianny, C. Synergistic induction of apoptosis in breast cancer cells by cotreatment with butyrate and TNF-alpha, TRAIL, or anti-Fas agonist antibody involves enhancement of death receptors’ signaling and requires P21waf1. Exp. Cell Res. 2004, 298, 560–573. [Google Scholar] [CrossRef] [PubMed]
  36. Wang, Y.; Hu, P.-C.; Ma, Y.-B.; Fan, R.; Gao, F.-F.; Wei, L.; Zhang, J.-W. Sodium butyrate-induced apoptosis and ultrastructural changes in MCF-7 breast cancer cells. Ultrastruct. Pathol. 2016, 40, 200–204. [Google Scholar] [CrossRef]
  37. Rodrigues, M.F.; Carvalho, E.; Rumjanek, F.D.; Amoedo, N.D.; Pezzuto, P. Reciprocal modulation of histone deacetylase inhibitors sodium butyrate and trichostatin A on the energy metabolism of breast cancer cells. J. Cell. Biochem. 2015, 116, 797–808. [Google Scholar] [CrossRef] [PubMed]
  38. Rattanapornsompong, K.; Khattiya, J.; Phannasil, P.; Phaonakrop, N.; Roytrakul, S.; Jitrapakdee, S.; Akekawatchai, C. Impaired G2/M cell cycle arrest induces apoptosis in pyruvate carboxylase knockdown MDA-MB-231 cells. Biochem. Biophys. Rep. 2021, 25, 100903. [Google Scholar] [CrossRef]
  39. Price, M.T.; Olney, J.W.; Samson, L.; Labruyere, J. Calcium influx accompanies but does not cause excitotoxin-induced neuronal necrosis in retina. Brain Res. Bull. 1985, 14, 369–376. [Google Scholar] [CrossRef]
  40. Alsherbiny, M.A.; Bhuyan, D.J.; Radwan, I.; Chang, D.; Li, C.-G. Metabolomic identification of anticancer metabolites of Australian propolis and proteomic elucidation of its synergistic mechanisms with doxorubicin in the MCF7 cells. Int. J. Mol. Sci. 2021, 22, 7840. [Google Scholar] [CrossRef]
  41. Abe, M.; Kufe, D.W. Effect of Sodium-Butyrate on Human-Breast Carcinoma (MCF-7) Cellular Proliferation, Morphology, and Cea Production. Breast Cancer Res. Treat. 1984, 4, 269–274. [Google Scholar] [CrossRef]
  42. Graham, K.A.; Buick, R.N. Sodium-Butyrate Induces Differentiation in Breast-Cancer Cell-Lines Expressing the Estrogen-Receptor. J. Cell. Physiol. 1988, 136, 63–71. [Google Scholar] [CrossRef] [PubMed]
  43. Janson, W.; Brandner, G.; Siegel, J. Butyrate modulates DNA-damage-induced p53 response by induction of p53-independent differentiation and apoptosis. Oncogene 1997, 15, 1395–1406. [Google Scholar] [CrossRef] [PubMed]
  44. Lambrecht, V.; Le Bourhis, X.; Toillon, R.-A.; Boilly, B.; Hondermarck, H. Alterations in both heparan sulfate proteoglycans and mitogenic activity of fibroblast growth factor-2 are triggered by inhibitors of proliferation in normal and breast cancer epithelial cells. Exp. Cell Res. 1998, 245, 239–244. [Google Scholar] [CrossRef] [PubMed]
  45. Mandal, M.; Kumar, R. BcI-2 expression regulates sodium butyrate-induced apoptosis in human MCF-7 breast cancer cells. Cell Growth Differ 1996, 7, 311–318. [Google Scholar] [PubMed]
  46. Stevens, M.S.; Aliabadi, Z.; Moore, M.R. Associated Effects of Sodium-Butyrate on Histone Acetylation and Estrogen-Receptor in the Human-Breast Cancer Cell-Line MCF-7. Biochem. Biophys. Res. Commun. 1984, 119, 132–138. [Google Scholar] [CrossRef]
  47. Wu, Y.; Sun, L.; Zou, W.; Xu, J.; Liu, H.; Wang, W.; Yun, X.; Gu, J. Prosaposin, a regulator of estrogen receptor alpha, promotes breast cancer growth. Cancer Sci. 2012, 103, 1820–1825. [Google Scholar] [CrossRef]
  48. Kang, S.-Y.; Halvorsen, O.J.; Gravdal, K.; Bhattacharya, N.; Lee, J.M.; Liu, N.W.; Johnston, B.T.; Johnston, A.B.; Haukaas, S.A.; Aamodt, K. Prosaposin inhibits tumor metastasis via paracrine and endocrine stimulation of stromal p53 and Tsp-1. Proc. Natl. Acad. Sci. USA 2009, 106, 12115–12120. [Google Scholar] [CrossRef]
  49. Daly, R.J.; Binder, M.D.; Sutherland, R.L. Overexpression of the Grb2 gene in human breast cancer cell lines. Oncogene 1994, 9, 2723–2727. [Google Scholar]
  50. Tari, A.M.; Lopez-Berestein, G. GRB2: A pivotal protein in signal transduction. Semin. Oncol. 2001, 28 (Suppl. S16), 142–147. [Google Scholar] [CrossRef]
  51. Chen, D.; Si, W.; Shen, J.; Du, C.; Lou, W.; Bao, C.; Zheng, H.; Pan, J.; Zhong, G.; Xu, L. miR-27b-3p inhibits proliferation and potentially reverses multi-chemoresistance by targeting CBLB/GRB2 in breast cancer cells. Cell Death Dis. 2018, 9, 188. [Google Scholar] [CrossRef]
  52. Braicu, C.; Raduly, L.; Morar-Bolba, G.; Cojocneanu, R.; Jurj, A.; Pop, L.-A.; Pileczki, V.; Ciocan, C.; Moldovan, A.; Irimie, A. Aberrant miRNAs expressed in HER-2 negative breast cancers patient. J. Exp. Clin. Cancer Res. 2018, 37, 257. [Google Scholar] [CrossRef]
  53. Murphy, E.; Steenbergen, C. Estrogen regulation of protein expression and signaling pathways in the heart. Biol. Sex Differ. 2014, 5, 6. [Google Scholar] [CrossRef]
  54. Kahl, I.; Mense, J.; Finke, C.; Boller, A.-L.; Lorber, C.; Győrffy, B.; Greve, B.; Götte, M.; Espinoza-Sánchez, N.A. The cell cycle-related genes RHAMM, AURKA, TPX2, PLK1, and PLK4 are associated with the poor prognosis of breast cancer patients. J. Cell. Biochem. 2022, 123, 581–600. [Google Scholar] [CrossRef] [PubMed]
  55. Ergul, M.; Bakar-Ates, F. RO3280: A novel PLK1 inhibitor, suppressed the proliferation of MCF-7 breast cancer cells through the induction of cell cycle arrest at G2/M point. Anti-Cancer Agents Med. Chem. 2019, 19, 1846–1854. [Google Scholar] [CrossRef] [PubMed]
  56. Grolmusz, V.K.; Karászi, K.; Micsik, T.; Tóth, E.A.; Mészáros, K.; Karvaly, G.; Barna, G.; Szabó, P.M.; Baghy, K.; Matkó, J. Cell cycle dependent RRM2 may serve as proliferation marker and pharmaceutical target in adrenocortical cancer. Am. J. Cancer Res. 2016, 6, 2041. [Google Scholar] [PubMed]
  57. Ma, J.; Zhang, F.; Sun, P. miR-140-3p impedes the proliferation of human cervical cancer cells by targeting RRM2 to induce cell-cycle arrest and early apoptosis. Bioorg. Med. Chem. 2020, 28, 115283. [Google Scholar] [CrossRef]
  58. Abdel-Rahman, M.A.; Mahfouz, M.; Habashy, H.O. RRM2 expression in different molecular subtypes of breast cancer and its prognostic significance. Diagn. Pathol. 2022, 17, 1. [Google Scholar] [CrossRef]
  59. Chen, W.-x.; Yang, L.-g.; Xu, L.-y.; Cheng, L.; Qian, Q.; Sun, L.; Zhu, Y.-l. Bioinformatics analysis revealing prognostic significance of RRM2 gene in breast cancer. Biosci. Rep. 2019, 39, BSR20182062. [Google Scholar] [CrossRef]
  60. Bagegni, N.; Thomas, S.; Liu, N.; Luo, J.; Hoog, J.; Northfelt, D.W.; Goetz, M.P.; Forero, A.; Bergqvist, M.; Karen, J. Serum thymidine kinase 1 activity as a pharmacodynamic marker of cyclin-dependent kinase 4/6 inhibition in patients with early-stage breast cancer receiving neoadjuvant palbociclib. Breast Cancer Res. 2017, 19, 123. [Google Scholar] [CrossRef]
  61. Del Re, M.; Bertolini, I.; Crucitta, S.; Fontanelli, L.; Rofi, E.; De Angelis, C.; Diodati, L.; Cavallero, D.; Gianfilippo, G.; Salvadori, B. Overexpression of TK1 and CDK9 in plasma-derived exosomes is associated with clinical resistance to CDK4/6 inhibitors in metastatic breast cancer patients. Breast Cancer Res. Treat. 2019, 178, 57–62. [Google Scholar] [CrossRef]
  62. Dasgupta, T.; Antony, J.; Braithwaite, A.W.; Horsfield, J.A. HDAC8 inhibition blocks SMC3 deacetylation and delays cell cycle progression without affecting cohesin-dependent transcription in MCF7 cancer cells. J. Biol. Chem. 2016, 291, 12761–12770. [Google Scholar] [CrossRef]
  63. Kaindl, A.M.; Passemard, S.; Kumar, P.; Kraemer, N.; Issa, L.; Zwirner, A.; Gerard, B.; Verloes, A.; Mani, S.; Gressens, P. Many roads lead to primary autosomal recessive microcephaly. Prog. Neurobiol. 2010, 90, 363–383. [Google Scholar] [CrossRef]
  64. Stander, B.; Marais, S.; Vorster, C.; Joubert, A. In vitro effects of 2-methoxyestradiol on morphology, cell cycle progression, cell death and gene expression changes in the tumorigenic MCF-7 breast epithelial cell line. J. Steroid Biochem. Mol. Biol. 2010, 119, 149–160. [Google Scholar] [CrossRef] [PubMed]
  65. Hung, L.-Y.; Chen, H.-L.; Chang, C.-W.; Li, B.-R.; Tang, T.K. Identification of a novel microtubule-destabilizing motif in CPAP that binds to tubulin heterodimers and inhibits microtubule assembly. Mol. Biol. Cell 2004, 15, 2697–2706. [Google Scholar] [CrossRef] [PubMed]
  66. Lee, Y.D.; Kim, B.; Jung, S.; Kim, H.; Kim, M.K.; Kwon, J.-O.; Song, M.-K.; Lee, Z.H.; Kim, H.-H. The dynactin subunit DCTN1 controls osteoclastogenesis via the Cdc42/PAK2 pathway. Exp. Mol. Med. 2020, 52, 514–528. [Google Scholar] [CrossRef]
  67. Li, W.; Chen, J.; Xiong, Z.; Zhou, H.; Huang, S.; Ren, J.; Liu, B.; Zhou, T.; Hu, K. Dynactin 2 acts as an oncogene in hepatocellular carcinoma through promoting cell cycle progression. Liver Res. 2022, 6, 155–166. [Google Scholar] [CrossRef]
  68. Wang, S.; Wang, Q.; Zhang, X.; Liao, X.; Wang, G.; Yu, L.; Zhang, W.; Zhou, Q.; Hu, S.; Yuan, W. Distinct prognostic value of dynactin subunit 4 (DCTN4) and diagnostic value of DCTN1, DCTN2, and DCTN4 in colon adenocarcinoma. Cancer Manag. Res. 2018, 10, 5807. [Google Scholar] [CrossRef]
  69. Mundt, K.E.; Golsteyn, R.M.; Lane, H.A.; Nigg, E.A. On the regulation and function of human polo-like kinase 1 (PLK1): Effects of overexpression on cell cycle progression. Biochem. Biophys. Res. Commun. 1997, 239, 377–385. [Google Scholar] [CrossRef] [PubMed]
  70. Bhuyan, D.J.; Alsherbiny, M.A.; Low, M.N.; Zhou, X.; Kaur, K.; Li, G.; Li, C.G. Broad-spectrum pharmacological activity of Australian propolis and metabolomic-driven identification of marker metabolites of propolis samples from three continents. Food Funct. 2021, 12, 2498–2519. [Google Scholar] [CrossRef]
  71. Bhuyan, D.J.; Vuong, Q.V.; Bond, D.R.; Chalmers, A.C.; Bowyer, M.C.; Scarlett, C.J. Eucalyptus microcorys leaf extract derived HPLC-fraction reduces the viability of MIA PaCa-2 cells by inducing apoptosis and arresting cell cycle. Biomed. Pharmacother. 2018, 105, 449–460. [Google Scholar] [CrossRef]
  72. Alsherbiny, M.A.; Bhuyan, D.J.; Low, M.N.; Chang, D.; Li, C.G. Synergistic interactions of cannabidiol with chemotherapeutic drugs in mcf7 cells: Mode of interaction and proteomics analysis of mechanisms. Int. J. Mol. Sci. 2021, 22, 10103. [Google Scholar] [CrossRef] [PubMed]
  73. Szklarczyk, D.; Morris, J.H.; Cook, H.; Kuhn, M.; Wyder, S.; Simonovic, M.; Santos, A.; Doncheva, N.T.; Roth, A.; Bork, P. The STRING database in 2017: Quality-controlled protein–protein association networks, made broadly accessible. Nucleic Acids Res. 2016, 45, D362–D368. [Google Scholar] [CrossRef] [PubMed]
  74. Reimand, J.; Isserlin, R.; Voisin, V.; Kucera, M.; Tannus-Lopes, C.; Rostamianfar, A.; Wadi, L.; Meyer, M.; Wong, J.; Xu, C. Pathway enrichment analysis and visualization of omics data using g: Profiler, GSEA, Cytoscape and EnrichmentMap. Nat. Protoc. 2019, 14, 482–517. [Google Scholar] [CrossRef]
  75. Fabregat, A.; Jupe, S.; Matthews, L.; Sidiropoulos, K.; Gillespie, M.; Garapati, P.; Haw, R.; Jassal, B.; Korninger, F.; May, B. The reactome pathway knowledgebase. Nucleic Acids Res. 2018, 46, D649–D655. [Google Scholar] [CrossRef]
  76. Kamburov, A.; Cavill, R.; Ebbels, T.M.; Herwig, R.; Keun, H.C. Integrated pathway-level analysis of transcriptomics and metabolomics data with IMPaLA. Bioinformatics 2011, 27, 2917–2918. [Google Scholar] [CrossRef]
  77. Perez-Riverol, Y.; Csordas, A.; Bai, J.; Bernal-Llinares, M.; Hewapathirana, S.; Kundu, D.J.; Inuganti, A.; Griss, J.; Mayer, G.; Eisenacher, M. The PRIDE database and related tools and resources in 2019: Improving support for quantification data. Nucleic Acids Res. 2019, 47, D442–D450. [Google Scholar] [CrossRef] [PubMed]
Figure 1. Reactive oxygen species (ROS) inhibitory percentage for nisin, inosine, and sodium butyrate, at 3 and 2 mg/mL, against the MCF7 and MDAMB231 cells after 4 h of treatment (n = 3). * Indicates p-value: 0.01 < p-value < 0.05. ** Indicates p-value ≤ 0.01. For the MCF7 cells, inosine exhibited significantly more ROS inhibition than did sodium butyrate at 3 mg/mL (p < 0.05). For the MDA-MB-231 cells, inosine, at both 3 and 2 mg/mL showed significantly more ROS inhibition (p < 0.05) compared to sodium butyrate at 3 mg/mL.
Ijms 24 15053 g001
Figure 2. Flow cytometric assessment of the apoptotic profiles of the MCF7 (a,b) and MDAMB231 (c,d) breast cancer cells after 24 h of treatment with nisin, inosine, and sodium butyrate (n = 3). * indicates 0.01 < p-value < 0.05; ** indicates p ≤ 0.01; *** indicates p ≤ 0.001; **** indicates p ≤ 0.0001 compared to the negative control. (a) All three metabolites showed significantly lower live cells and higher apoptotic (early- and late-stage) cells compared to the negative control in the MCF7 cell line. Notably, inosine exhibited the greatest activity among the three metabolites with significantly lower live cells (p < 0.0001) and higher apoptotic (early- and late-stage) cells (p < 0.0001) compared to the negative control. (b) Represented are the density plots of each drug treatment that is most representative of the average data from the flow cytometric analyses, with Q3-1 = necrotic cells, Q3-2 = late-stage apoptotic cells, Q3-3 = live cells, and Q3-4 = early-stage apoptotic cells. (c) All three metabolites showed significantly lower live cells and higher apoptotic (early- and late-stage) cells compared to the negative control in the MDAMB231 cell line. Sodium butyrate exhibited significantly lower live cells (p < 0.05) and greater apoptotic (early- and late-stage) cells (p < 0.01) compared to nisin, inosine and the negative control. (d) The density plots of each drug treatment shown here are the most representative of the average data from the flow cytometric analyses, with Q3-1 = necrotic cells, Q3-2 = late-stage apoptotic cells, Q3-3 = live cells, and Q3-4 = early-stage apoptotic cells.
Ijms 24 15053 g002
Figure 3. The STRING network of associated expressed genes in the MCF7 cells following sodium butyrate treatment for 24 h, with the connecting lines depicting significant interactions between multiple genes. The thicker lines indicate a more significant association, whereas the thinner lines are indicative of a less significant association.
Ijms 24 15053 g003
Figure 4. The STRING network of associated expressed genes in the MCF7 cells following 24 h of inosine treatment, with the connecting lines depicting significant interactions between multiple genes. The thicker lines indicate a more significant association, whereas the thinner lines are indicative of a less significant association.
Ijms 24 15053 g004
Figure 5. The STRING network of associated expressed genes in the MCF7 cells following 24 h of nisin treatment, with the connecting lines depicting significant interactions between multiple genes. The thicker lines indicate a more significant association, whereas the thinner lines are indicative of a less significant association.
Ijms 24 15053 g005
Table 1. Cell growth inhibition (%) of nisin, inosine, and sodium butyrate against the MCF7 and MDA-MB-231 breast adenocarcinoma and the MCF10A normal breast epithelial cell lines at concentrations of 0.03125–3 mg/mL for 72 h using the Alamar Blue assay (n = 3).
Concentration (mg/mL)Cell Growth Inhibition (%)
MCF7MDA-MB-231MCF10A
Sodium ButyrateInosineNisinSodium ButyrateInosineNisinSodium ButyrateInosineNisin
381.73 ± 4.81 a47.78 ± 8.89 b14.34 ± 15.66 c80.80 ± 1.06 a48.85 ± 1.11 b24.46 ± 6.79 c89.23 ± 0.92 a87.64 ± 5.51 a69.43 ± 10.28 a
270.86 ± 7.24 a39.88 ± 7.04 b13.31 ± 7.43 c67.70 ± 6.28 a36.09 ± 3.32 b12.29 ± 7.97 c83.96 ± 4.65 a84.47 ± 7.38 a54.76 ± 15.69 a
158.15 ± 2.90 a37.25 ± 5.07 b13.97 ± 9.09 c71.44 ± 6.84 a27.80 ± 6.40 b12.01 ± 4.13 c66.53 ± 3.85 a69.49 ± 13.77 a34.57 ± 15.22 b
0.543.84 ± 3.49 a19.12 ± 5.39 b8.86 ± 5.47 b51.05 ± 2.71 a13.67 ± 3.55 b10.18 ± 5.13 b39.46 ± 12.27 a31.29 ± 18.71 a27.20 ± 12.77 a
0.2535.79 ± 3.44 a4.04 ± 5.61 b6.92 ± 6.47 b31.33 ± 3.83 a6.38 ± 1.67 b6.95 ± 5.39 b18.47 ± 17.41 a20.94 ± 14.73 a2.80 ± 29.91 a
0.12525.98 ± 4.62 a-5.89 ± 4.10 b18.45 ± 5.87 a4.01 ± 0.75 b6.33 ± 7.06 b8.39 ± 18.78 a12.11 ± 19.81 a18.27 ± 13.50 a
0.062517.62 ± 3.88 a-2.48 ± 5.71 b7.57 ± 5.49 a2.08 ± 0.41 a2.41 ± 4.27 a3.76 ± 7.58 a18.71 ± 15.44 a21.05 ± 10.93 a
0.0312510.78 ± 2.08 a-0.98 ± 7.78 a4.93 ± 5.23 a3.52 ± 0.92 a3.90 ± 1.87 a5.67 ± 8.31 a3.57 ± 17.48 a15.98 ± 6.31 a
IC500.576 mg/mL (5.23 mM)2.743 mg/mL (10.23 mM)ND0.557 mg/mL (5.06 mM)3.262 mg/mL (12.16 mM)ND0.655 mg/mL (5.95 mM)0.655 mg/mL (2.44 mM)1.63 mg/mL (485.98 μM)
a,b,c The different subscript values in the same row for each cell line indicate statistically significant difference (p < 0.05) between the treatment groups. “-” indicates no cell inhibition. “ND” indicates not detected. Data are presented as mean ± standard deviation (SD).
Table 2. The upregulation (red ) and downregulation (blue ) of the most prolific proteins and genes (p < 0.02) by the gut microbial metabolites in the MCF7 breast cancer cell line, including the associated molecular pathways and mechanisms of action induced by the expression of these proteins and genes.
Gut MetaboliteRegulationProtein(s)Gene(s)Molecular PathwayMechanism of Action
Sodium butyrateC9JIZ6PSAPMetabolism of proteinsSurfactant metabolism
DiseaseDefective CSF2RA causes SMDP4
Defective CSF2RB causes SMDP5
Diseases associated with surfactant metabolism
Defective SFTPA2 causes IPF
E7EVQ6
Q13907
SQLE
IDI1
MetabolismActivation of gene expression by SREBF (SREBP)
Regulation of cholesterol biosynthesis by SREBP (SREBF)
C9JIZ6
P62993
PSAP
GRB2
Cell-cell communicationSignal regulatory protein family interactions
P02795
P21291
MT2A
CSRP1
Cellular responses to stimuliResponse to metal ions

P18031
P62993
F5GZ28
PTPN1
GRB2
LIG1
Signal transductionNegative regulation of MET activity
P21291CSRP1Cellular responses to stimuliMTF1 activates gene expression
P18031
Q9UHQ9
P11021
C9JIZ6
P62993
E9PI30
P04899
PTPN1
CYB5R1
HSPA5
PSAP
GRB2
CTSW
GNAI2
HemostasisPlatelet activation, signalling and aggregation

P52292
P04155
KPNA2
TFF1
Signal transductionOestrogen-dependent gene expression
P11021HSPA5Cellular responses to stimuliATF6 (ATF6-alpha) activates chaperone genes
ATF6 (ATF6-alpha) activates chaperones

P11216
Q9UHQ9
C9JIZ6
Q99519
Q14019
Q9BV40
Q9ULZ3
Q12912
Q92882
PYGB
CYB5R1
PSAP
NEU1
COTL1
VAMP8
PYCARD
IRAG2
OSTF1
Immune systemNeutrophil degranulation

P25685
P11021
O95817
DNAJB1
HSPA5
BAG3
Cellular responses to stimuliRegulation of HSF1-mediated heat shock response, cellular response to heat stress

P52292
P04899
P04155
KPNA2
GNAI2
TFF1
Signal transductionESR-mediated signalling

P25685
P02795
P11498
P11021
P21291
F5GYQ1
O00762
O95817
P15559
DNAJB1
MT2A
PC
HSPA5
CSRP1
ATP6V0D1
UBE2C
BAG3
NQO1
Cellular responses to stimuliCellular responses to stimuli
P11216PYGBMetabolismGlycogen breakdown (glycogenolysis)
C9JIZ6
P62993
Q15404
PSAP
GRB2
RSU1
Cell-cell communicationCell-cell communication
Q13332
P62993
PTPRS
GRB2
Signal transductionSignalling by NTRK3 (TRKC)
Q9UHQ9
P11021
C9JIZ6
E9PI30
CYB5R1
HSPA5
PSAP
CTSW
HemostasisPlatelet degranulation
Response to elevated platelet cytosolic Ca2+
InosineP31350
P04183
RRM2
TK1
Cell cycleG1/S Transition and G1/S-Specific Transcription
Mitotic G1 phase and G1/S transition
P08243ASNSCellular responses to stimuliResponse of EIF2AK1 (HRI) to heme deficiency
ATF4 activates genes in response to endoplasmic reticulum stress
PERK regulates gene expression
P08727
P05783
P05787
KRT19
KRT18
KRT8
Developmental biologyFormation of the cornified envelope
Keratinisation
P53350
Q9UQE7
PLK1
SMC3
Cell cycleMitotic Telephase/Cytokinesis

P21281
P08243
F2Z388
ATP6V1B2
ASNS
RPL35
Cellular responses to stimuliCellular response to starvation
Q9Y2A7
H0Y6R4
I3L4C2
NCKAP1
RAPGEF1
BAIAP2
Signal transductionRAC3 GTPase cycle
P30613PKLRDevelopmental biologyRegulation of gene expression in beta cells

P08243
F2Z388
ASNS
RPL35
Cellular responses to stimuliResponse of EIF2AK4 (GCN2) to amino acid deficiency
Q9Y2A7
I3L4C2
NCKAP1
BAIAP2
Signal transductionRHO GTPases activate WASPs and WAVEs

P31350
P04183
Q9UQE7
P53350
RRM2
TK1
SMC3
PLK1
Cell cycleCell Cycle, Mitotic
P51572
Q9Y2A7
P06239
H0Y6R4
Q5VT25
I3L4C2
BCAP31
NCKAP1
LCK
RAPGEF1
CDC42BPA
BAIAP2
Signal transductionRHO GTPase cycle
P31350RRM2Gene expression (transcription)Transcriptional regulation by E2F6
H0YAV1
P00403
RRM2B
MT-CO2
TP53 Regulates metabolic genes
P53350PLK1Cell cyclePolo-like kinase-mediated events
Mitotic metaphase/anaphase transition
Nisin
Q9HC77
A0A7P0Z4C3
P53350
CENPJ
DCTN1
PLK1
Cell cycleLoss of proteins required for interphase microtubule organization from the centrosome
Loss of Nlp from mitotic centrosomes
AURKA activation by TPX2
Recruitment of mitotic centrosome proteins and complexes
Centrosome maturation
Regulation of PLK1 activity at G2/M transition
Recruitment of NuMA to mitotic centrosomes
Organelle biogenesis and maintenanceAnchoring of the basal body to the plasma membrane
Cell cycleG2/M transition
Mitotic G2-G2/M phases
P53350PLK1Cell cyclePolo-like kinase-mediated events
Mitotic metaphase/anaphase transition

Q9Y6G9
A0A7P0Z4C3
Q9HC77
P53350
DYNC1LI1
DCTN1
CENPJ
PLK1
Cell cycleMitotic prometaphase
Disclaimer/Publisher’s Note: The statements, opinions and data contained in all publications are solely those of the individual author(s) and contributor(s) and not of MDPI and/or the editor(s). MDPI and/or the editor(s) disclaim responsibility for any injury to people or property resulting from any ideas, methods, instructions or products referred to in the content.

