Article

Mitochondrial Genome Sequence of Salvia officinalis (Lamiales: Lamiaceae) Suggests Diverse Genome Structures in Cogeneric Species and Finds the Stop Gain of Genes through RNA Editing Events

1
School of Environmental Science and Engineering, Tianjin University, Tianjin 300072, China
2
Institute of Medicinal Plant Development, Chinese Academy of Medical Sciences, Peking Union Medical College, Beijing 100193, China
*
Authors to whom correspondence should be addressed.
Int. J. Mol. Sci. 2023, 24(6), 5372; https://doi.org/10.3390/ijms24065372
Submission received: 23 December 2022 / Revised: 20 February 2023 / Accepted: 2 March 2023 / Published: 11 March 2023
(This article belongs to the Collection Feature Papers in Molecular Genetics and Genomics)

Abstract

:
Our previous study was the first to confirm that the predominant conformation of mitochondrial genome (mitogenome) sequence of Salvia species contains two circular chromosomes. To further understand the organization, variation, and evolution of Salvia mitogenomes, we characterized the mitogenome of Salvia officinalis. The mitogenome of S. officinalis was sequenced using Illumina short reads and Nanopore long reads and assembled using a hybrid assembly strategy. We found that the predominant conformation of the S. officinalis mitogenome also had two circular chromosomes that were 268,341 bp (MC1) and 39,827 bp (MC2) in length. The S. officinalis mitogenome encoded an angiosperm-typical set of 24 core genes, 9 variable genes, 3 rRNA genes, and 16 tRNA genes. We found many rearrangements of the Salvia mitogenome through inter- and intra-specific comparisons. A phylogenetic analysis of the coding sequences (CDs) of 26 common protein-coding genes (PCGs) of 11 Lamiales species and 2 outgroup taxa strongly indicated that the S. officinalis was a sister taxon to S. miltiorrhiza, consistent with the results obtained using concatenated CDs of common plastid genes. The mapping of RNA-seq data to the CDs of PCGs led to the identification of 451 C-to-U RNA editing sites from 31 PCGs of the S. officinalis mitogenome. Using PCR amplification and Sanger sequencing methods, we successfully validated 113 of the 126 RNA editing sites from 11 PCGs. The results of this study suggest that the predominant conformation of the S. officinalis mitogenome are two circular chromosomes, and the stop gain of rpl5 was found through RNA editing events of the Salvia mitogenome.

1. Introduction

Salvia officinalis L., also known commonly as sage, is an economically important aromatic and medicinal plant. It belongs to the mint family of Lamiaceae within Lamiales [1]. Salvia means “to heal or save” in Latin, and its species name “officinalis” means “medicinal” [2,3]. Sage has a historical reputation for preventing and curing illnesses and was regarded as a sacred plant in Ancient Rome [3,4]. It has been extensively investigated for its antioxidant, antibacterial, hypoglycemic, and anti-inflammatory properties [5,6]. Moreover, sage can prevent and cure cardiovascular diseases, brain and nervous disorders, and diabetes [7]. The aerial parts of sage were used mostly for the extraction of active constituents [5,8]. Two principal types of secondary metabolites were found in S. officinalis: terpenoids and phenolics [6]. The most active constituents of S. officinalis are essential oils (1–2.8%), including 1,8-cineole, camphor, α-thujone, β-thujone, borneol, and viridiflorol [9].
The nuclear genome of S. officinalis was reported recently and revealed a genomic size of 480 Mb and seven chromosomes [10]. Two expression cascades have been identified as the regulating factors of the biosynthesis of shoot and root diterpenoids, particularly the diterpene biosynthesis gene cluster [10]. Furthermore, genetic and metabolomic studies have focused on discerning the genes and pathways that underpin volatile terpenoid biosynthesis [11,12] and the genetic diversity of seven S. officinalis populations in Greece [13].
Organelle genomes including the genomes of mitochondria and plastids [14,15] are resources for species identification, evolution, and phylogenetic studies [16,17,18]. They all evolved from bacterial endosymbionts [19,20]. Similar evolutionary histories lead to many common characteristics of the mitochondrial and plastid DNAs (mtDNAs and ptDNAs). However, mitochondrial genomes (mitogenome) present more complexity and more pronounced eccentricities than plastid genomes [21]. In particular, the mitogenomes of higher plants show enormous diversity in their genome sizes, structures, and gene contents [14,22].
The mitogenome size ranged from 11 Mb for Silene conica [23], to 66 kb for Viscum scurruloideum [24]. The size variations were reported to be extremely divergent even in the same genus Silene [25]. Different mechanisms contribute to these size variations of plant mitogenome including the proliferation of repeat elements, the incorporation of foreign DNA [22], and the gain or loss of whole chromosomes [26].
The structures of the mitochondrial DNA in angiosperm plants showed enormous diversity at three levels: inter-specific, intra-specific, and within individual levels. At the inter-specific level, different technologies have been used to observe the mitogenome structure diversity. For example, the in-gel fluorescence microscopy of Lactuca sativa mtDNA molecules showed the presence of linear, branched, and circular structures, with branched linear forms representing a prevailing presence [27]. In cultured tobacco cells, linear molecules and multibranched molecules in mtDNA were observed by the pulse-chase experiments with 3H-thymidine [28]. In cultured Chenopodium album (L.) cells, linear, circular, sigma-like, branched, and rosette-like structures were observed by electron microscopy [29]. The plant mitogenomes assembled from high-throughput DNA sequencing data are also found to have complex structures [30]. For example, the cucumber mitogenome was assembled into a single circular master chromosome and a collection of sub-master circular chromosomes [31]. The most prominent mechanism for structure diversity is likely to be the intra- and inter-molecular recombinations mediated by direct repetitive sequences [32,33].
In addition to the inter-specific level, the mitogenome structures were also found to be highly diverse at the intra-species level. For example, seven mitogenomes of sorghum from different cultivars and wild sources showed reticulated structures with multilinked relationships and were grouped into three types [34]. The different types of mitogenome structures could be associated with certain domesticated events.
Enormous diversity was also expected at the individual level, considering the fact that one cell has multiple copies of mitogenomes. Indeed, representing the mtDNAs as circular or linear chromosomes might not be appropriate, as these mtDNAs might exist as polymeric complexes. In this case, they are best represented with a graph. Recently, a graph-based sequence assembly toolkit (GSAT) was developed to assemble and obtain high-quality mitochondrial master graphs (MMGs) to represent the full spectrum of structural conformations of plant mitogenomes [30], demonstrating another level of mitogenomic structural diversity.
The mitogenome contents, in terms of the number of PCGs and introns, are also found to be highly diverse. The number of PCGs ranges from 19 in Viscum scurruloideum [24] to more than 50 in the liverwort Marchantia polymorpha [35,36]. Additionally, the number of introns varies from 4 in Viscum scurruloideum [24] to more than 40 in the hornwort Anthoceros agrestis [37]. In the angiosperm mitogenomes, 24 core protein-coding genes (PCGs) encode the respiratory proteins, and 17 variable PCGs encode the ribosomal proteins [38,39,40].
The diversity of the mitogenome contents was further increase by a post-transcriptional modification process, called RNA editing [41]. The number of RNA editing sites varies extensively among different mitogenomes, ranging from 8 RNA in the moss Physcomitrella patens to 2139 in Selaginella [42]. Previously, we identified 225 RNA editing sites in the S. miltiorrhiza mitogenomic mRNA. In particular, we found 115 symmetric RNA editing sites, characterized by being on two different strands at the same position [43]. Given the prevalent RNA editing events, the mitogenome sequences alone are insufficient to detect the mitochondrial proteome sequences. The identification of RNA editing sites is important to determine the final output of the functional mitochondrial proteins.
The plastid genomes of S. officinalis have been reported [12,44,45]. We also developed novel molecular markers for authenticating three Salvia species [45]. The nuclear genome of S. officinalis has also been reported, but the mitogenome of S. officinalis remains unknown, limiting our ability to understand the interaction of the three genomes in S. officinalis.
Our long-term goal is to understand the diversity and evolution of Salvia mitogenomes, thereby ultimately providing valuable information for molecular breeding studies on these economically important Salvia species. Recently, we confirmed for the first time that the predominant conformations of Salvia mitogenomes contain two circular molecules [46]. In the present study, we sequenced the mitogenome of S. officinalis. We ascertained the mitogenomic structure, gene content, repeat sequences, and RNA editing sites. We then compared the mitogenome and plastome to identify the mitochondrial plastid DNA (MTPT) and their evolutionary congruence. Lastly, we compared the mitogenome of S. officinalis with those of related species. The results obtained from this work lay a solid foundation for comprehending the diversity and evolution of Salvia mitogenomes.

2. Results

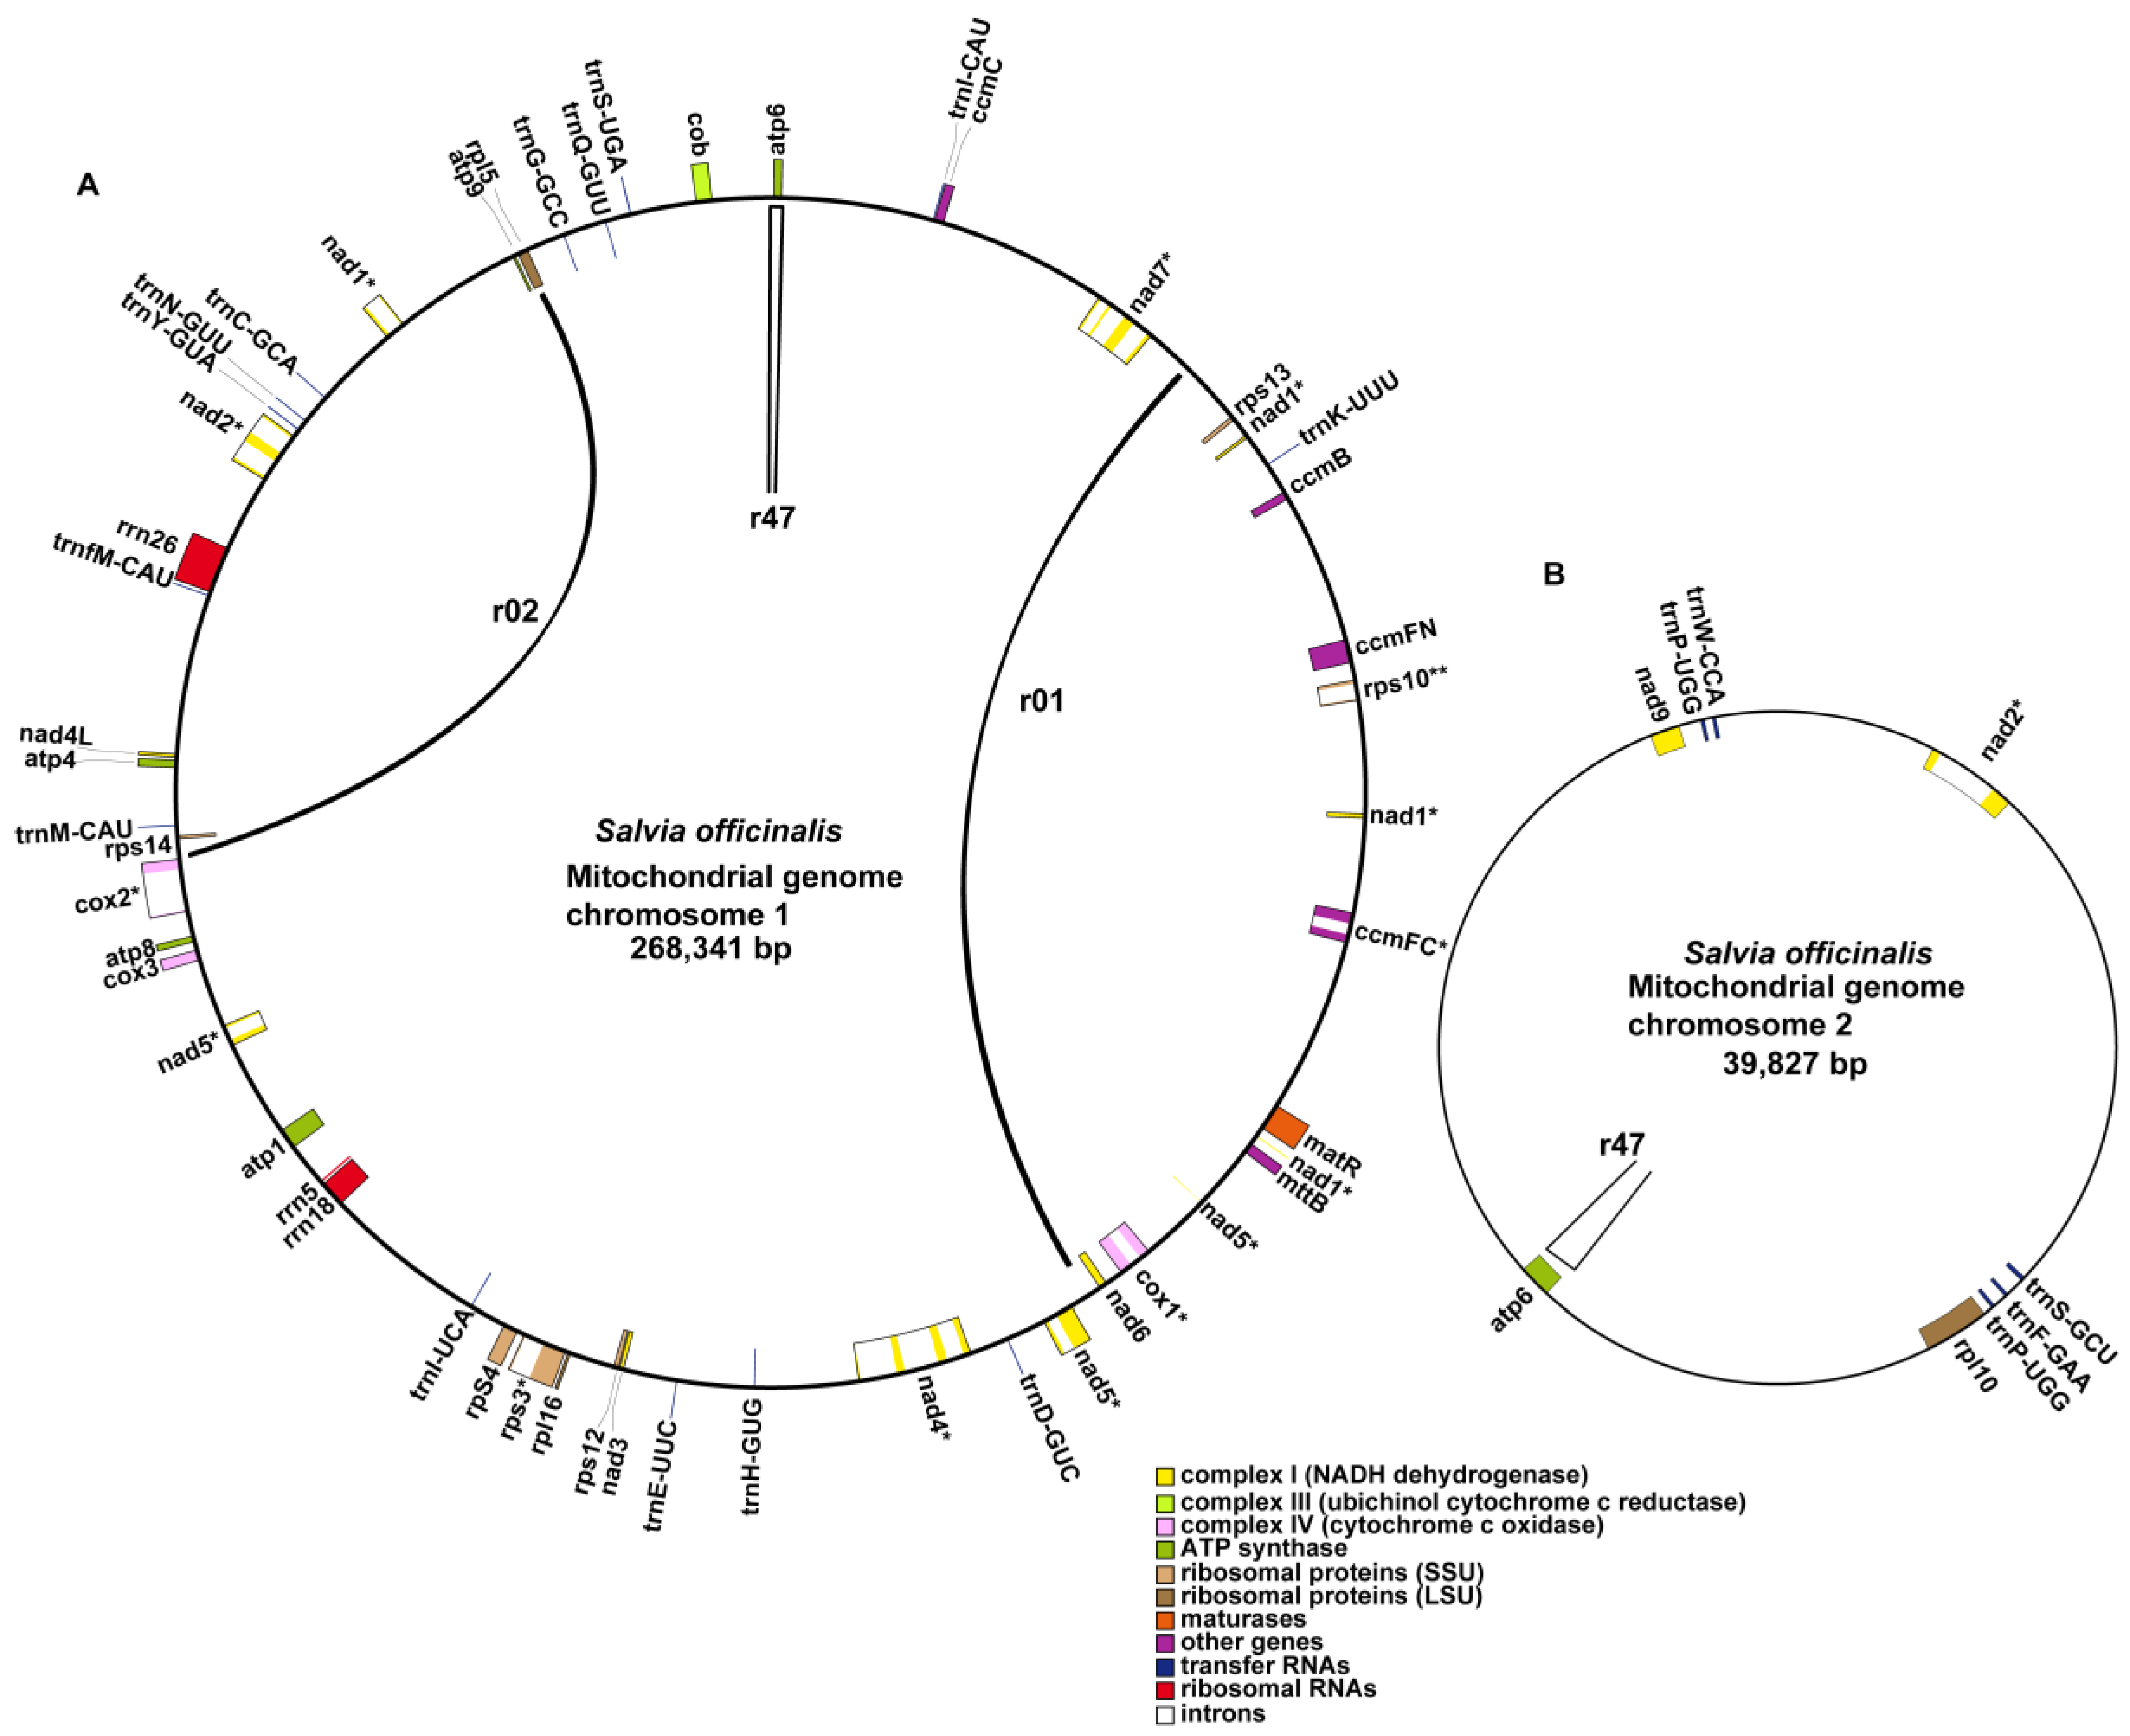
2.1. Structure of the S. officinalis Mitogenome

S. officinalis is a low (40–100 cm) shrub, and its leaves are oblong. The whole plants, aerial parts, leaves, flowers, and fruits of S. officinalis are shown in Figure 1A–D.
We obtained 32 Gb of Illumina sequencing data and 22 Gb of Nanopore sequencing data. The statistics of the sequencing results can be found in Table S1. The mitochondrial reads were extended from the raw sequencing reads using the GetOrganelle toolkit and de novo assembled using Unicycler software. The assembly result from GetOrganelle is shown as a unitig graph in Figure 2A. Three double-bifurcation structures (DBS) are designated as DBS01–03 in Figure 2A. Each of the DBS structures contained four alternative conformations—1, 2, 3, and 4—correspondingly named c1–4.
Unicycler software was used to resolve these DBS structures, which resulted in two circular sequences (Figure 2B). These two sequences were considered mitogenomic chromosomes, named MC1 and MC2, and were 268,341 bp and 39,827 bp in length and had GC contents of 45.23 and 44.32, respectively. To confirm that these three DBS structures were resolved correctly, we manually mapped all long reads to the sequences corresponding to the four conformations c1, c2, c3, and c4 of each DBS (Figure S1). The percentages of each conformation were quantified by the ratio of the number of long reads mapped to its sequence and those mapped to all four conformations (Table 1). According to the calculation, the relative abundances of the less abundant conformations of DBS01, 02, and 03 were 8.93%, 15.00%, and 20.69%, respectively. The details for the HSP r01, r02, and r47 are provided in Section 2.3.
To check the quality of the assemblies, we mapped the Nanopore and Illumina reads back to the MC1 and MC2 sequences. The mitogenome was mostly uniformly covered, with the Nanopore reads having average depths of coverage of 237.31 for MC1 (Figure S2a) and 53.72 for MC2 (Figure S2b). Similarly, the mitogenome was uniformly covered, with the Illumina short reads having average coverage depths of 285.93 for MC1 (Figure S2c) and 161.89 for MC2 (Figure S2d).
To determine the inter-specific variations of Salvia mitogenomes, we compared the mitogenome sequences of S. officinalis and S. miltiorrhiza [46] using Mummer (v3) [47] (Figure 3). As shown, there were many rearrangements between the two genomes (Figure 3). The lengths of the alignable regions were 177,342 bp (57.55%) for the S. officinalis mitogenome sequences and 176,363 bp (42.59%) for the S. miltiorrhiza mitogenome sequences, respectively (Figure 3).

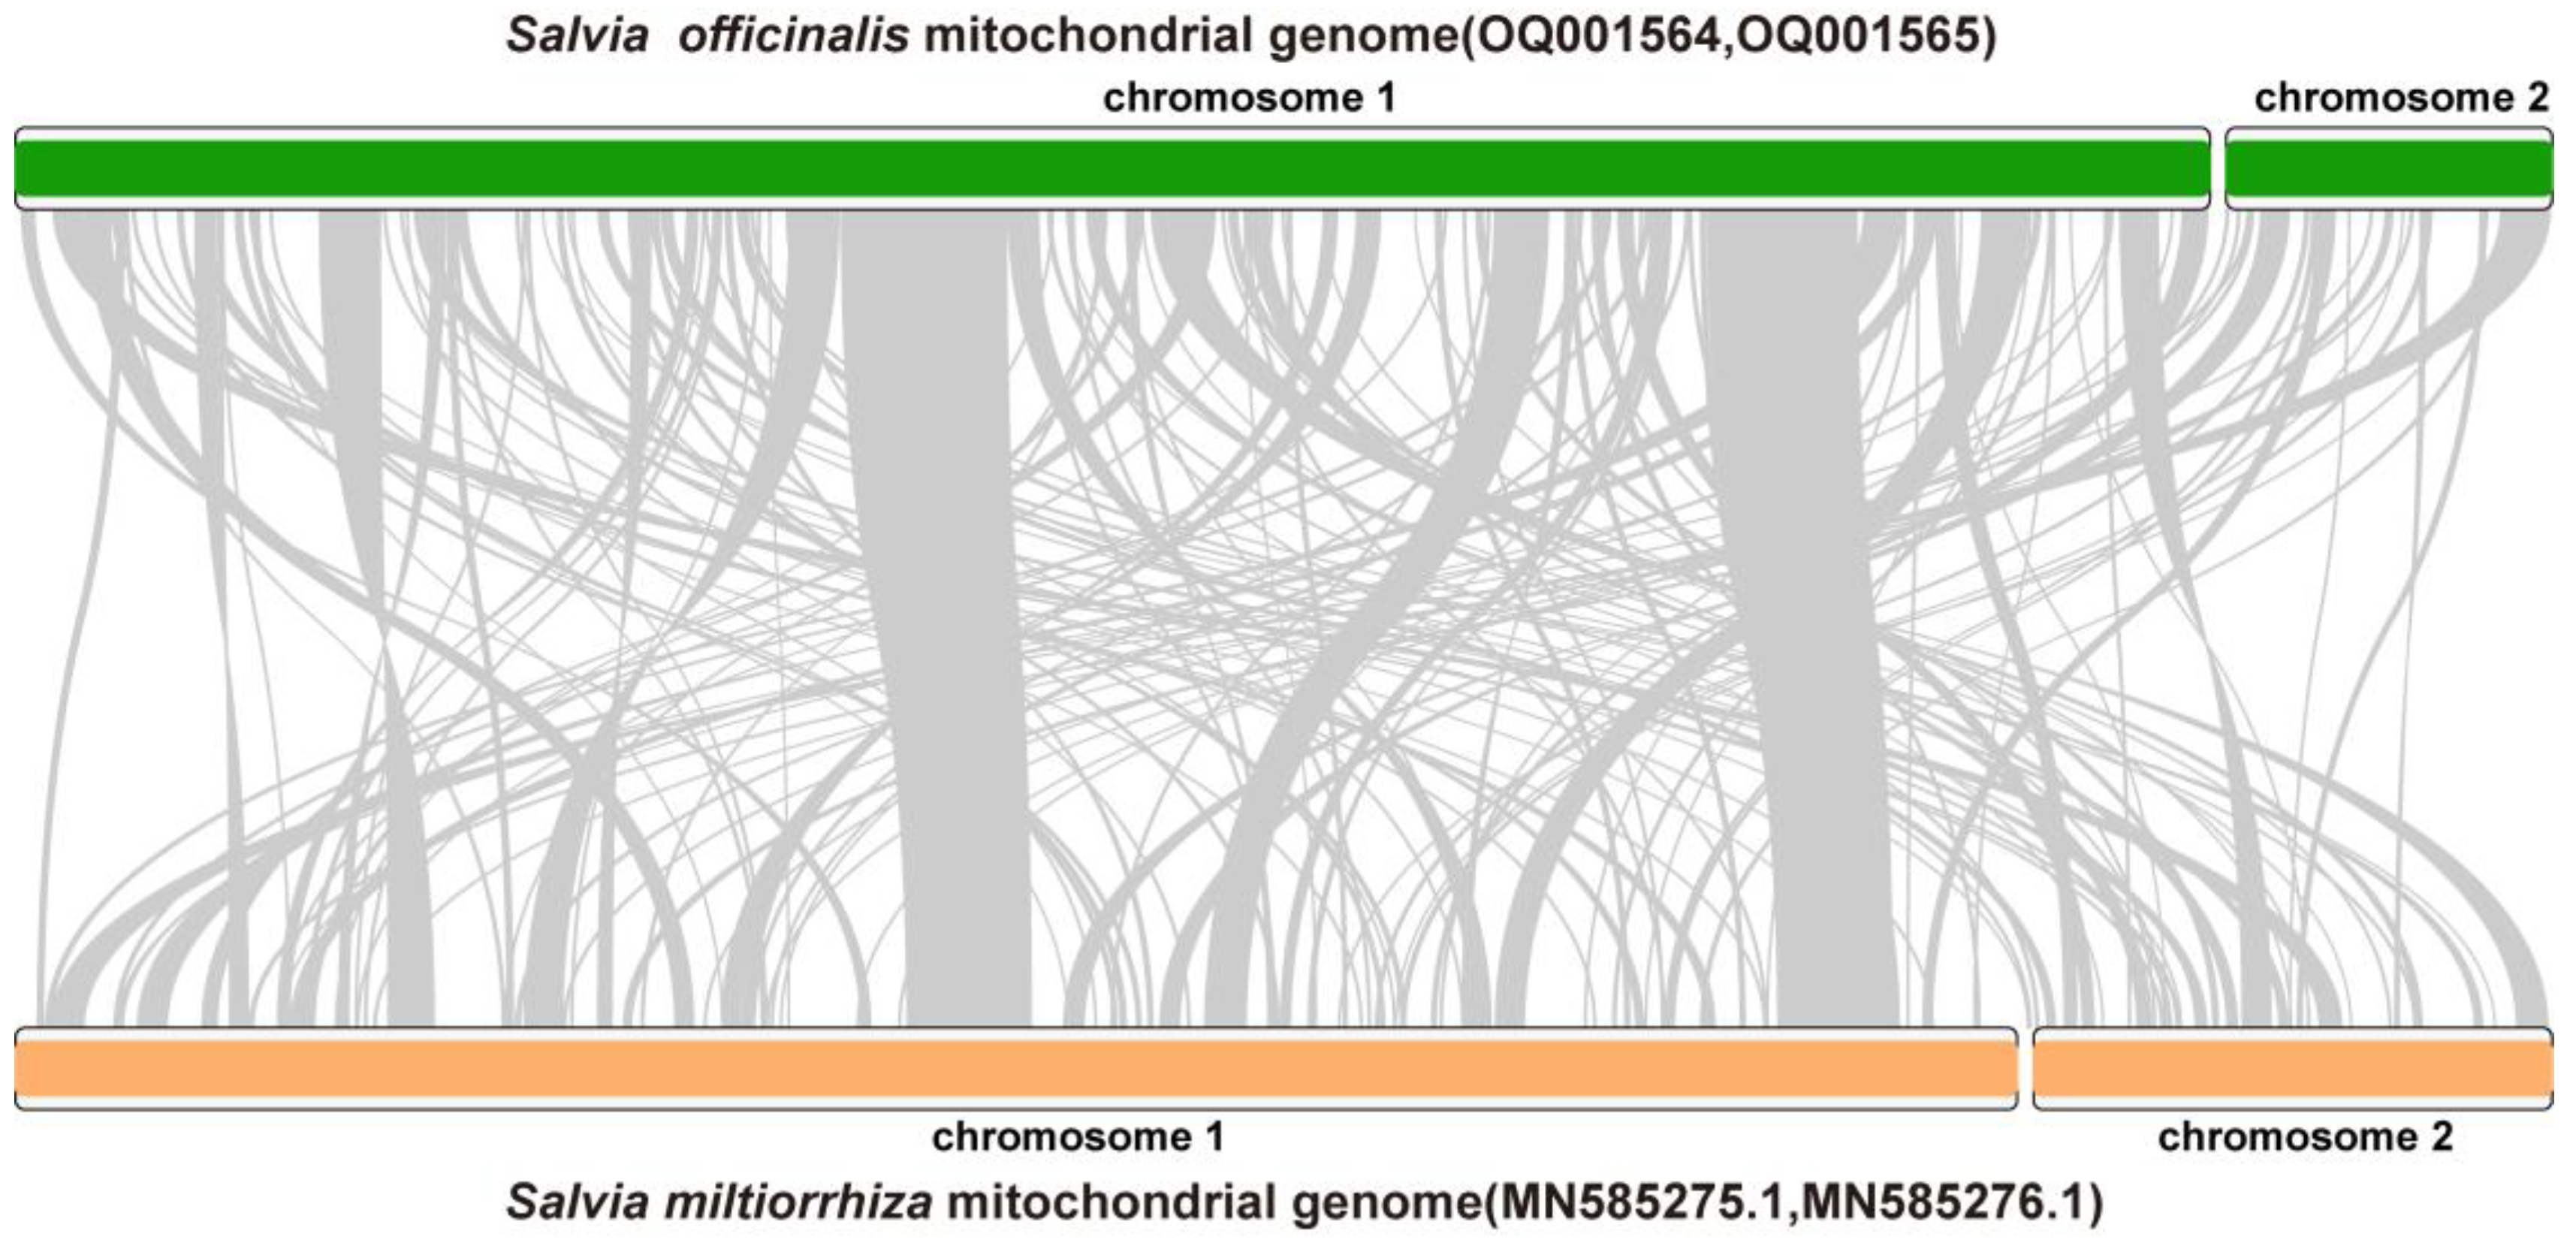
2.2. Gene and Intron Content of S. officinalis and Other Related Lamiales Mitogenomes

The S. officinalis mitogenome encoded 33 PCGs, 3 rRNA genes, and 17 tRNA genes. The distribution of these genes, along with three repetitive sequences (r01, r02, and r47) that might mediate homologous recombinations are shown in Figure 4. Details for the repetitive sequences are provided in Section 2.3. The 33 PCGs included the 24 core PCGs found in most of the angiosperm plants and 9 variable PCGs (Table 2), consistent with prior descriptions for angiosperm mitogenomes [24]. The coding sequences (CDs) covered 12.5% of the mitogenome.
Furthermore, we compared the gene contents of S. officinalis with all its Lamiales relatives (Figure 5A). We found that all the core genes were present. The Salvia mitogenomes lost four variable genes: rpl2, rpl23, rps7, and sdh3. In addition, the sdh4 was found to be a pseudogene as only partial sequences remained.
The angiosperm mitogenomes contain group I and group II introns [48]. The two types of introns were defined according to their conserved folding structures and splicing mechanisms [49]. These introns were removed by cis- or trans-splicing to form continuous and functional transcripts [50,51]. In the S. officinalis mitogenome, 10 PCGs contained 18 cis-spliced introns (Figure 5B). Among them, nad1, ccmFc, cox1, cox2, rps3, and rps10 contained one cis-spliced intron each. nad5 contained two cis-spliced introns. nad2 and nad4 contained three cis-spliced introns each. nad7 contained four cis-spliced introns. These introns were named according to a scheme described previously [38,52] and the names of the introns are shown in Figure 5B. Three PCGs (nad1, nad2, and nad5) contained six trans-spliced introns in total: nad1i394, nad1i669, nad1i728, nad2i542, nad5i455, and nad5i477 (Figure 5B).
We inferred intron gain/loss polymorphism in the S. officinalis mitogenome and the other ten Lamiales mitogenomes, which were introduced in the method of phylogenetic analysis (Section 4.7). The cox1 intron (cox1i729) was detected in eight species, including S. officinalis, but was not detected in the three species: E. guttata, O. fragrans, and H. palmeri (Figure 5B). In the eight Lamiales species, the cox1 intron was highly conserved in terms of its position on the cox1 gene. The presence/absence polymorphism of cis-spliced intron cox2i691 was also observed. Moreover, nad1i728 was cis-spliced in the two Oleaceae species. Its adjacent exons were trans-spliced in the nine Lamiales species (Figure 5B).
Figure 5. Heatmaps showing the PCG contents (A) and intron contents (B) in eleven sequenced Lamiales mitogenomes. Each column represents a gene in (A) and an intron in (B). Each row represents a species. The gene and intron names are shown above the heatmaps. The Latin names for each species and the family they belong to are shown to the left of the heatmap. The introns are named according to a prior scheme [52]. The mitogenome generated in this study was labeled with “*”. The different colored and patterned squares in the figures are explained below (A) and to the right of (B) the heatmaps.
Ijms 24 05372 g005

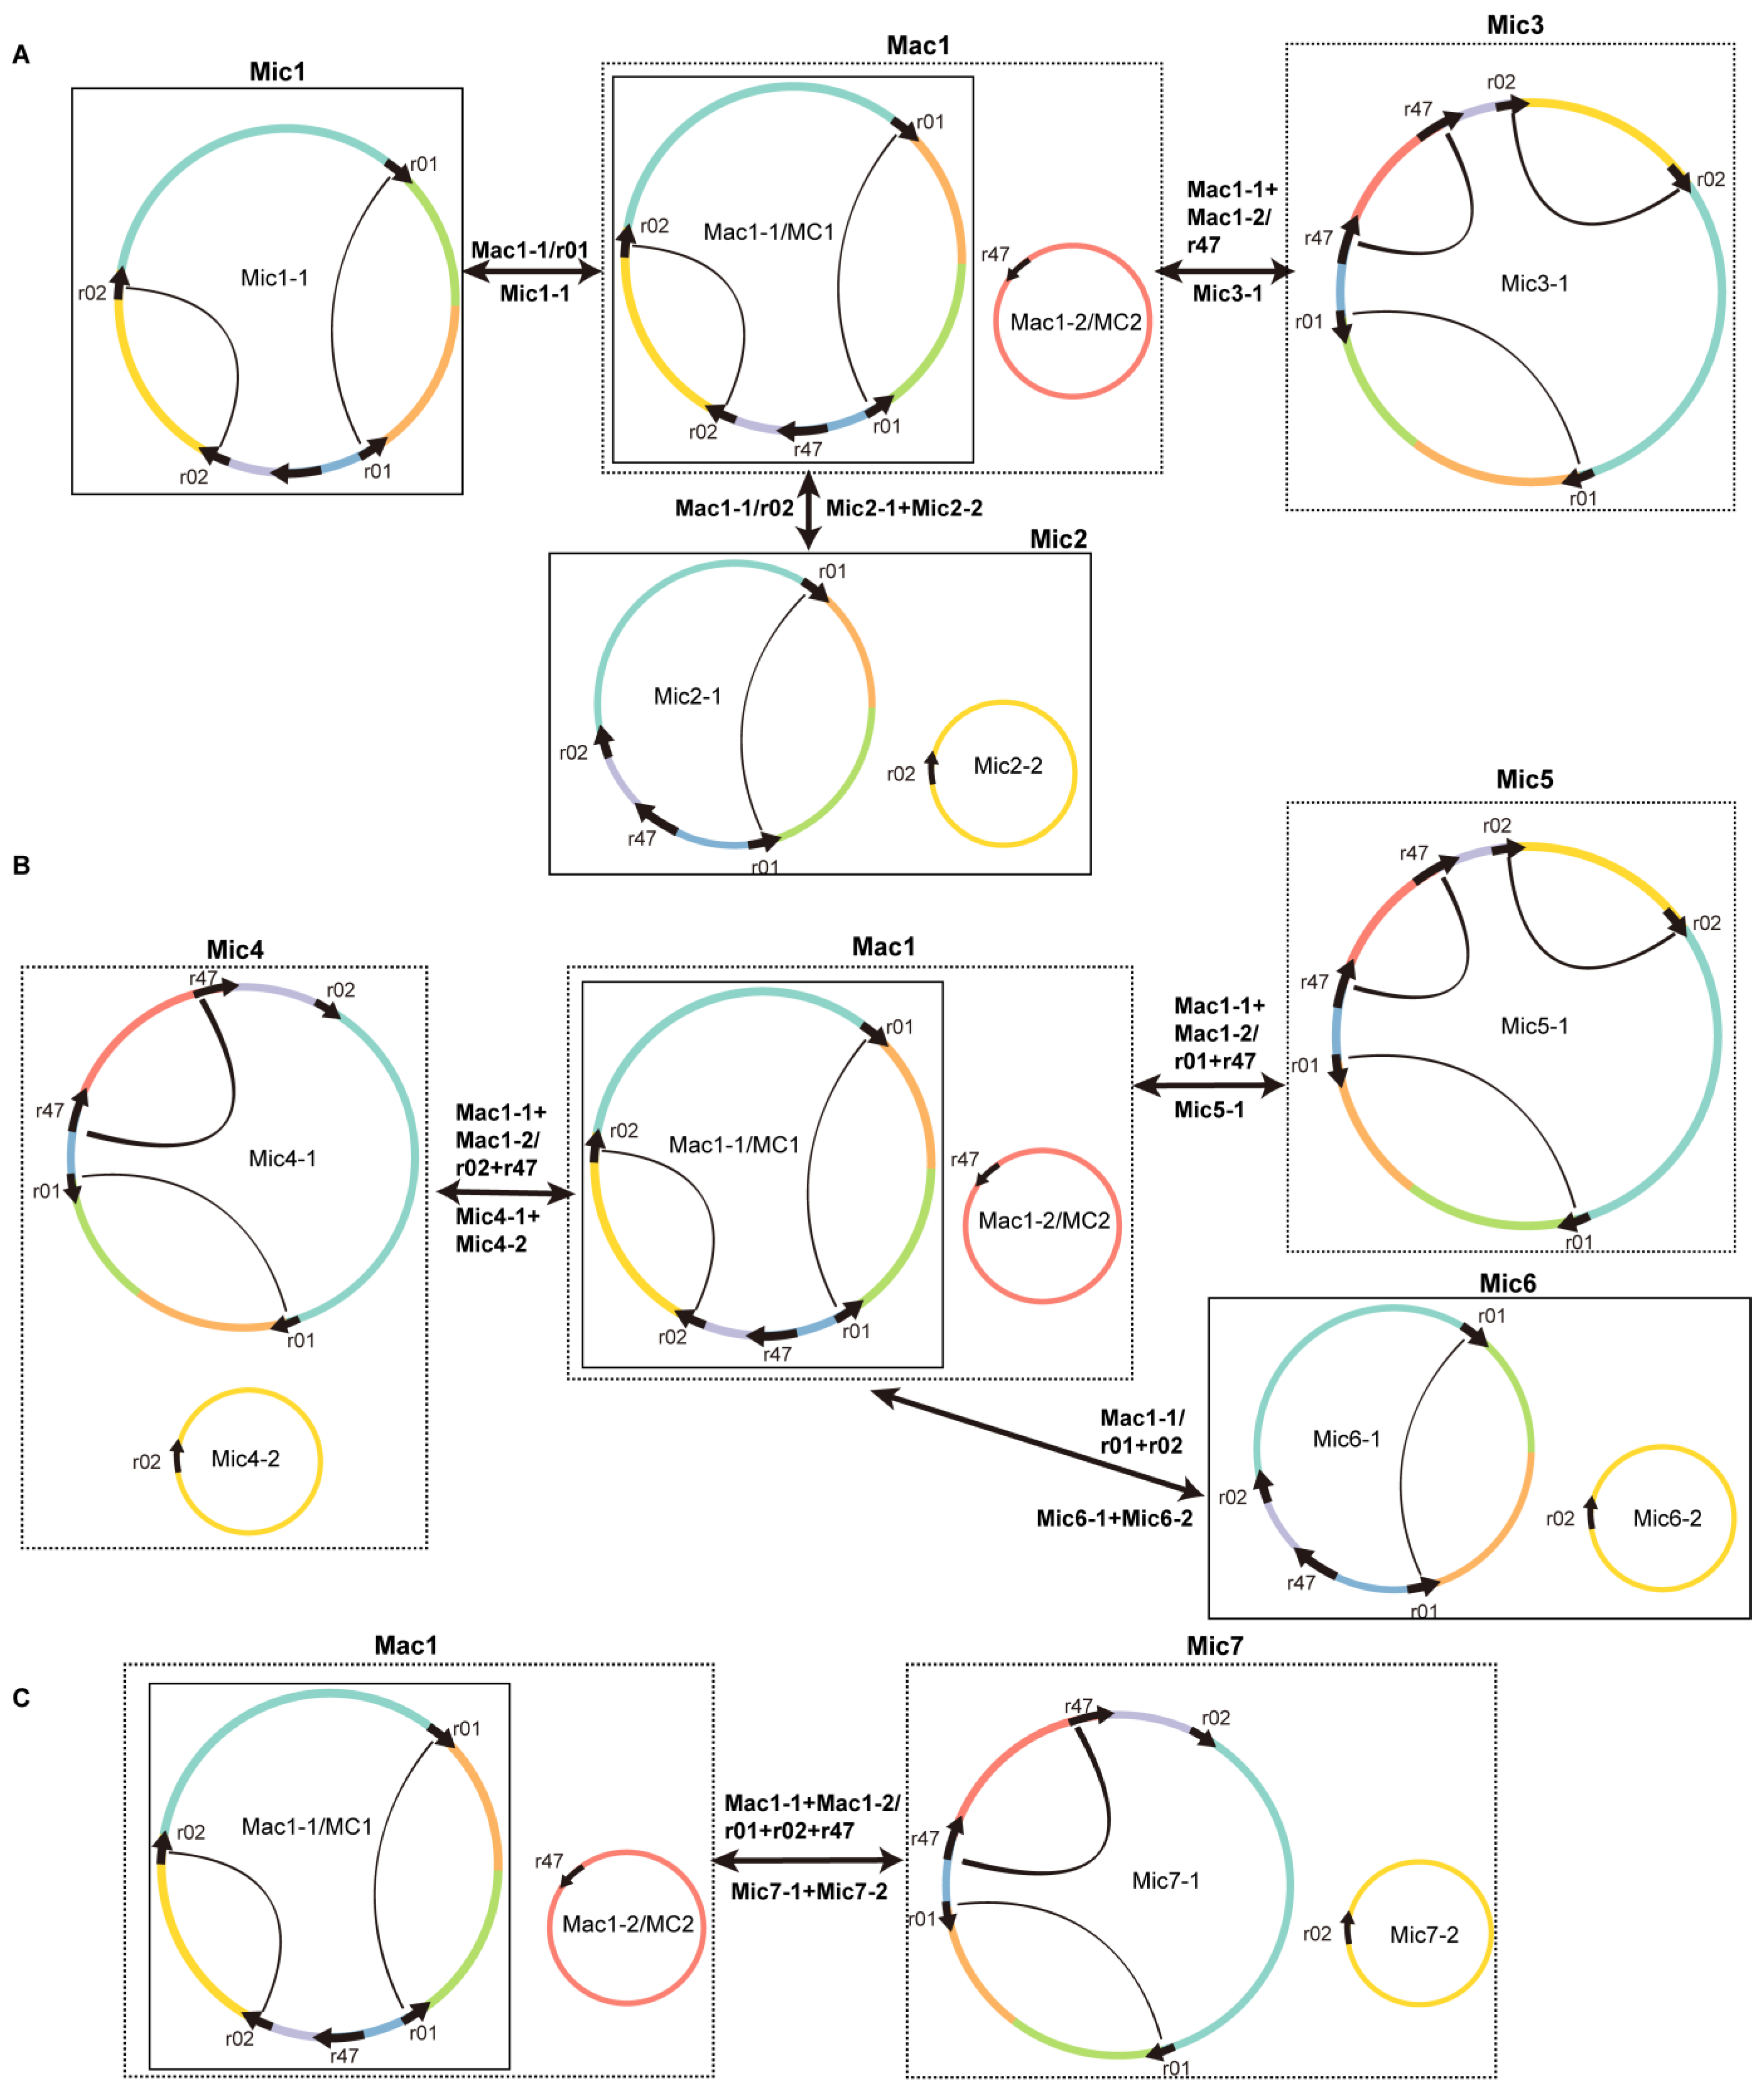
2.3. Homologous Recombination Mediated by Dispersed Repetitive Sequences

Angiosperm mitogenomes contain three types of dispersed repetitive sequences on the basis of the repeat unit length: larger repetitive sequences (LRs), intermediate repetitive sequences (IntRs), and short repetitive sequences (SRs), with repeat unit lengths of “>1 kb”, “100–1000 bp”, and “<100 bp”, respectively [53]. They are vastly distributed among different plants and contribute to homologous recombination and variable mitogenomic structures [54,55]. To identify the repetitive sequences that might mediate homologous recombination in the S. officinalis mitogenome, we conducted a self-to-self sequence comparison using BLASTn with an e-value < 1 × 10⁻⁶ and a word size of 7, as described previously [46]. The BLASTn results contained 52 high-scoring sequence pairs (HSPs). Prior research confirmed that the repeat unit sequences of the repetitive sequences mediating homologous recombination could be variable. Consequently, we considered all these HSPs as potential repetitive sequences and named them r01–r52 (Table 1 and Table S2).
These 52 repetitive sequences corresponded to 47 SRs and 5 IntRs, ranging from 28 to 892 bp in repeat unit length, with sequence identities ranging from 85.98% to 100% (Table S2). Among these 47 SRs and 5 IntRs, 30 SRs and 2 IntRs were intra-chromosomal, as both repeat units were on MC1 and MC2. By contrast, 20 SRs were inter-chromosomal and the two repeat units were located separately on MC1 and MC2.
To investigate if these repetitive sequences can mediate homologous recombination, we extracted the repeat unit sequence along with its 1000 bp long flanking sequences and combined them to form the reference sequences representing the four conformations before and after recombination (Figure 6A). Then, we mapped the Nanopore long reads to the reference sequences representing those before and after recombination. The homologous recombination products of three repetitive sequences (r01, r02, and r47) were supported by the Nanopore long reads. Further examination of these three repetitive sequences showed that they corresponded to DBS01–03, respectively (Figure S1).
To confirm the presence of the recombination products of r01, r02, and r47, we designed primers that can amplify DNA sequences corresponding to the c1–4 conformations (Table S3). The primers were then used to amplify the genomic DNA (gDNA), and the products were sequenced with the Sanger method. The gel electrophoresis results of the PCR products are shown in Figure 6B. The products corresponding to the c1–c4 recombination product conformations affiliated with r01, r02, and r47 are shown on lanes 1–4, 5–8, and 9–12, respectively. The PCR products were recovered and subjected to Sanger sequencing. The comparison of the Sanger sequencing results and those expected sequences revealed identical sequences (Figure S3).
We then drew the structure of the circular molecules that might result from the recombination mediated by the repetitive sequences r01, r02, and r47 (Figure 7). We define genomic conformation as a set of chromosomes that can contain all the genomic contents. As shown in Figure 7A, we defined the genomic conformation containing both MC1 and MC2 as major conformation 1 (Mac1). Then, four circular molecules, namely, Mic1-1, Mic2-1, Mic2-2, and Mic3-1, can be formed after recombination, mediated by r01, r02, and r47 alone, repeatedly. Assuming recombinations mediated by the three repetitive sequences were independent, then various recombination products can be obtained after recombinations mediated by two and three of the repetitive sequences. In Figure 7B, we showed that Mac1 can form Mic4, Mic5, and Mic6 through recombinations mediated by r02 + r47, r01 + r47, and r01 + r02, respectively. In Figure 7C, we showed that Mac1 can form Mic7 through recombinations mediated by all three repetitive sequences.
It should be noted that the genomic conformation Mic3 had only one circular chromosome, which was traditionally regarded as the master circle. Here, we found that its abundance was lower than that of the Mac1. Therefore, Mac1 was considered the predominant conformation. Note that multiple recombinations mediated by different combinations of repetitive sequences could occur and generate numerous molecules with different conformations.

2.4. Tandem Repeats in the Lamiales Mitogenomes

Tandem repeats, also called tandem repetitive sequences, are repetitive sequences whose repeat units are arranged in tandem. Simple sequence repeats (SSRs), or microsatellites, are short tandem repeat sequences in which the repeat units contain 1–6 nucleotides [56]. Tandem repeats in which the repeat units contain ≥7 nucleotides are designated as long tandem repeats. SSRs are involved in species authentication, genetic variation, construction of linkage maps, population phylogenetics, and evolution [57,58]. The importance of tandem repeats was reported in studies on the transcription, translation, and regulation of promoter activities [59,60]. Using the MISA web service and Linux version of the Tandem Repeats Finder (v4.09), we identified 78 SSRs and 9 long tandem repeats (Table S4).
Among the SSRs, 67 and 11 SSRs were located on MC1 and MC2, respectively. The 67 SSRs on MC1 consisted of 5 SSRs in the exonic regions of genes atp6, cob, rps3, and nad1 (SSR17, SSR18, SSR42, SSR58, and SSR59), and 61 SSRs in the non-exonic regions of the mitogenome (Table S5). One SSR in the MC2 was also located in the exonic regions of gene atp6 (SSR73). The S. officinalis mitogenome is rich in tetranucleotide repeats, which represented 43.28% and 36.36% of all SSRs on MC1 and MC2, respectively. By contrast, trinucleotide repeats were less frequent than their tetranucleotide counterparts and represent 19.40% of all SSRs on MC1. Trinucleotide and hexanucleotide repeats were not found in MC2. The S. officinalis mitogenome contained seven (TR1-7) and two (TR8-9) long tandem repetitive sequences on MC1 and MC2 (Table S6), respectively. The length of the repeat units ranged from 12 to 36 nt.

2.5. Identification of Mitochondrial Plastid DNA (MTPT)

MTPTs are mitochondrial DNA sequences that are derived from plastomes [61]. To identify MTPTs in the S. officinalis mitogenome, we compared the mitogenome and the plastome of S. officinalis using BLASTn with an e-value < 1 × 10⁻⁶ and a word size of 7 [46]. We identified 23 MTPTs in the S. officinalis mitogenome, with a total length of 14,495 bp accounting for 4.70% and 9.59% of the S. officinalis mitogenome and plastome sequences, respectively. The list of MTPTs is shown in Table S7. A schematic representation of the homologous sequence pairs from the mitogenome and plastome is shown in Figure S4.
The size of the MTPTs ranged from 41 to 4,261 bp. Twenty-one (mtpt01–21) and two MTPTs (mtpt22–23) were found in MC1 and MC2, respectively. The two largest MTPTs were mtpt01 (4261 bp) and mtpt11 (3598 bp), covering the regions of MC1 from positions 32,916 to 37,176 and from 167,076 to 170,673 (Table S7). The mtpt01 contained a fragment of the gene ycf2 and the 198 bp long, complete CDs of gene ycf15. The mtpt11 contained the 468 bp long, complete CDs of the gene rps7.
Many complete plastid tRNA genes were also found in the MTPTs, including trnI-CAU, trnN-GUU, trnM-CAU, trnH-GUG, trnD-GUC, trnS-GGA, trnP-UGG, and trnW-CCA (Table S7). To confirm that these sequences homologous to the plastome sequences are indeed on the mitogenome, we extracted the MTPTs and 2 kb long flanking sequences on each side of the MTPTs as reference sequences. We also mapped the Nanopore long reads to these reference sequences. The presence of long reads spanning the homologous sequences would support the notion that these sequences were indeed MTPTs. The mapping results for mtpt01–23 (Figure S5) confirmed the presence of these MTPTs.

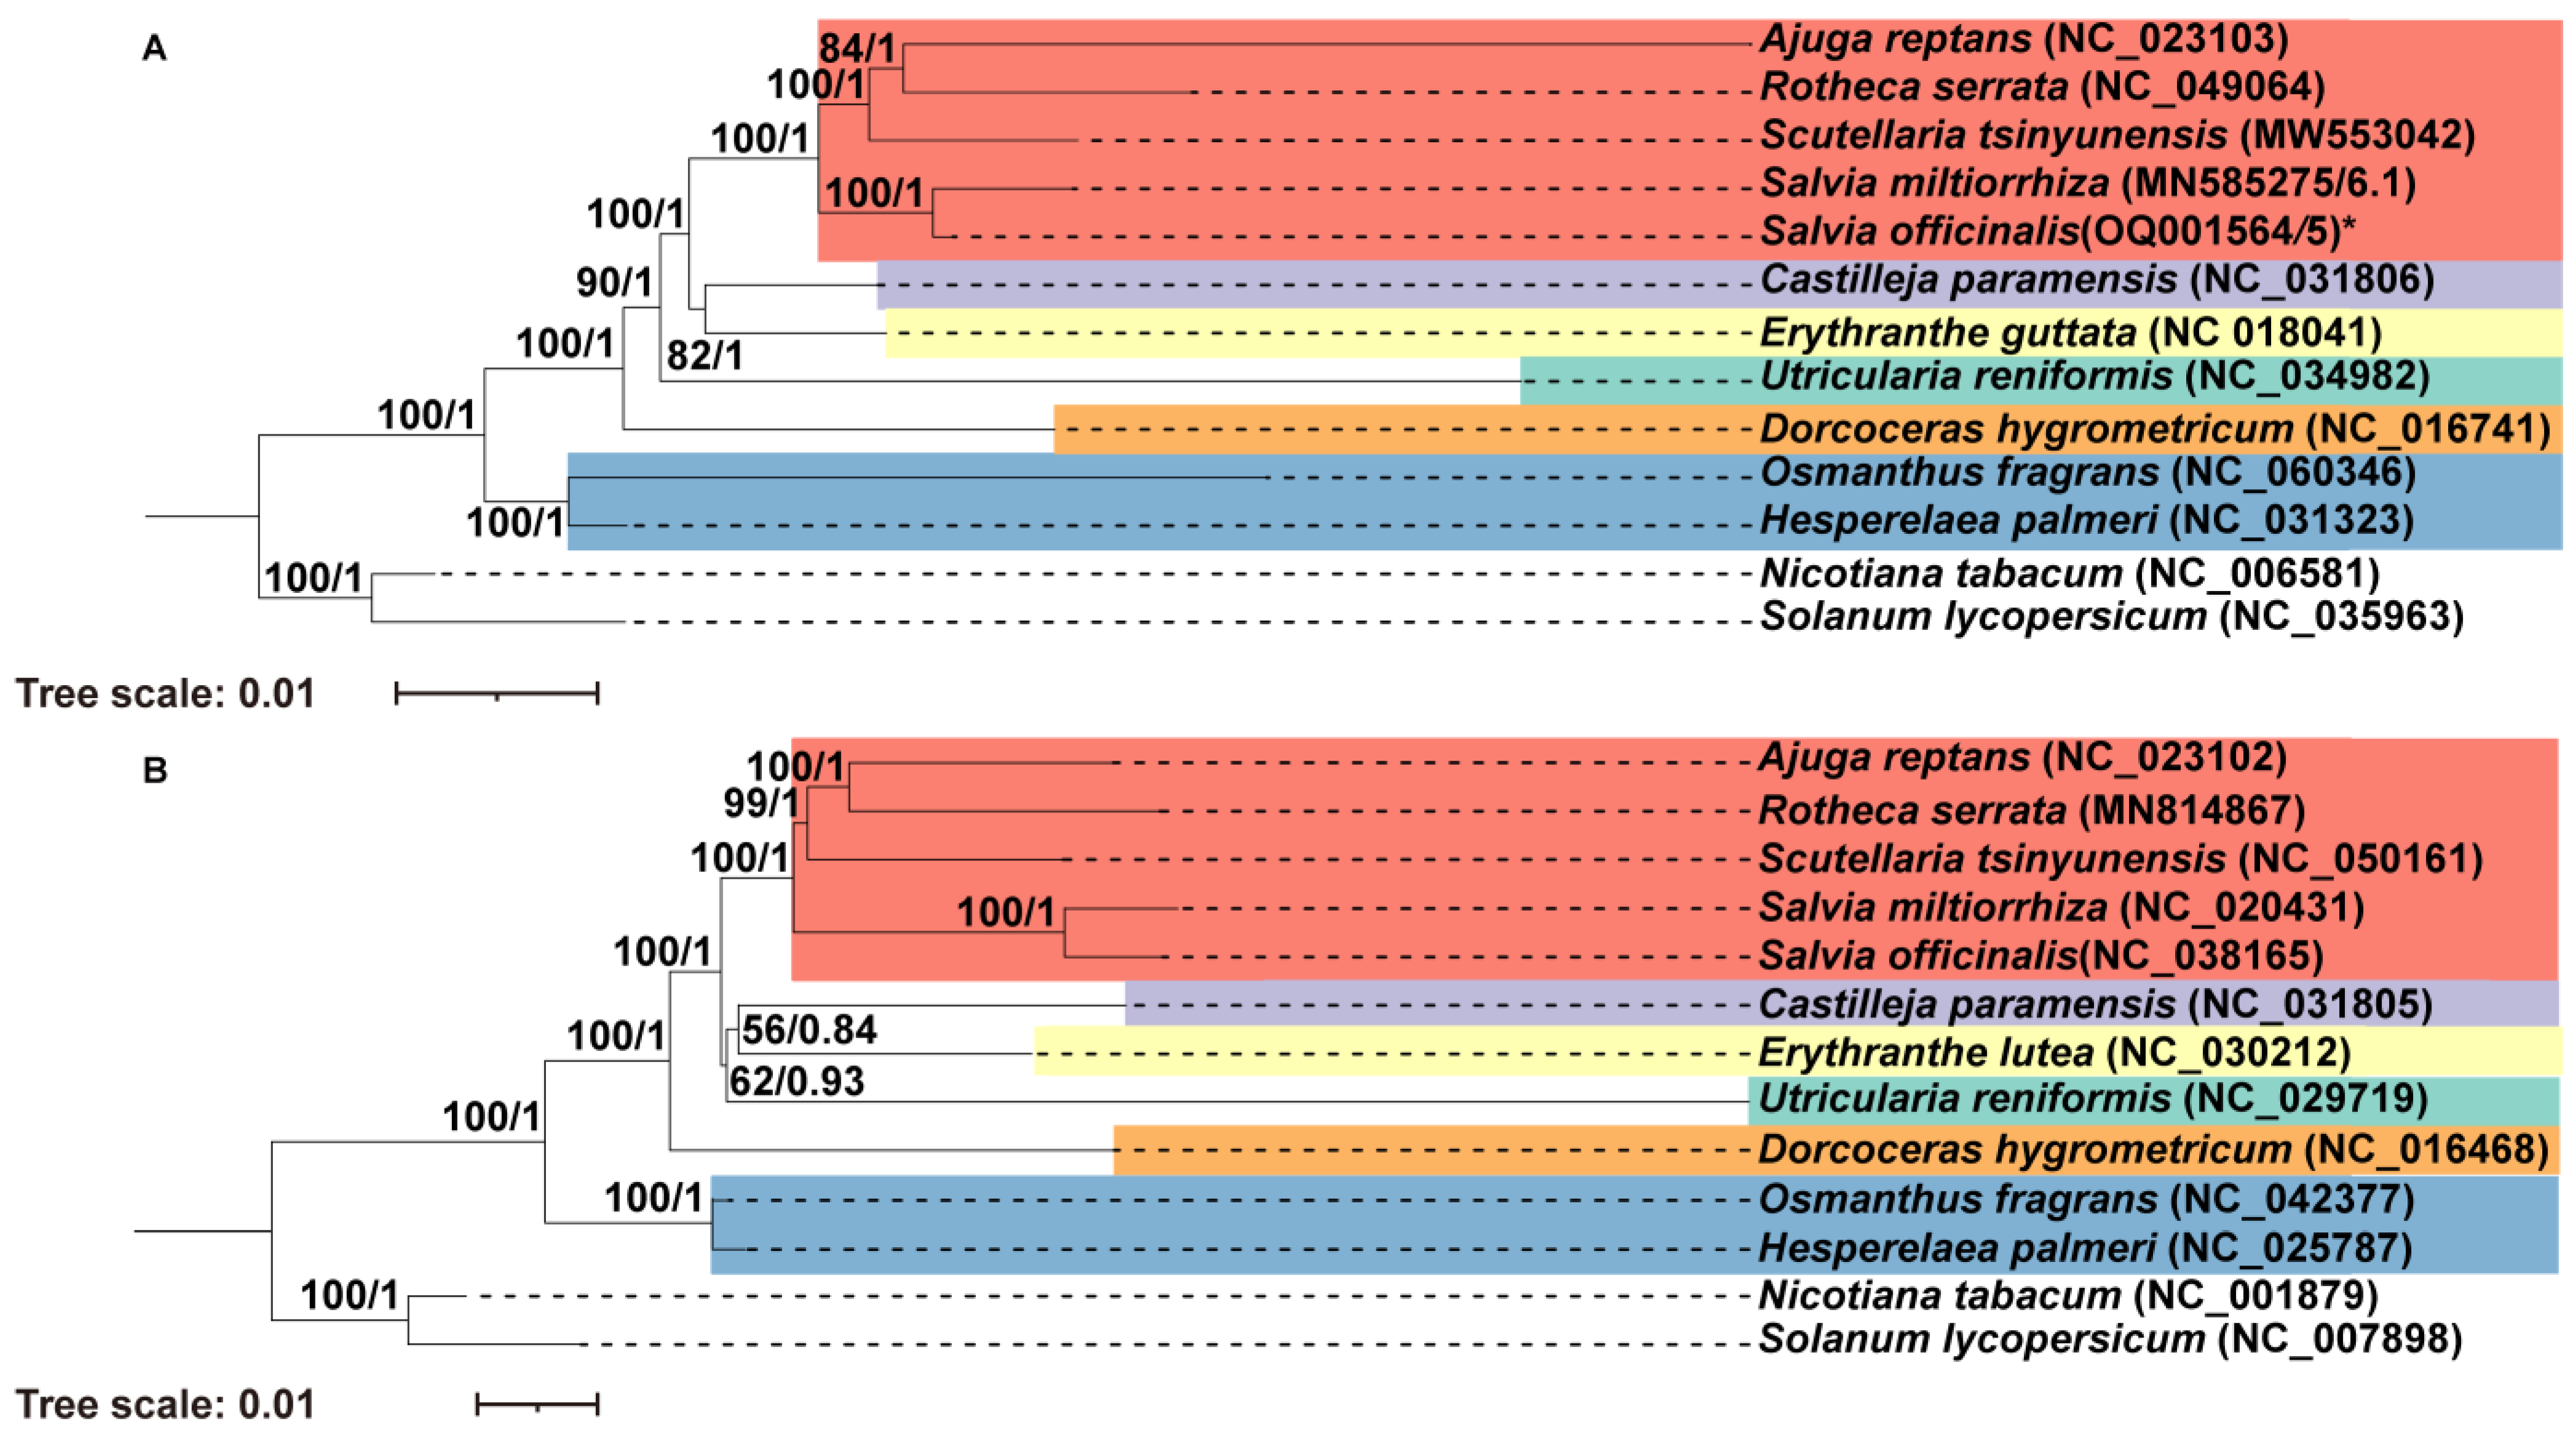
2.6. Phylogenetic Analysis

To understand how mitochondrial genomes evolve, we conducted a phylogenetic analysis of 11 Lamiales species and 2 non-Lamiales species as outgroups. First, we extracted the CDs of 26 genes shared by these 13 species, including the 24 core genes (atp1, atp4, atp6, atp8, atp9, ccmB, ccmC, ccmFc, ccmFn, cob, cox1, cox2, cox3, matR, mttB, nad1, nad2, nad3, nad4, nad4L, nad5, nad6, nad7, and nad9) and 2 variable genes (rps12 and rps13). The CDs were concatenated and subject to multiple sequence alignment with MAFFT. We constructed a maximum likelihood (ML) tree using the RAxML (v8.2.4) and a Bayesian inference (BI) tree using the MrBayes version (3.2.7) [62]. ML and BI analyses revealed that S. officinalis is the sister taxon to S. miltiorrhiza with a bootstrap support of 100 and a posterior probability of 1.00 (Figure 8A). Furthermore, we conducted a parallel phylogenetic analysis of the same taxa using the CDs of 56 common plastid PCGs (Figure 8B). The two trees had identical topology, suggesting that the CDs of mitogenomes and plastomes underwent a similar evolutionary process in these Lamiales species.

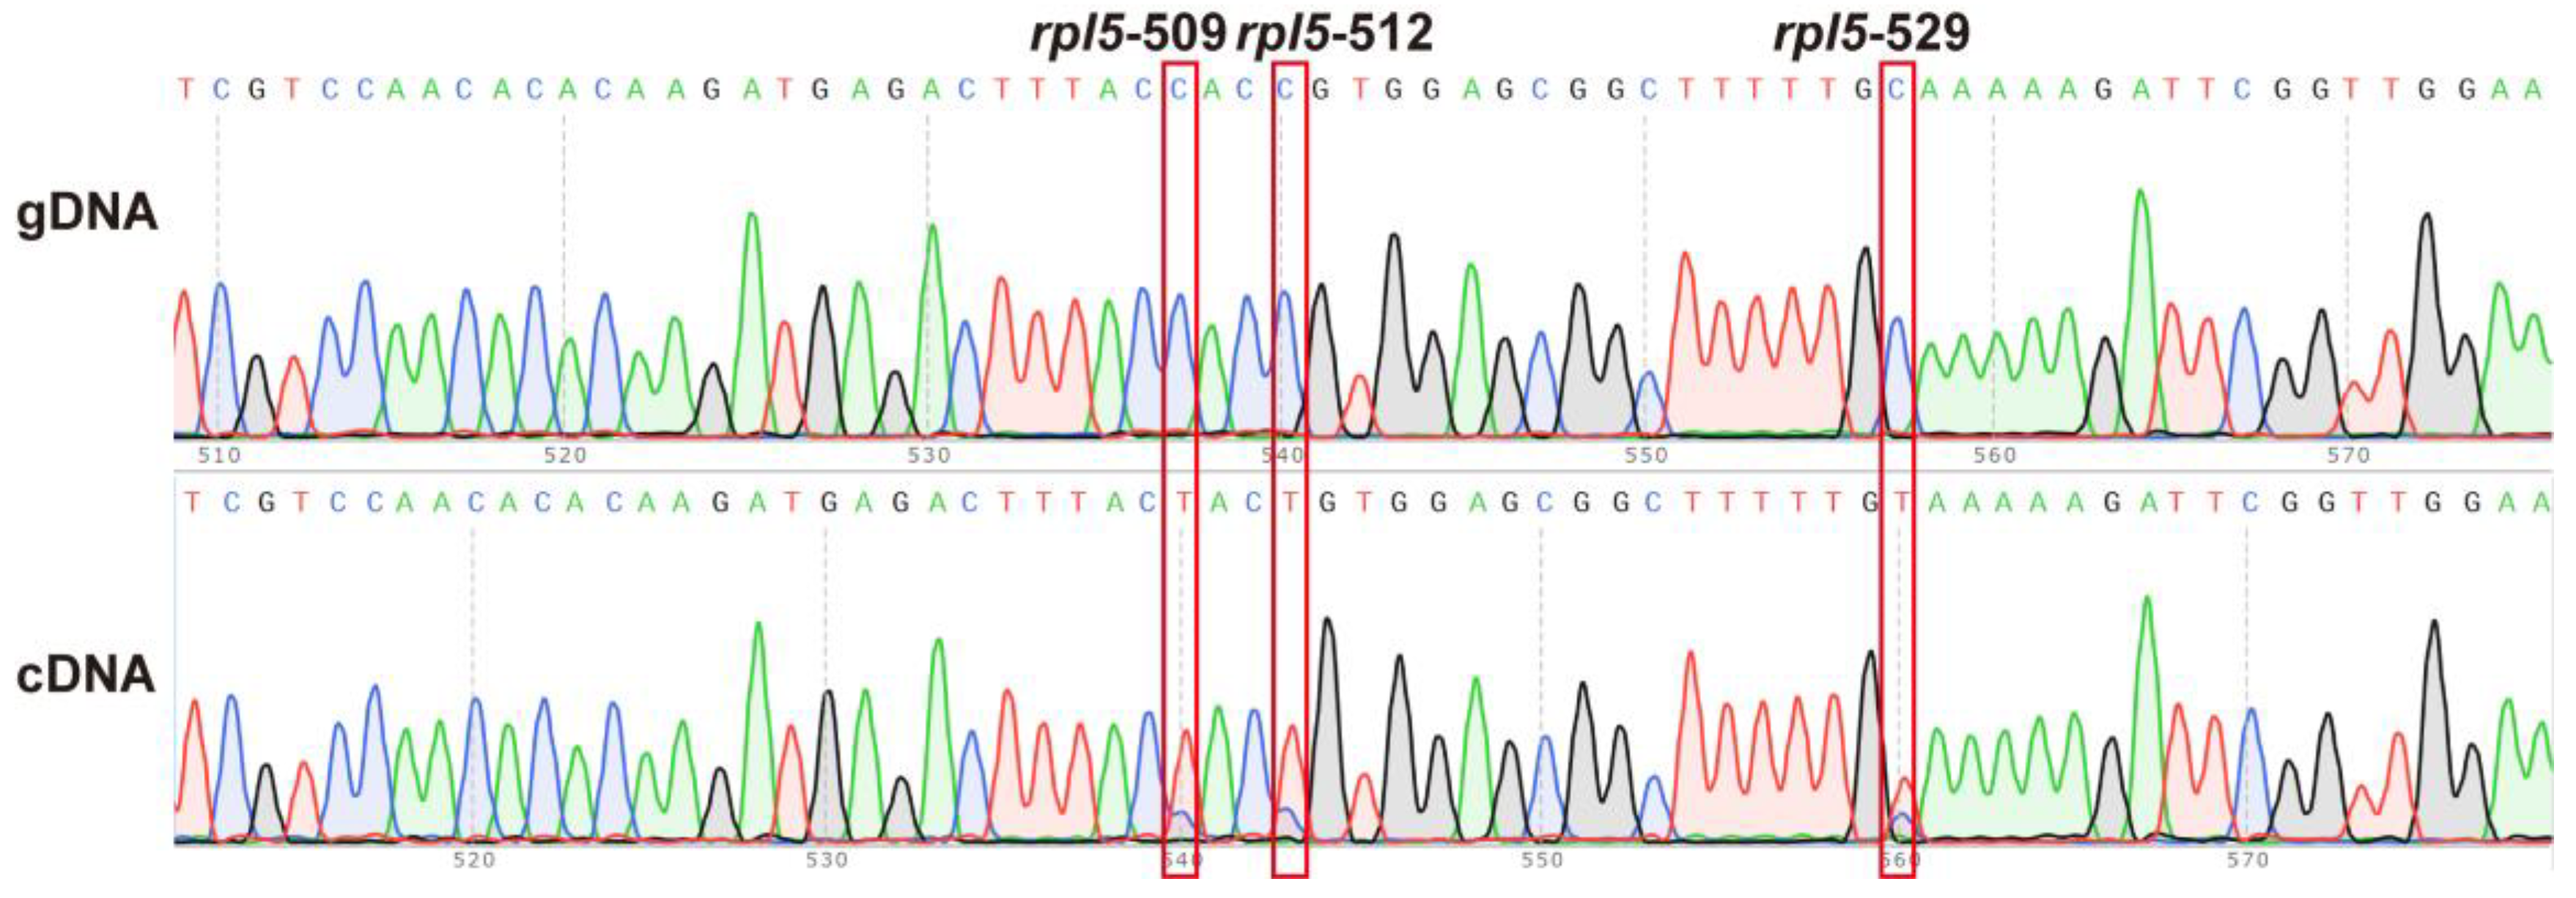
2.7. RNA Editing Site Analysis

RNA editing is a post-transcriptional modification process frequently found in the organelle of high plants [63]. RNA editing plays important roles in protein sequence conservation in the plastids and protein sequence diversification in the mitochondria. RNA editing can affect the composition of the final mitochondrial proteome. Furthermore, RNA editing can create start and stop codons in the mitochondrial mRNA molecules [37] through the so-called start-gain or stop-gain processes [63]. To determine the extent of RNA editing in the S. officinalis mitogenome, we first detected the RNA editing sites using the RNA sequencing reads, and 452 sites in the CDs were obtained within the 31 PCGs (Table S8). To exclude sites that might have originated from polymorphic sites, we identified the single nucleotide polymorphism sites in the CDs of the 31 PCGs (Table S9). Comparing the predicted RNA editing sites and the single nucleotide polymorphism (SNP) sites revealed only one overlap which, in turn, was removed from the downstream analysis of RNA editing events.
For the remaining 451 sites, we first ascertained the discrepancies between the DNA and mRNA sequences. We mapped the RNA sequencing reads to the CDs of 31 PCGs and then visualizes the results using the IGV software (v 2.15.1). The results (Figure S6) confirm the RNA editing of all the detected sites. To further confirm the RNA editing of these sites, we randomly selected 11 genes that contained 126 detected RNA editing sites. We designed specific primers (Table S10) to amplify the corresponding gDNA and complementary DNA (cDNA) sequences. The amplicons were then sequenced using the Sanger method. The comparison of the sequences amplified from gDNA and cDNA was presented in Figure S7. In total, 113 (90%) sites were confirmed successfully (Figure S7 and Table S8).
These 451 sites contained 404 non-synonymous editing sites, significantly more than the 47 synonymous sites in the S. officinalis mitogenome (Table S8). Moreover, 57.21% (258 sites), 32.37% (146 sites), and 10.42% (47 sites) editing sites occurred at the first, second, and third codon positions, respectively (Table S8). Specifically, we detected two stop-gain editing sites rpl5-529 and rps10-307, which created two new stop codons. The rpl5-529 editing changed the codon from CAA to the stop codon TAA (Table S8, Figure 9, Figure S6x, and Figure S7i). The rps10-307 editing changed the codon CGA to the stop codon TGA (Table S8 and Figure S6C).

3. Discussion

Recently, we reported on the mitogenome of S. miltiorrhiza on the basis of Pacbio long reads and Illumina short reads [46]. We were the first to confirm that the predominant conformations of the Salvia mitogenome are two circular chromosomes. To understand the diversity and evolution of the Salvia mitogenomes, we sequenced, assembled, and characterized the mitogenome of S. officinalis in detail in the current study. We characterized the gene contents, SSRs, tandem repeats sequences, dispersed repeat sequences, MTPTs, and RNA editing events in the S. officinalis mitogenome. Lastly, we used the common genes of 11 Lamiales species to identify the phylogenetic relationship and variation in gene and intron contents within Lamiales. The results from this work provide indispensable information for comprehending the diversity and evolution of Salvia mitogenomes.

3.1. Architecture of Two Major Circular Chromosomes and Multiple Variable forms for the S. officinalis Mitogenome

The S. officinalis mitogenome contains two circular chromosomes of 268,341 and 39,827 bps in length. The total length was 308,168 bps (Figure 1). These multichromosomal structures were also found in a close relative, S. miltiorrhiza, which also contained two chromosomes that were 328,915 and 85,199 bps in length. The total length was 414,114 bps [46]. These lines of data suggest that the dominant form of Salvia mitogenomes might be two circular chromosomes. With the availability of more Salvia mitogenomes, we will be able to test if this two-major-chromosome architecture is conserved.
The presence of alternative structures of plant mitogenomes created by repeat-mediated homologous recombination has been reported previously [54,55]. In the S. miltiorrhiza and Scutellaria tsinyunensis mitogenomes, repetitive sequences (numbered nine and one) could mediate homologous recombination, which resulted in alternative genomic conformations. We compared the sequences of these repeats and found no sequence similarity between them. Furthermore, the Mimulus guttatus mitogenome has eight alternative genomic conformations (C2–C8) predicted through the homologous recombination of three large repeats (R1, R2, and R3). In this study, we identified three repetitive sequences, r01, r02, and r47, in the S. officinalis mitogenome that mediated homologous recombination. Seven alternative genomic conformations Mic1–7 were predicted based on the recombination mediated by repeats independently. The results indicate that repeat-mediate recombination is a driving force in a plant mitogenome’s structural diversification.
It should be noted that there were 52 pairs of repetitive sequences in the S. officinalis mitogenome, but only 3 pairs were identified to be associated with homologous recombination. There are two putative explanations. Firstly, other repeats have low or no recombination activity. Secondly, due to the high sequencing error rate of Nanopore reads, it is difficult to identify the different copies of repeats, resulting in no observation of recombination products using the methods and parameters used in this study. Additional recombination products might be identified with an improvement in the accuracy of long-read sequencing. The specific observation of recombination products for these three repetitive sequences suggested that the recombination events are context-specific and that the recombination frequencies might result from the repeat sequences and their high-dimensional structures at or around the repeat sequences. However, we believe that we do not have sufficient data to draw further conclusions in the current paper.
The relative copy number of these alternative subgenomic conformations within plant mitochondria was differential [54] and was controlled by nuclear genes [64]. For instance, one nuclear gene (CHM) in Arabidopsis regulated the genomic shifting process and influenced the abundance levels of subgenomic conformations [64]. The possible involvement of the mechanism of this mitochondrial substoichiometric shifting should be studied in S. officinalis in the future.

3.2. Intron Contents of the Lamiales Mitogenomes

The intron contents of an angiosperm plant’s mitochondrial genes are conserved in each lineage but are variable among different lineages [38]. The introns’ positions, such as those of nad7 introns of Marchantia, have been used as phylogeny markers [65]. In the present study, we observed the variety of intron contents among different Lamiales lineages. For example, intron loss of the cox1 gene (cox1i729) occurred in two Oleaceae species and one Orobanchaceae species (Figure 5B). By contrast, the cox1i729 introns were present in the other eight species. In these eight species, the positions of the cox1i729 were highly conserved.
The origin of the intron cox1i729 has also been examined in the literature. One study proposed that cox1i729 was gained by a single horizontal transfer from fungi and subsequently transferred from one angiosperm to another [66]. Another report suggested that the cox1i729 intron was gained in angiosperms once by largely or entirely vertical transmissions [67]. Five introns (nad1i394, nad1i669, nad2i542, nad5i1455, and nad5i1477) found in the angiosperm mitochondrial trans-spliced genes (nad1, nad2, and nad5) were also identified in the eleven Lamiales species [38]. Furthermore, these trans-spliced introns were postulated to have evolved from one common ancestor by fragmentation of a cis-spliced arrangement [50].

3.3. MTPTs in the S. officinalis Mitogenome

Foreign sequences are commonly found in the angiosperm plants’ mitogenome; in particular, plastome sequences are frequently found in the mitogenomes through intracellular gene transfer (IGT) [68]. In this study, we found 23 MTPTs in the S. officinalis mitogenome ranging from 41 to 4261 bp. The total length of MTPTs was 14,495 bp and represented 4.70% of the mitogenome. Previously, 16 MTPTs ranging from 115 to 4987 bp (totaling 12,583 bp) and 19 MTPTs ranging from 45 to 902 bp (totaling 3372 bp) were identified in the S. miltiorrhiza and Scutellaria tsinyunensis mitogenomes, covering 3.04% and 0.95% of the mitogenome, respectively [46,69]. A higher ratio of the MTPT sequences was gained in other plants, such as a total of 6.3% of plastid sequences in the rice mitogenome [70].
In addition, the largest MTPT of the S. officinalis mitogenome (4261 bp) was slightly shorter than the largest MTPT in the S. miltiorrhiza mitogenome (4987 bp) but was more than four times longer than the largest MTPT in the Scutellaria tsinyunensis mitogenome (902 bp). The long fragments that transferred from plastids were not unique to the Salvia mitogenomes as they were also found in the Physochlaina orientalis mitogenome, with the largest MTPT being 6593 bp. Most MTPTs in the S. officinalis, S. miltiorrhiza, and Scutellaria tsinyunensis mitogenomes might be genetically inserted and become functionless as fragments of the coding genes. This presumption was also given in other higher plants [68]. The plastome tRNA genes were always intact and present in the S. officinalis and Scutellaria tsinyunensis mitogenomes. Current data suggest that the MTPTs are quite diverse in terms of length and content within the S. officinalis mitogenome.

3.4. RNA Editing in the S. officinalis Mitogenome

We also compared the 451 RNA editing sites detected in this work to those in a previous study of S. miltiorrhiza and found 193 sites in the homologous sites of the PCGs (Table S8). The stop codon gain site of rps10-307 was also conserved in the two mitogenomes. In the future, more mitogenome sequences of Salvia are needed to obtain additional information about the conservation of and variation in RNA editing events, and the protein sequences and structures of Salvia mitogenomes.
RNA editing events modify transcript site-specific information post-transcriptionally, and mitochondrial RNA editing events have been extensively detected among land plants [63,71,72]. Additionally, RNA editing sites are somewhat conservative in the angiosperm plant mitochondrial genome [73]. In our work, 13 of the 126 RNA editing sites in PCGs were not validated successfully. This outcome might be caused by the following reasons. First, the frequency of RNA editing was low in some of these sites (eight sites had frequencies of RNA editing ranging from 0.13 to 0.44). Second, preferential amplification most likely occurs during PCR.
Determining the RNA editing landscape is critical to annotate the mitogenome’s proteome. For example, annotation based on the stop codon on the DNA sequences predicted a CD of the gene rpl5 in S. officinalis that is 786 bp in length. By contrast, the homologous rpl5 CD is 555 bp long in S. miltiorrhiza and 558 bp long in Arabidopsis thaliana. However, considering the stop gain, the CDs of the gene rpl5 in S. officinalis became 529 bp in length and were more similar to their homologous sequences in S. miltiorrhiza and Arabidopsis thaliana. Furthermore, the sequence downstream from the stop gain codon had little similarity to sequences from S. miltiorrhiza and Arabidopsis thaliana. Taken together, DNA sequences alone are not sufficient to annotate PCG sequences, and RNA editing events must be taken into consideration.

4. Materials and Methods

4.1. Plant Materials and Nucleic Acid Preparation

Young leaves were collected from an S. officinalis line (named so-01) grown at the Institute of Medicinal Plant Development, Chinese Academy of Medical Sciences, Peking Union Medical College, Beijing City (E 116°25′, N 39°47′). S. officinalis is not an endangered or protected species, so no specific permissions were required for sample collection. The taxonomic identity of S. officinalis was confirmed by Dr. Yaodong Qi of the Institute of Medicinal Plant Development, Chinese Academy of Medical Sciences, Peking Union Medical College, Beijing. The S. officinalis plant was photographed by Dr. Xinlei Zhao, Institute of Medicinal Plant Development, Chinese Academy of Medical Sciences, Peking Union Medical College, Beijing (Figure 1). The voucher specimen of S. officinalis was deposited at the Institute of Medicinal Plant Development and assigned the accession number so-01-yhy. The S. officinalis leaves were kept at −80 °C until use.
For DNA sequencing, a plant genomic DNA kit (Tiangen Biotech, Beijing, Co., Ltd., Bejing, China) and an RNAprep Pure Plant Kit (Tiangen Biotech Beijing Co., Ltd) were used to isolate the total DNA and RNA from the fresh S. officinalis leaves, respectively. The DNA and RNA yield and purity were assessed using a Nanodrop spectrophotometer 2000 (Thermo Fisher Scientific, Waltham, MA, USA) and 1.0% agarose gel electrophoresis.

4.2. DNA and RNA Sequencing

For short read DNA sequencing, the DNA was first fragmented into 350 bp long fragments using the Covaris S2/E210 ultrasonicator (Covaris Inc., Woburn, MA, USA). The sequencing library was constructed with the NEBNext Ultra DNA Library Prep Kit for Illumina (NEB) according to the manufacturer’s instructions. The library was then subjected to pair-end sequencing (2 × 150 bp reads) on an Illumina HiSeq 2500 sequencer using the standard protocol (Illumina, Inc; San Diego, CA, USA) at Grandomics Biotechnology Co., Ltd. (Wuhan, China).
For long read DNA sequencing, the large DNA fragments (>10 kb) were selected and enriched by the Short Read Eliminator XS kit (Circulomics, Inc., Baltimore, MD, USA). The sequencing library was constructed using the Ligation Sequencing Kit SQK-LSK109 (Oxford Nanopore Technologies, Cambridge, UK) and sequenced on an R9.4.1 flow cell on the MinION sequencer at Grandomics Biotechnology Co., Ltd. The ONT MinKNOW v19.12.5 software was utilized for base calling.
For the total RNA sequencing, the rRNA in the total RNA was removed using a Ribo-ZeroTM Magnetic Kit (Epicenter, Madison, WI, USA). The sequencing library was prepared with a VAHTS Universal V8 RNA-seq Library Prep Kit (Vazyme, Nanjing, China) according to the manufacturer’s instructions. The prepared library was sequenced on an Illumina HiSeq 2500 sequencer (2 × 150 bp reads) at Grandomics Biotechnology Co., Ltd.

4.3. Mitogenome Assembly and Annotation

To acquire the complete sequence and uncover the possible structures of the mitogenome of S. officinalis (so-01), we performed a hybrid assembly strategy. We extended the mitochondrial short reads using the GetOrganelle (v1.6.4) toolkit. Subsequently, the GetOrganelle-extended reads were de novo assembled into a unitig graph using the SPAdes software packaged in the Unicycler (v0.4.9) [74]. Lastly, the DBSs in the unitig graph were resolved using the Unicycler with the Nanopore long reads.
To verify that the DBSs were resolved correctly, we extracted the repeat sequence and its 1000 bp long flanking sequences and combined them to form the reference sequences for the four conformations. The Nanopore long reads were then mapped to the DBSs of the reference sequences using the BWA (v0.7.12-r1039) [75] with default parameters.
Subsequently, the Nanopore long reads and the Illumina short reads were mapped back to the complete sequences of mitogenome using the BWA (v0.7.12-r1039) [75] with default parameters. The coverage depth of the long and short reads mapped to the S. officinalis mitogenome sequences was obtained using samtools (v1.3.1) [76].
For mitogenome annotation, we used a new custom program: MGA (http://www.1kmpg.cn/mga (accessed on 10 November 2022)). Finally, we carefully checked the start and stop codon positions and intron/exon boundaries of each gene using the program Apollo [77]. Maps of the circular S. officinalis mitogenome were drawn using PMGView (http://www.1kmpg.cn/pmgview (accessed on 10 November 2022)). The mitogenome sequences of S. officinalis were deposited in GenBank under the accession numbers OQ001564 and OQ001565.
For the collinear analysis of the Salvia mitogenomes, we used the Nucmer module in Mummer (v3) [47] with the parameters used in a previous report [78]. Briefly, the identity threshold was set to 85% and the alignment mode was many-to-many. The results of the collinear analysis were visualized using RIdeogram in the R package [79].
To identify the presence/absence of polymorphisms in the introns’ contents, we checked the intron contents of ten Lamiales species using MGA (http://www.1kmpg.cn/mga (accessed on 15 November 2022)). We named the introns following the scheme proposed by a previous report [52], which denoted each intron according to the positions of its orthologous genes in Marchantia polymorpha.

4.4. Analysis of the Homologous Recombination

To identify the repetitive sequences in the S. officinalis mitogenome that might mediate homologous recombination, we conducted a self-to-self comparison of the mitogenome using BLASTn (v 2.10.1+) with the parameters e-value < 1 × 10⁻⁶ and word_size = 7, as described previously [46]. To detect the possible recombination products of these homologous sequences, we extracted the homologous sequences and their 1000 bp long flanking sequences and combined them to form the reference sequences corresponding to the recombination products. Subsequently, we mapped the Nanopore long reads to these reference sequences and counted the numbers of reads spanning the homologous sequences.
To validate the presence of the homologous recombination products supported by the Nanopore long reads, we designed primers according to the corresponding reference sequences using Primer-BLAST [80]. PCR amplification was conducted for a total volume of 25 µL that contained 12 µL of 2 × Taq PCR Master Mix (TransGen Biotech, Beijing, China), 11 µL of water, 0.5 µL of each primer, and 1 µL of DNA. We performed the PCR reactions on a Pro-Flex PCR system (Applied Biosystems, Waltham, MA, USA) under the following conditions: denaturation at 94 °C for 2 min; then 35 cycles of 94 °C for 30 s, 57 °C for 30 s, and 72 °C for 60 s; and extension at 72 °C for 2 min. We visualized the PCR amplicons with 1.0% agarose gel electrophoresis and sequenced the PCR amplicons using the Sanger sequencing technology at SinoGenoMax Co., Ltd. (Beijing, China).

4.5. SSRs and Tandem Repeats Analysis

To analyze the SSRs in the S. officinalis mitogenome, we used the MISA web service [56], with 10 as the number of mononucleotide repeat units; 5 as the number of dinucleotide repeat units; 4 as the number of trinucleotide repeat units; and 3 as the number of tetra-, penta-, and hexanucleotide repeat units. The tandem repeats were determined using Tandem Repeats Finder (v 4.09) [81] with the command line “trf mitogenome.fasta 2 7 7 80 10 50 500”. The parameter settings were 2 for matches; 7 for mismatches and indels; and 50 and 500 for the minimum alignment score and maximum period size, respectively.

4.6. Identification of Mitochondrial Plastid DNA (MTPT)

We compared the sequences of the mitogenome and plastome (NC_038165.1) using BLASTn (v 2.10.1+) with an e-value < 1 × 10⁻⁶ and a word size of 7 [46]. All hits were annotated to check the genes located in the MTPTs. Graphic representations of MTPTs in the mitogenome and plastome were created using TBtools (v 1.076) [82]. To validate the presence of MTPTs, we extracted the MTPTs and their 2000 bp long flanking regions on each side as reference sequences. We then mapped the Nanopore long reads to these reference sequences with BWA-MEM [83]. The number of long reads that spanned the MTPTs was counted. We utilized Integrative Genomics Viewer (IGV) software (v 2.15.1) [84] to visualize the reads mapped to the reference sequences.

4.7. Phylogenetic Analysis of the 10 Lamiales Species Based on Common Mitochondrial Protein Sequences

For the phylogenetic analysis, we retrieved the mitogenome sequences from S. officinalis (OQ001564 and OQ001565), ten Lamiales species, and two outgroup species. The ten Lamiales mitogenomes include Ajuga reptans (NC_023103.1), Rotheca serrata (NC_049064.1), Scutellaria tsinyunensis (MW553042.1), S. miltiorrhiza (NC_023209.1), Erythranthe lutea (NC_018041.1), Castilleja paramensis (NC_031806.1), Utricularia reniformis (NC_034982.1), Dorcoceras hygrometricum (NC_016741.1), Osmanthus fragrans (NC_060346.1), and Hesperelaea palmeri (NC_031323.1). The two outgroup species were from the order Solanales: Nicotiana tabacum (NC_006581.1) and Solanum lycopersicum (NC_035963.1).
The CDs of the 26 PCGs (atp1, atp4, atp6, atp8, atp9, ccmB, ccmC, ccmFc, ccmFn, cob, cox1, cox2, cox3, matR, mttB, nad1, nad2, nad3, nad4, nad4L, nad5, nad6, nad7, nad9, rps12, and rps13) present in all these thirteen mitogenomes were extracted using PhyloSuite (v1.2.1) [85]. The sequences of each gene were aligned with MAFFT (v7.450) [86] and concatenated into a data matrix using PhyloSuite. The ML tree was constructed using RAxML (v8.2.4) [87] with the parameters “raxmlHPC-PTHREADS-SSE3-f a-N 1000-m PROTGAMMACPREV-x 551314260-p 551314260-o Nicotiana_tabacum, Solanum_lycopersicum-T 20.” The bootstrap support values of each branch in the phylogenetic tree were generated based on 1000 replicates. The BI of the phylogeny was performed using MrBayes (v3.2.7) [62] according to the appropriate model (TVM+I+G), and the parameters were determined by jMdoleTest (v2.1.0) [88]. All resulting trees were visualized with iTOL viewer (https://itol.embl.de (accessed on 20 November 2022)).
The CDs of the 56 common PCGs (atpI, atpF, rps15, atpE, rpl22, rpl16, psbK, psbF, petD, rps3, petA, psaC, rpl14, clpP, rbcL, rps2, rps16, psbH, petL, atpA, rpoB, psbJ, petN, rpl20, rps11, ycf4, accD, rpl2, psbA, psbM, rps4, psbD, rpoC2, petG, matK, rpoA, petB, ycf1, rpl23, psbL, rps8, ycf3, psbC, psbN, rps18, ycf2, rps14, rpl33, atpH, psbE, rpl36, psaB, psbT, psaA, rps7, and rpoC1) of plastomes of thirteen species—Ajuga reptans (NC_023102.1), Rotheca serrata (MN814867), Scutellaria tsinyunensis (NC_050161.1), S. miltiorrhiza (NC_023431.1), S. officinalis (NC_038165.1), Erythranthe lutea (NC_030212.1), Castilleja paramensis (NC_031805.1), Utricularia reniformis (NC_029719.1), Dorcoceras hygrometricum (NC_016468.1), Osmanthus fragrans (NC_042377.1), Hesperelaea palmeri (NC_025787.1), Nicotiana tabacum (NC_001879.1), and Solanum lycopersicum (NC_007898.1)—were subjected to phylogenetic analysis by utilizing the same methods employed for the mitogenome.

4.8. Detection of RNA Editing Sites

We extracted the CDs of each PCG with the 100 bp long flanking regions as reference sequences. We then mapped the strand-specific RNA-seq reads to these reference sequences using HISAT2 (v 2.2.1) [89] with the parameters “--rna-strandness RF--sensitive --no-mixed--no-discordant” [90]. We subsequently used REDItools (v 2.0) [91] with the parameters coverage ≥ 5 and frequency ≥ 0.1 to detect the RNA editing sites [43]. Lastly, we employed IGV software (v 2.15.1) [84] to visualize the mapping results at the RNA editing sites with the minor variant frequency ≥ 0.1.
To detect SNP sites, we mapped the DNA sequencing reads to the reference sequences extracted above using BWA (v0.7.12-r1039) [75] with default parameters, as described before [52,90]. The SNP sites were identified with REDItools (v 2.0) by employing the following parameters: coverage ≥ 5 and frequency ≥ 0.1.
To validate the RNA editing sites detected according to the RNA-seq data, we randomly selected eleven PCGs for PCR amplification and Sanger sequencing of the PCR products. The genomic DNA was the one extracted in the DNA sequencing experiment. To obtain the cDNA, the RNA extracted in the RNA sequencing experiment was subjected to reverse transcription reactions in a 20 μL reaction system containing 1 μg of total RNA, random primers, and 200 U of SuperScript III Reverse Transcriptase (TransGen Biotech, Beijing, China). We utilized the CDs of the selected PCGS as templates and designed primers using the Primer-BLAST. Then, the genomic DNA and cDNA of so-01 were used as templates for PCR amplification under the same conditions described above. The PCR products were subjected to Sanger sequencing at SinoGenoMax Co., Ltd. (Beijing, China).

5. Conclusions

We found that the predominant conformation of the S. officinalis mitogenome is two circular chromosomes. Recombination mediated by one of the three repetitive sequences r01, r02, and r47 could generate three minor conformations consisting of four circular chromosomes. The mitogenome structures are highly diverse between S. officinalis and S. miltiorrhiza. We identified more than 400 RNA editing sites, including two that created stop codons. A phylogenomic analysis using mitogenome and plastome CDs resulted in an identical phylogenetic relationship, suggesting that the genomes of the mitochondria and plastid of Salvia species underwent a similar evolutionary process.

Supplementary Materials

The following supporting information can be downloaded at https://www.mdpi.com/article/10.3390/ijms24065372/s1.

Author Contributions

Conceptualization, C.L.; methodology, C.L., H.Y. and Y.N.; software, H.Y. and H.C.; validation, J.L.; formal analysis, H.Y., H.C. and Y.N.; investigation, Y.C.; resources, H.Y.; data curation, J.L. and Y.C.; writing—original draft preparation, H.Y. and C.L.; writing—review and editing, H.Y., J.W. and C.L.; visualization, H.Y. and Y.N.; supervision, J.W. and C.L.; project administration, J.W. and C.L.; funding acquisition, C.L. All authors have read and agreed to the published version of the manuscript.

Funding

This work was funded by the National Science Foundation Funds (81872966); the National Science & Technology Fundamental Resources Investigation Program of China (2018FY100705); the National Mega-Project for Innovative Drugs of China (2019ZX09735-002); and the Chinese Academy of Medical Sciences, the Innovation Funds for Medical Sciences (CIFMS) (2021-I2M-1-022). The funders were not involved in the study design, data collection or analysis, decision to publish, or manuscript preparation.

Institutional Review Board Statement

Not applicable.

Informed Consent Statement

Not applicable.

Data Availability Statement

The raw sequencing data from the Illumina and Nanopore platforms generated during this study are available in GenBank. The associated BioProject, BioSample, and SRA numbers are PRJNA908250, SAMN32033742, and SRR22727863 for the Illumina sequencing reads and SRR22728000 for the Nanopore sequencing reads. The mitogenome sequences were released into GenBank with the following accession numbers: OQ001564 and OQ001565. The plant samples are stored at the Herbarium of the Institute of Medicinal Plant Development, Beijing, China (voucher numbers: so-01-yhy).

Acknowledgments

We thank Ziyi Rong and Yanjuan Guan for helping prepare the RNA editing data and GrandOmics Biotechnology Co., Ltd. for their genomic sequencing service.

Conflicts of Interest

The authors declare no conflict of interest.

References

  1. Drew, B.; González-Gallegos, J.G.; Xiang, C.-L.; Kriebel, R.; Drummond, C.; Walker, J.; Sytsma, K. Salvia united: The greatest good for the greatest number. Taxon 2017, 66, 133–145. [Google Scholar] [CrossRef] [Green Version]
  2. Lopresti, A.L. Salvia (Sage): A Review of its Potential Cognitive-Enhancing and Protective Effects. Drugs R D 2017, 17, 53–64. [Google Scholar] [CrossRef] [Green Version]
  3. Russo, A.; Formisano, C.; Rigano, D.; Senatore, F.; Delfine, S.; Cardile, V.; Rosselli, S.; Bruno, M. Chemical composition and anticancer activity of essential oils of Mediterranean sage (Salvia officinalis L.) grown in different environmental conditions. Food Chem. Toxicol. 2013, 55, 42–47. [Google Scholar] [CrossRef]
  4. Durling, N.; Catchpole, O.; Grey, J.; Webby, R.; Mitchell, K.; Foo, L.; Perry, N. Extraction of phenolics and essential oil from dried sage (Salvia officinalis) using ethanol–water mixtures. Food Chem. 2007, 101, 1417–1424. [Google Scholar] [CrossRef]
  5. Ghorbani, A.; Esmaeilizadeh, M. Pharmacological properties of Salvia officinalis and its components. J. Tradit. Complement. Med. 2017, 7, 433–440. [Google Scholar] [CrossRef] [PubMed]
  6. Lu, Y.; Foo, L.Y. Antioxidant activities of polyphenols from sage (Salvia officinalis). Food chem. 2001, 75, 197–202. [Google Scholar] [CrossRef]
  7. Behradmanesh, S.; Derees, F.; Rafieian-Kopaei, M. Effect of Salvia officinalis on diabetic patients. J. Renal. Inj. Prev. 2013, 2, 51–54. [Google Scholar]
  8. Wang, M.; Li, J.; Rangarajan, M.; Shao, Y.; LaVoie, E.J.; Huang, T.-C.; Ho, C.-T. Antioxidative phenolic compounds from sage (Salvia officinalis). J. Agric. Food Chem. 1998, 46, 4869–4873. [Google Scholar] [CrossRef]
  9. Raal, A.; Orav, A.; Arak, E. Composition of the essential oil of Salvia officinalis L. from various European countries. Nat. Prod. Res. 2007, 21, 406–411. [Google Scholar] [CrossRef] [PubMed]
  10. Li, C.Y.; Yang, L.; Liu, Y.; Xu, Z.G.; Gao, J.; Huang, Y.B.; Xu, J.J.; Fan, H.; Kong, Y.; Wei, Y.K.; et al. The sage genome provides insight into the evolutionary dynamics of diterpene biosynthesis gene cluster in plants. Cell Rep. 2022, 40, 111236. [Google Scholar] [CrossRef] [PubMed]
  11. Ali, M.; Li, P.; She, G.; Chen, D.; Wan, X.; Zhao, J. Transcriptome and metabolite analyses reveal the complex metabolic genes involved in volatile terpenoid biosynthesis in garden sage (Salvia officinalis). Sci. Rep. 2017, 7, 16074. [Google Scholar] [CrossRef] [PubMed] [Green Version]
  12. Liang, C.; Wang, L.; Ma, W.; Xu, J. A comparative study of complete chloroplast genome for the genus salvia. J. Plant Biochem. Biotechnol. 2020, 30, 117–125. [Google Scholar] [CrossRef]
  13. Sarrou, E.; Ganopoulos, I.; Xanthopoulou, A.; Masuero, D.; Martens, S.; Madesis, P.; Mavromatis, A.; Chatzopoulou, P. Genetic diversity and metabolic profile of Salvia officinalis populations: Implications for advanced breeding strategies. Planta 2017, 246, 201–215. [Google Scholar] [CrossRef] [PubMed]
  14. Timmis, J.N.; Ayliffe, M.A.; Huang, C.Y.; Martin, W. Endosymbiotic gene transfer: Organelle genomes forge eukaryotic chromosomes. Nat. Rev. Genet. 2004, 5, 123–135. [Google Scholar] [CrossRef] [PubMed]
  15. Palmer, J.D. Contrasting modes and tempos of genome evolution in land plant organelles. Trends Genet. 1990, 6, 115–120. [Google Scholar] [CrossRef]
  16. Hollingsworth, P.M.; Graham, S.W.; Little, D.P. Choosing and using a plant DNA barcode. PLoS ONE 2011, 6, e19254. [Google Scholar] [CrossRef] [PubMed]
  17. Chen, R.; Jiang, L.Y.; Qiao, G.X. The effectiveness of three regions in mitochondrial genome for aphid DNA barcoding: A case in Lachininae. PLoS ONE 2012, 7, e46190. [Google Scholar] [CrossRef] [Green Version]
  18. Gray, M.W. Mitochondrial evolution. Cold Spring Harb Perspect Biol. 2012, 4, a011403. [Google Scholar] [CrossRef] [Green Version]
  19. Gray, M.W.; Burger, G.; Lang, B.F. Mitochondrial Evolution. Science 1999, 283, 1476–1481. [Google Scholar] [CrossRef] [Green Version]
  20. Green, B.R. Chloroplast genomes of photosynthetic eukaryotes. Plant J. 2011, 66, 34–44. [Google Scholar] [CrossRef]
  21. Smith, D.R.; Keeling, P.J. Mitochondrial and plastid genome architecture: Reoccurring themes, but significant differences at the extremes. Proc. Natl. Acad. Sci. USA 2015, 112, 10177–10184. [Google Scholar] [CrossRef] [Green Version]
  22. Wu, Z.Q.; Liao, X.Z.; Zhang, X.N.; Tembrock, L.R.; Broz, A. Genomic architectural variation of plant mitochondria—A review of multichromosomal structuring. J. Syst. Evol. 2020, 60, 160–168. [Google Scholar] [CrossRef]
  23. Sloan, D.B.; Alverson, A.J.; Chuckalovcak, J.P.; Wu, M.; McCauley, D.E.; Palmer, J.D.; Taylor, D.R. Rapid evolution of enormous, multichromosomal genomes in flowering plant mitochondria with exceptionally high mutation rates. PLoS Biol. 2012, 10, e1001241. [Google Scholar] [CrossRef] [Green Version]
  24. Skippington, E.; Barkman, T.J.; Rice, D.W.; Palmer, J.D. Miniaturized mitogenome of the parasitic plant Viscum scurruloideum is extremely divergent and dynamic and has lost all nad genes. Proc. Natl. Acad. Sci. USA 2015, 112, E3515–E3524. [Google Scholar] [CrossRef] [Green Version]
  25. Sloan, D.B. One ring to rule them all? Genome sequencing provides new insights into the ‘master circle’ model of plant mitochondrial DNA structure. New Phytol. 2013, 200, 978–985. [Google Scholar] [CrossRef] [PubMed]
  26. Wu, Z.; Cuthbert, J.M.; Taylor, D.R.; Sloan, D.B. The massive mitochondrial genome of the angiosperm Silene noctiflora is evolving by gain or loss of entire chromosomes. Proc. Natl. Acad. Sci. USA 2015, 112, 10185–10191. [Google Scholar] [CrossRef] [PubMed] [Green Version]
  27. Kozik, A.; Rowan, B.A.; Lavelle, D.; Berke, L.; Schranz, M.E.; Michelmore, R.W.; Christensen, A.C. The alternative reality of plant mitochondrial DNA: One ring does not rule them all. PLoS Genet. 2019, 15, e1008373. [Google Scholar] [CrossRef] [Green Version]
  28. Oldenburg, D.J.; Bendich, A.J. Size and structure of replicating mitochondrial DNA in cultured tobacco cells. Plant Cell 1996, 8, 447–461. [Google Scholar] [CrossRef]
  29. Backert, S.; Börner, T. Phage T4-like intermediates of DNA replication and recombination in the mitochondria of the higher plant Chenopodium album (L.). Curr. Genet. 2000, 37, 304–314. [Google Scholar] [CrossRef] [PubMed]
  30. He, W.; Xiang, K.; Chen, C.; Wang, J.; Wu, Z. Master graph: An essential integrated assembly model for the plant mitogenome based on a graph-based framework. Brief. Bioinform. 2023, 2, 24. [Google Scholar] [CrossRef]
  31. Alverson, A.J.; Rice, D.W.; Dickinson, S.; Barry, K.; Palmer, J.D. Origins and recombination of the bacterial-sized multichromosomal mitochondrial genome of cucumber. Plant Cell 2011, 23, 2499–2513. [Google Scholar] [CrossRef] [Green Version]
  32. Shirihai, O.S.; Alverson, A.J.; Zhuo, S.; Rice, D.W.; Sloan, D.B.; Palmer, J.D. The Mitochondrial Genome of the Legume Vigna radiata and the Analysis of Recombination across Short Mitochondrial Repeats. PLoS ONE 2011, 6, e16404. [Google Scholar]
  33. Cole, L.W.; Guo, W.; Mower, J.P.; Palmer, J.D. High and Variable Rates of Repeat-Mediated Mitochondrial Genome Rearrangement in a Genus of Plants. Mol. Biol. Evol. 2018, 35, 2773–2785. [Google Scholar] [CrossRef] [Green Version]
  34. Zhang, S.; Wang, J.; He, W.; Kan, S.; Liao, X.; Jordan, D.R.; Mace, E.S.; Tao, Y.; Cruickshank, A.W.; Klein, R.; et al. Variation in mitogenome structural conformation in wild and cultivated lineages of sorghum corresponds with domestication history and plastome evolution. BMC Plant Biol. 2023, 23, 91. [Google Scholar] [CrossRef]
  35. Oda, K.; Yamato, K.; Ohta, E.; Nakamura, Y.; Takemura, M.; Nozato, N.; Akashi, K.; Kanegae, T.; Ogura, Y.; Kohchi, T. Gene organization deduced from the complete sequence of liverwort Marchantia polymorpha mitochondrial DNA: A primitive form of plant mitochondrial genome. J. Mol. Biol. 1992, 223, 1–7. [Google Scholar] [CrossRef] [PubMed]
  36. Guo, W.; Mower, J.P. Evolution of plant mitochondrial intron-encoded maturases: Frequent lineage-specific loss and recurrent intracellular transfer to the nucleus. J. Mol. Evol. 2013, 77, 43–54. [Google Scholar] [CrossRef]
  37. Gerke, P.; Szovenyi, P.; Neubauer, A.; Lenz, H.; Gutmann, B.; McDowell, R.; Small, I.; Schallenberg-Rudinger, M.; Knoop, V. Towards a plant model for enigmatic U-to-C RNA editing: The organelle genomes, transcriptomes, editomes and candidate RNA editing factors in the hornwort Anthoceros agrestis. New Phytol. 2020, 225, 1974–1992. [Google Scholar] [CrossRef] [Green Version]
  38. Mower, J.P. Variation in protein gene and intron content among land plant mitogenomes. Mitochondrion 2020, 53, 203–213. [Google Scholar] [CrossRef]
  39. Adams, K.L.; Qiu, Y.-L.; Stoutemyer, M.; Palmer, J.D. Punctuated evolution of mitochondrial gene content: High and variable rates of mitochondrial gene loss and transfer to the nucleus during angiosperm evolution. Proc. Natl. Acad. Sci. USA 2002, 99, 9905–9912. [Google Scholar] [CrossRef] [PubMed] [Green Version]
  40. Adams, K. Evolution of mitochondrial gene content: Gene loss and transfer to the nucleus. Mol. Phylogenetics Evol. 2003, 29, 380–395. [Google Scholar] [CrossRef]
  41. Lukes, J.; Kaur, B.; Speijer, D. RNA Editing in Mitochondria and Plastids: Weird and Widespread. Trends Genet. 2021, 37, 99–102. [Google Scholar] [CrossRef] [PubMed]
  42. Hecht, J.; Grewe, F.; Knoop, V. Extreme RNA editing in coding islands and abundant microsatellites in repeat sequences of Selaginella moellendorffii mitochondria: The root of frequent plant mtDNA recombination in early tracheophytes. Genome Biol. Evol. 2011, 3, 344–358. [Google Scholar] [CrossRef] [Green Version]
  43. Wu, B.; Chen, H.; Shao, J.; Zhang, H.; Wu, K.; Liu, C. Identification of Symmetrical RNA Editing Events in the Mitochondria of Salvia miltiorrhiza by Strand-specific RNA Sequencing. Sci. Rep. 2017, 7, 1–11. [Google Scholar] [CrossRef] [Green Version]
  44. Zhao, F.; Drew, B.T.; Chen, Y.-P.; Hu, G.-X.; Li, B.; Xiang, C.-L. The Chloroplast Genome of Salvia: Genomic Characterization and Phylogenetic Analysis. Int. J. Plant Sci. 2020, 181, 812–830. [Google Scholar] [CrossRef]
  45. Du, Q.; Yang, H.; Zeng, J.; Chen, Z.; Zhou, J.; Sun, S.; Wang, B.; Liu, C. Comparative Genomics and Phylogenetic Analysis of the Chloroplast Genomes in Three Medicinal Salvia Species for Bioexploration. Int. J. Mol. Sci. 2022, 23, 12080. [Google Scholar] [CrossRef] [PubMed]
  46. Yang, H.; Chen, H.; Ni, Y.; Li, J.; Cai, Y.; Ma, B.; Yu, J.; Wang, J.; Liu, C. De Novo Hybrid Assembly of the Salvia miltiorrhiza Mitochondrial Genome Provides the First Evidence of the Multi-Chromosomal Mitochondrial DNA Structure of Salvia Species. Int. J. Mol. Sci. 2022, 23, 14267. [Google Scholar] [CrossRef]
  47. Kurtz, S.; Phillippy, A.; Delcher, A.L.; Smoot, M.; Shumway, M.; Antonescu, C.; Salzberg, S.L. Versatile and open software for comparing large genomes. Genome Biol. 2004, 5, R12. [Google Scholar] [CrossRef] [Green Version]
  48. Saldanha, R.; Mohr, G.; Belfort, M.; Lambowitz, A.M. Group I and group II introns. FASEB J.Off. Publ. Fed. Am. Soc. Exp. Biol. 1993, 7, 15–24. [Google Scholar] [CrossRef]
  49. Cech, T.R.; Damberger, S.H.; Gutell, R.R. Representation of the secondary and tertiary structure of group I introns. Nat. Struct. Biol. 1994, 1, 273–280. [Google Scholar] [CrossRef]
  50. Guo, W.; Zhu, A.; Fan, W.; Adams, R.P.; Mower, J.P. Extensive Shifts from Cis- to Trans-splicing of Gymnosperm Mitochondrial Introns. Mol. Biol. Evol. 2020, 37, 1615–1620. [Google Scholar] [CrossRef]
  51. Malek, O.; Knoop, V. Trans-splicing group II introns in plant mitochondria: The complete set of cis-arranged homologs in ferns, fern allies, and a hornwort. RNA 1998, 4, 1599–1609. [Google Scholar] [CrossRef] [Green Version]
  52. Dombrovska, O.; Qiu, Y.L. Distribution of introns in the mitochondrial gene nad1 in land plants: Phylogenetic and molecular evolutionary implications. Mol. Phylogenetics Evol. 2004, 32, 246–263. [Google Scholar] [CrossRef]
  53. Mower, J.P.; Sloan, D.B.; Alverson, A.J. Plant mitochondrial genome diversity: The genomics revolution. In Plant Genome Diversity Volume 1; Springer: Berlin, Germany, 2012; pp. 123–144. [Google Scholar]
  54. Mower, J.P.; Case, A.L.; Floro, E.R.; Willis, J.H. Evidence against equimolarity of large repeat arrangements and a predominant master circle structure of the mitochondrial genome from a monkeyflower (Mimulus guttatus) lineage with cryptic CMS. Genome Biol. Evol. 2012, 4, 670–686. [Google Scholar] [CrossRef] [Green Version]
  55. Guo, W.; Grewe, F.; Fan, W.; Young, G.J.; Knoop, V.; Palmer, J.D.; Mower, J.P. Ginkgo and Welwitschia Mitogenomes Reveal Extreme Contrasts in Gymnosperm Mitochondrial Evolution. Mol. Biol. Evol. 2016, 33, 1448–1460. [Google Scholar] [CrossRef] [Green Version]
  56. Beier, S.; Thiel, T.; Munch, T.; Scholz, U.; Mascher, M. MISA-web: A web server for microsatellite prediction. Bioinformatics 2017, 33, 2583–2585. [Google Scholar] [CrossRef] [Green Version]
  57. Ramsay, L.; Macaulay, M.; Degli Ivanissevich, S.; MacLean, K.; Cardle, L.; Fuller, J.; Edwards, K.J.; Tuvesson, S.; Morgante, M.; Massari, A.; et al. A simple sequence repeat-based linkage map of barley. Genetics 2000, 156, 1997–2005. [Google Scholar] [CrossRef]
  58. Gupta, P.K.; Rustgi, S.; Sharma, S.; Singh, R.; Kumar, N.; Balyan, H.S. Transferable EST-SSR markers for the study of polymorphism and genetic diversity in bread wheat. Mol. Genet. Genom. 2003, 270, 315–323. [Google Scholar] [CrossRef]
  59. Martin, P.; Makepeace, K.; Hill, S.A.; Hood, D.W.; Moxon, E.R. Microsatellite instability regulates transcription factor binding and gene expression. Proc. Natl. Acad. Sci. USA 2005, 102, 3800–3804. [Google Scholar] [CrossRef] [Green Version]
  60. Vinces, M.D.; Legendre, M.; Caldara, M.; Hagihara, M.; Verstrepen, K.J. Unstable tandem repeats in promoters confer transcriptional evolvability. Science 2009, 324, 1213–1216. [Google Scholar] [CrossRef] [Green Version]
  61. Wang, D.; Rousseau-Gueutin, M.; Timmis, J.N. Plastid Sequences Contribute to Some Plant Mitochondrial Genes. Mol. Biol. Evol. 2012, 29, 1707–1711. [Google Scholar] [CrossRef] [Green Version]
  62. Ronquist, F.; Teslenko, M.; Van Der Mark, P.; Ayres, D.L.; Darling, A.; Höhna, S.; Larget, B.; Liu, L.; Suchard, M.A.; Huelsenbeck, J.P. MrBayes 3.2: Efficient Bayesian phylogenetic inference and model choice across a large model space. Syst. Biol. 2012, 61, 539–542. [Google Scholar] [CrossRef] [Green Version]
  63. Mower, J.P.; Palmer, J.D. Patterns of partial RNA editing in mitochondrial genes of Beta vulgaris. Mol. Genet. Genom. 2006, 276, 285–293. [Google Scholar] [CrossRef] [PubMed]
  64. Abdelnoor, R.V.; Yule, R.; Elo, A.; Christensen, A.C.; Meyer-Gauen, G.; Mackenzie, S.A. Substoichiometric shifting in the plant mitochondrial genome is influenced by a gene homologous to MutS. Proc. Natl. Acad. Sci. USA 2003, 100, 5968–5973. [Google Scholar] [CrossRef] [Green Version]
  65. Terasawa, K.; Odahara, M.; Kabeya, Y.; Kikugawa, T.; Sekine, Y.; Fujiwara, M.; Sato, N. The mitochondrial genome of the moss Physcomitrella patens sheds new light on mitochondrial evolution in land plants. Mol. Biol. Evol. 2007, 24, 699–709. [Google Scholar] [CrossRef] [PubMed] [Green Version]
  66. Sanchez-Puerta, M.V.; Cho, Y.; Mower, J.P.; Alverson, A.J.; Palmer, J.D. Frequent, phylogenetically local horizontal transfer of the cox1 group I Intron in flowering plant mitochondria. Mol. Biol. Evol. 2008, 25, 1762–1777. [Google Scholar] [CrossRef] [Green Version]
  67. Cusimano, N.; Zhang, L.B.; Renner, S.S. Reevaluation of the cox1 group I intron in Araceae and angiosperms indicates a history dominated by loss rather than horizontal transfer. Mol. Biol. Evol. 2008, 25, 265–276. [Google Scholar] [CrossRef]
  68. Palmer, J.D. Mitochondrial DNA in plant systematics: Applications and limitations. In Molecular Systematics of Plants; Springer: Berlin, Germany, 1992; pp. 36–49. [Google Scholar]
  69. Li, J.; Xu, Y.; Shan, Y.; Pei, X.; Yong, S.; Liu, C.; Yu, J. Assembly of the complete mitochondrial genome of an endemic plant, Scutellaria tsinyunensis, revealed the existence of two conformations generated by a repeat-mediated recombination. Planta 2021, 254, 1–16. [Google Scholar] [CrossRef]
  70. Notsu, Y.; Masood, S.; Nishikawa, T.; Kubo, N.; Akiduki, G.; Nakazono, M.; Hirai, A.; Kadowaki, K. The complete sequence of the rice (Oryza sativa L.) mitochondrial genome: Frequent DNA sequence acquisition and loss during the evolution of flowering plants. Mol. Genet. Genom. 2002, 268, 434–445. [Google Scholar] [CrossRef]
  71. Steinhauser, S.; Beckert, S.; Capesius, I.; Malek, O.; Knoop, V. Plant mitochondrial RNA editing. J. Mol. Evol. 1999, 48, 303–312. [Google Scholar] [CrossRef]
  72. Chaw, S.M.; Shih, A.C.; Wang, D.; Wu, Y.W.; Liu, S.M.; Chou, T.Y. The mitochondrial genome of the gymnosperm Cycas taitungensis contains a novel family of short interspersed elements, Bpu sequences, and abundant RNA editing sites. Mol. Biol. Evol. 2008, 25, 603–615. [Google Scholar] [CrossRef] [Green Version]
  73. Handa, H. The complete nucleotide sequence and RNA editing content of the mitochondrial genome of rapeseed (Brassica napus L.): Comparative analysis of the mitochondrial genomes of rapeseed and Arabidopsis thaliana. Nucleic Acids Res. 2003, 31, 5907–5916. [Google Scholar] [CrossRef] [Green Version]
  74. Wick, R.R.; Judd, L.M.; Gorrie, C.L.; Holt, K.E. Unicycler: Resolving bacterial genome assemblies from short and long sequencing reads. PLoS Comput. Biol. 2017, 13, e1005595. [Google Scholar] [CrossRef] [Green Version]
  75. Li, H.; Durbin, R. Fast and accurate short read alignment with Burrows-Wheeler transform. Bioinformatics 2009, 25, 1754–1760. [Google Scholar] [CrossRef] [Green Version]
  76. Li, H.; Handsaker, B.; Wysoker, A.; Fennell, T.; Ruan, J.; Homer, N.; Marth, G.; Abecasis, G.; Durbin, R.; Genome Project Data Processing, S. The Sequence Alignment/Map format and SAMtools. Bioinformatics 2009, 25, 2078–2079. [Google Scholar] [CrossRef] [Green Version]
  77. Lee, E.; Harris, N.; Gibson, M.; Chetty, R.; Lewis, S. Apollo: A community resource for genome annotation editing. Bioinformatics 2009, 25, 1836–1837. [Google Scholar] [CrossRef] [Green Version]
  78. Zhong, Y.; Yu, R.; Chen, J.; Liu, Y.; Zhou, R. Highly active repeat-mediated recombination in the mitogenome of the holoparasitic plant Aeginetia indica. Front. Plant Sci. 2022, 13, 988368. [Google Scholar] [CrossRef]
  79. Hao, Z.; Lv, D.; Ge, Y.; Shi, J.; Weijers, D.; Yu, G.; Chen, J. RIdeogram: Drawing SVG graphics to visualize and map genome-wide data on the idiograms. PeerJ Comput. Sci. 2020, 6, e251. [Google Scholar] [CrossRef] [Green Version]
  80. Ye, J.; Coulouris, G.; Zaretskaya, I.; Cutcutache, I.; Rozen, S.; Madden, T.L. Primer-BLAST: A tool to design target-specific primers for polymerase chain reaction. BMC Bioinform. 2012, 13, 1–11. [Google Scholar] [CrossRef] [Green Version]
  81. Benson, G. Tandem repeats finder: A program to analyze DNA sequences. Nucleic Acids Res. 1999, 27, 573–580. [Google Scholar] [CrossRef] [Green Version]
  82. Chen, C.; Chen, H.; Zhang, Y.; Thomas, H.R.; Frank, M.H.; He, Y.; Xia, R. TBtools: An Integrative Toolkit Developed for Interactive Analyses of Big Biological Data. Mol. Plant 2020, 13, 1194–1202. [Google Scholar] [CrossRef]
  83. Li, H. Aligning sequence reads, clone sequences and assembly contigs with BWA-MEM. arXiv 2013, arXiv:1303.3997. [Google Scholar]
  84. Milne, I.; Bayer, M.; Cardle, L.; Shaw, P.; Stephen, G.; Wright, F.; Marshall, D. Tablet--next generation sequence assembly visualization. Bioinformatics 2010, 26, 401–402. [Google Scholar] [CrossRef] [PubMed] [Green Version]
  85. Zhang, D.; Gao, F.; Jakovlić, I.; Zou, H.; Zhang, J.; Li, W.X.; Wang, G.T. PhyloSuite: An integrated and scalable desktop platform for streamlined molecular sequence data management and evolutionary phylogenetics studies. Mol. Ecol. Resour. 2020, 20, 348–355. [Google Scholar] [CrossRef]
  86. Katoh, K.; Rozewicki, J.; Yamada, K.D. MAFFT online service: Multiple sequence alignment, interactive sequence choice and visualization. Brief. Bioinform. 2019, 20, 1160–1166. [Google Scholar] [CrossRef] [PubMed] [Green Version]
  87. Stamatakis, A. RAxML version 8: A tool for phylogenetic analysis and post-analysis of large phylogenies. Bioinformatics 2014, 30, 1312–1313. [Google Scholar] [CrossRef] [PubMed] [Green Version]
  88. Darriba, D.; Taboada, G.L.; Doallo, R.; Posada, D. jModelTest 2: More models, new heuristics and parallel computing. Nat. Methods 2012, 9, 772. [Google Scholar] [CrossRef] [Green Version]
  89. Kim, D.; Langmead, B.; Salzberg, S.L. HISAT: A fast spliced aligner with low memory requirements. Nat. Methods 2015, 12, 357–360. [Google Scholar] [CrossRef] [Green Version]
  90. Yu, R.; Sun, C.; Zhong, Y.; Liu, Y.; Sanchez-Puerta, M.V.; Mower, J.P.; Zhou, R. The minicircular and extremely heteroplasmic mitogenome of the holoparasitic plant Rhopalocnemis phalloides. Curr. Biol. 2021, 32, 470–479. [Google Scholar] [CrossRef]
  91. Picardi, E.; Pesole, G. REDItools: High-throughput RNA editing detection made easy. Bioinformatics 2013, 29, 1813–1814. [Google Scholar] [CrossRef] [Green Version]
Figure 1. Photographs of the aerial parts of S. officinalis. The images were photographed by Dr. Xinlei Zhao from the Institute of Medicinal Plant Development, Chinese Academy of Medical Sciences, Beijing, China, and are used in this study with permission. (A) The entire plant; (B) the leaves; (C) the flowers; and (D) the fruits and seeds.
Ijms 24 05372 g001
Figure 2. Schematic representation of the assembly steps of S. officinalis mitogenome. (A) Unitig graph of the S. officinalis mitogenome obtained from de novo assembly of Illumina reads with GetOrganelle. The unitig graph contained six contigs (blue and purple) that formed DBSs (DBS01–03, highlighted in the red circles). Each DBS has four conformations (c1, c2, c3, and c4), as shown in the top left corner, with DBS02 as an example. (B) The mitogenomic chromosomes MC1 (light blue circle) and MC2 (dark blue circle) of S. officinalis after the DBSs shown in (A) were resolved using Unicycler software.
Ijms 24 05372 g002
Figure 3. Syntenic analysis of the mitogenome sequences of S. officinalis and S. miltiorrhiza. The chromosomes of S. officinalis and S. miltiorrhiza are shown with green and orange blocks, respectively. DNA fragments having a similarity > 85% were connected with gray lines.
Ijms 24 05372 g003
Figure 4. Schematic of the circular MC1 (A) and MC2 (B) of S. officinalis. The graph was drawn using PMGView (http://www.1kmpg.cn/pmgview (accessed on 28 October 2022)). Genes shown on the inside were on the negative strand, and those on the outside were on the positive strand. Genes with introns were highlighted using “*”. The colors indicate different functional categories. The locations of the three repetitive sequences (r01, r02, and r47) that could mediate homologous recombination in the S. officinalis mitogenome are highlighted inside the circles. The two repeat units of r01 and r02 are on chromosome 1 and are connected with arcs. In contrast, the two repeat units of r47 are distributed on chromosome 1 and 2.
Ijms 24 05372 g004
Figure 6. PCR verification of recombination products associated with the repetitive sequences on MC1 and MC2. (A) Schematic representation of the four conformations (c1–c4) associated with each repetitive sequence. The regions corresponding to the primers are shown as red blocks. f1 and f2: forward primers. r1 and r2: reverse primers. (B) Electrophoretic gel plot of PCR products amplified with various combinations of forward and reverse primers to amplify the DNA molecules corresponding to conformations c1–c4. The name of the repetitive sequence, combinations of forward and reverse primers, expected conformation to be amplified, and lane numbers are shown above the gel plot. The expected size of each PCR product includes the length of the repetitive sequence and the length of its 5′ and 3′ flanking regions (200–1000 bp). We used the length of the PCR products as a rough assessment of the successful amplification of the fragments representing the recombination products.
Ijms 24 05372 g006
Figure 7. Products of homologous recombination mediated by one (A), two (B), and three (C) of the repetitive sequences r01, r02, and r47. The repeat units of r01, r02, and r47 are represented by arrows. The two repeat units are connected with arcs if they are on the same chromosome. Sequences around the repeat units are shown in different colors. The circles represent circular chromosomes. The genomic conformation is named “c” followed by the conformation number. In contrast, the circular chromosomes of a particular genomic conformation are named “c” followed by the conformation number, “-”, and the chromosome number. The double-headed arrows indicated the source circular chromosomes, the repetitive elements, and the product circular chromosomes, separated with “/”. The circular chromosomes before and after the recombination are shown with the same type of squares: solid or dashed. The genomic conformation name is prefixed with “Ma”, representing “major” if it is the most abundant conformation. Otherwise, the genomic conformation name is prefixed with “Mi”, representing “minor”. Mac1 is the genomic conformation containing chromosomes MC1 (Mac1-1) and MC2 (Mac1-2). (Panel A) Mac1-1 can undergo recombination mediated by r01 to form a circular chromosome Mic1-1. Similarly, Mac1-1 can undergo recombination mediated by r02 to form two circular chromosomes: Mic2-1 and Mic2-2. Mac1-1 and Mac1-2 can undergo recombination mediated by r47 to form Mic3-1. Mic3 only contains one circular chromosome Mic3-1. (Panel B) Mac1 can undergo recombinations mediated by two of the three repetitive sequences r01, r02, and r47 to form genomic conformations Mic4 to Mic6. (Panel C) Lastly, Mac1 can form Mic7 through recombinations mediated by r01, r02, and r47 together. Please note that we consider the Mac1 as the source conformation. Only newly formed circular chromosomes are shown for each newly formed genome conformation. By definition, it should also contain the circular chromosome in the source conformation that does not undergo recombination.
Ijms 24 05372 g007
Figure 8. Molecular phylogenetic analysis of Salvia officinalis and its 10 close Lamiales relatives and two non-Lamiales species based on mitogenomes (A) and plastomes (B). The tree was constructed using concatenated conserved protein sequences from the mitogenomes of 11 Lamiales and 2 non-Lamiales species via the ML and BI methods. The bootstrap score was obtained by employing 1000 replicates. The ML bootstrap support values and BI posterior probabilities were labeled at the corresponding nodes. Two species from Solanaceae (Nicotiana tabacum and Solanum lycopersicum) were used as outgroups. The mitogenome assembled in this study was labeled with an asterisk.
Ijms 24 05372 g008
Figure 9. Validation of three predicted RNA editing sites (rpl5-509, rpl5-512, and rpl5-529) using PCR and Sanger sequencing. The top panel shows the sequences and chromatographs from the PCR products amplified using gDNA as the template. The bottom panel shows the sequences and chromatographs from the PCR products amplified using the cDNA. The gene names and the RNA editing sites’ positions are shown at the top of the figure, separated with “-”. The red squares highlight the focal RNA editing site. rpl5-529 created a new stop codon upstream from the stop codon found in the genomic sequence.
Ijms 24 05372 g009
Table 1. Mapping results for Nanopore long reads to the four possible conformations associated with three DBS (DBS01–03), which correspond to high-scoring sequence pairs (HSPs) r01, r02, and r47 described in Section 2.3. DBS: double-bifurcation structure. MC1/2: mitogenome chromosome 1/2. The percentage of minor DBS conformations was calculated as the number of reads mapped to the conformations having fewer mapped reads divided by those mapped to all conformations. a Validated successfully with PCR; b all positions are based on MC1, except those marked with MC2.
The ID of the HSPThe ID of the DBS aIdentity (%)Alignment LengthNo. of MismatchesNo. of Gap OpeningsPositions of Repeat Copy 1 bPositions of Repeat
Copy 2
E-ValueTypeNumber of Long Reads Mapped to Each DBS ConformationPercentage of Minor DBS Conformation (%)
StartEndStartEndc1c2c3c4
r01 aDBS0110022700230,814231,04047,10146,8752.46 × 10−116Inverted2333418.93%
r02 aDBS0210020000137,561137,76085,30685,5052.52 × 10−101Direct14263315.00%
R47 aDBS031008920066,04266,93325,340
(MC2)
24,449
(MC2)
0Direct10193320.69%
Table 2. Gene contents in the mitogenome of S. officinalis.
Group of GenesName of Genes
Core genesATP synthaseatp1, atp4, atp6 *, atp8, atp9
Cytochrome c biogenesisccmB, ccmC, ccmFc a, ccmFn
Ubichinol cytochrome c reductasecob
Cytochrome c oxidasecox1 a, cox2 a, cox3
MaturasesmatR
Transport membrane proteinmttB
NADH dehydrogenasenad1 c, nad2 c, nad3, nad4 b, nad4L, nad5 c, nad6, nad7 b, nad9
Variable genesRibosomal protein large subunitrpl5, rpl10, rpl16
Ribosomal protein small subunitrps3 a, rps4, rps10 a, rps12, rps13, rps14
rRNA genesRibosomal RNArrn5, rrn18, rrn26
tRNA genesTransfer RNAtrnC-GCA, trnD-GUC, trnE-UUC, trnF-GAA, trnG-GCC, trnH-GUG, trnI-CAU, trnK-UUU, trnM-CAU, trnN-GUU, trnP-UGG, trnP-UGG, trnQ-UUG, trnS-UGA, trnS-GCU, trnW-CCA, trnY-GUA
a”, “b”, and “c”: genes with two, four, and five exons, respectively. “*”: genes with two copies.
Disclaimer/Publisher’s Note: The statements, opinions and data contained in all publications are solely those of the individual author(s) and contributor(s) and not of MDPI and/or the editor(s). MDPI and/or the editor(s) disclaim responsibility for any injury to people or property resulting from any ideas, methods, instructions or products referred to in the content.

