
Evaluating the Transition from Targeted to Exome Sequencing: A Guide for Clinical Laboratories

 , , ,
, , ,
Abstract
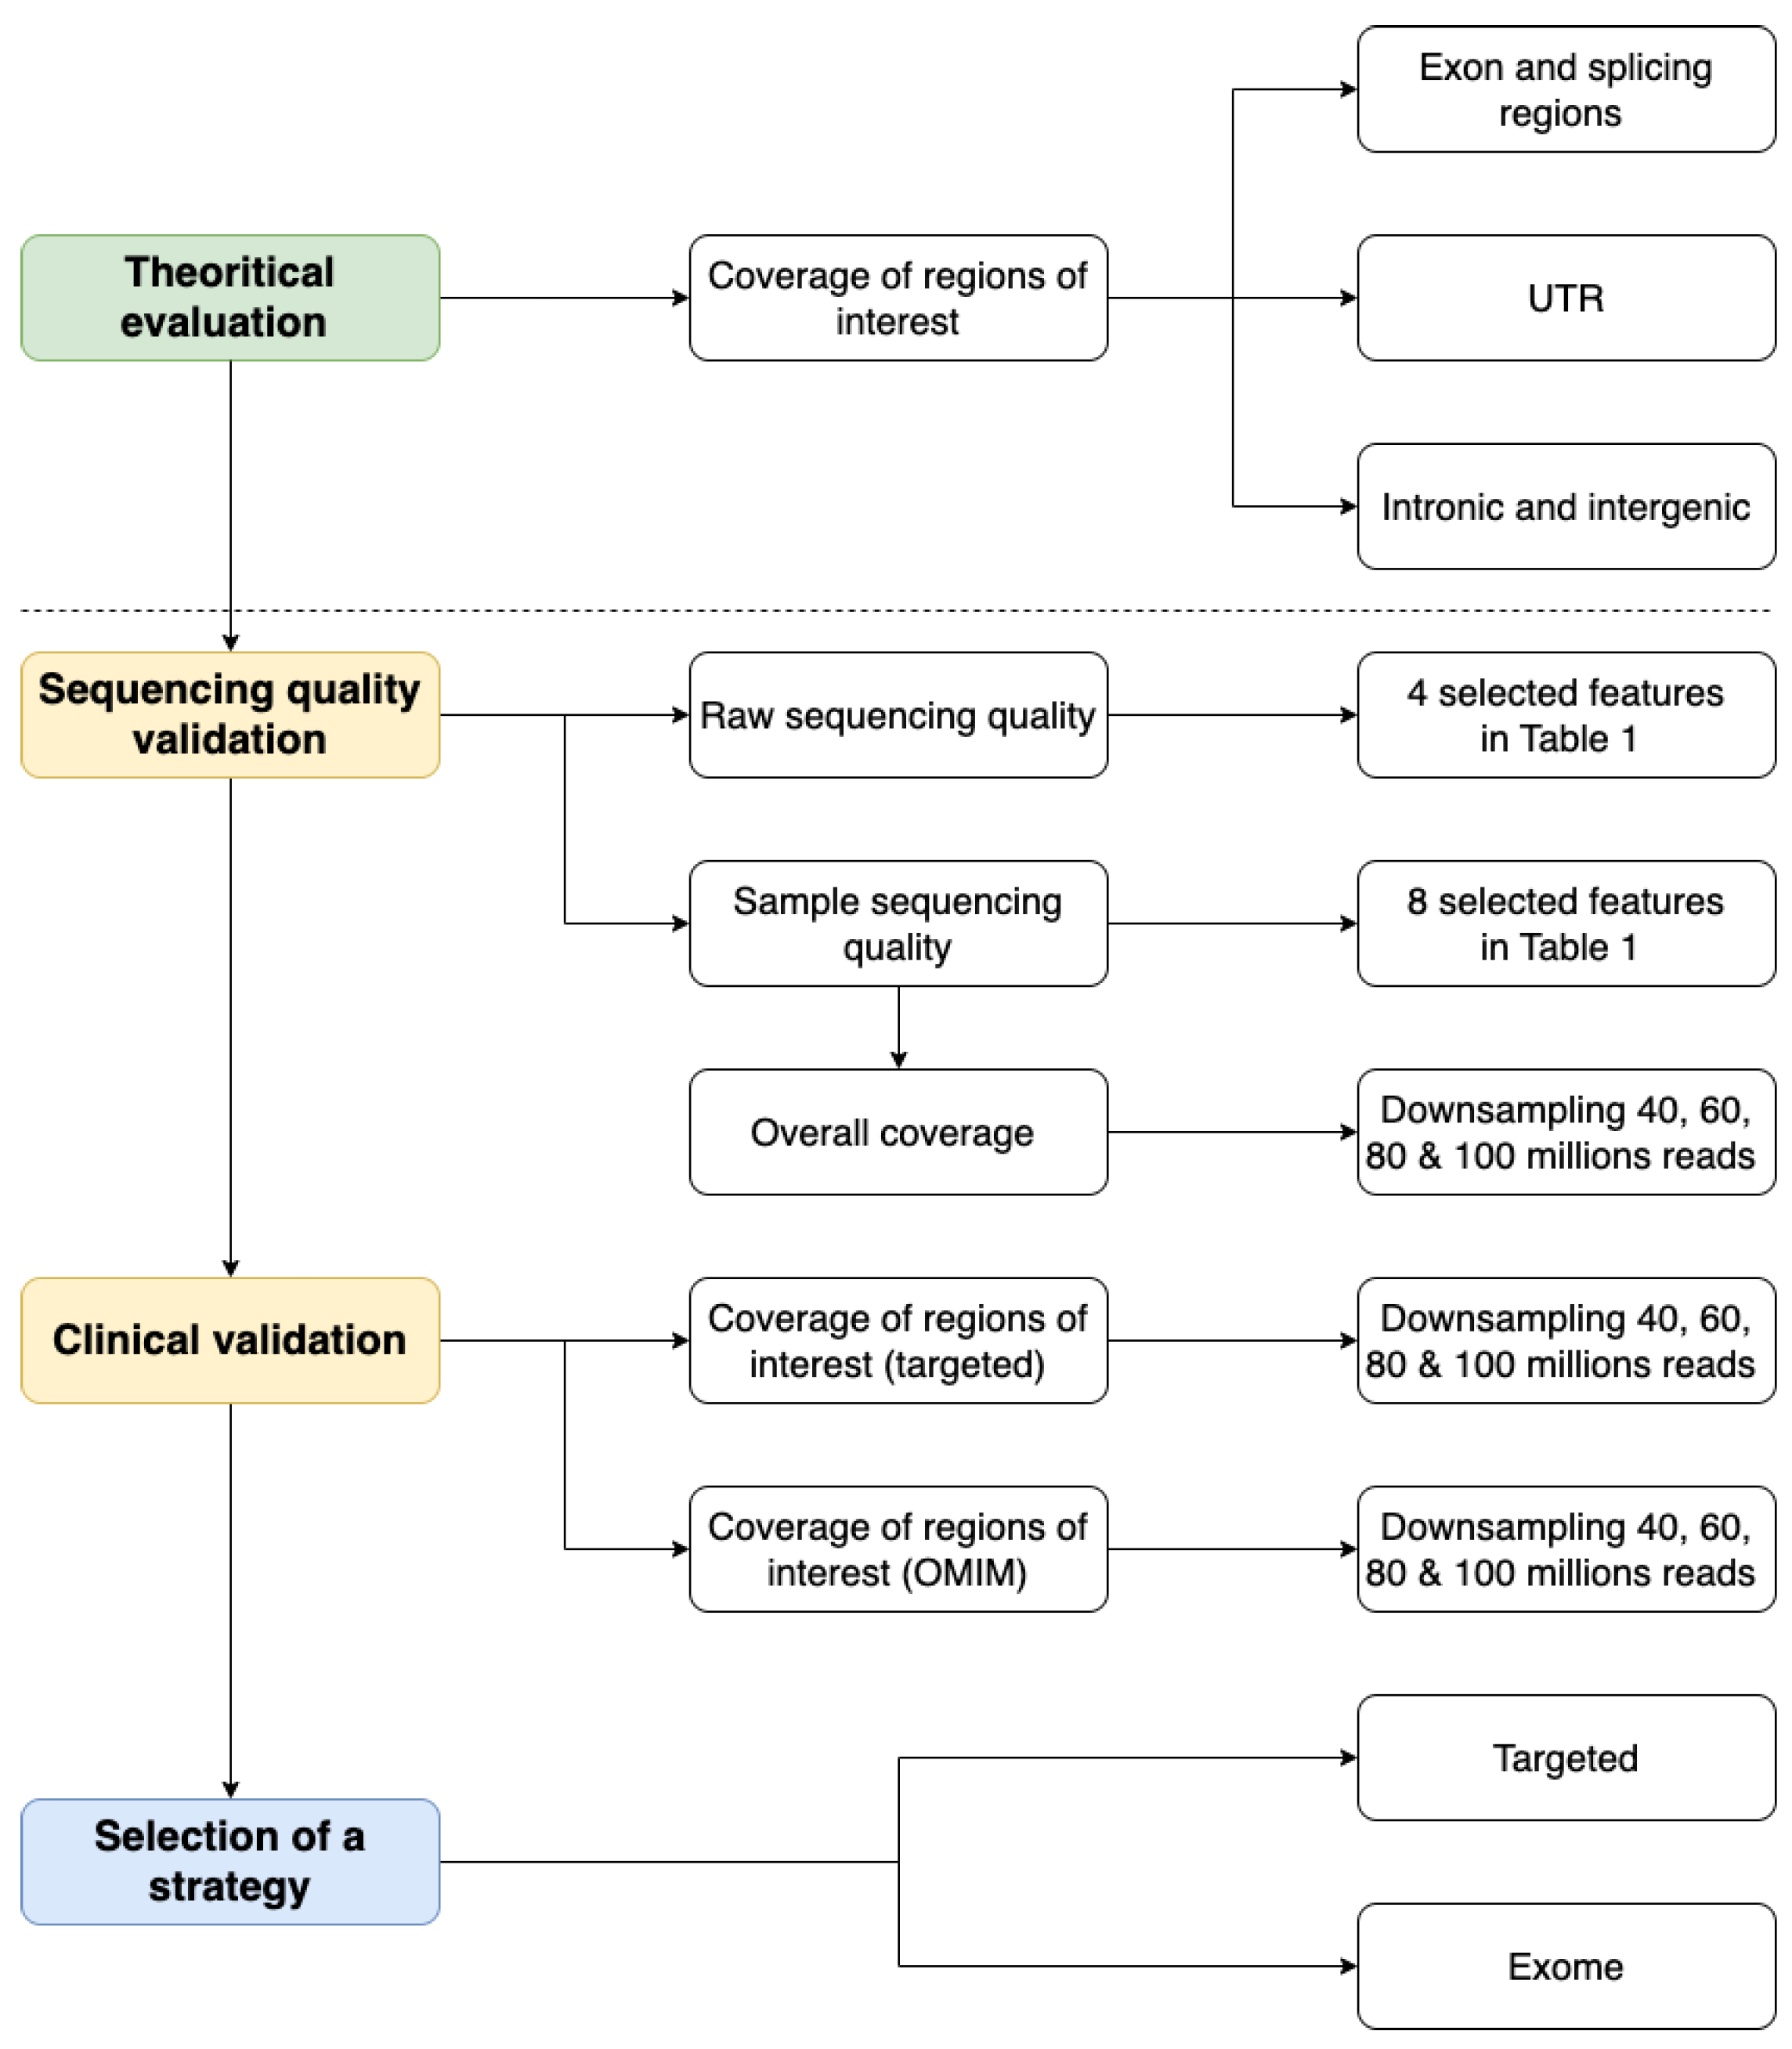
:1. Introduction
2. Results
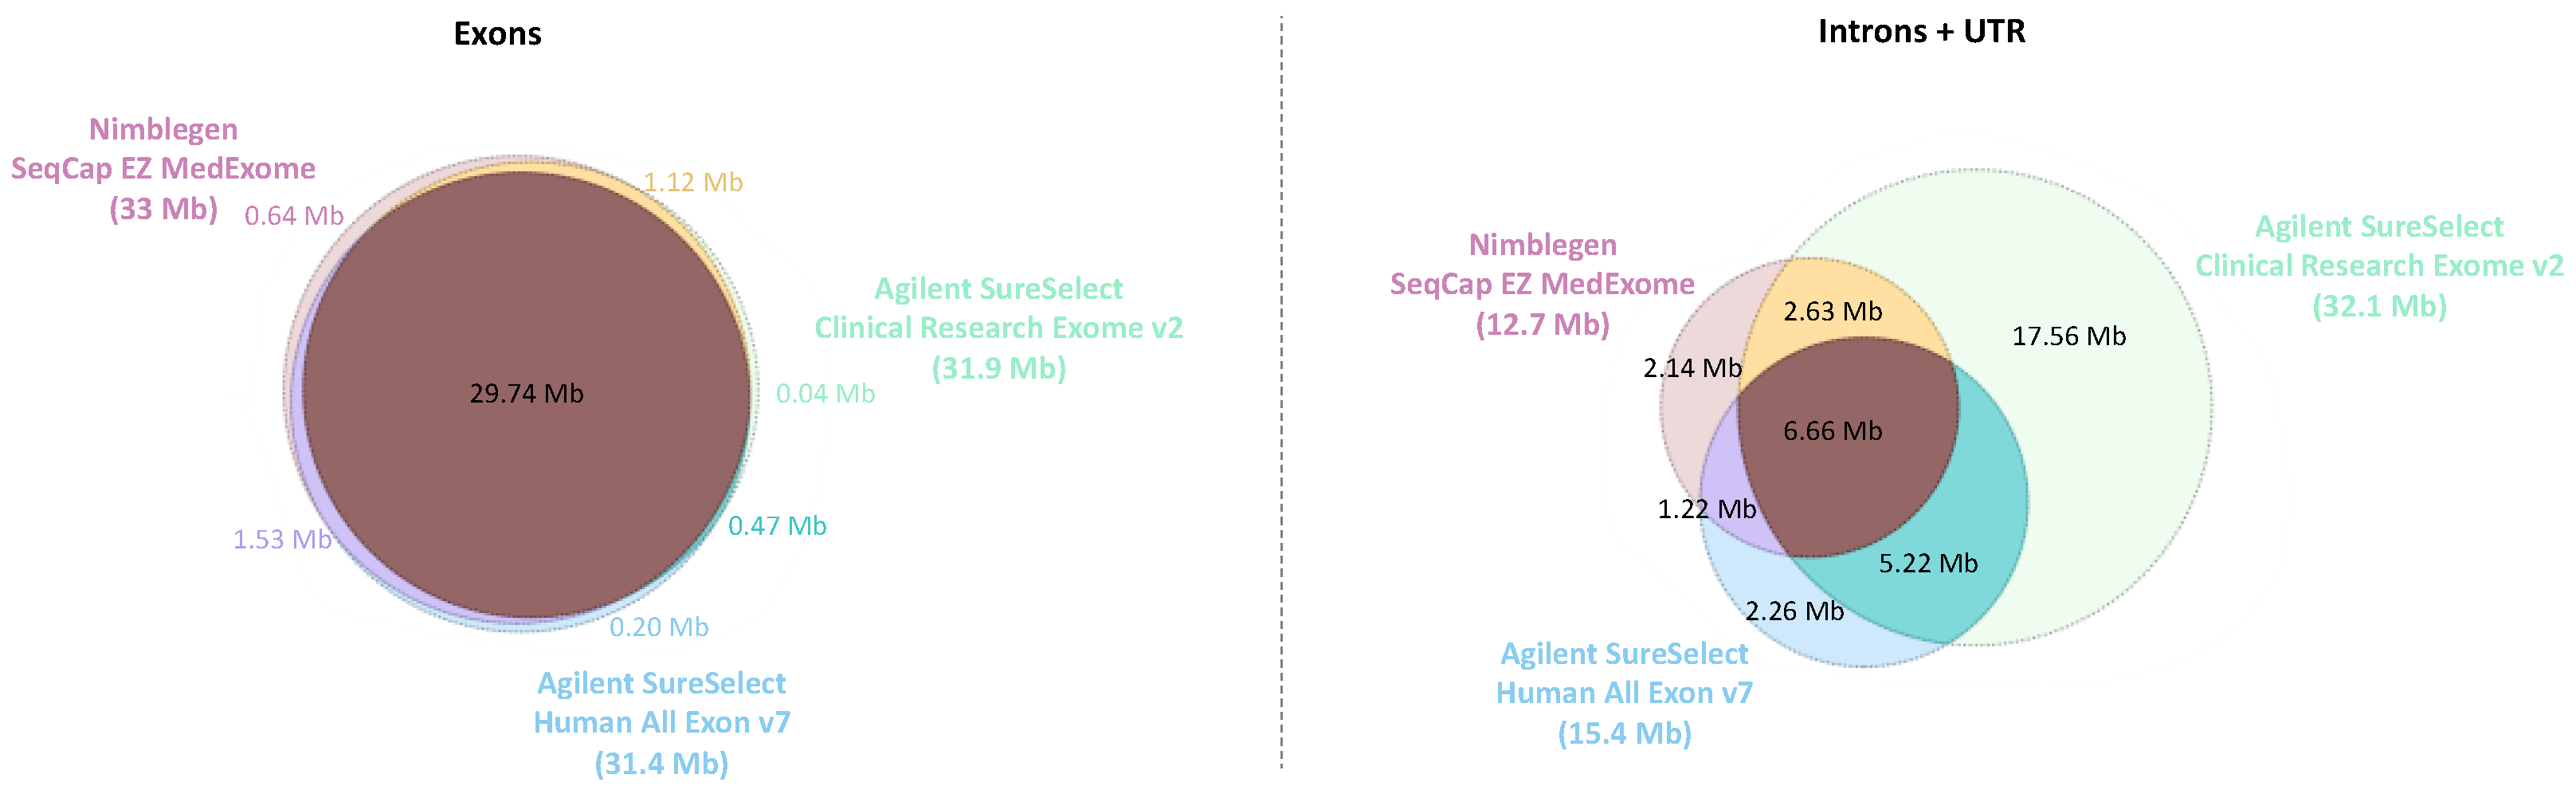
2.1. Theoretical Evaluation of Regions of Interest Coverage
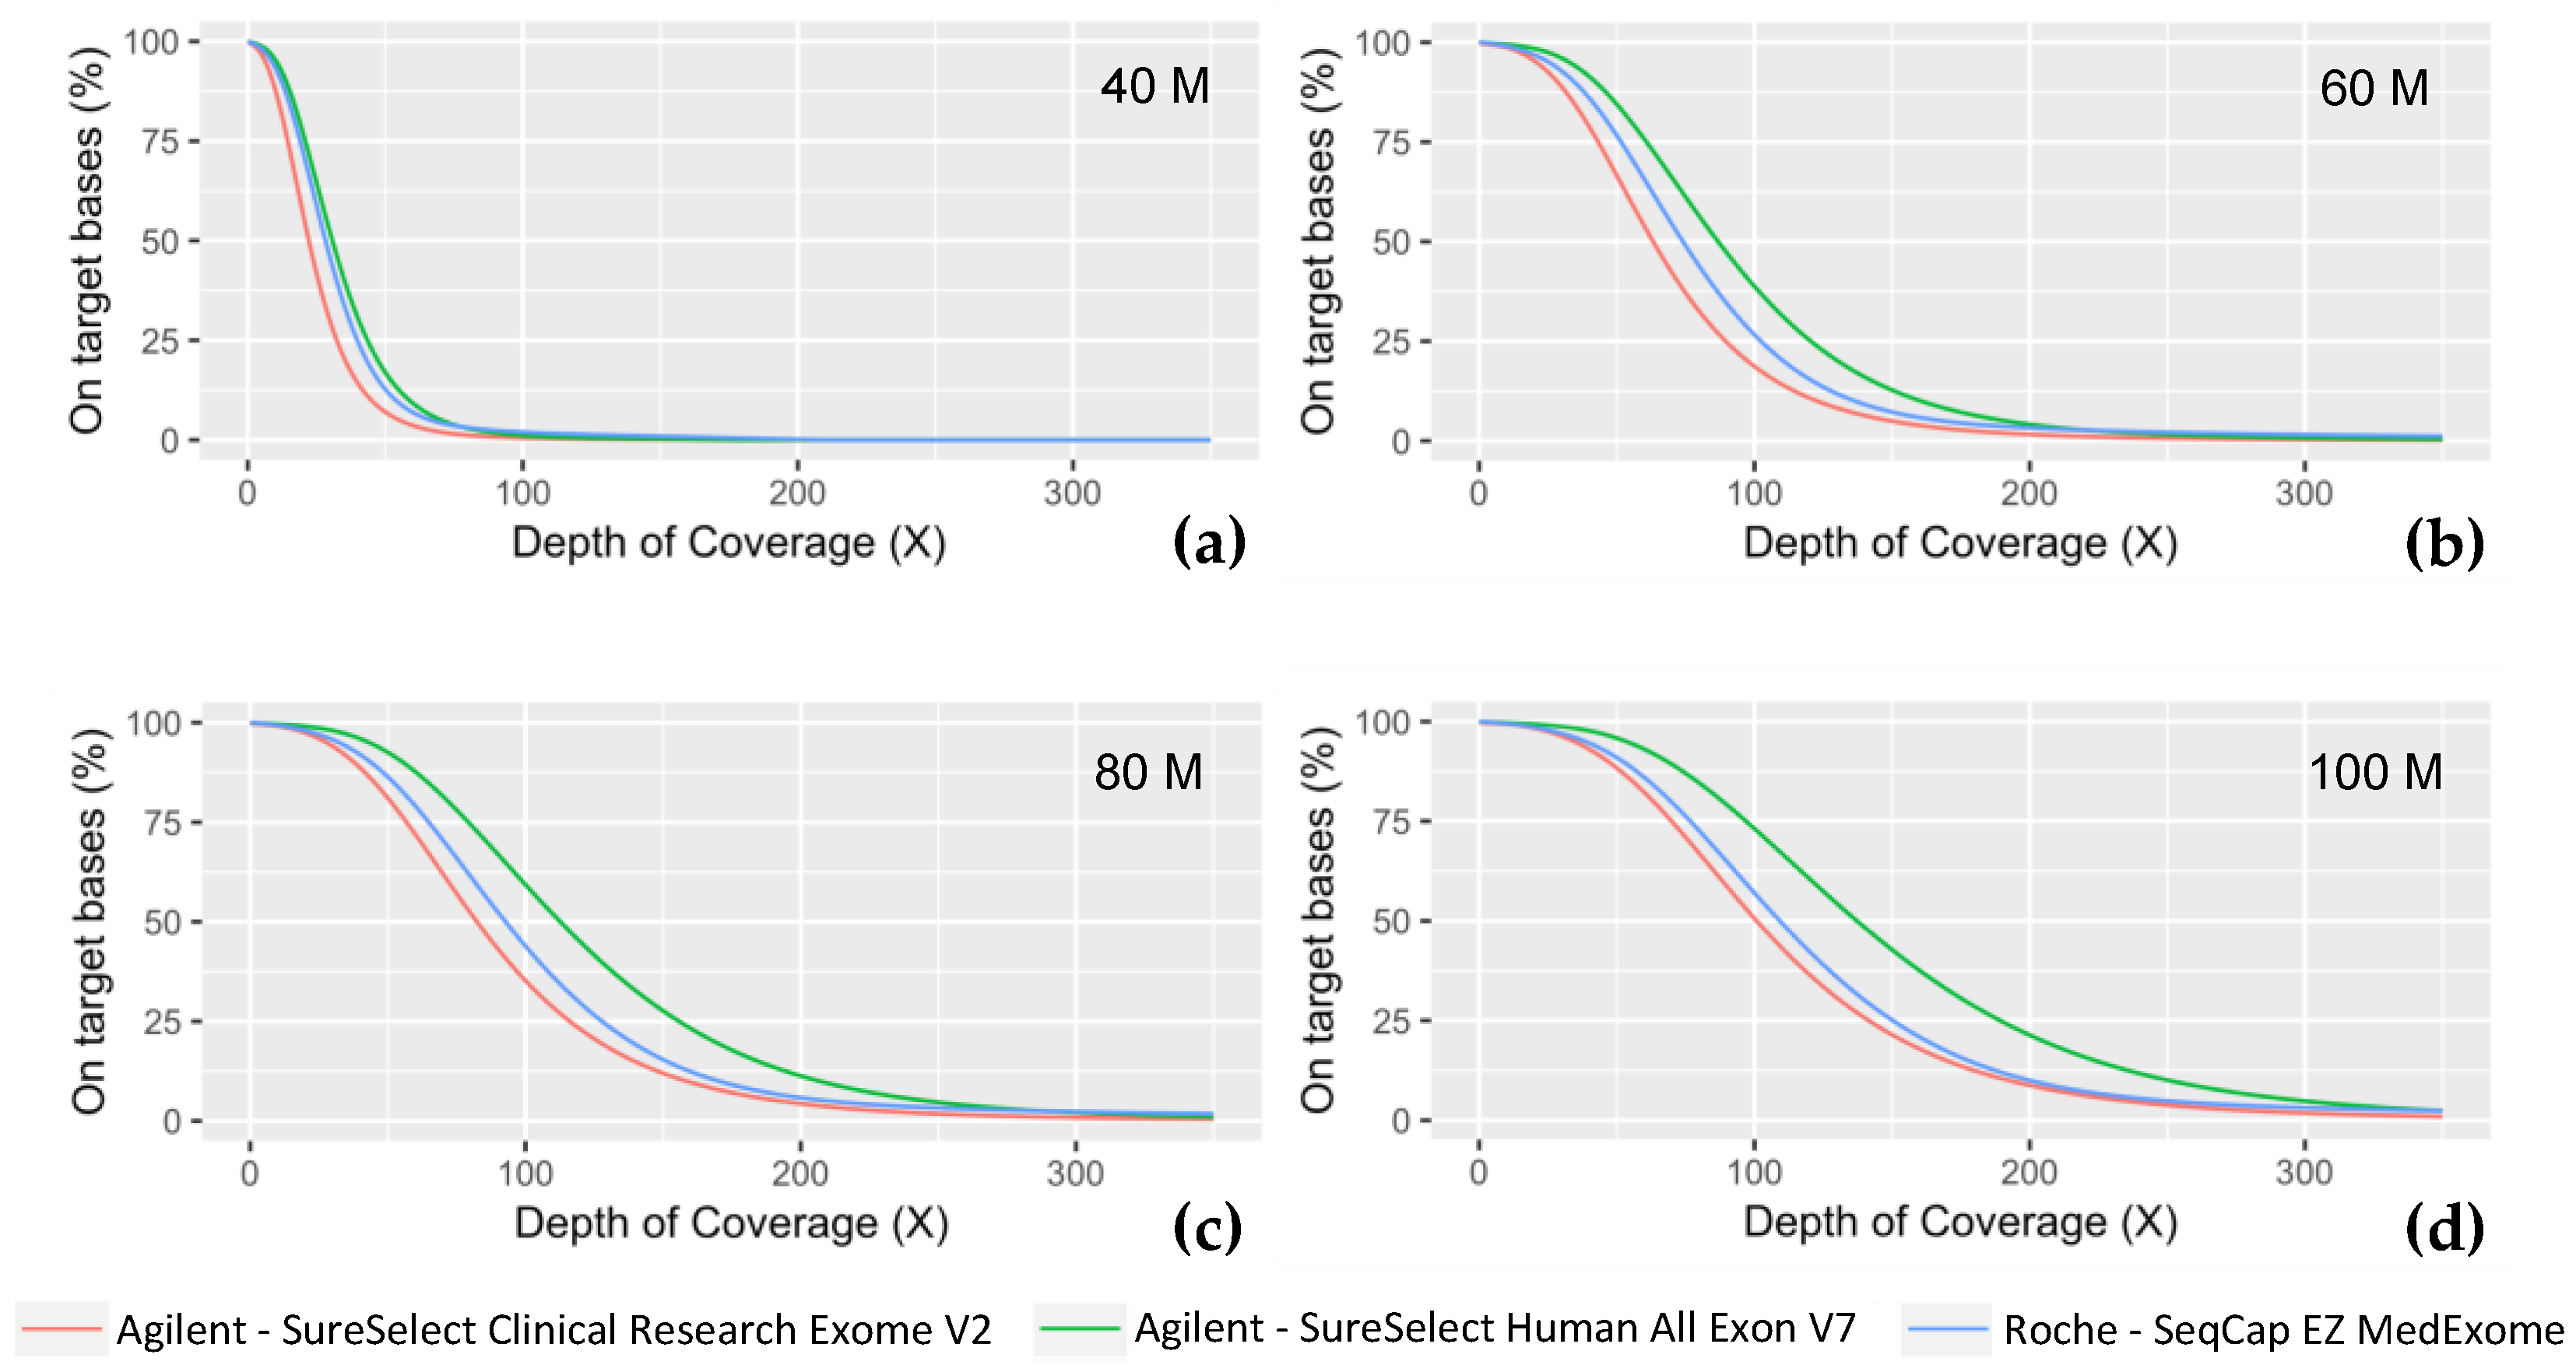
2.2. Sequencing Quality Validation
2.3. Clinical Validation
2.4. Final Selection of a Strategy
3. Discussion
4. Materials and Methods
4.1. NGS Experiments
4.2. NGS Data Analyses
4.2.1. Data Processing
4.2.2. Theoretical Evaluation of Regions of Interest Coverage
4.2.3. Sequencing Quality Validation
4.2.4. Clinical Validation: Coverage of Targeted Regions
Supplementary Materials
Author Contributions
Funding
Institutional Review Board Statement
Informed Consent Statement
Data Availability Statement
Acknowledgments
Conflicts of Interest
References
- Adams, D.R.; Eng, C.M. Next-Generation Sequencing to Diagnose Suspected Genetic Disorders. N. Engl. J. Med. 2018, 379, 1353–1362. [Google Scholar] [CrossRef] [PubMed]
- Vinkšel, M.; Writzl, K.; Maver, A.; Peterlin, B. Improving Diagnostics of Rare Genetic Diseases with NGS Approaches. J. Community Genet. 2021, 12, 247–256. [Google Scholar] [CrossRef] [PubMed]
- Zenagui, R.; Lacourt, D.; Pegeot, H.; Yauy, K.; Morales, R.J.; Theze, C.; Rivier, F.; Cances, C.; Sole, G.; Renard, D.; et al. A Reliable Targeted Next-Generation Sequencing Strategy for Diagnosis of Myopathies and Muscular Dystrophies, Especially for the Giant Titin and Nebulin Genes. J. Mol. Diagn. 2018, 20, 533–549. [Google Scholar] [CrossRef]
- Stosser, M.B.; Lindy, A.S.; Butler, E.; Retterer, K.; Piccirillo-Stosser, C.M.; Richard, G.; McKnight, D.A. High Frequency of Mosaic Pathogenic Variants in Genes Causing Epilepsy-Related Neurodevelopmental Disorders. Genet. Med. 2018, 20, 403–410. [Google Scholar] [CrossRef] [PubMed]
- Schwarze, K.; Buchanan, J.; Taylor, J.C.; Wordsworth, S. Are Whole-Exome and Whole-Genome Sequencing Approaches Cost-Effective? A Systematic Review of the Literature. Genet. Med. 2018, 20, 1122–1130. [Google Scholar] [CrossRef] [PubMed]
- Wright, C.F.; FitzPatrick, D.R.; Firth, H.V. Paediatric Genomics: Diagnosing Rare Disease in Children. Nat. Rev. Genet. 2018, 19, 253–268. [Google Scholar] [CrossRef] [PubMed]
- Qin, L.; Nie, Y.; Zhang, H.; Chen, L.; Zhang, D.; Lin, Y.; Ru, K. Identification of New Mutations in Patients with Hereditary Spherocytosis by Next-Generation Sequencing. J. Hum. Genet. 2020, 65, 427–434. [Google Scholar] [CrossRef]
- Dollfus, H. Le plan France Médecine Génomique 2025 et les maladies rares. Med. Sci. 2018, 34, 39–41. [Google Scholar] [CrossRef] [PubMed]
- Thiffault, I.; Farrow, E.; Zellmer, L.; Berrios, C.; Miller, N.; Gibson, M.; Caylor, R.; Jenkins, J.; Faller, D.; Soden, S.; et al. Clinical Genome Sequencing in an Unbiased Pediatric Cohort. Genet. Med. 2019, 21, 303–310. [Google Scholar] [CrossRef]
- Xue, Y.; Ankala, A.; Wilcox, W.R.; Hegde, M.R. Solving the Molecular Diagnostic Testing Conundrum for Mendelian Disorders in the Era of Next-Generation Sequencing: Single-Gene, Gene Panel, or Exome/Genome Sequencing. Genet. Med. 2015, 17, 444–451. [Google Scholar] [CrossRef]
- Krahn, M.; Cerino, M.; Campana-Salort, E.; Cossée, M. Towards a national standardisation of NGS studies in the diagnosis of myopathies. Med. Sci. 2017, 33, 30–33. [Google Scholar] [CrossRef]
- Kastanis, G.J.; Santana-Quintero, L.V.; Sanchez-Leon, M.; Lomonaco, S.; Brown, E.W.; Allard, M.W. In-depth Comparative Analysis of Illumina® MiSeq Run Metrics: Development of a Wet-lab Quality Assessment Tool. Mol. Ecol. Resour. 2019, 19, 377–387. [Google Scholar] [CrossRef]
- McFadyen, R. Next-Generation Sequencing Tips n’ Tricks—Part 4. Diagnostech 2020. Available online: https://diagnostech.co.za/next-generation-sequencing-tips-n-tricks-part-4/ (accessed on 28 November 2022).
- Technical Support. Optimizing Cluster Density on Illumina Sequencing Systems. Available online: https://www.illumina.com/content/dam/illumina-marketing/documents/products/other/miseq-overclustering-primer-770-2014-038.pdf (accessed on 20 November 2022).
- Genohub. Cluster Density Optimization on Illumina Sequencing Instruments. Available online: https://genohub.com/loading-concentrations-optimal-cluster-density/ (accessed on 28 March 2023).
- Illumina Technical Support. Illumina Recommandation Des Densités de Cluster Selon Les Types de Plateforme de Séquençage Illumina Utilisant Des Flow Cell Non Structurées. Available online: https://emea.support.illumina.com/bulletins/2020/05/recommandation-des-densites-de-cluster-selon-les-types-de-platef.html (accessed on 28 March 2023).
- Derek Caetano-Anolles PF Reads—Illumina Chastity Filter. Available online: https://gatk.broadinstitute.org/hc/en-us/articles/360035890991-PF-reads-Illumina-chastity-filter (accessed on 28 March 2023).
- Illumina Technical Support. Calculating Percent Passing Filter for Patterned and Non-Patterned Flow Cells. Available online: https://support.illumina.com/content/dam/illumina-marketing/documents/products/technotes/hiseq-x-percent-pf-technical-note-770-2014-043.pdf (accessed on 15 December 2022).
- Illumina Sequencing Quality Scores. Available online: https://www.illumina.com/science/technology/next-generation-sequencing/plan-experiments/quality-scores.html (accessed on 10 March 2023).
- Illumina Technical Support. Quality Scores for Next-Generation Sequencing. Available online: https://www.illumina.com/Documents/products/technotes/technote_Q-Scores.pdf (accessed on 19 November 2022).
- Illumina Technical Support. Illumina PhiX Loading Concentrations for Validation Runs on Illumina Sequencing Platforms. Available online: https://knowledge.illumina.com/instrumentation/general/instrumentation-general-reference_material-list/000001536 (accessed on 10 March 2023).
- Simon Andrews FastQC A Quality Control Tool for High Throughput Sequence Data. Available online: https://www.bioinformatics.babraham.ac.uk/projects/fastqc/ (accessed on 10 March 2019).
- Zhou, W.; Chen, T.; Zhao, H.; Eterovic, A.K.; Meric-Bernstam, F.; Mills, G.B.; Chen, K. Bias from Removing Read Duplication in Ultra-Deep Sequencing Experiments. Bioinformatics 2014, 30, 1073–1080. [Google Scholar] [CrossRef] [PubMed]
- Genohub. Recommended Coverage and Read Depth for NGS Applications. Available online: https://genohub.com/recommended-sequencing-coverage-by-application/ (accessed on 28 March 2023).
- Oexle, K. Evaluation of the Evenness Score in Next-Generation Sequencing. J. Hum. Genet. 2016, 61, 627–632. [Google Scholar] [CrossRef]
- McFadyen, R. Next-Generation Sequencing Tips n’ Tricks—Part 3. Diagnostech 2020. Available online: https://diagnostech.co.za/next-generation-sequencing-tips-n-tricks-part-3/ (accessed on 28 November 2022).
- Mokry, M.; Feitsma, H.; Nijman, I.J.; de Bruijn, E.; van der Zaag, P.J.; Guryev, V.; Cuppen, E. Accurate SNP and Mutation Detection by Targeted Custom Microarray-Based Genomic Enrichment of Short-Fragment Sequencing Libraries. Nucleic Acids Res. 2010, 38, e116. [Google Scholar] [CrossRef] [PubMed]
- Wang, J.; Raskin, L.; Samuels, D.C.; Shyr, Y.; Guo, Y. Genome Measures Used for Quality Control Are Dependent on Gene Function and Ancestry. Bioinformatics 2015, 31, 318–323. [Google Scholar] [CrossRef] [PubMed]
- Cingolani, P.; Platts, A.; Wang, L.L.; Coon, M.; Nguyen, T.; Wang, L.; Land, S.J.; Lu, X.; Ruden, D.M. A Program for Annotating and Predicting the Effects of Single Nucleotide Polymorphisms, SnpEff: SNPs in the Genome of Drosophila Melanogaster Strain w1118; Iso-2; Iso-3. Fly 2012, 6, 80–92. [Google Scholar] [CrossRef] [PubMed]
- Bainbridge, M.N.; Wang, M.; Wu, Y.; Newsham, I.; Muzny, D.M.; Jefferies, J.L.; Albert, T.J.; Burgess, D.L.; Gibbs, R.A. Targeted Enrichment beyond the Consensus Coding DNA Sequence Exome Reveals Exons with Higher Variant Densities. Genome Biol. 2011, 12, R68. [Google Scholar] [CrossRef] [PubMed]
- Gargis, A.S.; Kalman, L.; Berry, M.W.; Bick, D.P.; Dimmock, D.P.; Hambuch, T.; Lu, F.; Lyon, E.; Voelkerding, K.V.; Zehnbauer, B.A.; et al. Assuring the Quality of Next-Generation Sequencing in Clinical Laboratory Practice. Nat. Biotechnol. 2012, 30, 1033–1036. [Google Scholar] [CrossRef]
- Matthijs, G.; Souche, E.; Alders, M.; Corveleyn, A.; Eck, S.; Feenstra, I.; Race, V.; Sistermans, E.; Sturm, M.; Weiss, M.; et al. Guidelines for Diagnostic Next-Generation Sequencing. Eur. J. Hum. Genet. 2016, 24, 2–5. [Google Scholar] [CrossRef]
- Li, H. Improving SNP Discovery by Base Alignment Quality. Bioinformatics 2011, 27, 1157–1158. [Google Scholar] [CrossRef]
- DePristo, M.A.; Banks, E.; Poplin, R.; Garimella, K.V.; Maguire, J.R.; Hartl, C.; Philippakis, A.A.; del Angel, G.; Rivas, M.A.; Hanna, M.; et al. A Framework for Variation Discovery and Genotyping Using Next-Generation DNA Sequencing Data. Nat. Genet. 2011, 43, 491–498. [Google Scholar] [CrossRef]
- Online Mendelian Inheritance in Man, OMIM® 2019. Available online: https://omim.org/ (accessed on 29 March 2019).
- Robinson, J.T.; Thorvaldsdóttir, H.; Winckler, W.; Guttman, M.; Lander, E.S.; Getz, G.; Mesirov, J.P. Integrative Genomics Viewer. Nat. Biotechnol. 2011, 29, 24–26. [Google Scholar] [CrossRef]
- Thorvaldsdóttir, H.; Robinson, J.T.; Mesirov, J.P. Integrative Genomics Viewer (IGV): High-Performance Genomics Data Visualization and Exploration. Brief. Bioinform. 2013, 14, 178–192. [Google Scholar] [CrossRef]
- Tenedini, E.; Bernardis, I.; Artusi, V.; Artuso, L.; Roncaglia, E.; Guglielmelli, P.; Pieri, L.; Bogani, C.; Biamonte, F.; Rotunno, G.; et al. Targeted Cancer Exome Sequencing Reveals Recurrent Mutations in Myeloproliferative Neoplasms. Leukemia 2014, 28, 1052–1059. [Google Scholar] [CrossRef] [PubMed]
- Samuels, D.C.; Han, L.; Li, J.; Quanghu, S.; Clark, T.A.; Shyr, Y.; Guo, Y. Finding the Lost Treasures in Exome Sequencing Data. Trends Genet. 2013, 29, 593–599. [Google Scholar] [CrossRef] [PubMed]
- van der Schoot, V.; Haer-Wigman, L.; Feenstra, I.; Tammer, F.; Oerlemans, A.J.M.; van Koolwijk, M.P.A.; van Agt, F.; Arens, Y.H.J.M.; Brunner, H.G.; Vissers, L.E.L.M.; et al. Lessons Learned from Unsolicited Findings in Clinical Exome Sequencing of 16,482 Individuals. Eur. J. Hum. Genet. 2022, 30, 170–177. [Google Scholar] [CrossRef] [PubMed]
- Green, R.C.; Berg, J.S.; Grody, W.W.; Kalia, S.S.; Korf, B.R.; Martin, C.L.; McGuire, A.L.; Nussbaum, R.L.; O’Daniel, J.M.; Ormond, K.E.; et al. ACMG Recommendations for Reporting of Incidental Findings in Clinical Exome and Genome Sequencing. Genet. Med. 2013, 15, 565–574. [Google Scholar] [CrossRef]
- Kalia, S.S.; Adelman, K.; Bale, S.J.; Chung, W.K.; Eng, C.; Evans, J.P.; Herman, G.E.; Hufnagel, S.B.; Klein, T.E.; Korf, B.R.; et al. Recommendations for Reporting of Secondary Findings in Clinical Exome and Genome Sequencing, 2016 Update (ACMG SF v2.0): A Policy Statement of the American College of Medical Genetics and Genomics. Genet. Med. 2017, 19, 249–255. [Google Scholar] [CrossRef]
- Miller, D.T.; Lee, K.; Gordon, A.S.; Amendola, L.M.; Adelman, K.; Bale, S.J.; Chung, W.K.; Gollob, M.H.; Harrison, S.M.; Herman, G.E.; et al. Recommendations for Reporting of Secondary Findings in Clinical Exome and Genome Sequencing, 2021 Update: A Policy Statement of the American College of Medical Genetics and Genomics (ACMG). Genet. Med. 2021, 23, 1391–1398. [Google Scholar] [CrossRef]
- Lionel, A.C.; Costain, G.; Monfared, N.; Walker, S.; Reuter, M.S.; Hosseini, S.M.; Thiruvahindrapuram, B.; Merico, D.; Jobling, R.; Nalpathamkalam, T.; et al. Improved Diagnostic Yield Compared with Targeted Gene Sequencing Panels Suggests a Role for Whole-Genome Sequencing as a First-Tier Genetic Test. Genet. Med. 2018, 20, 435–443. [Google Scholar] [CrossRef]
- Baux, David Nenufaar 2021. Available online: https://github.com/mobidic/nenufaar (accessed on 28 February 2021).
- Li, H. Aligning Sequence Reads, Clone Sequences and Assembly Contigs with BWA-MEM. arXiv 2013, arXiv:1303.3997. [Google Scholar]
- Poplin, R.; Ruano-Rubio, V.; DePristo, M.A.; Fennell, T.J.; Carneiro, M.O.; der Auwera, G.A.V.; Kling, D.E.; Gauthier, L.D.; Levy-Moonshine, A.; Roazen, D.; et al. Scaling Accurate Genetic Variant Discovery to Tens of Thousands of Samples. bioRxiv 2017. bioRxiv:201178. [Google Scholar]
- McKenna, A.; Hanna, M.; Banks, E.; Sivachenko, A.; Cibulskis, K.; Kernytsky, A.; Garimella, K.; Altshuler, D.; Gabriel, S.; Daly, M.; et al. The Genome Analysis Toolkit: A MapReduce Framework for Analyzing next-Generation DNA Sequencing Data. Genome Res. 2010, 20, 1297–1303. [Google Scholar] [CrossRef] [PubMed]
- Rimmer, A.; Phan, H.; Mathieson, I.; Iqbal, Z.; Twigg, S.R.F.; Wilkie, A.O.M.; McVean, G.; Lunter, G. Integrating Mapping-, Assembly- and Haplotype-Based Approaches for Calling Variants in Clinical Sequencing Applications. Nat. Genet. 2014, 46, 912–918. [Google Scholar] [CrossRef] [PubMed]
- García-Alcalde, F.; Okonechnikov, K.; Carbonell, J.; Cruz, L.M.; Götz, S.; Tarazona, S.; Dopazo, J.; Meyer, T.F.; Conesa, A. Qualimap: Evaluating next-Generation Sequencing Alignment Data. Bioinformatics 2012, 28, 2678–2679. [Google Scholar] [CrossRef] [PubMed]
- Okonechnikov, K.; Conesa, A.; García-Alcalde, F. Qualimap 2: Advanced Multi-Sample Quality Control for High-Throughput Sequencing Data. Bioinformatics 2016, 32, 292–294. [Google Scholar] [CrossRef] [PubMed]
- der Auwera, G.V.; O’Connor, B. Genomics in the Cloud: Using Docker, GATK, and WDL in Terra, 1st ed.; O’Reilly Media: Sebastopol, CA, USA, 2020; ISBN 978-1-4919-7519-0. [Google Scholar]
- Quinlan, A.R.; Hall, I.M. BEDTools: A Flexible Suite of Utilities for Comparing Genomic Features. Bioinformatics 2010, 26, 841–842. [Google Scholar] [CrossRef] [PubMed]
- O’Leary, N.A.; Wright, M.W.; Brister, J.R.; Ciufo, S.; Haddad, D.; McVeigh, R.; Rajput, B.; Robbertse, B.; Smith-White, B.; Ako-Adjei, D.; et al. Reference Sequence (RefSeq) Database at NCBI: Current Status, Taxonomic Expansion, and Functional Annotation. Nucleic Acids Res. 2016, 44, D733–D745. [Google Scholar] [CrossRef]
- Broad Institute Picard Toolkit 2019. Available online: https://github.com/broadinstitute/picard (accessed on 1 March 2019).
- Danecek, P.; Bonfield, J.K.; Liddle, J.; Marshall, J.; Ohan, V.; Pollard, M.O.; Whitwham, A.; Keane, T.; McCarthy, S.A.; Davies, R.M.; et al. Twelve Years of SAMtools and BCFtools. GigaScience 2021, 10, giab008. [Google Scholar] [CrossRef]


| Quality parameters | Description | Tools to Evaluate | Acceptable Threshold(s) (Depending on Context) | Results Outside Thresholds: Common Causes and/or Corrective Measures | Sources |
|---|---|---|---|---|---|
| Raw Sequencing Quality | [12,13] | ||||
| Density of clusters (K/mm2) | The density of clusters on the flow cell (in thousands per mm2). This parameter is a direct representation of the amount of DNA loaded. | Sequencer Software (ex: Sequencing Analysis Viewer from Illumina®) | Depends on instruments. For example: MiniSeq-High and Mid-170–220 MiSeq-v2-1000–1200 MiSeq-v3-1200–1400 NextSeq-v2 High and Mid-170–220 HiSeq2500-v1 and v2-850–1000 HiSeq2500-v3-750–850 HiSeq2500-v4-950–1050 | Inaccurate library quantification is the most common cause of over or under-clustering. | [14,15,16] |
| Clusters passing filter (%PF) | The %PF is the number of clusters that passed Illumina’s “Chastity filter”. The “Chastity Filter” is a ratio of the brightest base intensity (Ia) divided by the sum of the brightest and second brightest (Ib) base intensities: Ia/(Ia + Ib). A cluster does not pass this filter if 1 base call has a chastity value below 0.6 in the first 25 cycles. | 65% | In the most common cases, a %PF under 65% is due to an over-clustering. | [17,18] | |
| Quality score Q30 (%) | The percentage of bases with a phred quality score of 30 or higher. Phred-like quality scores (Q-scores) are used to measure the accuracy of nucleotide identity data from a sequencing run. This value is an average across the whole read length since error rate increases towards the end of the reads. Q = −10.log10(e) Error rate: percentage of bases called incorrectly at any one cycle. Q30 is the best indicator to check base quality. | 80%. This threshold may be adapted following DNA quality; if the sample is from FFPE or is old then the DNA may be of poor quality but precious. | The main cause of a low Q30 is the poor quality of DNA. The extraction is a key step. Another cause is the quality of the reagents or polymerase, the reason why the Q30 score decreases as the run progress. | [19,20] | |
| PhiX control (%) | PhiX is an adapter-ligated library used as an internal control for Illumina sequencing run quality monitoring. PhiX% is calculated from the reads that are aligned to Illumina’s PhiX control. | >0.3% Ideally preconized around 1%. | The less complex/diverse is the library, the higher PhiX control amount is needed. | [21] | |
| Sample Sequencing Data Quality | |||||
| Insert size | Median or mean length of sequenced fragments calculated from fastq. | FastP Picard (GATK) FastQC | Around 200–250 Depending on library kits. | Adjusting fragmentation could lead to an optimal sequencing and coverage uniformity. | |
| Duplicate rate | Rate of deduplicated reads. | Picard (GATK) FastQC | An acceptable threshold is under 20%. Depending on library kit, targets or depth. | Can be diminished by optimizing the amount of starting material and the number of PCR cycles in the laboratory. | [22,23] |
| On-target rate | Percent of sequencing data/reads which maps to regions of interest: ratio of the number of sequenced bases covering the target regions to the total number of mapped bases output by the sequencer. | Picard (GATK) | An acceptable threshold is >80%. Depending on library kit, targets or depth. | Substantially influenced by insert size. | |
| Depth of coverage | Median or mean coverage on all target bases (expressed in X). | Strongly recommended, at least, 100X. Depending on application. | For a better uniformity of coverage, a lower threshold is acceptable. Lower numbers of samples will increase coverage. | [24] | |
| Coverage rate (% at nX) | Percent of target bases with coverage > nX. | Strongly recommended: >90% at 30X. Depending on application, targets, or library. | Lower numbers of samples will increase coverage. A change in capture design or technology should increase the coverage rate. | ||
| Uniformity of coverage | Homogeneity in coverage of the NGS targets, represented by the evenness score (ES) and fold 80 base penalty (Fold-80). The fold 80 base penalty is defined as the fold change of non-zero read coverage needed to bring 80% of the targeted bases to the observed mean coverage. | MiSeqReporter/Local Run Manager HomeMade Script | Threshold depending of the method of calculation. A lower value of the Fold-80 and a high percentage of the ES indicate less variability among the coverage of the individual targets, a value of 1 of the Fold-80 base penalty, and of 100% of the ES representing a perfect uniformity. | A change in capture design or technology should increase the coverage rate. | [25,26,27] |
| Ts/Tv ratio (SNV) | Transitions (Ts) (changes from A <-> G and C <-> T) compared to transversions (Tv) (changes from A <-> C, A <-> T, G <-> C or G <-> T) | BCFTools SNPSift GATK VariantEval (BETA) | An acceptable threshold on CDS sequencing is >2.4. Depending on the application. | Across the entire genome, the ratio of transitions to transversions is typically around 2. In protein coding regions, this ratio is typically higher, often a little above 3. This metric can be used as a long-term control, if this metric changes drastically it can mean a problem with the capture, samples, or sequencer. | [28,29,30] |
| Number of Reads (Million) | Exome | Median Insert Size (bp) | On-Target Rate | On-Target Mean Coverage with Duplicates (X) | Duplicate Reads (%) | On-Target Mean Coverage without Duplicates (X) | Target Base at 30 X (%) | Fold 80 Base Penalty | Evenness | Ts/Tv Ratio |
|---|---|---|---|---|---|---|---|---|---|---|
| 40M | Medexome | 206 | 74.26 | 61.3 | 12.09 | 42.1 | 66 | 1.9 | 77.25 | 2.8 |
| SSV7 | 215 | 72.04 | 66.1 | 5.16 | 45.5 | 73 | 1.8 | 79.46 | 2.7 | |
| CREV2 | 204 | 72.14 | 48.8 | 4.26 | 33.3 | 51 | 2.0 | 77.62 | 2.5 | |
| 60M | Medexome | 206 | 74.26 | 86.4 | 17.25 | 59.5 | 83 | 1.9 | 77.03 | 2.7 |
| SSV7 | 218 | 72.04 | 96.32 | 7.54 | 66.3 | 89 | 1.7 | 79.52 | 2.6 | |
| CREV2 | 205 | 72.14 | 71.4 | 6.24 | 48.8 | 75 | 1.9 | 77.99 | 2.4 | |
| 80M | Medexome | 207 | 74.26 | 108.4 | 21.93 | 74.7 | 90 | 1.9 | 77.22 | 2.7 |
| SSV7 | 218 | 72.04 | 124.9 | 9.79 | 86.1 | 94 | 1.8 | 80.01 | 2.6 | |
| CREV2 | 205 | 72.14 | 93.0 | 8.15 | 63.6 | 86 | 1.8 | 78.63 | 2.4 | |
| 100M | Medexome | 209 | 74.26 | 127.8 | 26.19 | 88.2 | 92 | 1.8 | 77.46 | 2.7 |
| SSV7 | 218 | 72.04 | 151.9 | 11.94 | 104.9 | 96 | 1.7 | 80.22 | 2.6 | |
| CREV2 | 206 | 72.14 | 113.6 | 9.96 | 77.7 | 90 | 1.8 | 79.31 | 2.4 |
Disclaimer/Publisher’s Note: The statements, opinions and data contained in all publications are solely those of the individual author(s) and contributor(s) and not of MDPI and/or the editor(s). MDPI and/or the editor(s) disclaim responsibility for any injury to people or property resulting from any ideas, methods, instructions or products referred to in the content. |
© 2023 by the authors. Licensee MDPI, Basel, Switzerland. This article is an open access article distributed under the terms and conditions of the Creative Commons Attribution (CC BY) license (https://creativecommons.org/licenses/by/4.0/).
Share and Cite
Yauy, K.; Van Goethem, C.; Pégeot, H.; Baux, D.; Guignard, T.; Thèze, C.; Ardouin, O.; Roux, A.-F.; Koenig, M.; Bergougnoux, A.; et al. Evaluating the Transition from Targeted to Exome Sequencing: A Guide for Clinical Laboratories. Int. J. Mol. Sci. 2023, 24, 7330. https://doi.org/10.3390/ijms24087330
Yauy K, Van Goethem C, Pégeot H, Baux D, Guignard T, Thèze C, Ardouin O, Roux A-F, Koenig M, Bergougnoux A, et al. Evaluating the Transition from Targeted to Exome Sequencing: A Guide for Clinical Laboratories. International Journal of Molecular Sciences. 2023; 24(8):7330. https://doi.org/10.3390/ijms24087330
Chicago/Turabian StyleYauy, Kevin, Charles Van Goethem, Henri Pégeot, David Baux, Thomas Guignard, Corinne Thèze, Olivier Ardouin, Anne-Françoise Roux, Michel Koenig, Anne Bergougnoux, and et al. 2023. "Evaluating the Transition from Targeted to Exome Sequencing: A Guide for Clinical Laboratories" International Journal of Molecular Sciences 24, no. 8: 7330. https://doi.org/10.3390/ijms24087330