

The Mechanism of Hepatic Encephalopathy Induced by Thioacetamide Based on Metabolomics and Proteomics: A Preliminary Study


Abstract
:1. Introduction
2. Results
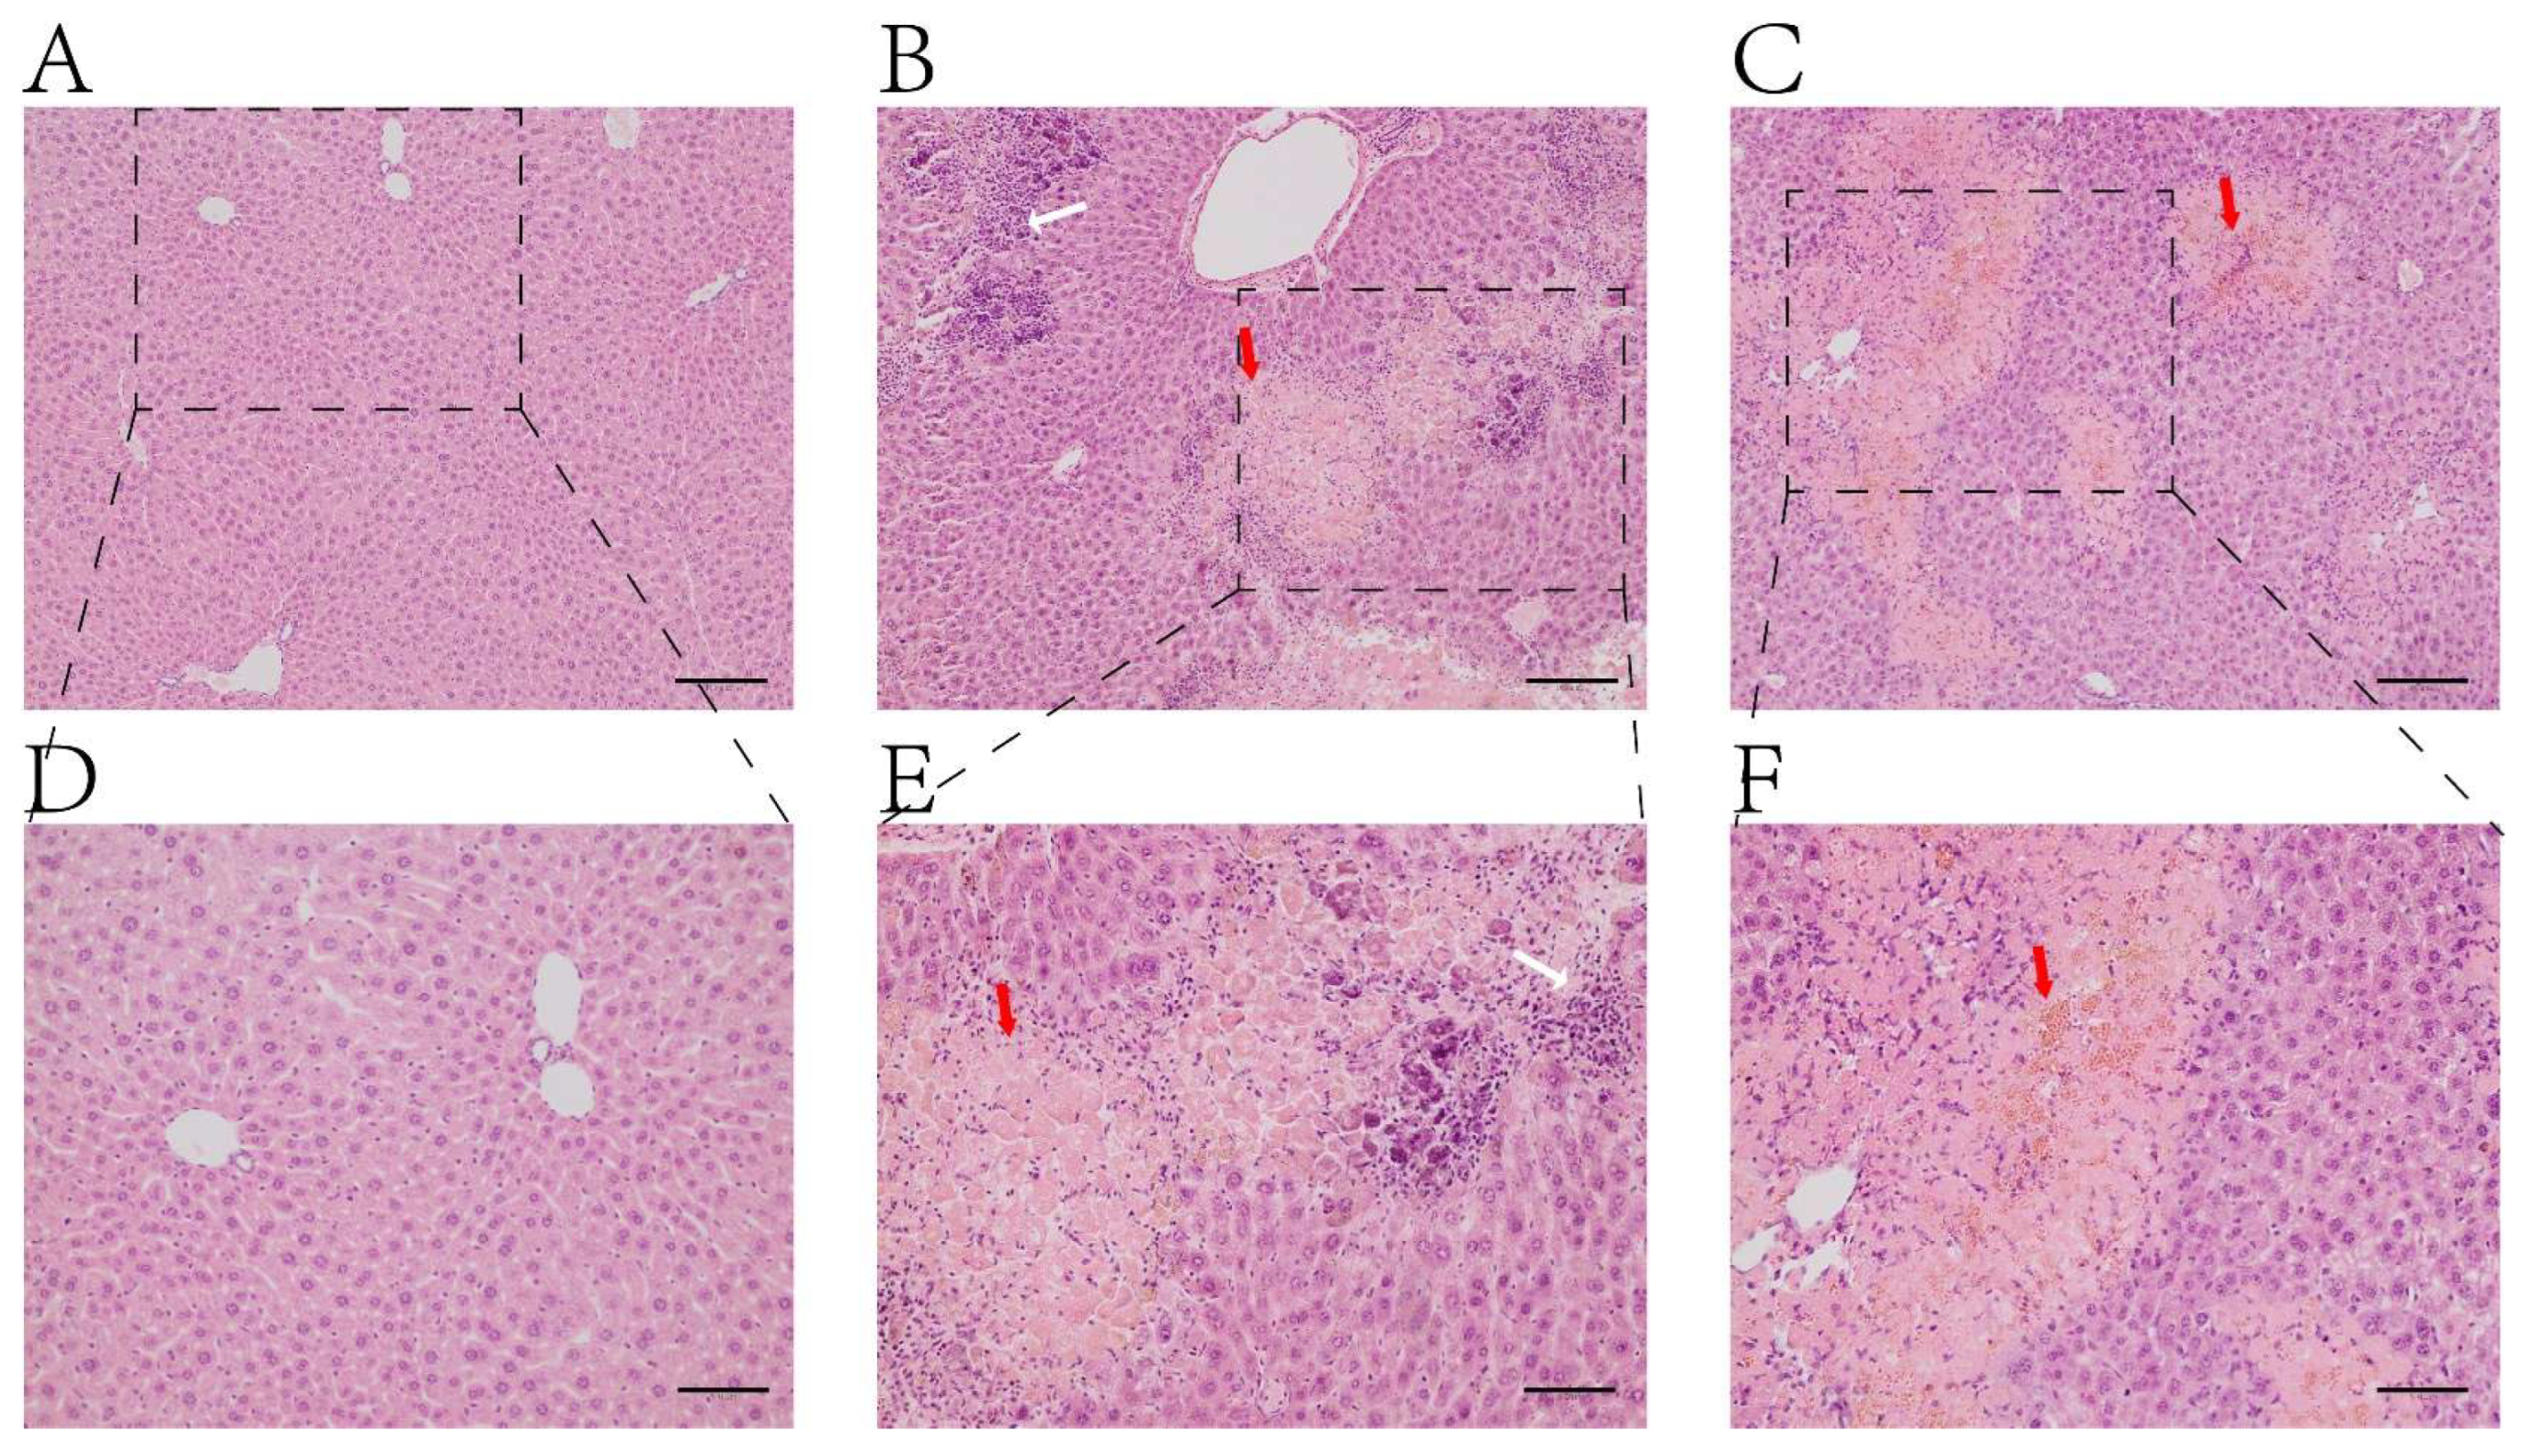
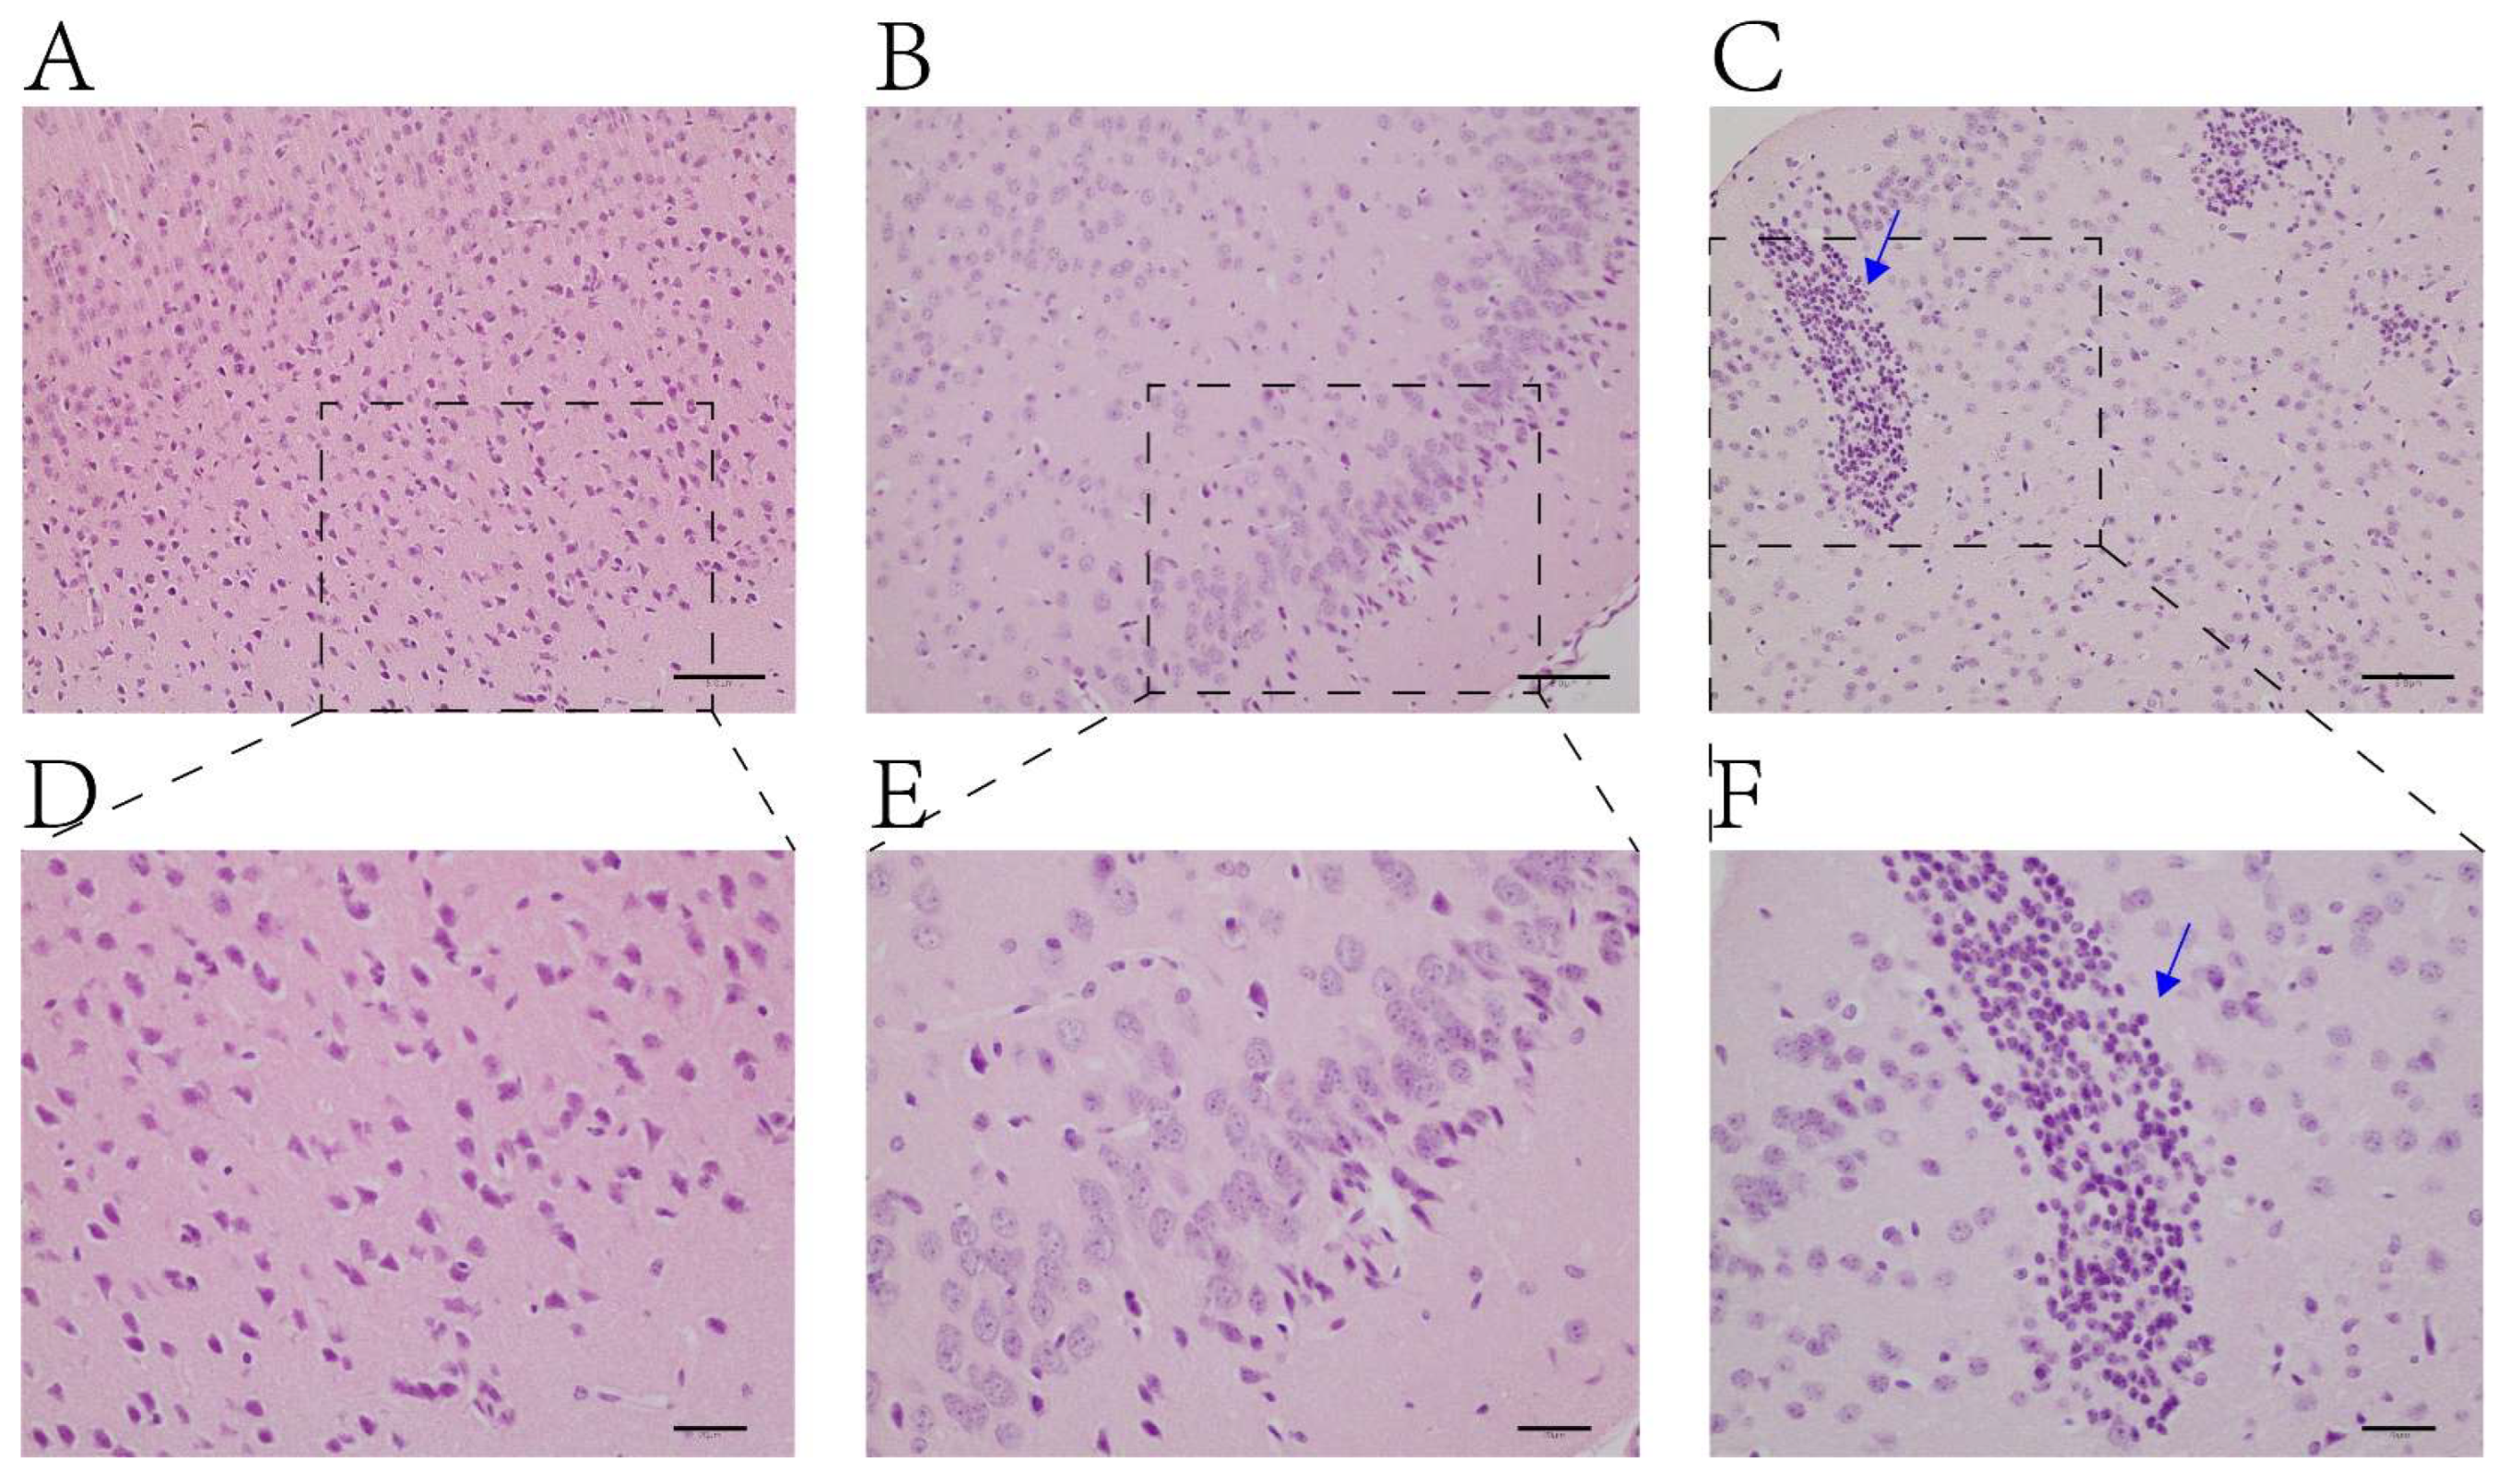
2.1. H&E Staining
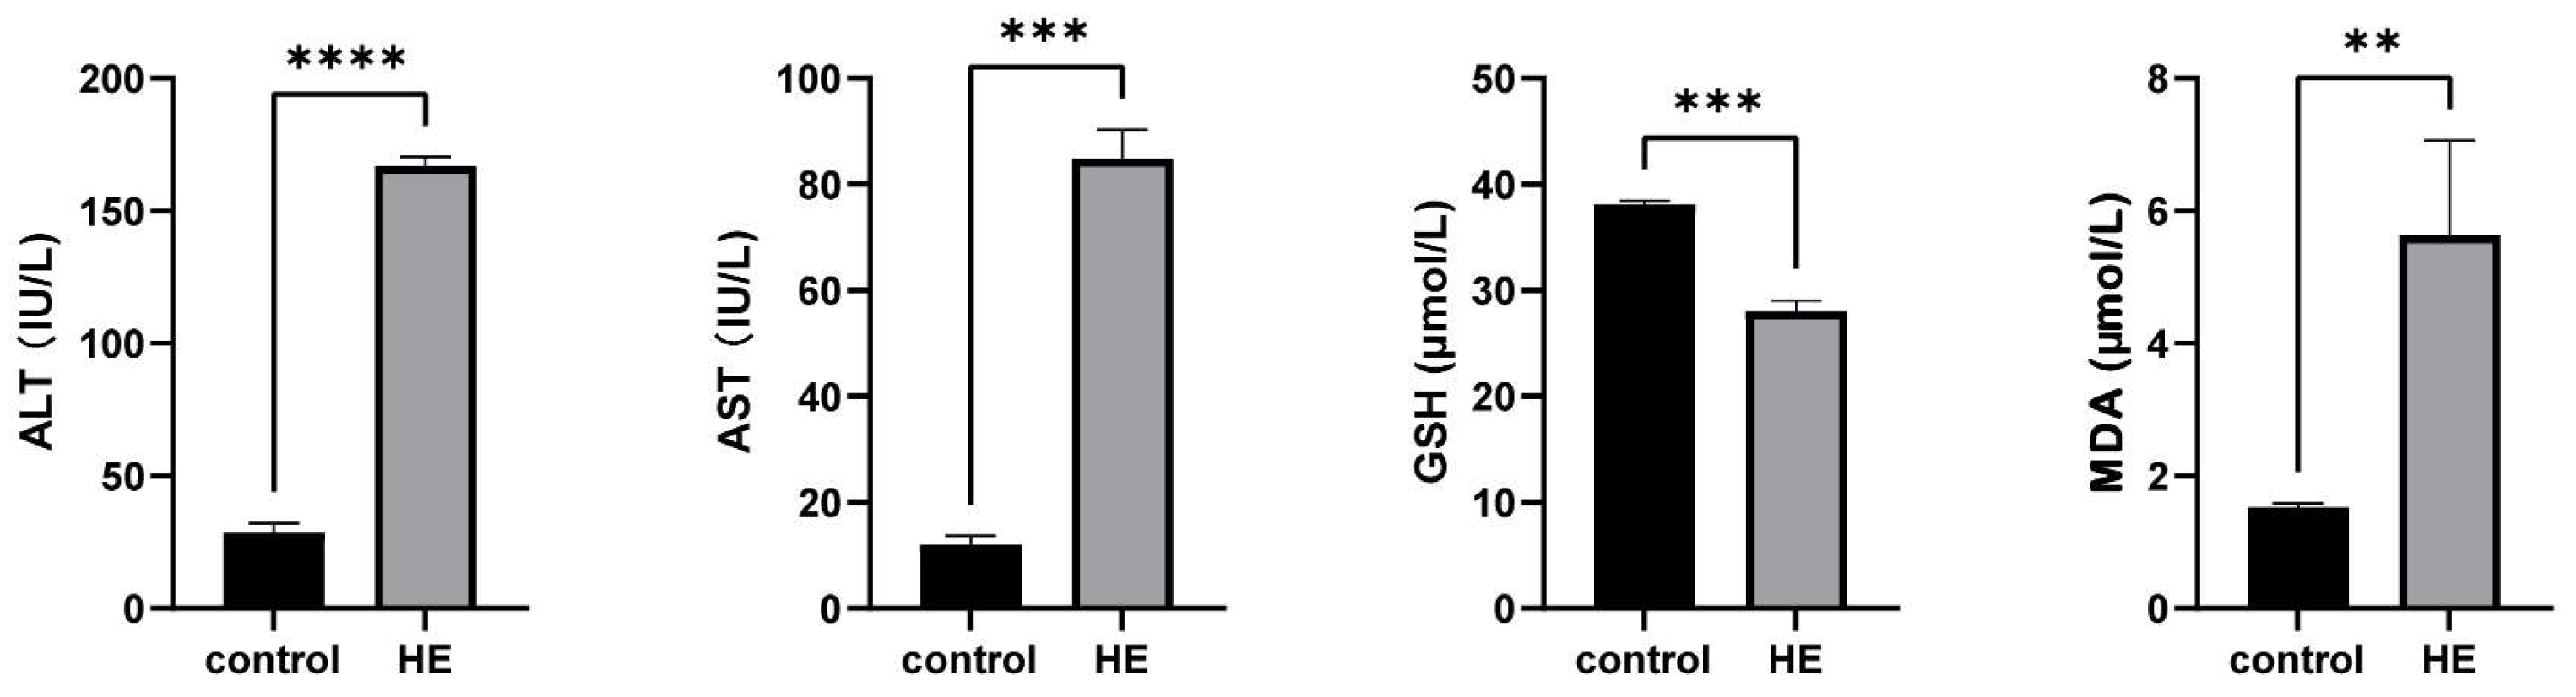
2.2. Results of ALT, AST, GSH, and MDA
2.3. Results of Metabolomics
2.3.1. Sample Quality Control
2.3.2. PCA and PLS-DA Results
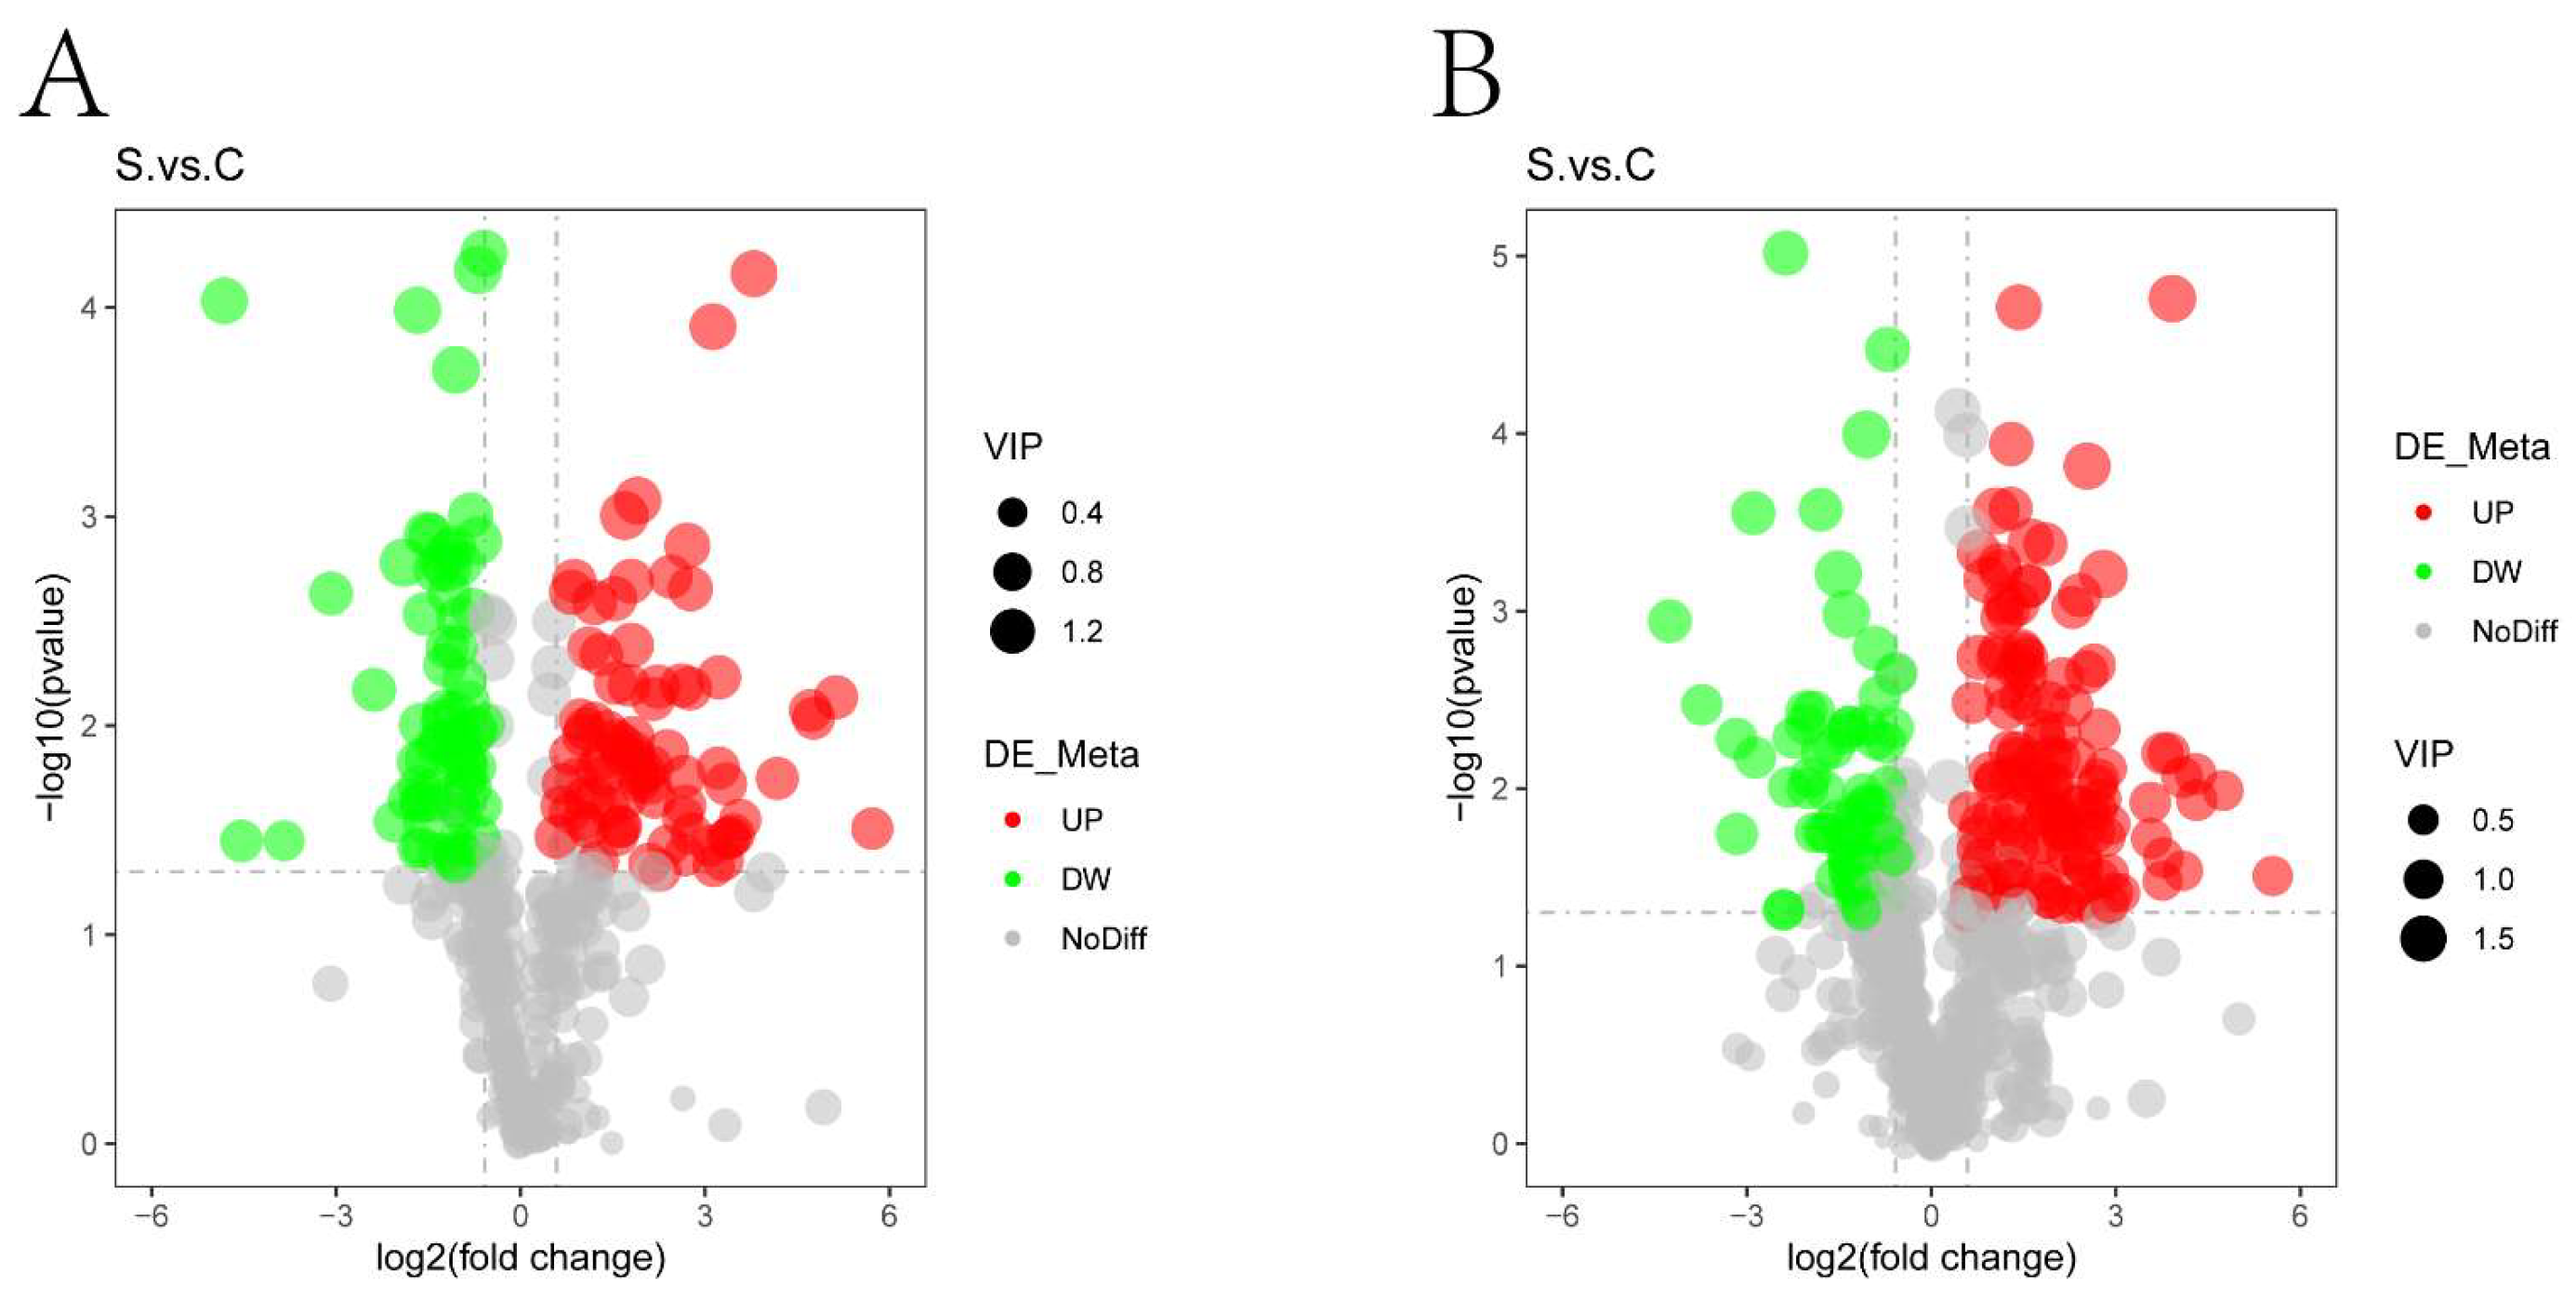
2.3.3. Volcano Plots and Hierarchical Clustering Analysis of Differential Metabolites
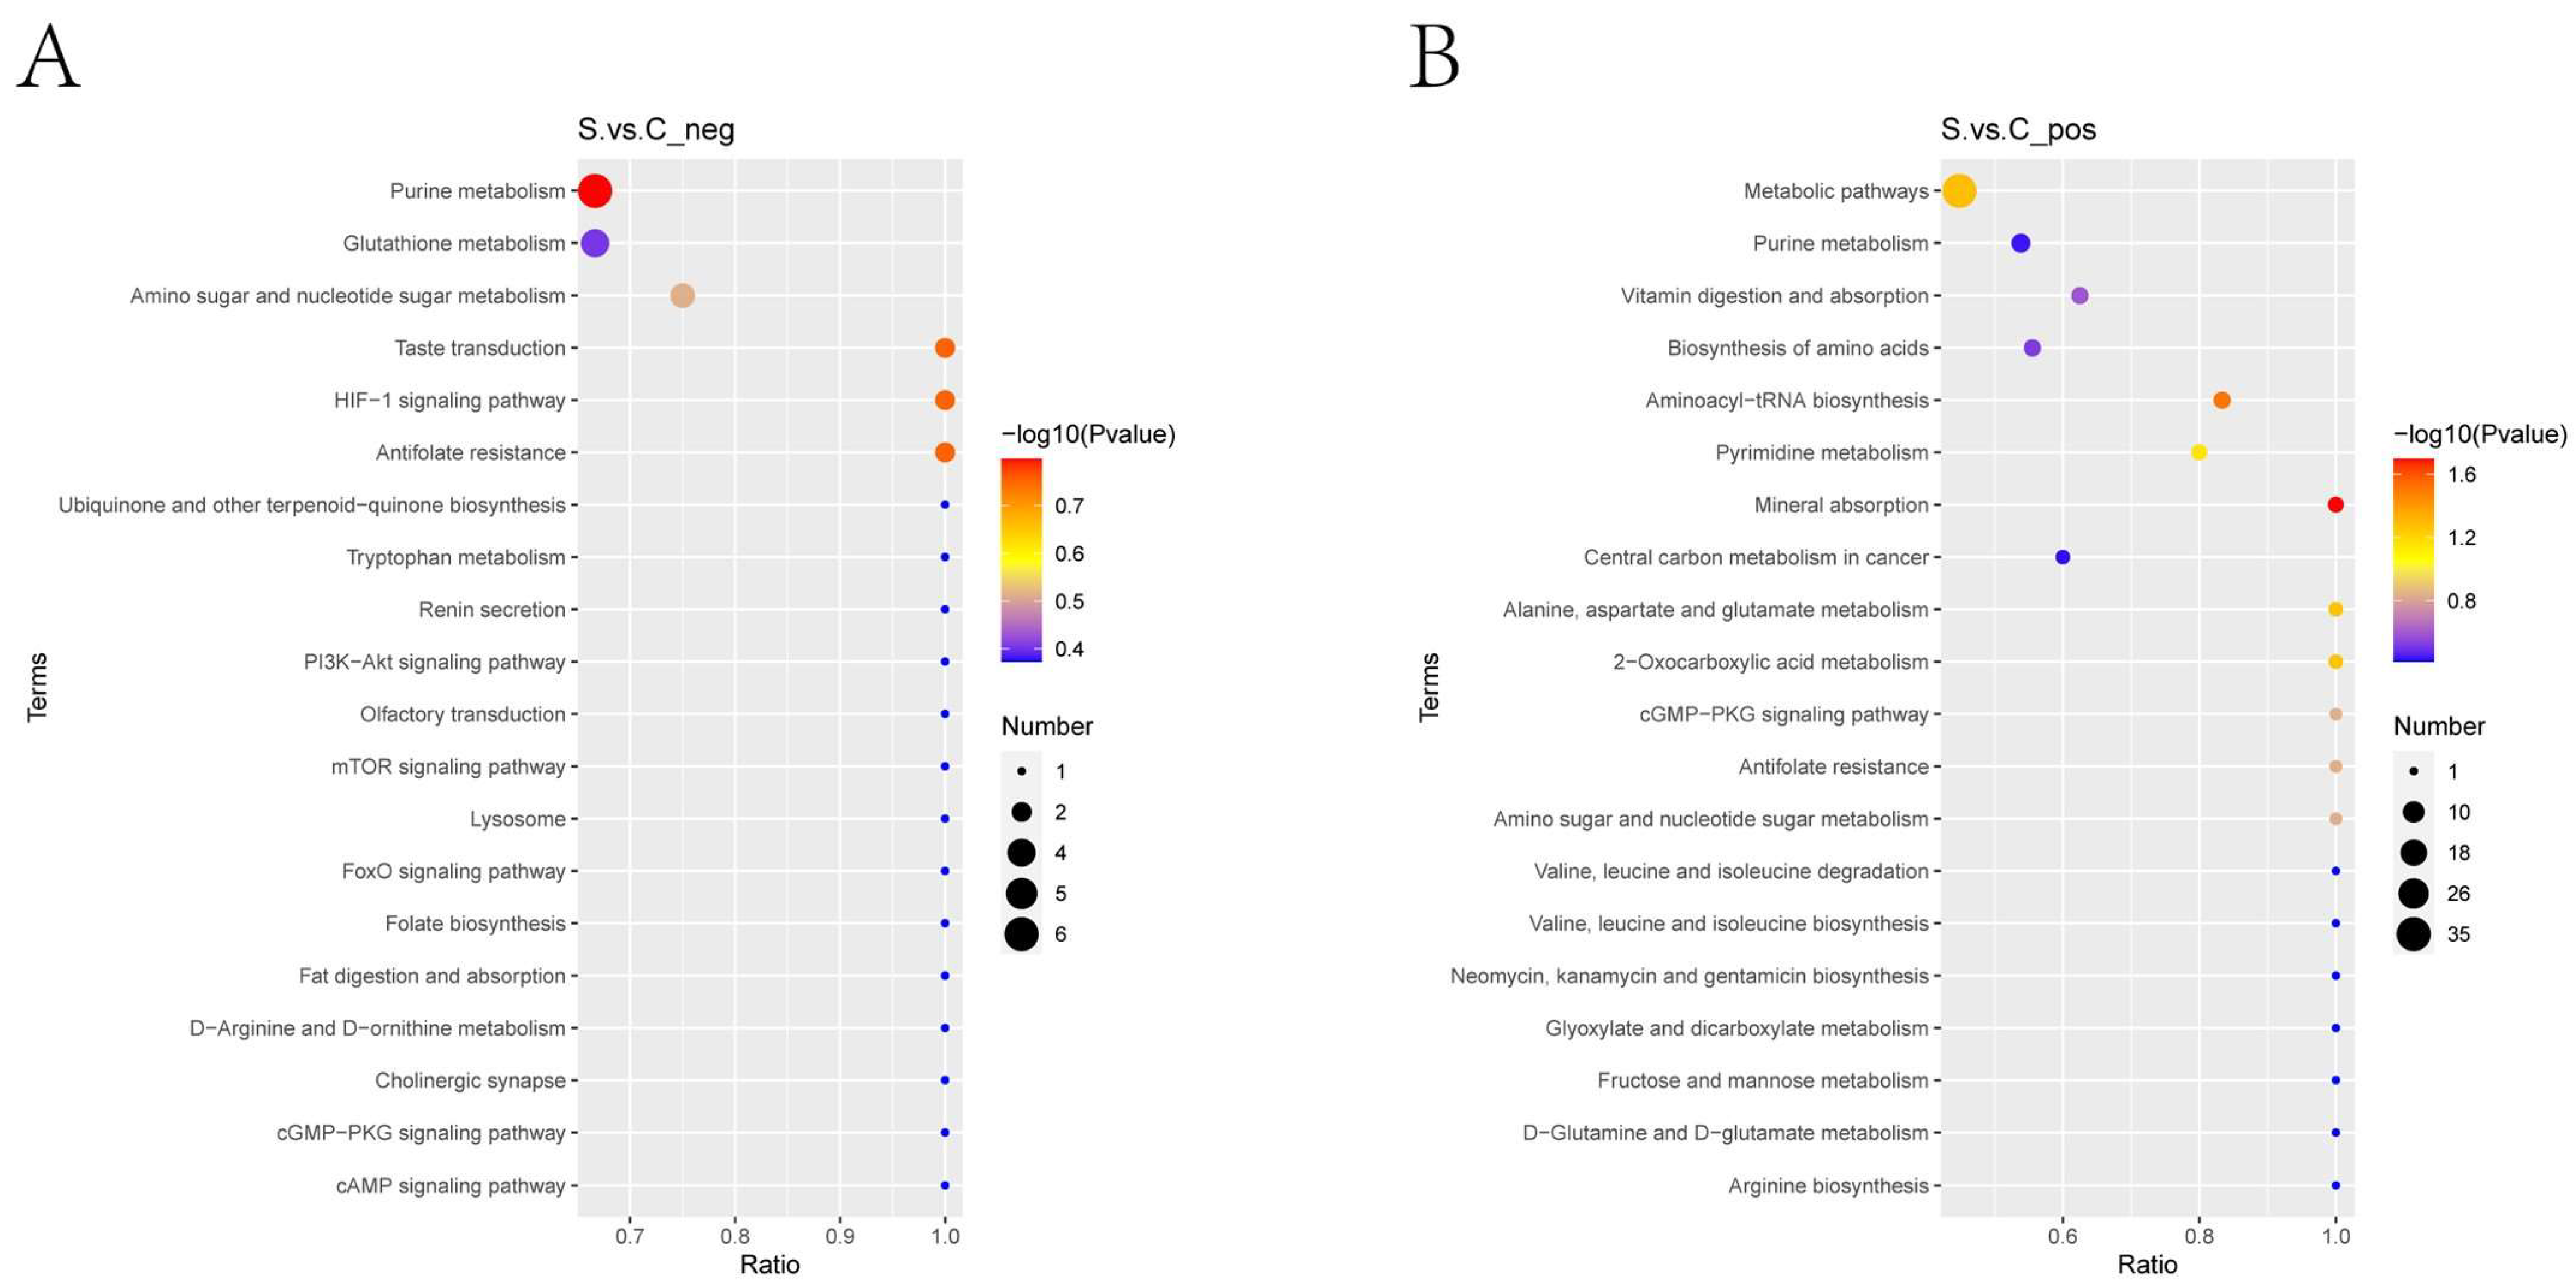
2.3.4. KEGG Pathway Enrichment Analysis
2.4. Results of Proteomics
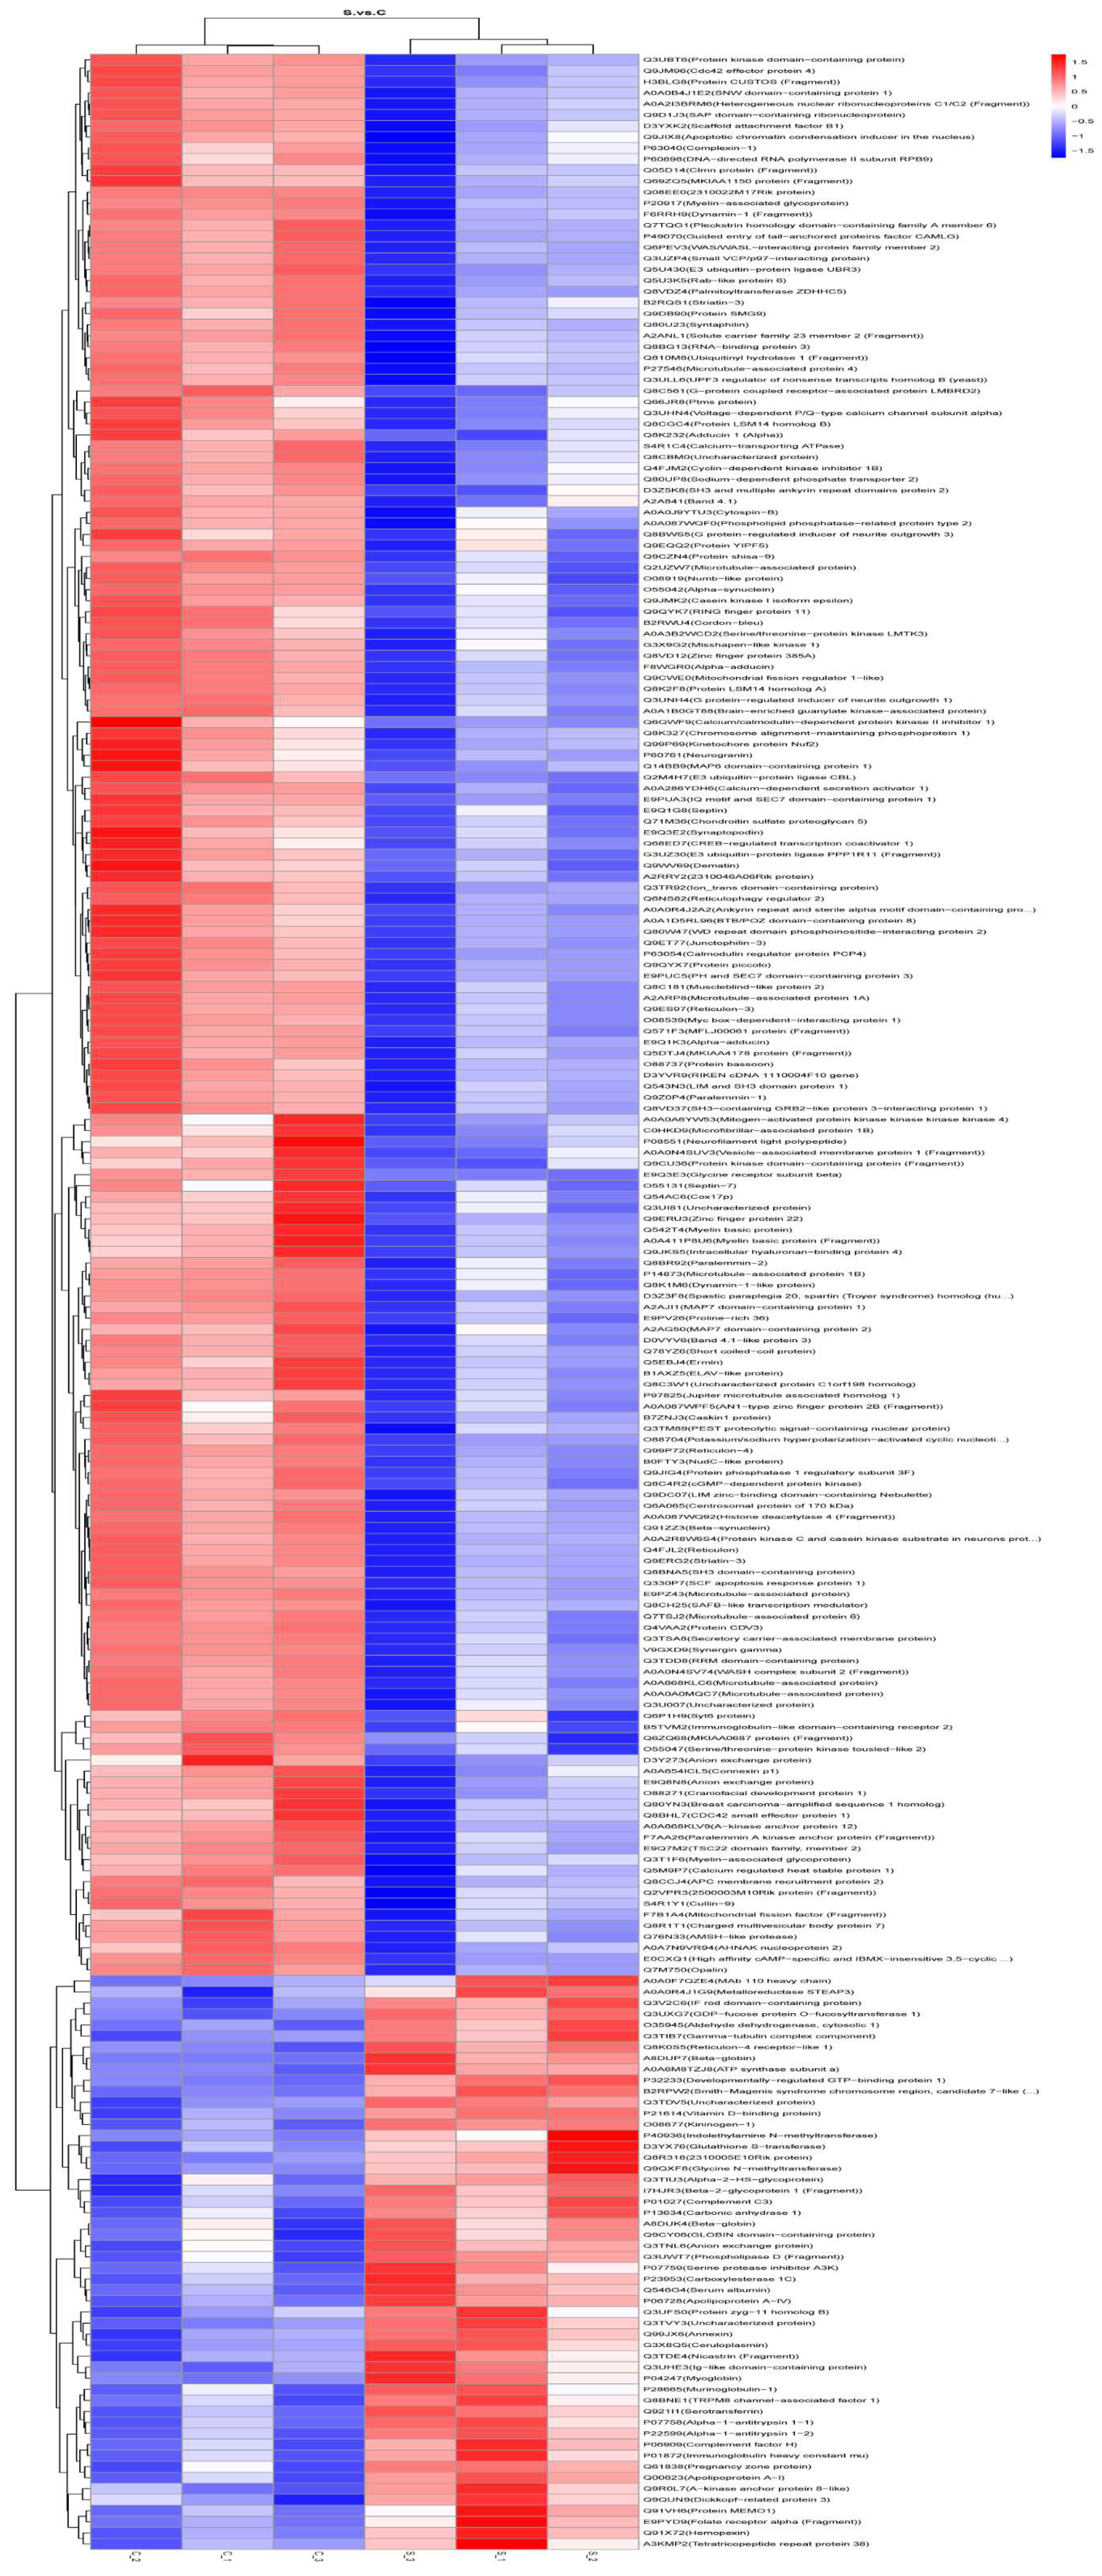
2.4.1. Differential Protein Results for Presentation, Volcano Plots, and Heatmap Plots
2.4.2. DEPs of Gene Ontology (GO) Function Enrichment Analysis
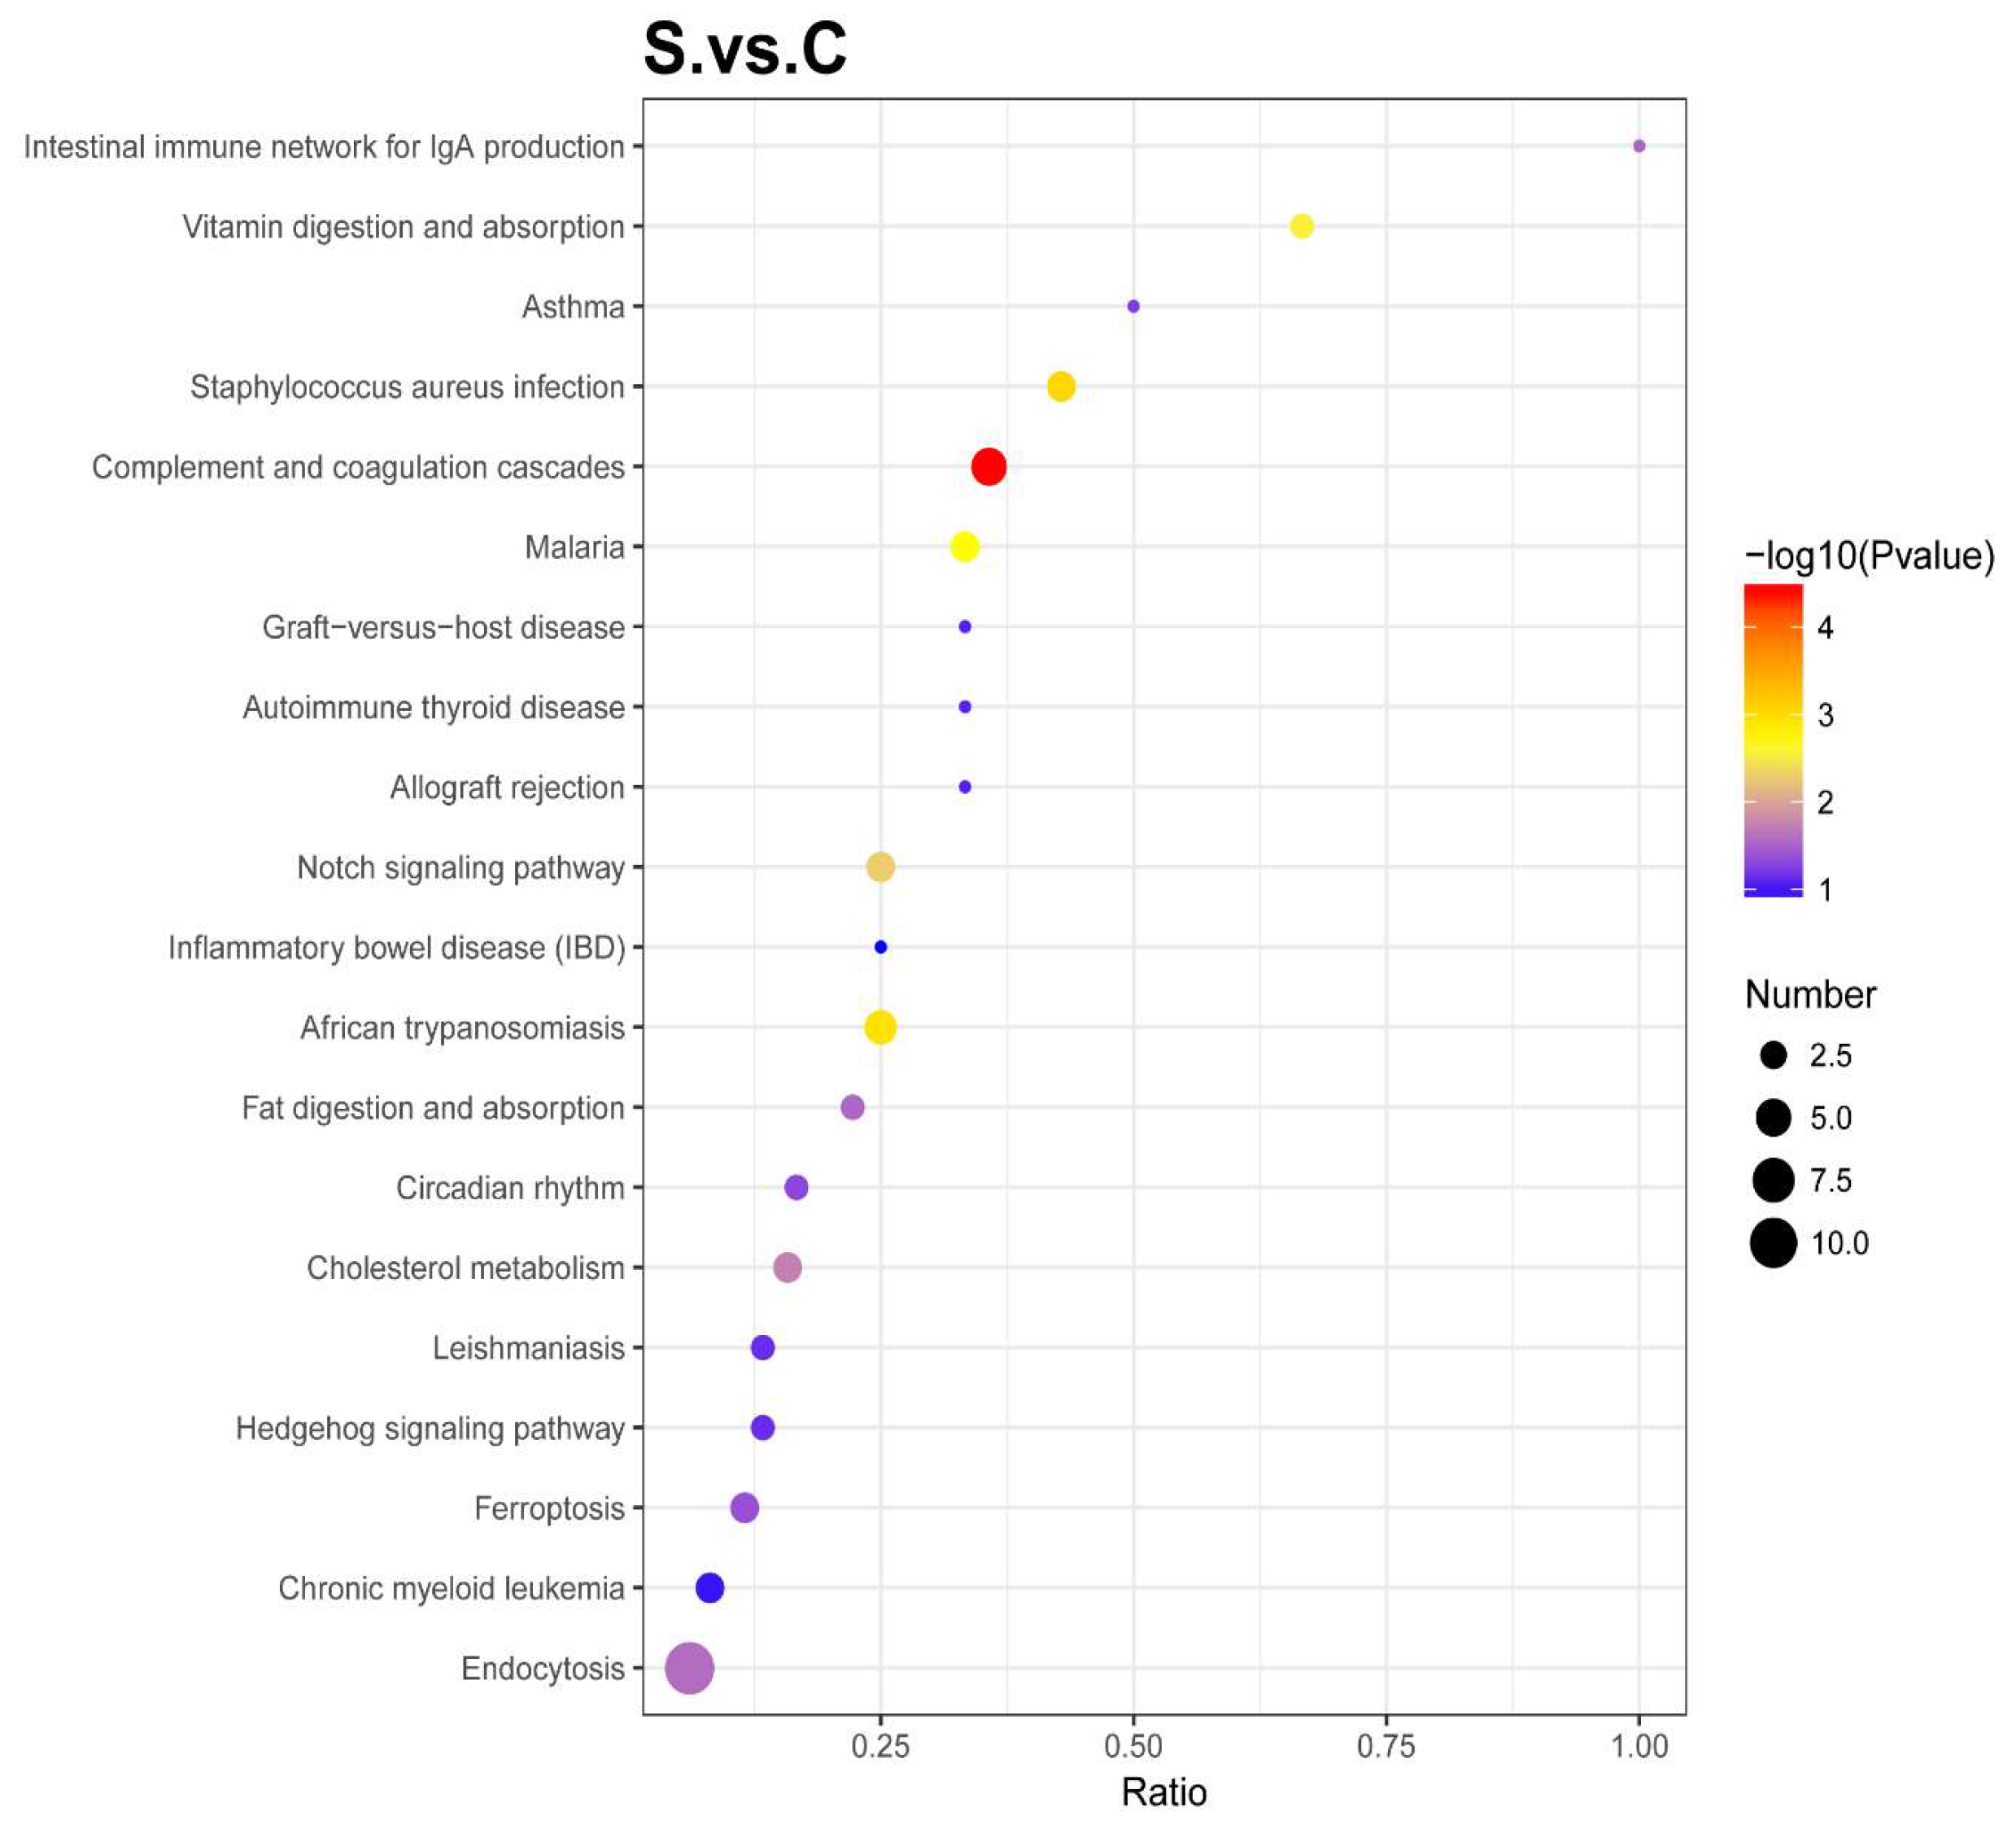
2.4.3. Enrichment of Kyoto Encyclopedia of Genes and Genomes (KEGG) Pathway Analysis
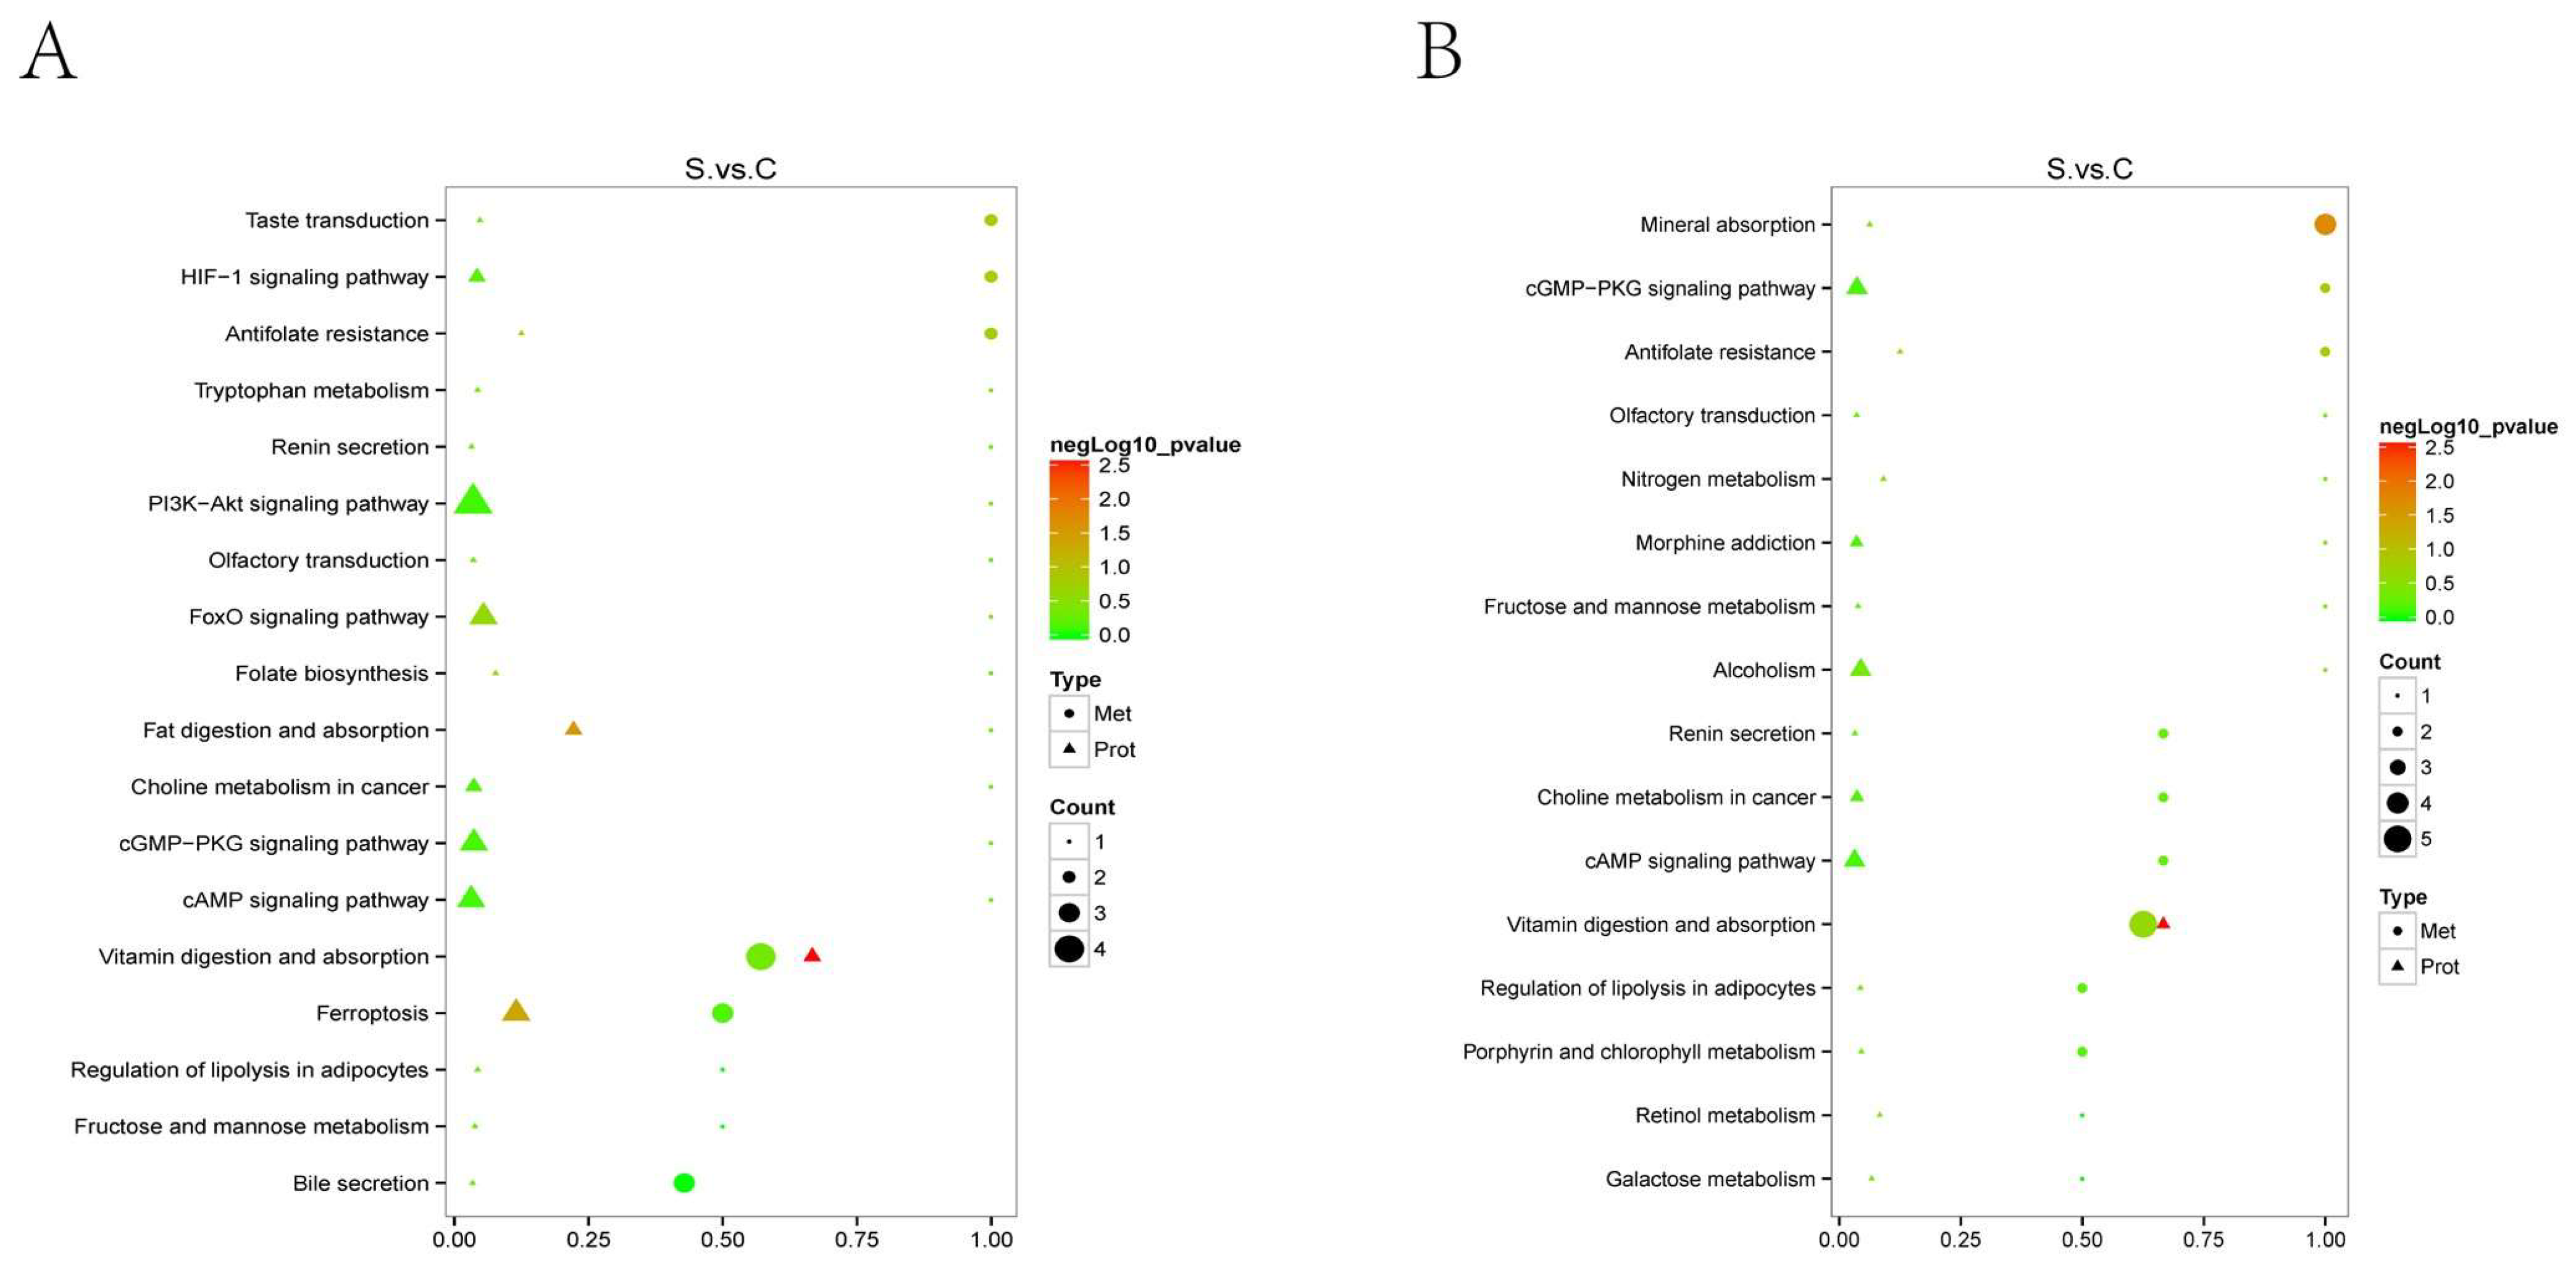
2.5. Joint Analysis of Metabolomics and Proteomics
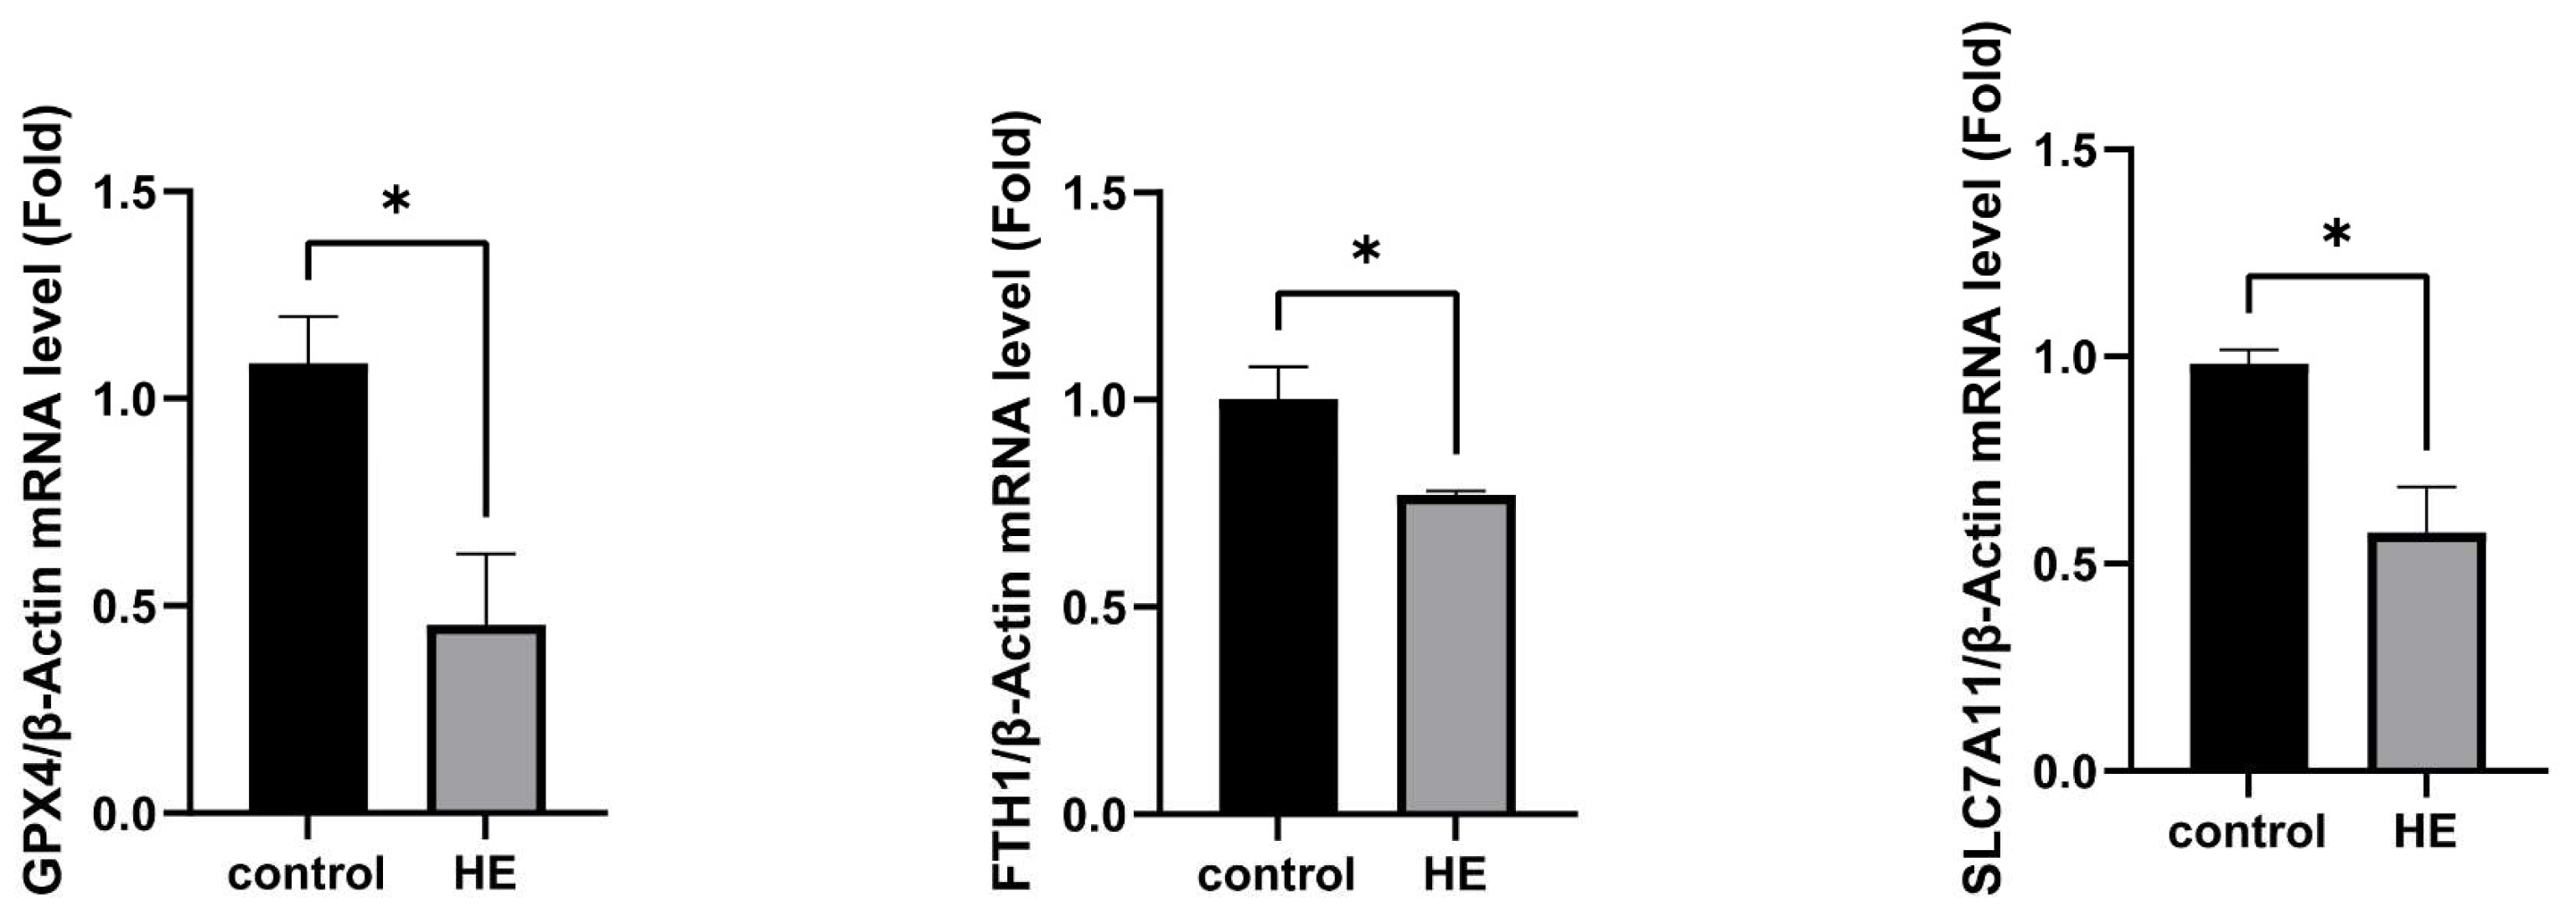
2.6. Detect Ferroptosis-Related Gene Expression in Mouse Brain Tissue
3. Discussion
4. Materials and Methods
4.1. Reagents
4.2. Animal Model and Sample Collection
4.3. Proteomics
4.3.1. Total Protein Extraction
4.3.2. TMT Labeling of Peptides
4.3.3. Separation of Fractions
4.3.4. LC-MS/MS Analysis
4.3.5. Data Analysis
The Identification and Quantitation of Protein
The Functional Analysis of Protein and DEP
4.4. Metabolomics
4.4.1. Metabolites Extraction
4.4.2. UHPLC-MS/MS Analyses
4.4.3. Data Processing and Metabolite Identification
4.4.4. Data Analysis
4.5. Hematoxylin and Eosin (H&E) Staining
4.6. Determination of ALT, AST, MDA, and GSH
4.7. RNA Extraction and Quantitative Real-Time PCR (qPCR)
4.8. Statistical Analysis
5. Conclusions
Supplementary Materials
Author Contributions
Funding
Informed Consent Statement
Data Availability Statement
Conflicts of Interest
Abbreviations
| ACN | acetonitrile |
| AGC | automatic gain control |
| ALT | alanine transaminase |
| AST | aspartate aminotransferase |
| BCAAs | branched chain amion acids |
| BP | biological Process |
| CC | Cellular Component |
| COG | clusters of orthologous groups |
| CYP450 | cytochrome P450 |
| DEPs | differentially expressed proteins |
| ELISA | enzyme-linked immunosorbent assay |
| FA | formic acid |
| FC | fold change |
| FMO | flavin-containing monooxygenase |
| FMT | fecal microbiota transplantation |
| FTH1 | ferritin heavy chain 1 |
| GABA | γ-aminobutyric acid |
| Glu | glutamate |
| GMP | guanosine monophosphate |
| GO | gene ontology |
| GPX4 | glutathione peroxidase 4 |
| GSH | glutathione |
| HCD | higher-energy collisional dissociation |
| HE | hepatic encephalopathy |
| HRMS | high-resolution mass spectrometry |
| KEGG | Kyoto Encyclopedia of Genes and Genomes |
| LC-MS | Liquid chromatography–Mass spectrometry |
| LOLA | L-ornithine-L-aspartate |
| MDA | malondialdehyde |
| MeOH | Methanol |
| MF | Molecular Function |
| NAFLD | nonalcoholic fatty liver disease |
| NCOA4 | nuclear receptor coactivator 4 |
| PBS | phosphate-buffered saline |
| PCA | principal component analysis |
| PLS-DA | partial least squares discrimination analysis |
| PSMs | peptide spectrum matches |
| PUFA | polyunsaturated fatty acid |
| QC | quality control |
| ROS | reactive oxygen species |
| SEM | standard error of mean |
| SPF | specific pathogen-free |
| STEAP3 | six-transmembrane epithelial antigen of prostate 3 |
| TAA | thioacetamide |
| TMT | tandem mass tags |
| UMP | uridine monophosphate |
| VIP | variable importance in projection |
References
- Bajaj, J.S.; Wade, J.B.; Sanyal, A.J. Spectrum of neurocognitive impairment in cirrhosis: Implications for the assessment of hepatic encephalopathy. Hepatology 2009, 50, 2014–2021. [Google Scholar] [CrossRef] [PubMed]
- Balzano, T. Active Clinical Trials in Hepatic Encephalopathy: Something Old, Something New and Something Borrowed. Neurochem. Res. 2023, 48, 2309–2319. [Google Scholar] [CrossRef] [PubMed]
- Patel, D.; McPhail, M.J.; Cobbold, J.F.; Taylor-Robinson, S.D. Hepatic encephalopathy. Br. J. Hosp. Med. 2012, 73, 79–85. [Google Scholar] [CrossRef] [PubMed]
- Tranah, T.H.; Vijay, G.K.; Ryan, J.M.; Shawcross, D.L. Systemic inflammation and ammonia in hepatic encephalopathy. Metab. Brain Dis. 2013, 28, 1–5. [Google Scholar] [CrossRef] [PubMed]
- Vidal-Cevallos, P.; Chavez-Tapia, N.C.; Uribe, M. Current approaches to hepatic encephalopathy. Ann. Hepatol. 2022, 27, 100757. [Google Scholar] [CrossRef] [PubMed]
- Ramakrishna, K.; Sinku, S.; Majumdar, S.; Singh, N.; Gajendra, T.A.; Rani, A.; Krishnamurthy, S. Indole-3-carbinol ameliorated the thioacetamide-induced hepatic encephalopathy in rats. Toxicology 2023, 492, 153542. [Google Scholar] [CrossRef]
- Mincheva, G.; Gimenez-Garzo, C.; Izquierdo-Altarejos, P.; Martinez-Garcia, M.; Doverskog, M.; Blackburn, T.P.; Hallgren, A.; Backstrom, T.; Llansola, M.; Felipo, V. Golexanolone, a GABA(A) receptor modulating steroid antagonist, restores motor coordination and cognitive function in hyperammonemic rats by dual effects on peripheral inflammation and neuroinflammation. CNS Neurosci. Ther. 2022, 28, 1861–1874. [Google Scholar] [CrossRef]
- Liu, X.F.; Lu, J.J.; Li, Y.; Yang, X.Y.; Qiang, J.W. Ferrous sulfate reverses cerebral metabolic abnormality induced by minimal hepatic encephalopathy. Metab. Brain Dis. 2023, 38, 1613–1620. [Google Scholar] [CrossRef]
- Butterworth, R.F. Pathogenesis of hepatic encephalopathy and brain edema in acute liver failure. J. Clin. Exp. Hepatol. 2015, 5, S96–S103. [Google Scholar] [CrossRef]
- Xu, X.Y.; Ding, H.G.; Li, W.G.; Jia, J.D.; Wei, L.; Duan, Z.P.; Liu, Y.L.; Ling-Hu, E.Q.; Zhuang, H.; Hepatology, C.S.O.; et al. Chinese guidelines on management of hepatic encephalopathy in cirrhosis. World J. Gastroenterol. 2019, 25, 5403–5422. [Google Scholar] [CrossRef]
- Jones, E.A.; Basile, A.S.; Yurdaydin, C.; Skolnich, P. Do benzodiazepine ligands contribute to hepatic encephalopathy? Adv. Exp. Med. Biol. 1993, 341, 57–69. [Google Scholar] [CrossRef] [PubMed]
- Williams, E.; Chu, C.; DeMorrow, S. A critical review of bile acids and their receptors in hepatic encephalopathy. Anal. Biochem. 2022, 643, 114436. [Google Scholar] [CrossRef] [PubMed]
- Kong, W.; Sun, X.; Yu, S.; Liu, P.; Zheng, X.; Zhang, J.; Zhu, L.; Jiang, T.; Jin, M.; Gao, J.; et al. Bile duct ligation increased dopamine levels in the cerebral cortex of rats partly due to induction of tyrosine hydroxylase. Br. J. Pharmacol. 2023, 180, 1690–1709. [Google Scholar] [CrossRef] [PubMed]
- Johansson, M.; Agusti, A.; Llansola, M.; Montoliu, C.; Stromberg, J.; Malinina, E.; Ragagnin, G.; Doverskog, M.; Backstrom, T.; Felipo, V. GR3027 antagonizes GABAA receptor-potentiating neurosteroids and restores spatial learning and motor coordination in rats with chronic hyperammonemia and hepatic encephalopathy. Am. J. Physiol. Gastrointest. Liver Physiol. 2015, 309, G400–G409. [Google Scholar] [CrossRef] [PubMed]
- Llansola, M.; Montoliu, C.; Agusti, A.; Hernandez-Rabaza, V.; Cabrera-Pastor, A.; Gomez-Gimenez, B.; Malaguarnera, M.; Dadsetan, S.; Belghiti, M.; Garcia-Garcia, R.; et al. Interplay between glutamatergic and GABAergic neurotransmission alterations in cognitive and motor impairment in minimal hepatic encephalopathy. Neurochem. Int. 2015, 88, 15–19. [Google Scholar] [CrossRef] [PubMed]
- Butterworth, R.F. Neurosteroids in hepatic encephalopathy: Novel insights and new therapeutic opportunities. J. Steroid Biochem. Mol. Biol. 2016, 160, 94–97. [Google Scholar] [CrossRef]
- Jones, E.A. Ammonia, the GABA neurotransmitter system, and hepatic encephalopathy. Metab. Brain Dis. 2002, 17, 275–281. [Google Scholar] [CrossRef]
- Kircheis, G.; Luth, S. Pharmacokinetic and Pharmacodynamic Properties of L-Ornithine L-Aspartate (LOLA) in Hepatic Encephalopathy. Drugs 2019, 79, 23–29. [Google Scholar] [CrossRef]
- Hassouneh, R.; Bajaj, J.S. Gut Microbiota Modulation and Fecal Transplantation: An Overview on Innovative Strategies for Hepatic Encephalopathy Treatment. J. Clin. Med. 2021, 10, 330. [Google Scholar] [CrossRef]
- Philips, C.A.; Augustine, P. Gut Barrier and Microbiota in Cirrhosis. J. Clin. Exp. Hepatol. 2022, 12, 625–638. [Google Scholar] [CrossRef]
- Alimirah, M.; Sadiq, O.; Gordon, S.C. Novel Therapies in Hepatic Encephalopathy. Clin. Liver Dis. 2020, 24, 303–315. [Google Scholar] [CrossRef] [PubMed]
- Gluud, L.L.; Dam, G.; Les, I.; Marchesini, G.; Borre, M.; Aagaard, N.K.; Vilstrup, H. Branched-chain amino acids for people with hepatic encephalopathy. Cochrane Database Syst. Rev. 2017, 5, CD001939. [Google Scholar] [CrossRef] [PubMed]
- Sharma, B.C.; Singh, J.; Srivastava, S.; Sangam, A.; Mantri, A.K.; Trehanpati, N.; Sarin, S.K. Randomized controlled trial comparing lactulose plus albumin versus lactulose alone for treatment of hepatic encephalopathy. J. Gastroenterol. Hepatol. 2017, 32, 1234–1239. [Google Scholar] [CrossRef] [PubMed]
- Bass, N.M.; Mullen, K.D.; Sanyal, A.; Poordad, F.; Neff, G.; Leevy, C.B.; Sigal, S.; Sheikh, M.Y.; Beavers, K.; Frederick, T.; et al. Rifaximin treatment in hepatic encephalopathy. N. Engl. J. Med. 2010, 362, 1071–1081. [Google Scholar] [CrossRef] [PubMed]
- Sharma, B.C.; Sharma, P.; Agrawal, A.; Sarin, S.K. Secondary prophylaxis of hepatic encephalopathy: An open-label randomized controlled trial of lactulose versus placebo. Gastroenterology 2009, 137, 885–891.e1. [Google Scholar] [CrossRef] [PubMed]
- Schnur, J.; Oláh, J.; Szepesi, A.; Nagy, P.; Thorgeirsson, S.S. Thioacetamide-induced hepatic fibrosis in transforming growth factor beta-1 transgenic mice. Eur. J. Gastroenterol. Hepat. 2004, 16, 127–133. [Google Scholar] [CrossRef]
- Amirshahrokhi, K.; Niapour, A. Carvedilol attenuates brain damage in mice with hepatic encephalopathy. Int. Immunopharmacol. 2022, 111, 109119. [Google Scholar] [CrossRef]
- Miranda, A.S.; Rodrigues, D.H.; Vieira, L.B.; Lima, C.X.; Rachid, M.A.; Vidigal, P.V.; Gomez, M.V.; Reis, H.J.; Guatimosim, C.; Teixeira, A.L. A thioacetamide-induced hepatic encephalopathy model in C57BL/6 mice: A behavioral and neurochemical study. Arq. Neuropsiquiatr. 2010, 68, 597–602. [Google Scholar] [CrossRef]
- Avraham, Y.; Grigoriadis, N.C.; Magen, I.; Poutahidis, T.; Vorobiav, L.; Zolotarev, O.; Ilan, Y.; Mechoulam, R.; Berry, E.M. Capsaicin affects brain function in a model of hepatic encephalopathy associated with fulminant hepatic failure in mice. Br. J. Pharmacol. 2009, 158, 896–906. [Google Scholar] [CrossRef]
- Butterworth, R.F. Pathophysiology of Hepatic Encephalopathy: Studies in Animal Models. In Metabolic Encephalopathy; McCandless, D.W., Ed.; Springer: New York, NY, USA, 2009; pp. 149–180. [Google Scholar]
- Swapna, I.; Kumar, K.V.; Reddy, P.V.; Murthy Ch, R.; Reddanna, P.; Senthilkumaran, B. Phospholipid and cholesterol alterations accompany structural disarray in myelin membrane of rats with hepatic encephalopathy induced by thioacetamide. Neurochem. Int. 2006, 49, 238–244. [Google Scholar] [CrossRef]
- Sathyasaikumar, K.V.; Swapna, I.; Reddy, P.V.; Murthy Ch, R.; Roy, K.R.; Dutta Gupta, A.; Senthilkumaran, B.; Reddanna, P. Co-administration of C-Phycocyanin ameliorates thioacetamide-induced hepatic encephalopathy in Wistar rats. J. Neurol. Sci. 2007, 252, 67–75. [Google Scholar] [CrossRef] [PubMed]
- Ross, P.L.; Huang, Y.N.; Marchese, J.N.; Williamson, B.; Parker, K.; Hattan, S.; Khainovski, N.; Pillai, S.; Dey, S.; Daniels, S.; et al. Multiplexed protein quantitation in Saccharomyces cerevisiae using amine-reactive isobaric tagging reagents. Mol. Cell Proteom. 2004, 3, 1154–1169. [Google Scholar] [CrossRef] [PubMed]
- Essam, R.M.; Saadawy, M.A.; Gamal, M.; Abdelsalam, R.M.; El-Sahar, A.E. Lactoferrin averts neurological and behavioral impairments of thioacetamide-induced hepatic encephalopathy in rats via modulating HGMB1/TLR-4/MyD88/Nrf2 pathway. Neuropharmacology 2023, 236, 109575. [Google Scholar] [CrossRef] [PubMed]
- Asano, F.; Moriwaki, H.; Shiratori, Y.; Shimazaki, M.; Sakai, T.; Koshino, Y.; Murakami, N.; Sugihara, J.; Ohnishi, H.; Saito, K.; et al. Enhanced production of leukotriene B4 by peripheral blood mononuclear cells in patients with fulminant hepatitis. J. Gastroenterol. Hepatol. 1993, 8, 228–231. [Google Scholar] [CrossRef] [PubMed]
- Bissonnette, J.; Rose, C.F. Hepatic Encephalopathy: Pathophysiology—Brain. In Diagnosis and Management of Hepatic Encephalopathy: A Case-based Guide; Bajaj, J.S., Ed.; Springer International Publishing: Cham, Switzerland, 2018; pp. 15–29. [Google Scholar]
- Ma, S.X.; Seo, B.A.; Kim, D.; Xiong, Y.; Kwon, S.H.; Brahmachari, S.; Kim, S.; Kam, T.I.; Nirujogi, R.S.; Kwon, S.H.; et al. Complement and Coagulation Cascades are Potentially Involved in Dopaminergic Neurodegeneration in alpha-Synuclein-Based Mouse Models of Parkinson’s Disease. J. Proteome Res. 2021, 20, 3428–3443. [Google Scholar] [CrossRef] [PubMed]
- Yang, X.; Wang, Z.; Kai, J.; Wang, F.; Jia, Y.; Wang, S.; Tan, S.; Shen, X.; Chen, A.; Shao, J.; et al. Curcumol attenuates liver sinusoidal endothelial cell angiogenesis via regulating Glis-PROX1-HIF-1alpha in liver fibrosis. Cell Prolif. 2020, 53, e12762. [Google Scholar] [CrossRef] [PubMed]
- Arenas, Y.M.; Felipo, V. Sustained Hyperammonemia Activates NF-kappaB in Purkinje Neurons Through Activation of the TrkB-PI3K-AKT Pathway by Microglia-Derived BDNF in a Rat Model of Minimal Hepatic Encephalopathy. Mol. Neurobiol. 2023, 60, 3071–3085. [Google Scholar] [CrossRef]
- Abdelaziz, R.R.; Abdelrahman, R.S.; Abdelmageed, M.E. SB332235, a CXCR2 antagonist, ameliorates thioacetamide-induced hepatic encephalopathy through modulation of the PI3K/AKT pathways in rats. Neurotoxicology 2022, 92, 110–121. [Google Scholar] [CrossRef]
- Ding, T.; Chen, S.; Xiao, W.; Liu, Z.; Tu, J.; Yu, Y.; Dong, B.; Chen, W.; Zeng, Y. Six-Transmembrane Epithelial Antigen of Prostate 3 Promotes Hepatic Insulin Resistance and Steatosis. J. Lipid Res. 2023, 64, 100318. [Google Scholar] [CrossRef]
- Guo, W.Z.; Fang, H.B.; Cao, S.L.; Chen, S.Y.; Li, J.; Shi, J.H.; Tang, H.W.; Zhang, Y.; Wen, P.H.; Zhang, J.K.; et al. Six-Transmembrane Epithelial Antigen of the Prostate 3 Deficiency in Hepatocytes Protects the Liver Against Ischemia-Reperfusion Injury by Suppressing Transforming Growth Factor-beta-Activated Kinase 1. Hepatology 2020, 71, 1037–1054. [Google Scholar] [CrossRef]
- Chen, X.; Li, J.; Kang, R.; Klionsky, D.J.; Tang, D. Ferroptosis: Machinery and regulation. Autophagy 2021, 17, 2054–2081. [Google Scholar] [CrossRef] [PubMed]
- Stockwell, B.R.; Jiang, X.; Gu, W. Emerging Mechanisms and Disease Relevance of Ferroptosis. Trends Cell Biol. 2020, 30, 478–490. [Google Scholar] [CrossRef] [PubMed]
- Costa, I.; Barbosa, D.J.; Benfeito, S.; Silva, V.; Chavarria, D.; Borges, F.; Remiao, F.; Silva, R. Molecular mechanisms of ferroptosis and their involvement in brain diseases. Pharmacol. Ther. 2023, 244, 108373. [Google Scholar] [CrossRef] [PubMed]
- Cardoso, B.R.; Hare, D.J.; Bush, A.I.; Roberts, B.R. Glutathione peroxidase 4: A new player in neurodegeneration? Mol. Psychiatry 2017, 22, 328–335. [Google Scholar] [CrossRef] [PubMed]
- Wang, C.; Chen, S.; Guo, H.; Jiang, H.; Liu, H.; Fu, H.; Wang, D. Forsythoside A Mitigates Alzheimer’s-like Pathology by Inhibiting Ferroptosis-mediated Neuroinflammation via Nrf2/GPX4 Axis Activation. Int. J. Biol. Sci. 2022, 18, 2075–2090. [Google Scholar] [CrossRef]
- Zhan, S.; Lu, L.; Pan, S.S.; Wei, X.Q.; Miao, R.R.; Liu, X.H.; Xue, M.; Lin, X.K.; Xu, H.L. Targeting NQO1/GPX4-mediated ferroptosis by plumbagin suppresses in vitro and in vivo glioma growth. Br. J. Cancer 2022, 127, 364–376. [Google Scholar] [CrossRef]
- Mao, C.; Liu, X.G.; Zhang, Y.L.; Lei, G.; Yan, Y.L.; Lee, H.M.; Koppula, P.; Wu, S.Q.; Zhuang, L.; Fang, B.L.; et al. DHODH-mediated ferroptosis defence is a targetable vulnerability in cancer. Nature 2021, 593, 586–590, Erratum in Nature 2021, 596, E13. [Google Scholar] [CrossRef]
- Wen, B.; Mei, Z.; Zeng, C.; Liu, S. metaX: A flexible and comprehensive software for processing metabolomics data. BMC Bioinform. 2017, 18, 183. [Google Scholar] [CrossRef]


| No. | Name | log2FC | p Value | ROC | VIP | Up/Down |
|---|---|---|---|---|---|---|
| 1 | L-Glutamic acid | −0.7148 | 0.0000 | 1.0000 | 1.7550 | down |
| 2 | Adenine | −1.8026 | 0.0003 | 1.0000 | 1.4061 | down |
| 3 | Adenosine | −4.2551 | 0.0011 | 1.0000 | 1.3706 | down |
| 4 | Cytidine | −1.3588 | 0.0256 | 0.8611 | 1.0604 | down |
| 5 | L-Glutathione (reduced) | −2.0501 | 0.0288 | 0.9167 | 1.0914 | down |
| 6 | UDP-N-acetylglucosamine | −1.5685 | 0.0290 | 0.8611 | 1.1164 | down |
| 7 | S-Adenosylmethionine | −1.8971 | 0.0177 | 1.0000 | 1.1697 | down |
| 8 | N-Acetyl-DL-glutamic acid | −0.9836 | 0.0323 | 0.7778 | 1.1143 | down |
| 9 | 5′-S-Methyl-5′-thioadenosine | −1.2561 | 0.0350 | 0.7222 | 1.1118 | down |
| 10 | Υ-Glutamylcysteine | −1.1471 | 0.0426 | 0.7222 | 1.0854 | down |
| 11 | 5-Hydroxyindole-3-acetic acid | −0.8199 | 0.0470 | 0.7778 | 1.0177 | down |
| 12 | Cytidine 5′-monophosphate (hydrate) | −0.8442 | 0.0475 | 0.8056 | 1.0850 | down |
| 13 | Inosine | −0.7601 | 0.0481 | 0.7778 | 1.0709 | down |
| 14 | α-Aspartylphenylalanine | −2.4091 | 0.0482 | 0.8056 | 1.1948 | down |
| 15 | L-Glutathione oxidized | −1.1454 | 0.0490 | 0.8333 | 1.0628 | down |
| 16 | α-D-Glucose-1,6-bisphosphate | −1.6690 | 0.0388 | 0.8333 | 1.0271 | down |
| 17 | N-Acetylneuraminic acid | −0.5952 | 0.0001 | 1.0000 | 1.4531 | down |
| 18 | 5-Aminolevulinic acid | −0.9738 | 0.0017 | 1.0000 | 1.2759 | down |
| 19 | Adenosine 5′-monophosphate | −3.0832 | 0.0023 | 0.9444 | 1.2062 | down |
| 20 | Ascorbic acid | −0.9980 | 0.0129 | 0.8889 | 1.1806 | down |
| 21 | O-Phosphorylethanolamine | −1.0382 | 0.0368 | 0.9444 | 1.0457 | down |
| 22 | Uridine monophosphate (UMP) | −1.6295 | 0.0232 | 0.8611 | 1.1090 | down |
| 23 | Guanosine monophosphate (GMP) | −1.6259 | 0.0234 | 0.9167 | 1.0563 | down |
| 24 | N6-Acetyl-L-lysine | 0.5880 | 0.0499 | 0.8333 | 1.0435 | up |
| 25 | N-Acetyl-L-tyrosine | 2.1337 | 0.0158 | 0.9167 | 1.1105 | up |
| 26 | L-Histidine | 2.2341 | 0.0065 | 1.0000 | 1.2401 | up |
| 27 | Hippuric acid | 2.6338 | 0.0273 | 0.8611 | 1.0633 | up |
| 28 | N2-Methylguanosine | 2.7800 | 0.0330 | 0.7222 | 1.0859 | up |
| 29 | Xanthosine | 4.1746 | 0.0179 | 0.8611 | 1.1467 | up |
| 30 | N-Acetyl-L-phenylalanine | 2.1029 | 0.0189 | 0.9167 | 1.1265 | up |
| 31 | L-Tyrosine | 1.2616 | 0.0443 | 0.7222 | 1.0675 | up |
| 32 | N-Acetyl-DL-tryptophan | 1.7116 | 0.0223 | 0.8333 | 1.0564 | up |
| 33 | Argininosuccinic acid | 1.0689 | 0.0018 | 0.9444 | 1.2466 | up |
| 34 | N3,N4-Dimethyl-L-arginine | 2.6446 | 0.0020 | 0.9722 | 1.3649 | up |
| 35 | L-Phenylalanine | 1.4515 | 0.0031 | 1.0000 | 1.3137 | up |
| 36 | Uracil | 1.8273 | 0.0047 | 1.0000 | 1.2165 | up |
| 37 | DL-Tryptophan | 1.4018 | 0.0062 | 1.0000 | 1.2632 | up |
| 38 | L(+)-Ornithine | 3.8581 | 0.0063 | 0.8611 | 1.2678 | up |
| 39 | Proline | 3.7575 | 0.0063 | 0.8611 | 1.2684 | up |
| 40 | γ-aminobutyric acid | 2.3444 | 0.0067 | 1.0000 | 1.2419 | up |
| 41 | Thiamine | 0.9335 | 0.0081 | 0.9444 | 1.1754 | up |
| 42 | Indole-3-acetic acid | 1.0212 | 0.0089 | 0.9167 | 1.1264 | up |
| 43 | Nicotinamide | 3.0732 | 0.0388 | 0.7222 | 1.0653 | up |
| 44 | DL-Lysine | 2.0674 | 0.0141 | 0.9167 | 1.1979 | up |
| 45 | L-Isoleucine | 1.7751 | 0.0158 | 0.9444 | 1.1804 | up |
| 46 | L-(+)-Citrulline | 3.7701 | 0.0245 | 0.8611 | 1.1390 | up |
| 47 | Threonine | 0.8236 | 0.0246 | 0.8333 | 1.0965 | up |
| 48 | N-Acetyl-L-leucine | 2.3822 | 0.0442 | 0.7222 | 1.0795 | up |
| 49 | Riboflavin | 1.9154 | 0.0260 | 0.8611 | 1.0731 | up |
| 50 | Leukotriene B4 | 1.0947 | 0.0405 | 0.8333 | 1.0335 | up |
| Time (min) | Flow Rate (mL/min) | Mobile Phase A (%) | Mobile Phase B (%) |
|---|---|---|---|
| 0 | 1 | 97 | 3 |
| 10 | 1 | 95 | 5 |
| 30 | 1 | 80 | 20 |
| 48 | 1 | 60 | 40 |
| 50 | 1 | 50 | 50 |
| 53 | 1 | 30 | 70 |
| 54 | 1 | 0 | 100 |
| Time (min) | Flow Rate (mL/min) | Mobile Phase A (%) | Mobile Phase B (%) |
|---|---|---|---|
| 0 | 0.6 | 94 | 6 |
| 2 | 0.6 | 85 | 15 |
| 48 | 0.6 | 60 | 40 |
| 50 | 0.6 | 50 | 50 |
| 51 | 0.6 | 45 | 55 |
| 60 | 0.6 | 0 | 100 |
Disclaimer/Publisher’s Note: The statements, opinions and data contained in all publications are solely those of the individual author(s) and contributor(s) and not of MDPI and/or the editor(s). MDPI and/or the editor(s) disclaim responsibility for any injury to people or property resulting from any ideas, methods, instructions or products referred to in the content. |
© 2023 by the authors. Licensee MDPI, Basel, Switzerland. This article is an open access article distributed under the terms and conditions of the Creative Commons Attribution (CC BY) license (https://creativecommons.org/licenses/by/4.0/).
Share and Cite
Guo, H.; Wang, G.; Huang, W.; Li, L.; Bai, Y.; Wang, H.; Gao, L. The Mechanism of Hepatic Encephalopathy Induced by Thioacetamide Based on Metabolomics and Proteomics: A Preliminary Study. Int. J. Mol. Sci. 2024, 25, 284. https://doi.org/10.3390/ijms25010284
Guo H, Wang G, Huang W, Li L, Bai Y, Wang H, Gao L. The Mechanism of Hepatic Encephalopathy Induced by Thioacetamide Based on Metabolomics and Proteomics: A Preliminary Study. International Journal of Molecular Sciences. 2024; 25(1):284. https://doi.org/10.3390/ijms25010284
Chicago/Turabian StyleGuo, Honghui, Guang Wang, Wei Huang, Lingrui Li, Yang Bai, Haifeng Wang, and Lina Gao. 2024. "The Mechanism of Hepatic Encephalopathy Induced by Thioacetamide Based on Metabolomics and Proteomics: A Preliminary Study" International Journal of Molecular Sciences 25, no. 1: 284. https://doi.org/10.3390/ijms25010284