
Concordance between the In Vivo Content of Neurospecific Proteins (BDNF, NSE, VILIP-1, S100B) in the Hippocampus and Blood in Patients with Epilepsy

 , , ,
, , ,  and
and
Abstract
:1. Introduction
2. Results
2.1. BDNF
2.2. NSE
2.3. S100B
2.4. VILIP-1
3. Discussion
Limitations
4. Materials and Methods
4.1. Patients
4.2. Sampling Procedures
4.3. Biochemical Analysis
4.4. Immunohistochemical (IHC) Analysis
4.5. Statistical Analysis
5. Conclusions
Supplementary Materials
Author Contributions
Funding
Institutional Review Board Statement
Informed Consent Statement
Data Availability Statement
Acknowledgments
Conflicts of Interest
Abbreviations
| ATP | adenosine triphosphate |
| a.u. | arbitrary units |
| BBB | blood–brain barrier |
| BDNF | brain-derived neurotrophic factor |
| CNS | central nervous system |
| CSF | cerebrospinal fluid |
| DAPI | 4′,6-diamidino-2-phenylindole (a marker of a cell nucleus) |
| EEG | electroencephalography |
| GDNF | glial-cell-line-derived neurotrophic factor |
| HG | hippocampal gliosis |
| HS | hippocampal sclerosis |
| IHC | immunohistochemical analysis |
| IL | interleukin |
| ILAE | International League Against Epilepsy |
| MRI | magnetic resonance imaging |
| MTLE | mesial temporal lobe epilepsy |
| NMDA | N-methyl-D-aspartate |
| n.s. | not significant |
| NSE | neuron-specific enolase |
| PBMCs | peripheral blood mononuclear cells |
| PBS | phosphate-buffered saline |
| S100B | S100 calcium-binding protein B |
| TBI | traumatic brain injury |
| VILIP-1 | visinin-like protein 1 |
References
- Benarroch, E.E. Brain-derived neurotrophic factor: Regulation, effects, and potential clinical relevance. Neurology 2015, 84, 1693–1704. [Google Scholar] [CrossRef] [PubMed]
- Lu, B.; Nagappan, G.; Guan, X.; Nathan, P.J.; Wren, P. BDNF-based synaptic repair as a disease-modifying strategy for neurodegenerative diseases. Nat. Rev. Neurosci. 2013, 14, 401–416. [Google Scholar] [CrossRef] [PubMed]
- Fujimura, H.; Altar, C.A.; Chen, R.; Nakamura, T.; Nakahashi, T.; Kambayashi, J.; Sun, B.; Tandon, N.N. Brain-derived neurotrophic factor is stored in human platelets and released by agonist stimulation. Thromb. Haemost. 2002, 87, 728–734. [Google Scholar] [CrossRef] [PubMed]
- Cattaneo, A.; Cattane, N.; Begni, V.; Pariante, C.M.; Riva, M.A. The human BDNF gene: Peripheral gene expression and protein levels as biomarkers for psychiatric disorders. Transl. Psychiatry 2016, 6, e958. [Google Scholar] [CrossRef] [PubMed]
- Fontanesi, C.; Kvint, S.; Frazzitta, G.; Bera, R.; Ferrazzoli, D.; Di Rocco, A.; Rebholz, H.; Friedman, E.; Pezzoli, G.; Quartarone, A.; et al. Intensive Rehabilitation Enhances Lymphocyte BDNF-TrkB Signaling in Patients With Parkinson’s Disease. Neurorehabilit. Neural Repair 2016, 30, 411–418. [Google Scholar] [CrossRef] [PubMed]
- Wang, H.Y.; Crupi, D.; Liu, J.; Stucky, A.; Cruciata, G.; Di Rocco, A.; Friedman, E.; Quartarone, A.; Ghilardi, M.F. Repetitive transcranial magnetic stimulation enhances BDNF-TrkB signaling in both brain and lymphocyte. J. Neurosci. 2011, 31, 11044–11054. [Google Scholar] [CrossRef] [PubMed]
- Carlino, D.; Leone, E.; Di Cola, F.; Baj, G.; Marin, R.; Dinelli, G.; Tongiorgi, E.; De Vanna, M. Low serum truncated-BDNF isoform correlates with higher cognitive impairment in schizophrenia. J. Psychiatr. Res. 2011, 45, 273–279. [Google Scholar] [CrossRef] [PubMed]
- Shvaikovskaya, A.A.; Zhanaeva, S.Y.; Evsyukova, A.V.; Tikhonova, M.A.; Danilenko, K.V.; Aftanas, L.I. Brain neurotrophic factor (BDNF) and its diagnostic significance when measured in blood: Analytical review. Yakut Med. J. 2020, 71, 102–107. [Google Scholar] [CrossRef]
- Tikhonova, M.A.; Zhanaeva, S.Y.; Shvaikovskaya, A.A.; Olkov, N.M.; Aftanas, L.I.; Danilenko, K.V. Neurospecific Molecules Measured in Periphery in Humans: How Do They Correlate with the Brain Levels? A Systematic Review. Int. J. Mol. Sci. 2022, 23, 9193. [Google Scholar] [CrossRef]
- Marangos, P.J.; Schmechel, D.E. Neuron specific enolase, a clinically useful marker for neurons and neuroendocrine cells. Annu. Rev. Neurosci. 1987, 10, 269–295. [Google Scholar] [CrossRef]
- Maiti, R.; Mishra, B.R.; Sanyal, S.; Mohapatra, D.; Parida, S.; Mishra, A. Effect of carbamazepine and oxcarbazepine on serum neuron-specific enolase in focal seizures: A randomized controlled trial. Epilepsy Res. 2017, 138, 5–10. [Google Scholar] [CrossRef]
- Correale, J.; Rabinowicz, A.L.; Heck, C.N.; Smith, T.D.; Loskota, W.J.; DeGiorgio, C.M. Status epilepticus increases CSF levels of neuron-specific enolase and alters the blood-brain barrier. Neurology 1998, 50, 1388–1391. [Google Scholar] [CrossRef] [PubMed]
- DeGiorgio, C.M.; Correale, J.D.; Gott, P.S.; Ginsburg, D.L.; Bracht, K.A.; Smith, T.; Boutros, R.; Loskota, W.J.; Rabinowicz, A.L. Serum neuron-specific enolase in human status epilepticus. Neurology 1995, 45, 1134–1137. [Google Scholar] [CrossRef] [PubMed]
- Notomi, T.; Morikawa, J.; Kato, K.; Tsuchida, Y.; Ohsawa, R. Radioimmunoassay development for human neuron-specific enolase: With some clinical results in lung cancers and neuroblastoma. Tumour Biol. 1985, 6, 57–66. [Google Scholar] [PubMed]
- Pahlman, S.; Esscher, T.; Bergvall, P.; Odelstad, L. Purification and characterization of human neuron-specific enolase: Radioimmunoassay development. Tumour Biol. 1984, 5, 127–139. [Google Scholar] [PubMed]
- Johnsson, P.; Blomquist, S.; Luhrs, C.; Malmkvist, G.; Alling, C.; Solem, J.O.; Stahl, E. Neuron-specific enolase increases in plasma during and immediately after extracorporeal circulation. Ann. Thorac. Surg. 2000, 69, 750–754. [Google Scholar] [CrossRef] [PubMed]
- Braunewell, K.H.; Klein-Szanto, A.J. Visinin-like proteins (VSNLs): Interaction partners and emerging functions in signal transduction of a subfamily of neuronal Ca2+-sensor proteins. Cell Tissue Res. 2009, 335, 301–316. [Google Scholar] [CrossRef] [PubMed]
- Saenger, A.K.; Christenson, R.H. Stroke biomarkers: Progress and challenges for diagnosis, prognosis, differentiation, and treatment. Clin. Chem. 2010, 56, 21–33. [Google Scholar] [CrossRef] [PubMed]
- Stejskal, D.; Sporova, L.; Svestak, M.; Karpisek, M. Determination of serum visinin like protein-1 and its potential for the diagnosis of brain injury due to the stroke: A pilot study. Biomed. Pap. Med. Fac. Univ. Palacky. Olomouc Czech Repub. 2011, 155, 263–268. [Google Scholar] [CrossRef]
- Groblewska, M.; Muszynski, P.; Wojtulewska-Supron, A.; Kulczynska-Przybik, A.; Mroczko, B. The Role of Visinin-Like Protein-1 in the Pathophysiology of Alzheimer’s Disease. J. Alzheimers Dis. 2015, 47, 17–32. [Google Scholar] [CrossRef]
- Marchi, N.; Cavaglia, M.; Fazio, V.; Bhudia, S.; Hallene, K.; Janigro, D. Peripheral markers of blood-brain barrier damage. Clin. Chim. Acta 2004, 342, 1–12. [Google Scholar] [CrossRef] [PubMed]
- Tan, Z.; Jiang, J.; Tian, F.; Peng, J.; Yang, Z.; Li, S.; Long, X. Serum Visinin-Like Protein 1 Is a Better Biomarker Than Neuron-Specific Enolase for Seizure-Induced Neuronal Injury: A Prospective and Observational Study. Front. Neurol. 2020, 11, 567587. [Google Scholar] [CrossRef] [PubMed]
- Kacinski, M.; Budziszewska, B.; Lason, W.; Zajac, A.; Skowronek-Bala, B.; Leskiewicz, M.; Kubik, A.; Basta-Kaim, A. Level of S100B protein, neuron specific enolase, orexin A, adiponectin and insulin-like growth factor in serum of pediatric patients suffering from sleep disorders with or without epilepsy. Pharmacol. Rep. 2012, 64, 1427–1433. [Google Scholar] [CrossRef] [PubMed]
- Sendrowski, K.; Sobaniec, W.; Sobaniec-Lotowska, M.E.; Lewczuk, P. S-100 protein as marker of the blood-brain barrier disruption in children with internal hydrocephalus and epilepsy—A preliminary study. Rocz. Akad. Med. Bialymst. 2004, 49 (Suppl. S1), 236–238. [Google Scholar] [PubMed]
- Steinhoff, B.J.; Tumani, H.; Otto, M.; Mursch, K.; Wiltfang, J.; Herrendorf, G.; Bittermann, H.J.; Felgenhauer, K.; Paulus, W.; Markakis, E. Cisternal S100 protein and neuron-specific enolase are elevated and site-specific markers in intractable temporal lobe epilepsy. Epilepsy Res. 1999, 36, 75–82. [Google Scholar] [CrossRef] [PubMed]
- Walker, L.E.; Janigro, D.; Heinemann, U.; Riikonen, R.; Bernard, C.; Patel, M. WONOEP appraisal: Molecular and cellular biomarkers for epilepsy. Epilepsia 2016, 57, 1354–1362. [Google Scholar] [CrossRef] [PubMed]
- Gadad, B.S.; Vargas-Medrano, J.; Ramos, E.I.; Najera, K.; Fagan, M.; Forero, A.; Thompson, P.M. Altered levels of interleukins and neurotrophic growth factors in mood disorders and suicidality: An analysis from periphery to central nervous system. Transl. Psychiatry 2021, 11, 341. [Google Scholar] [CrossRef]
- Sian-Hulsmann, J.; Monoranu, C.M.; Grunblatt, E.; Riederer, P. Neurochemical markers as potential indicators of postmortem tissue quality. Handb. Clin. Neurol. 2018, 150, 119–127. [Google Scholar] [CrossRef]
- Barker, R.; Wellington, D.; Esiri, M.M.; Love, S. Assessing white matter ischemic damage in dementia patients by measurement of myelin proteins. J. Cereb. Blood Flow Metab. 2013, 33, 1050–1057. [Google Scholar] [CrossRef]
- Lago, S.G.; Tomasik, J.; van Rees, G.F.; Steeb, H.; Cox, D.A.; Rustogi, N.; Ramsey, J.M.; Bishop, J.A.; Petryshen, T.; Haggarty, S.J.; et al. Drug discovery for psychiatric disorders using high-content single-cell screening of signaling network responses ex vivo. Sci. Adv. 2019, 5, eaau9093. [Google Scholar] [CrossRef]
- Begliuomini, S.; Lenzi, E.; Ninni, F.; Casarosa, E.; Merlini, S.; Pluchino, N.; Valentino, V.; Luisi, S.; Luisi, M.; Genazzani, A.R. Plasma brain-derived neurotrophic factor daily variations in men: Correlation with cortisol circadian rhythm. J. Endocrinol. 2008, 197, 429–435. [Google Scholar] [CrossRef] [PubMed]
- Tongiorgi, E.; Domenici, L.; Simonato, M. What is the biological significance of BDNF mRNA targeting in the dendrites? Clues from epilepsy and cortical development. Mol. Neurobiol. 2006, 33, 17–32. [Google Scholar] [CrossRef] [PubMed]
- Shetty, A.K.; Zaman, V.; Shetty, G.A. Hippocampal neurotrophin levels in a kainate model of temporal lobe epilepsy: A lack of correlation between brain-derived neurotrophic factor content and progression of aberrant dentate mossy fiber sprouting. J. Neurochem. 2003, 87, 147–159. [Google Scholar] [CrossRef] [PubMed]
- Zhand, A.; Sayad, A.; Ghafouri-Fard, S.; Arsang-Jang, S.; Mazdeh, M.; Taheri, M. Expression analysis of GRIN2B, BDNF, and IL-1beta genes in the whole blood of epileptic patients. Neurol. Sci. 2018, 39, 1945–1953. [Google Scholar] [CrossRef] [PubMed]
- Chen, S.F.; Jou, S.B.; Chen, N.C.; Chuang, H.Y.; Huang, C.R.; Tsai, M.H.; Tan, T.Y.; Tsai, W.C.; Chang, C.C.; Chuang, Y.C. Serum Levels of Brain-Derived Neurotrophic Factor and Insulin-Like Growth Factor 1 Are Associated With Autonomic Dysfunction and Impaired Cerebral Autoregulation in Patients With Epilepsy. Front. Neurol. 2018, 9, 969. [Google Scholar] [CrossRef] [PubMed]
- Sorokina, E.G.; Semenova, Z.B.; Averianova, N.S.; Karaseva, O.V.; Arsenieva, E.N.; Luk’yanov, V.I.; Reutov, V.P.; Asanov, A.Y.; Roshal, L.M.; Pinelis, V.G. Polymorphism of the APOE Gene and Markers of Brain Damage in the Outcomes of Severe Traumatic Brain Injury in Children. Neurosci. Behav. Physiol. 2021, 51, 28–35. [Google Scholar] [CrossRef]
- Bharani, K.L.; Ledreux, A.; Gilmore, A.; Carroll, S.L.; Granholm, A.C. Serum pro-BDNF levels correlate with phospho-tau staining in Alzheimer’s disease. Neurobiol. Aging 2020, 87, 49–59. [Google Scholar] [CrossRef] [PubMed]
- Shvaikovskaya, A.A.; Zhanaeva, S.Y.; Olkov, N.M.; Moysak, G.I.; Danilenko, K.V.; Aftanas, L.I.; Tikhonova, M.A. Concordance between the in vivo concentrations of neurospecific proteins (BDNF, NSE) in the brain and blood in patients with epilepsy. In Proceedings of the Bioinformatics of Genome Regulation and Structure/Systems Biology (BGRS/SB-2022): The Thirteenth International Multiconference, Novosibirsk, Russia, 4–8 July 2022; Institute of Cytology and Genetics, The Siberian Branch of the Russian Academy of Sciences: Novosibirsk, Russia, 2022; p. 961. [Google Scholar]
- Filimonova, E.A.; Pashkov, A.A.; Moysak, G.I.; Tropynina, A.Y.; Zhanaeva, S.Y.; Shvaikovskaya, A.A.; Akopyan, A.A.; Danilenko, K.V.; Aftanas, L.I.; Tikhonova, M.A.; et al. Brain but not serum BDNF levels are associated with structural alterations in the hippocampal regions in patients with drug-resistant mesial temporal lobe epilepsy. Front. Neurosci. 2023, 17, 1217702. [Google Scholar] [CrossRef]
- Araujo, B.; Torres, L.; Stein, M.; Cabral, F.R.; Herai, R.; Okamoto, O.; Cavalheiro, E. Decreased expression of proteins involved in energy metabolism in the hippocampal granular layer of rats submitted to the pilocarpine epilepsy model. Neurosci. Lett. 2014, 561, 46–51. [Google Scholar] [CrossRef]
- Yardimoglu, M.; Ilbay, G.; Dalcik, C.; Dalcik, H.; Sahin, D.; Ates, N. Immunocytochemistry of neuron specific enolase (NSE) in the rat brain after single and repeated epileptic seizures. Int. J. Neurosci. 2008, 118, 981–993. [Google Scholar] [CrossRef]
- Isgro, M.A.; Bottoni, P.; Scatena, R. Neuron-Specific Enolase as a Biomarker: Biochemical and Clinical Aspects. Adv. Exp. Med. Biol. 2015, 867, 125–143. [Google Scholar] [CrossRef]
- Bajetta, E.; Ferrari, L.; Martinetti, A.; Celio, L.; Procopio, G.; Artale, S.; Zilembo, N.; Di Bartolomeo, M.; Seregni, E.; Bombardieri, E. Chromogranin A, neuron specific enolase, carcinoembryonic antigen, and hydroxyindole acetic acid evaluation in patients with neuroendocrine tumors. Cancer 1999, 86, 858–865. [Google Scholar] [CrossRef]
- Missler, U.; Wiesmann, M.; Friedrich, C.; Kaps, M. S-100 protein and neuron-specific enolase concentrations in blood as indicators of infarction volume and prognosis in acute ischemic stroke. Stroke 1997, 28, 1956–1960. [Google Scholar] [CrossRef] [PubMed]
- Oh, S.H.; Lee, J.G.; Na, S.J.; Park, J.H.; Choi, Y.C.; Kim, W.J. Prediction of early clinical severity and extent of neuronal damage in anterior-circulation infarction using the initial serum neuron-specific enolase level. Arch. Neurol. 2003, 60, 37–41. [Google Scholar] [CrossRef] [PubMed]
- Wunderlich, M.T.; Lins, H.; Skalej, M.; Wallesch, C.W.; Goertler, M. Neuron-specific enolase and tau protein as neurobiochemical markers of neuronal damage are related to early clinical course and long-term outcome in acute ischemic stroke. Clin. Neurol. Neurosurg. 2006, 108, 558–563. [Google Scholar] [CrossRef] [PubMed]
- Zeltzer, P.M.; Marangos, P.J.; Parma, A.M.; Sather, H.; Dalton, A.; Hammond, D.; Siegel, S.E.; Seeger, R.C. Raised neuron-specific enolase in serum of children with metastatic neuroblastoma. A report from the Children’s Cancer Study Group. Lancet 1983, 2, 361–363. [Google Scholar] [CrossRef] [PubMed]
- Lee, S.Y.; Choi, Y.C.; Kim, J.H.; Kim, W.J. Serum neuron-specific enolase level as a biomarker in differential diagnosis of seizure and syncope. J. Neurol. 2010, 257, 1708–1712. [Google Scholar] [CrossRef] [PubMed]
- Cronberg, T.; Rundgren, M.; Westhall, E.; Englund, E.; Siemund, R.; Rosen, I.; Widner, H.; Friberg, H. Neuron-specific enolase correlates with other prognostic markers after cardiac arrest. Neurology 2011, 77, 623–630. [Google Scholar] [CrossRef]
- Sorokina, E.G.; Semenova, Z.B.; Reutov, V.P.; Arsenieva, E.N.; Karaseva, O.V.; Fisenko, A.P.; Roshal, L.M.; Pinelis, V.G. Brain Biomarkers in Children After Mild and Severe Traumatic Brain Injury. Acta Neurochir. Suppl. 2021, 131, 103–107. [Google Scholar] [CrossRef]
- Zhang, Y.; Zhang, S.; Ji, Y.; Yang, X.; Liu, P.; Yu, G. Relationship of serum ATPase activity and the levels of neuron- specific enolase, S100B and B-cell lymphoma/leukemia-2 with cognitive function after epileptic seizure. Ann. Palliat. Med. 2020, 9, 3366–3372. [Google Scholar] [CrossRef]
- Eriksson, H.; Banote, R.K.; Larsson, D.; Blennow, K.; Zetterberg, H.; Zelano, J. Brain injury markers in new-onset seizures in adults: A pilot study. Seizure 2021, 92, 62–67. [Google Scholar] [CrossRef]
- Kwan, P.; Arzimanoglou, A.; Berg, A.T.; Brodie, M.J.; Allen Hauser, W.; Mathern, G.; Moshe, S.L.; Perucca, E.; Wiebe, S.; French, J. Definition of drug resistant epilepsy: Consensus proposal by the ad hoc Task Force of the ILAE Commission on Therapeutic Strategies. Epilepsia 2010, 51, 1069–1077. [Google Scholar] [CrossRef]


| Analyte | Type of Analysis/Tissue | ||||
|---|---|---|---|---|---|
| Biochemical Analysis | IHC Analysis | ||||
| Hippocampus (pg/mg of Protein) | Blood | Hippocampus (a.u.) | Blood | ||
| Serum (pg/mL) | PBMCs (pg/mg of Protein) | PBMCs (a.u.) | |||
| BDNF | 224.8 (138.0; 361.1) (N = 38) | 3458.7 (2707.6; 3891.9) (N = 41) | 1243.2 (623.2; 2169.8) (N = 40) | 0.027 (0.017; 0.037) (N = 43) | 3.222 (2.14; 3.811) (N = 43) |
| NSE | 4077.3 (2593.0; 5722.2) (N = 40) | 1.8 (1.2; 2.8) (N = 40) | 67.1 (33.1; 154.3) (N = 40) | 0.0095 (0.0064; 0.0148) (N = 43) | 3.749 (3.163; 5.163) (N = 42) |
| VILIP-1 | 98.6 (65.4; 190.4) (N = 39) | 244.72 (155.1; 371.3) (N = 41) | 124.9 (81.0; 228.9) (N = 39) | - | - |
| S100B | 2298.3 (1800.4; 2942.5) (N = 39) | 38.5 (23.5; 66.5) (N = 41) | 1.55 (0.44; 4.85) (N = 39) | 0.011 (0.008; 0.015) (N = 30) | 1.842 (1.401; 2.274) (N = 30) |
| Parameter | Type of Analysis/Tissue | ||||
|---|---|---|---|---|---|
| Biochemical Analysis | IHC Analysis | ||||
| Hippocampus | Blood | Hippocampus | Blood | ||
| Serum | PBMCs | PBMCs | |||
| Correlation between blood and hippocampal levels | - | rho = −0.11 (n.s., N = 38) | rho = −0.17 (n.s., N = 38) | - | rho = 0.15 (n.s., N = 43) |
| BDNF levels in female (f) vs. male (m) patients | f vs. m (Z = 1.08, n.s., N = 38) | f vs. m (Z = 1.22, n.s., N = 40) | f vs. m (Z = 1.12, n.s., N = 40) | f vs. m (t = 0.36, n.s., N = 43) | f vs. m (Z = 0.97, n.s., N = 43) |
| Correlation between BDNF levels and age (years) | rho = −0.18 (n.s., N = 38) | r = 0.32 (p = 0.045, N = 41) | rho = 0.05 (n.s., N = 40) | r = −0.12 (n.s., N = 43) | rho = 0.13 (n.s., N = 43) |
| Correlation between BDNF levels and disease duration (years) | rho = −0.19 (n.s., N = 38) | r = 0.09 (n.s., N = 41) | rho = 0.09 (n.s., N = 40) | r = 0.17 (n.s., N = 43) | rho = −0.08 (n.s., N = 43) |
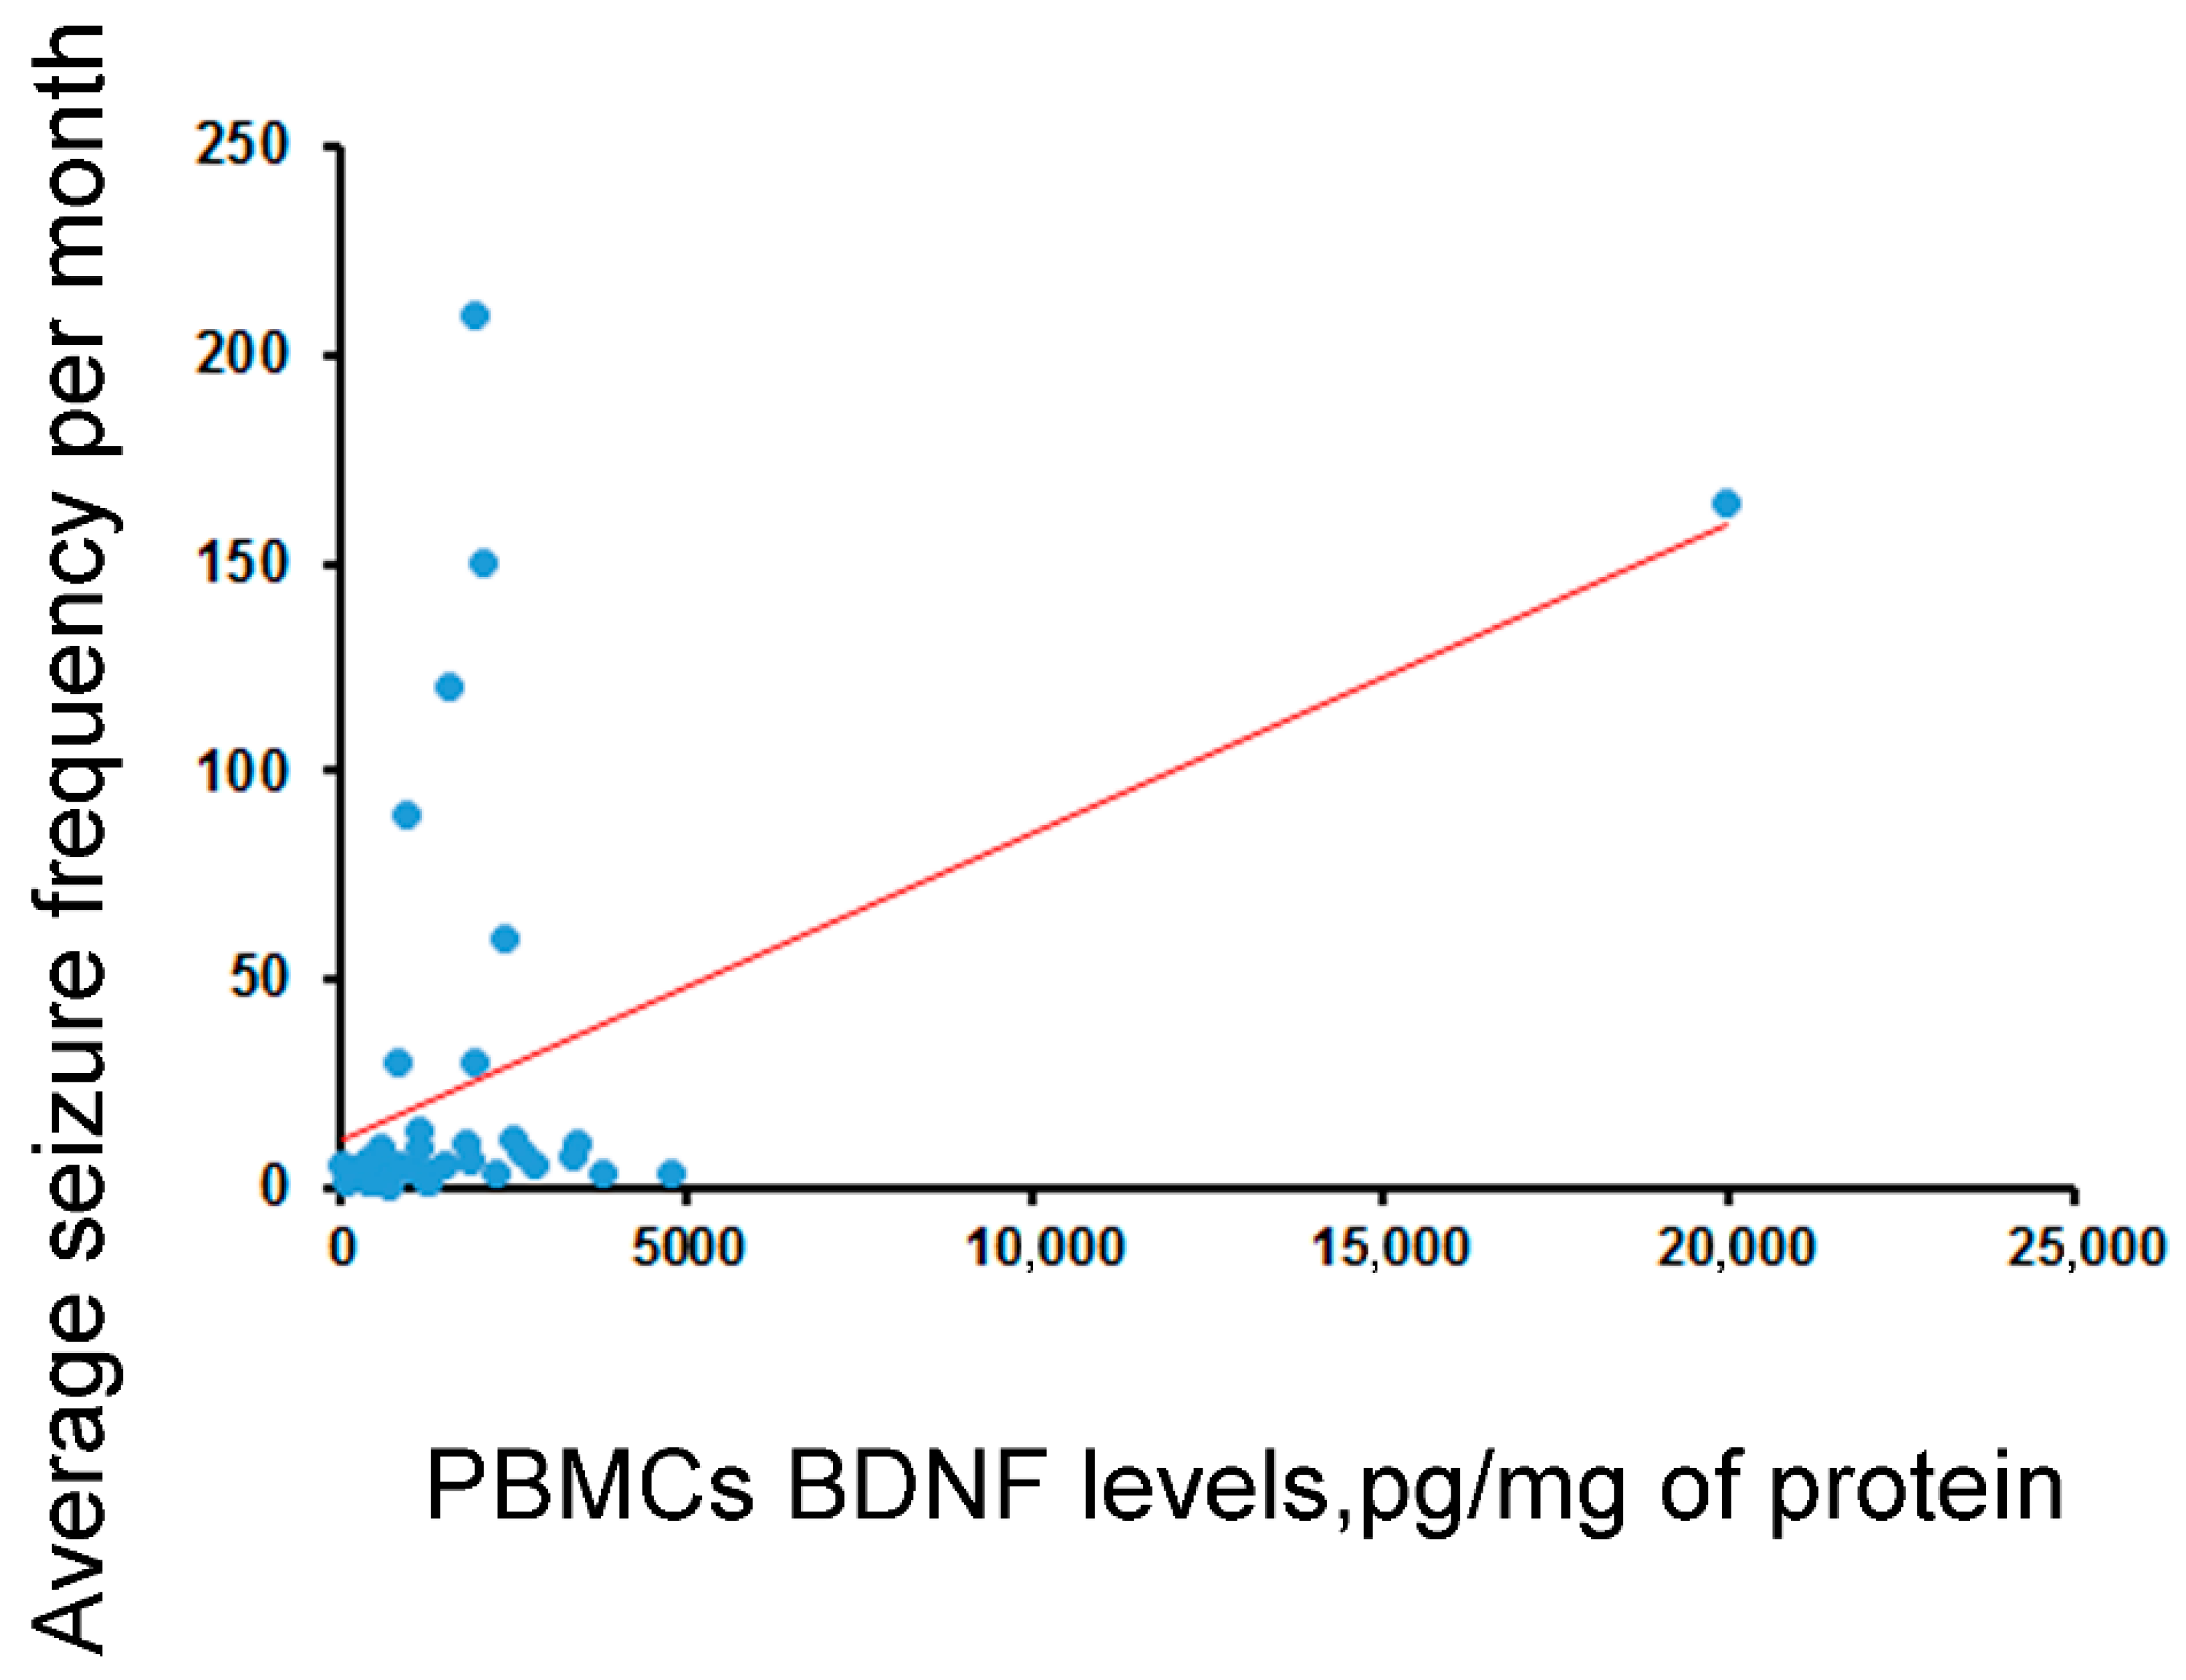
| Correlation between BDNF levels and average seizure frequency per month | rho = 0.15 (n.s., N = 38) | rho = 0.17 (n.s., N = 41) | rho = 0.46, p < 0.003 (N = 40) | rho = −0.06 (n.s., N = 43) | rho = 0.18 (n.s., N = 43) |
| Correlation between BDNF levels and average seizure duration (s) | rho = −0.17 (n.s., N = 38) | rho = −0.003 (n.s., N = 41) | rho = 0.01 (n.s., N = 40) | rho = −0.06 (n.s., N = 43) | rho = 0.001 (n.s., N = 43) |
| BDNF levels in patients with hippocampal sclerosis (HS) vs. hippocampal gliosis (HG) | HS [0.23 ± 0.03 ng/mL] vs. HG [0.25 ± 0.01 ng/mL] (F(1, 36) < 1, N = 38) | HS [3.52 (2.80; 3.84) ng/mL] vs. HG [3.07 (2.53; 3.99) ng/mL] (Z = 0.73, p > 0.05, N = 41) | HS [1.48 (0.84; 2.49) ng/mL] vs. HG [1.03 (0.58; 1.59) ng/mL] (Z = 1.59, p = 0.11, N = 40) | HS [0.03 ± 0.003 a.u.] vs. HG [0.024 ± 0.003 a.u.] (F(1, 41) = 2.2, p = 0.15, N = 43) | HS [3.67 (2.79; 4.01) a.u.] vs. HG [2.3 (1.47; 3.33) a.u.] (Z = 2.87, p = 0.0041, N = 43) |
| Outcome (ILAE classes) | F(5, 32) = 1.7, p > 0.05, N = 38 | F(5, 35) < 1, N = 41 | H(5, N = 40) = 9.53, p = 0.09 | F(5, 37) < 1, N = 43 | H(5, N = 43) = 6.12, p > 0.05 |
| BDNF levels in patients who were treated with drugs stimulating GABAergic activity (1) vs. those who were not (0) | 1 vs. 0 (t = −0.03, n.s., N = 38) | 1 vs. 0 (t = 0.77, n.s., N = 41) | 1 vs. 0 (Z = 1.00, n.s., N = 40) | 1 vs. 0 (t = 0.2, n.s., N = 43) | 1 vs. 0 (Z = −1.06, n.s., N = 43) |
| BDNF levels in patients who were treated with drugs regulating ion channel activity (1) vs. those who were not (0) | 1 vs. 0 (Z = −0.21, n.s., N = 38) | 1 vs. 0 (t = 2.70, p = 0.01, N = 41) | 1 vs. 0 (Z = 0.84, n.s., N = 40) | 1 vs. 0 (t = −0.13, n.s., N = 43) | 1 vs. 0 (Z = −0.37, n.s., N = 43) |
| BDNF levels in patients who were treated with drugs inhibiting the activity of NMDA receptors (1) vs. those who were not (0) | 1 vs. 0 (t =−0.23, n.s., N = 38) | 1 vs. 0 (t =−0.61, n.s., N = 41) | 1 vs. 0 (Z = 0.35, n.s., N = 40) | 1 vs. 0 (t = −0.05, n.s., N = 43) | 1 vs. 0 (Z = −0.41, n.s., N = 43) |
| Parameter | Type of Analysis/Tissue | ||||
|---|---|---|---|---|---|
| Biochemical Analysis | IHC Analysis | ||||
| Hippocampus | Blood | Hippocampus | Blood | ||
| Serum | PBMCs | PBMCs | |||
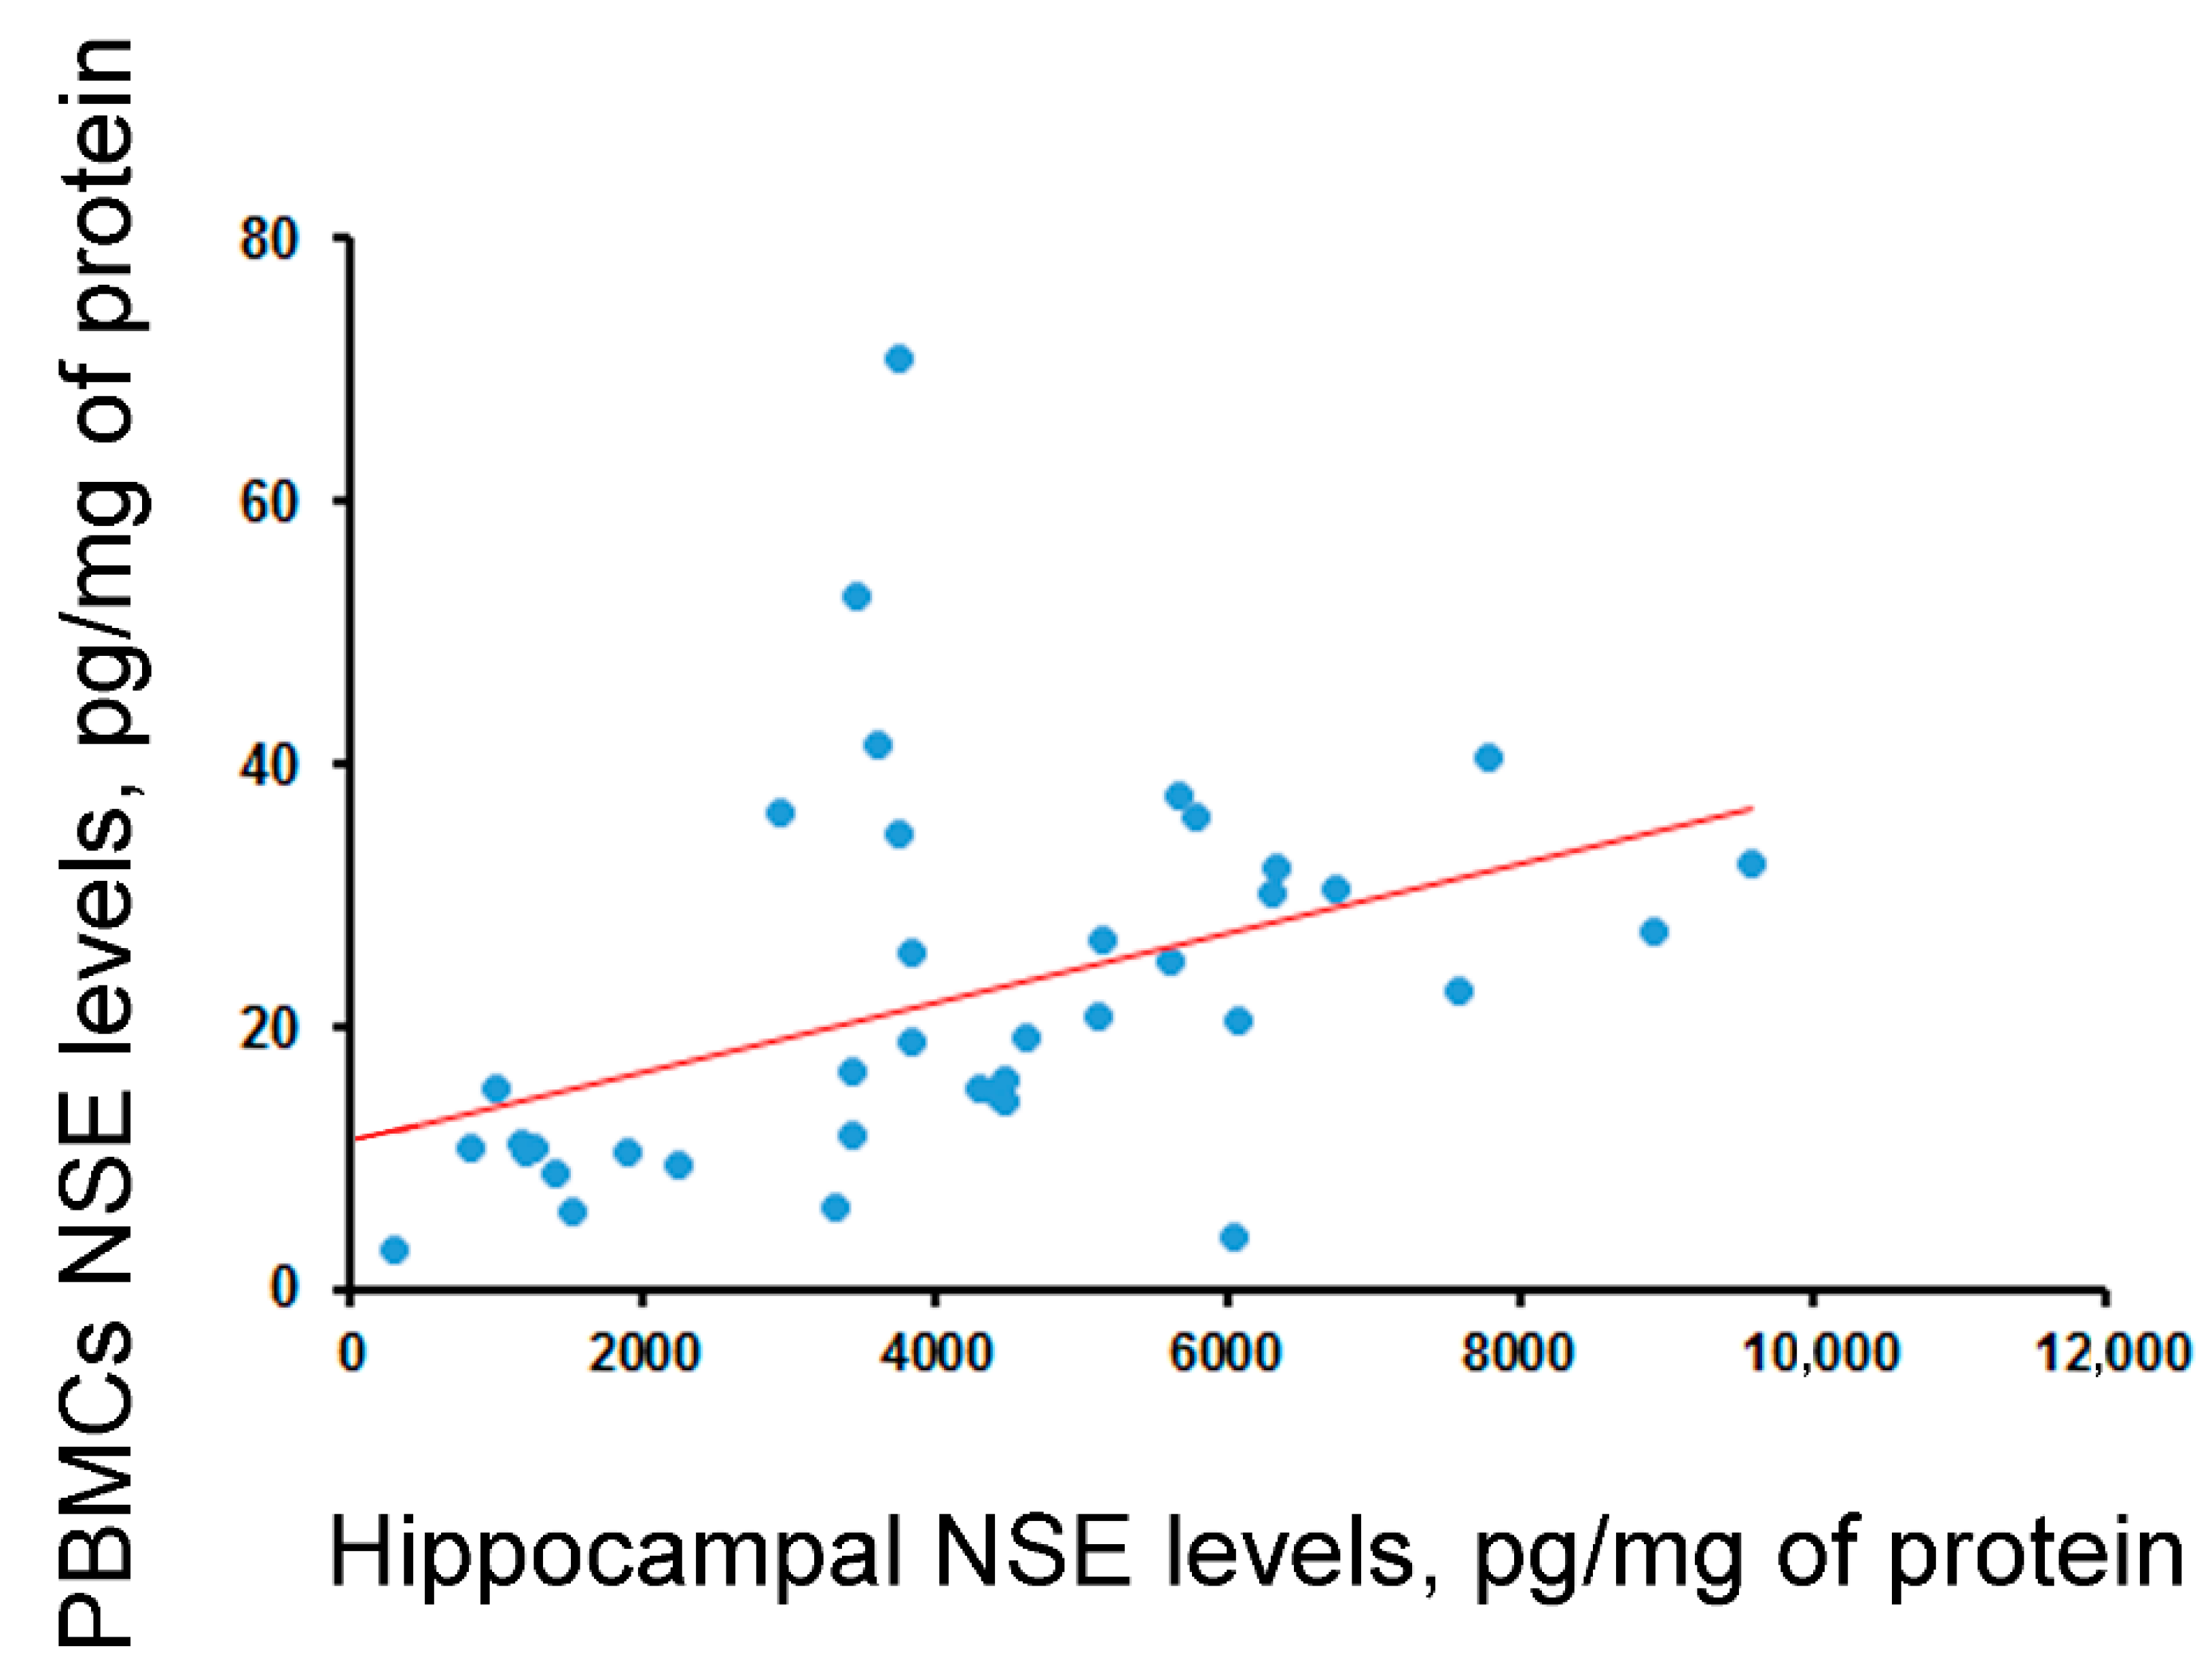
| Correlation between blood and hippocampal levels | - | rho = −0.29 (p = 0.06, N = 40) | rho = 0.55 (p < 0.001, N = 40) | - | rho = 0.3 (p = 0.057, N = 41) |
| NSE levels in female (f) vs. male (m) patients | f vs. m (t = −0.05, n.s., N = 40) | f vs. m (Z = −1.95, p = 0.05, N = 40) | f vs. m (Z = −0.14, n.s., N = 40) | f vs. m (Z = −1.68, n.s., N = 43) | f vs. m (Z = −0.68, n.s., N = 42) |
| Correlation between NSE levels and age (years) | r = −0.18 (n.s., N = 40) | rho = 0.10 (n.s., N = 40) | rho = −0.27 (n.s., N = 40) | rho = −0.08 (n.s., N = 43) | rho = 0.17 (n.s., N = 42) |
| Correlation between NSE levels and disease duration (years) | rho = −0.04 (n.s., N = 40) | rho = 0.05 (n.s., N = 40) | rho = −0.19 (n.s., N = 40) | rho = 0.04 (n.s., N = 43) | rho = −0.08 (n.s., N = 42) |
| Correlation between NSE levels and average seizure frequency per month | rho = 0.05 (n.s., N = 40) | rho = 0.03 (n.s., N = 40) | rho = 0.02 (n.s., N = 40) | rho = −0.09 (n.s., N = 43) | rho = 0.07 (n.s., N = 42) |
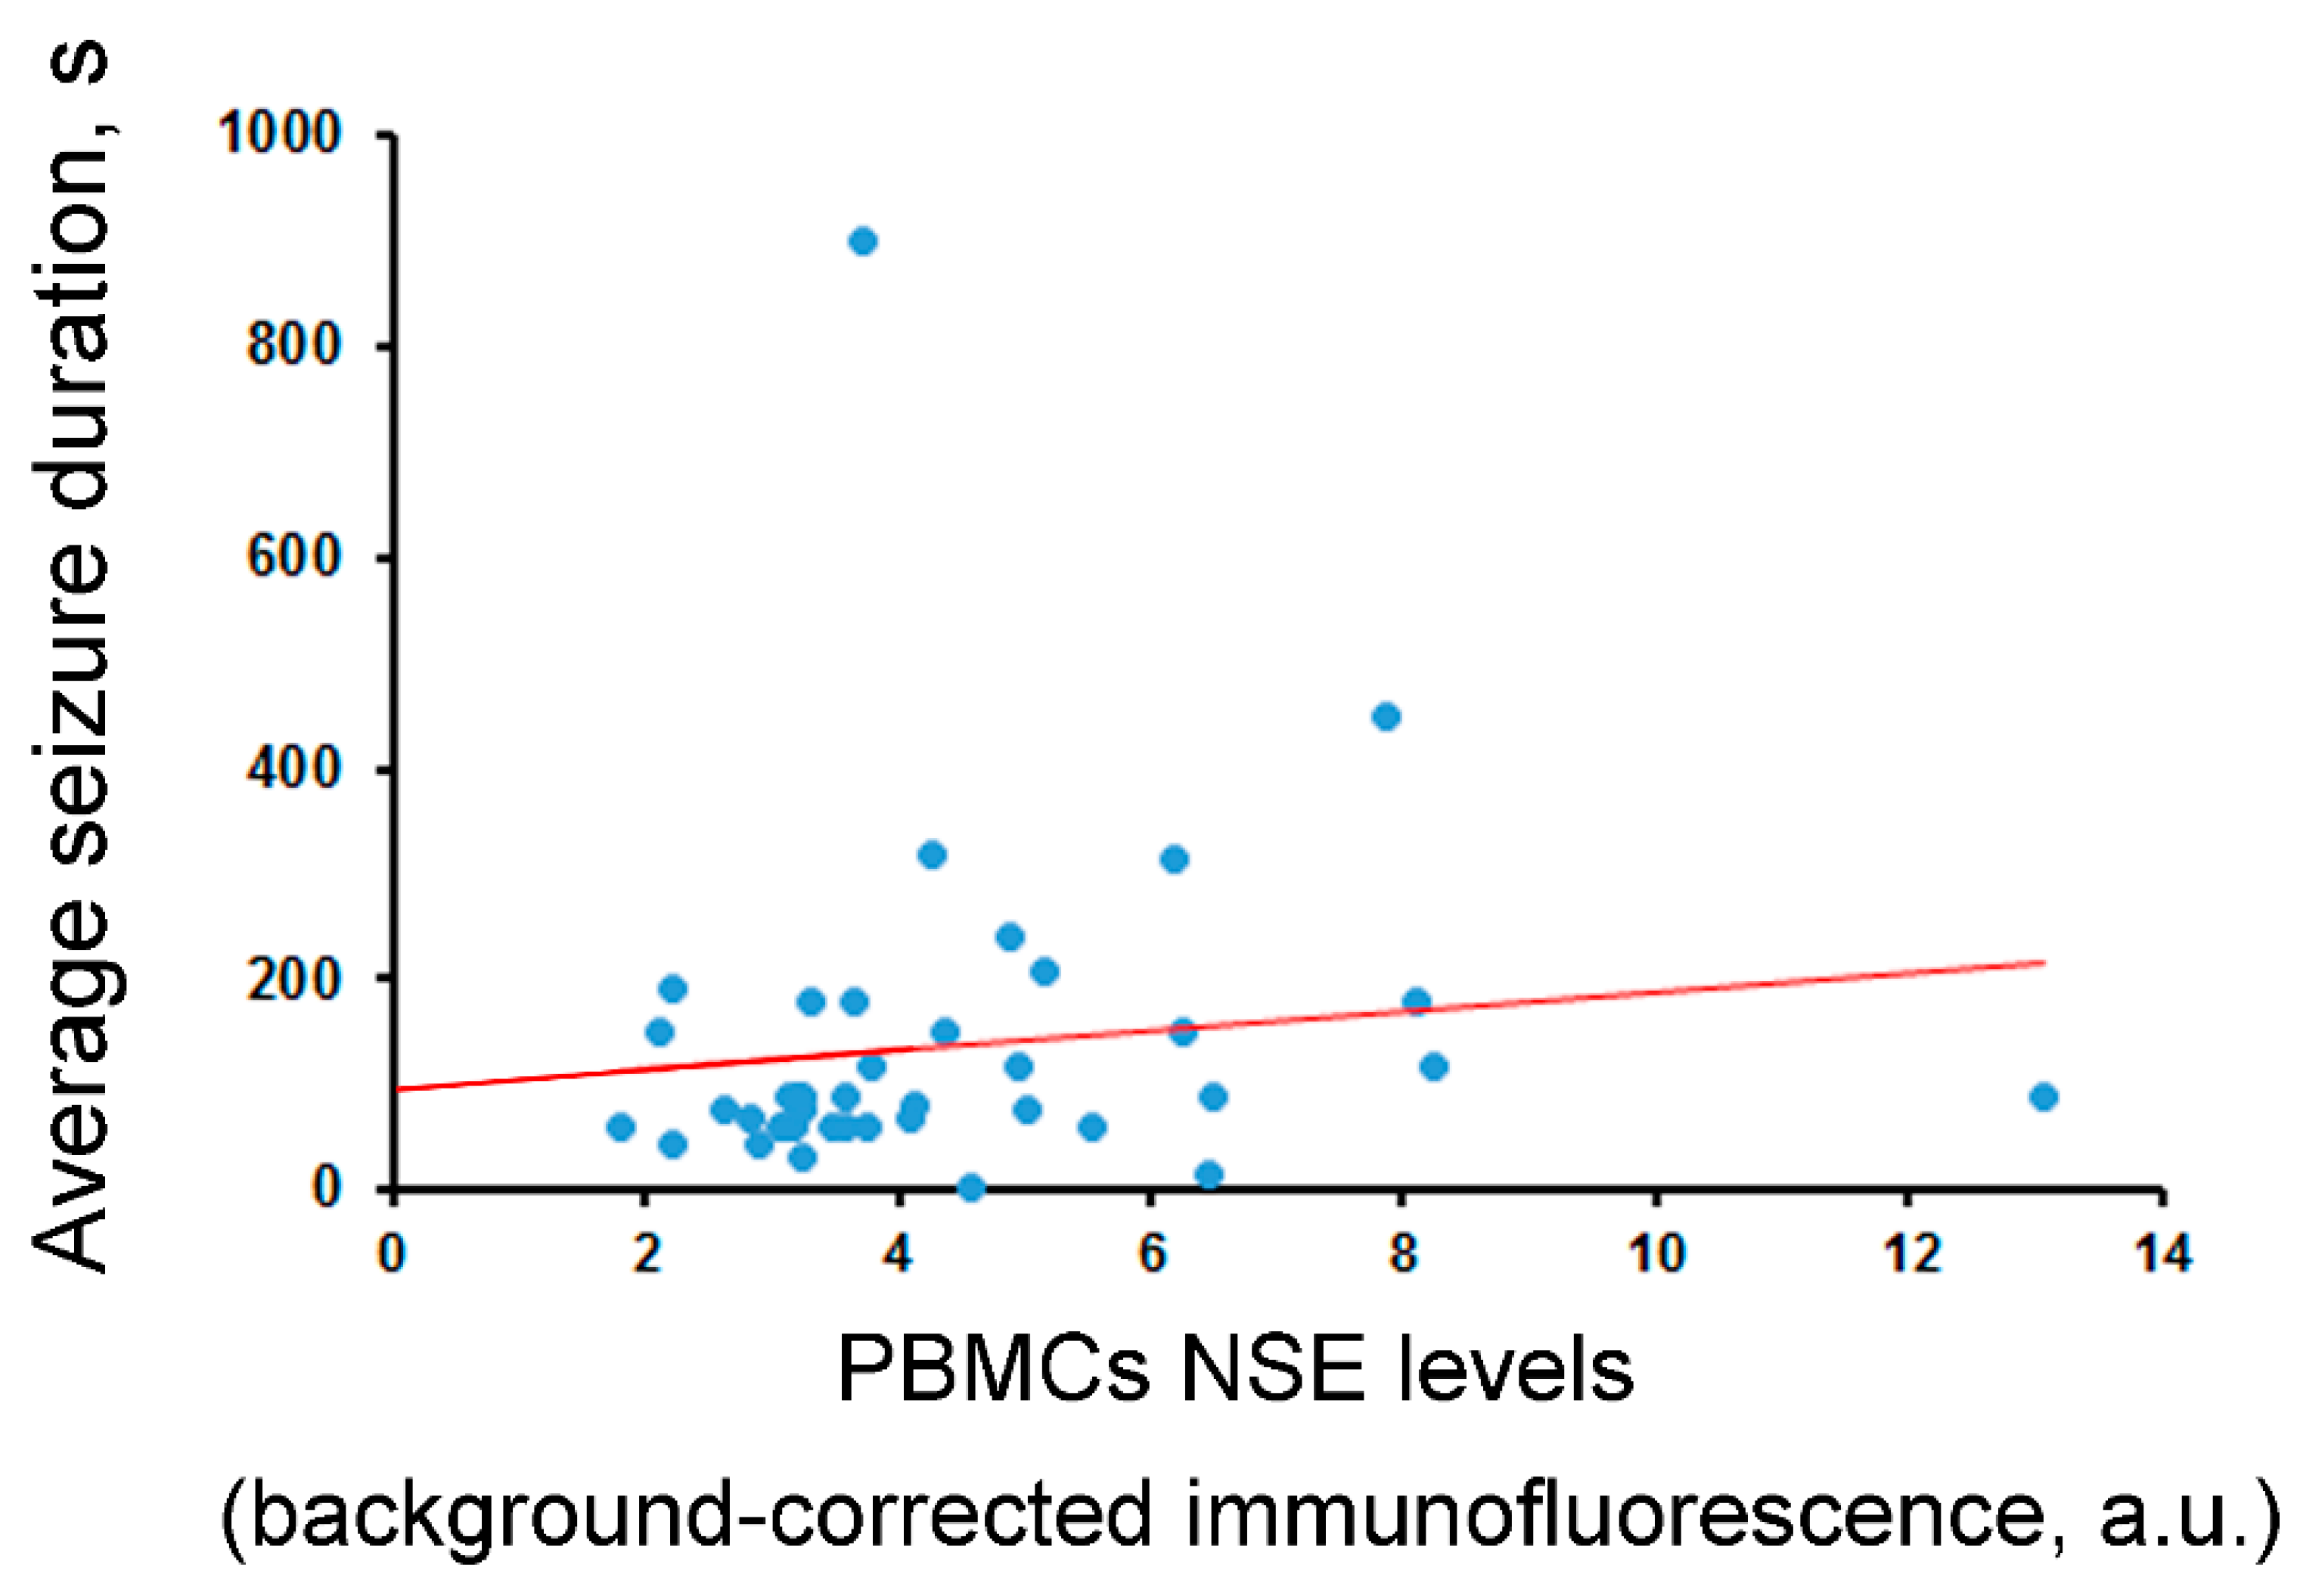
| Correlation between NSE levels and average seizure duration (s) | rho = −0.00 (n.s., N = 40) | rho = −0.06 (n.s., N = 40) | rho = −0.11 (n.s., N = 40) | rho = −0.09 (n.s., N = 42) | rho = 0.34 (p = 0.03, N = 41) |
| NSE levels in patients with hippocampal sclerosis (HS) vs. hippocampal gliosis (HG) | HS vs. HG (t = −1.33, n.s., N = 40) | HS vs. HG (Z = 0.97, n.s., N = 40) | HS vs. HG (Z = −1.92, n.s., N = 40) | HS vs. HG (Z = −0.43, n.s., N = 43) | HS vs. HG (Z = 0.87, n.s., N = 42) |
| Outcome (ILAE classes) | F(5, 33) = 0.19, p > 0.05 | H(5, N = 39) = 4.23, p > 0.05 | H(5, N = 39) = 5.22, p > 0.05 | H(5, N = 43) = 2.92, p > 0.05 | H(5, N = 42) = 6.79, p > 0.05 |
| NSE levels in patients who were treated with drugs stimulating GABAergic activity (1) vs. those who were not (0) | 1 vs. 0 (t = 0.23, p = 0.056, N = 40) | 1 vs. 0 (Z = −0.17, n.s., N = 40) | 1 vs. 0 (Z = 1.67, n.s., N = 40) | 1 vs. 0 (Z = 0.23, n.s., N = 43) | 1 vs. 0 (Z = 0.52, n.s., N = 42) |
| NSE levels in patients who were treated with drugs regulating ion channel activity (1) vs. those who were not (0) | 1 vs. 0 (t = −0.52, n.s., N = 40) | 1 vs. 0 (Z = 1.00, n.s., N = 40) | 1 vs. 0 (Z = 0.82, n.s., N = 40) | 1 vs. 0 (Z = 1.5, n.s., N = 43) | 1 vs. 0 (Z = 1.86, n.s., N = 42) |
| NSE levels in patients who were treated with drugs inhibiting the activity of NMDA receptors (1) vs. those who were not (0) | 1 vs. 0 (t = 2.17, p < 0.05, N = 40) | 1 vs. 0 (Z = −2.52, p < 0.05, N = 40) | 1 vs. 0 (Z = 0.08, n.s., N = 40) | 1 vs. 0 (Z = −1.65, n.s., N = 43) | 1 vs. 0 (Z = −0.68, n.s., N = 42) |
| Parameter | Type of Analysis/Tissue | ||||
|---|---|---|---|---|---|
| Biochemical Analysis | IHC Analysis | ||||
| Hippocampus | Blood | Hippocampus | Blood | ||
| Serum | PBMCs | PBMCs | |||
| Correlation between blood and hippocampal levels | - | rho = 0.14 (n.s., N = 39) | rho = 0.21 (n.s., N = 39) | - | r = 0.16 (n.s., N = 30) |
| S100B levels in female (f) vs. male (m) patients | f vs. m (t = 1.85, p = 0.07, N = 39) | f vs. m (Z = 0.86, n.s., N = 41) | f vs. m (Z = 0.43, n.s., N = 39) | f vs. m (t = −0.17, n.s., N = 30) | f vs. m (t = −0.45, n.s., N = 30) |
| Correlation between S100B levels and age (years) | r = −0.06 (n.s., N = 39) | rho = 0.34, (p < 0.05, N = 41) | rho = 0.06 (n.s., N = 39) | r = −0.05 (n.s., N = 30) | r = −0.12 (n.s., N = 30) |
| Correlation between S100B levels and disease duration (years) | r = −0.23 (n.s., N = 39) | rho = 0.19 (n.s., N = 41) | rho = 0.10 (n.s., N = 39) | r = 0.16 (n.s., N = 30) | r = −0.22 (n.s., N = 30) |
| Correlation between S100B levels and average seizure frequency per month | rho = 0.26 (n.s., N = 39) | rho = 0.23 (n.s., N = 41) | rho = 0.27 (n.s., N = 39) | rho = −0.14 (n.s., N = 30) | rho = 0.004 (n.s., N = 30) |
| Correlation between S100B levels and average seizure duration (s) | rho = −0.05 (n.s., N = 39) | rho = 0.02 (n.s., N = 41) | rho = 0.05 (n.s., N = 39) | rho = −0.06 (n.s., N = 29) | rho = 0.28 (n.s., N = 29) |
| S100B levels in patients with hippocampal sclerosis (HS) vs. hippocampal gliosis (HG) | HS vs. HG (t = −0.20, n.s., N = 39) | HS vs. HG (Z = 1.39, n.s., N = 41) | HS vs. HG (Z = −0.12, n.s., N = 39) | HS vs. HG (t = −0.91, n.s., N = 30) | HS vs. HG (t = −1.31, n.s., N = 30) |
| Outcome (ILAE classes) | F(5, 33) = 0.30, p > 0.05, N = 39 | H(5, N = 41) = 5.62, n.s. | H(5, N = 39) = 2.19, n.s. | F(5, 24) =1.04, p > 0.05 | F(5, 24) = 1.46, p > 0.05 |
| S100B levels in patients who were treated with drugs stimulating GABAergic activity (1) vs. those who were not (0) | 1 vs. 0 (t = −1.08, n.s., N = 39) | 1 vs. 0 (Z = 0.64, n.s., N = 41) | 1 vs. 0 (Z = −0.09, n.s., N = 39) | 1 vs. 0 (t = 1.58, n.s., N = 30) | 1 vs. 0 (t = 0.43, n.s., N = 30) |
| S100B levels in patients who were treated with drugs regulating ion channel activity (1) vs. those who were not (0) | 1 vs. 0 (t = −0.92, n.s., N = 39) | 1 vs. 0 (Z = 0.85, n.s., N = 41) | 1 vs. 0 (Z = −0.76, n.s., N = 39) | 1 vs. 0 (t = −0.42, n.s., N = 30) | 1 vs. 0 (t = 0.42, n.s., N = 42) |
| S100B levels in patients who were treated with drugs inhibiting the activity of NMDA receptors (1) vs. those who were not (0) | 1 vs. 0 (t = 1.44, n.s., N = 39) | 1 vs. 0 (Z = −0.12, n.s., N = 41) | 1 vs. 0 (Z = 0.08, n.s., N = 39) | 1 vs. 0 (t = 1.61, n.s., N = 30) | 1 vs. 0 (t = −0.66, n.s., N = 30) |
| Biochemical Analysis | |||
|---|---|---|---|
| Parameter | Tissue | ||
| Hippocampus | Blood | ||
| Serum | PBMCs | ||
| Correlation between blood and hippocampal levels | - | rho = 0.11 (n.s., N = 39) | rho = 0.01 (n.s., N = 39) |
| VILIP-1 levels in female (f) vs. male (m) patients | f vs. m (Z = 1.93, p = 0.054, N = 39) | f vs. m (Z = −1.03, n.s., N = 41) | f vs. m (Z = −0.49, n.s., N = 39) |
| Correlation between VILIP-1 levels and age (years) | rho = 0.09 (n.s., N = 39) | rho = 0.10 (n.s., N = 41) | rho = −0.26 (n.s., N = 39) |
| Correlation between VILIP-1 levels and disease duration (years) | rho = 0.05 (n.s., N = 39) | rho = 0.01 (n.s., N = 41) | rho = −0.07 (n.s., N = 39) |
| Correlation between VILIP-1 levels and average seizure frequency per month | rho = 0.24 (n.s., N = 39) | rho = 0.10 (n.s., N = 41) | rho = 0.10 (n.s., N = 39) |
| Correlation between VILIP-1 levels and average seizure duration (s) | rho = −0.03 (n.s., N = 39) | rho = −0.05 (n.s., N = 41) | rho = −0.23 (n.s., N = 39) |
| VILIP-1 levels in patients with hippocampal sclerosis (HS) vs. hippocampal gliosis (HG) | HS vs. HG (Z = 1.93, n.s., N = 39) | HS vs. HG (Z = 0.95, n.s., N = 41) | HS vs. HG (Z = −1.13, n.s., N = 39) |
| Outcome (ILAE classes) | H(5, N = 39) = 3.27, n.s. | H(5, N = 41) = 1.13, n.s. | H(5, N = 39) = 4.38, n.s. |
| VILIP-1 levels in patients who were treated with drugs stimulating GABAergic activity (1) vs. those who were not (0) | 1 vs. 0 (Z = −0.25, n.s., N = 39) | 1 vs. 0 (Z = −0.74, n.s., N = 41) | 1 vs. 0 (Z = 0.64, n.s., N = 39) |
| VILIP-1 levels in patients who were treated with drugs regulating ion channel activity (1) vs. those who were not (0) | 1 vs. 0 (Z = −0.98, n.s., N = 39) | 1 vs. 0 (Z = −0.30, n.s., N = 41) | 1 vs. 0 (Z = −0.71, n.s., N = 39) |
| VILIP-1 levels in patients who were treated with drugs inhibiting the activity of NMDA receptors (1) vs. those who were not (0) | 1 vs. 0 (Z = 1.45, n.s., N = 39) | 1 vs. 0 (Z = −1.88, p = 0.06, N = 41) | 1 vs. 0 (Z = 0.39, n.s., N = 39) |
Disclaimer/Publisher’s Note: The statements, opinions and data contained in all publications are solely those of the individual author(s) and contributor(s) and not of MDPI and/or the editor(s). MDPI and/or the editor(s) disclaim responsibility for any injury to people or property resulting from any ideas, methods, instructions or products referred to in the content. |
© 2023 by the authors. Licensee MDPI, Basel, Switzerland. This article is an open access article distributed under the terms and conditions of the Creative Commons Attribution (CC BY) license (https://creativecommons.org/licenses/by/4.0/).
Share and Cite
Tikhonova, M.A.; Shvaikovskaya, A.A.; Zhanaeva, S.Y.; Moysak, G.I.; Akopyan, A.A.; Rzaev, J.A.; Danilenko, K.V.; Aftanas, L.I. Concordance between the In Vivo Content of Neurospecific Proteins (BDNF, NSE, VILIP-1, S100B) in the Hippocampus and Blood in Patients with Epilepsy. Int. J. Mol. Sci. 2024, 25, 502. https://doi.org/10.3390/ijms25010502
Tikhonova MA, Shvaikovskaya AA, Zhanaeva SY, Moysak GI, Akopyan AA, Rzaev JA, Danilenko KV, Aftanas LI. Concordance between the In Vivo Content of Neurospecific Proteins (BDNF, NSE, VILIP-1, S100B) in the Hippocampus and Blood in Patients with Epilepsy. International Journal of Molecular Sciences. 2024; 25(1):502. https://doi.org/10.3390/ijms25010502
Chicago/Turabian StyleTikhonova, Maria A., Anna A. Shvaikovskaya, Svetlana Y. Zhanaeva, Galina I. Moysak, Anna A. Akopyan, Jamil A. Rzaev, Konstantin V. Danilenko, and Lyubomir I. Aftanas. 2024. "Concordance between the In Vivo Content of Neurospecific Proteins (BDNF, NSE, VILIP-1, S100B) in the Hippocampus and Blood in Patients with Epilepsy" International Journal of Molecular Sciences 25, no. 1: 502. https://doi.org/10.3390/ijms25010502