
Impact of Exercise Intensity on Cerebral BDNF Levels: Role of FNDC5/Irisin

Abstract
: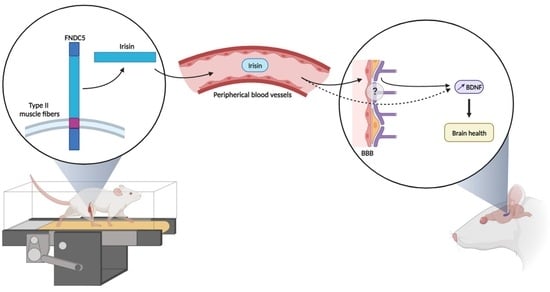
1. Introduction
2. Results
2.1. Baseline Characteristics of Sedentary and Exercised Rats
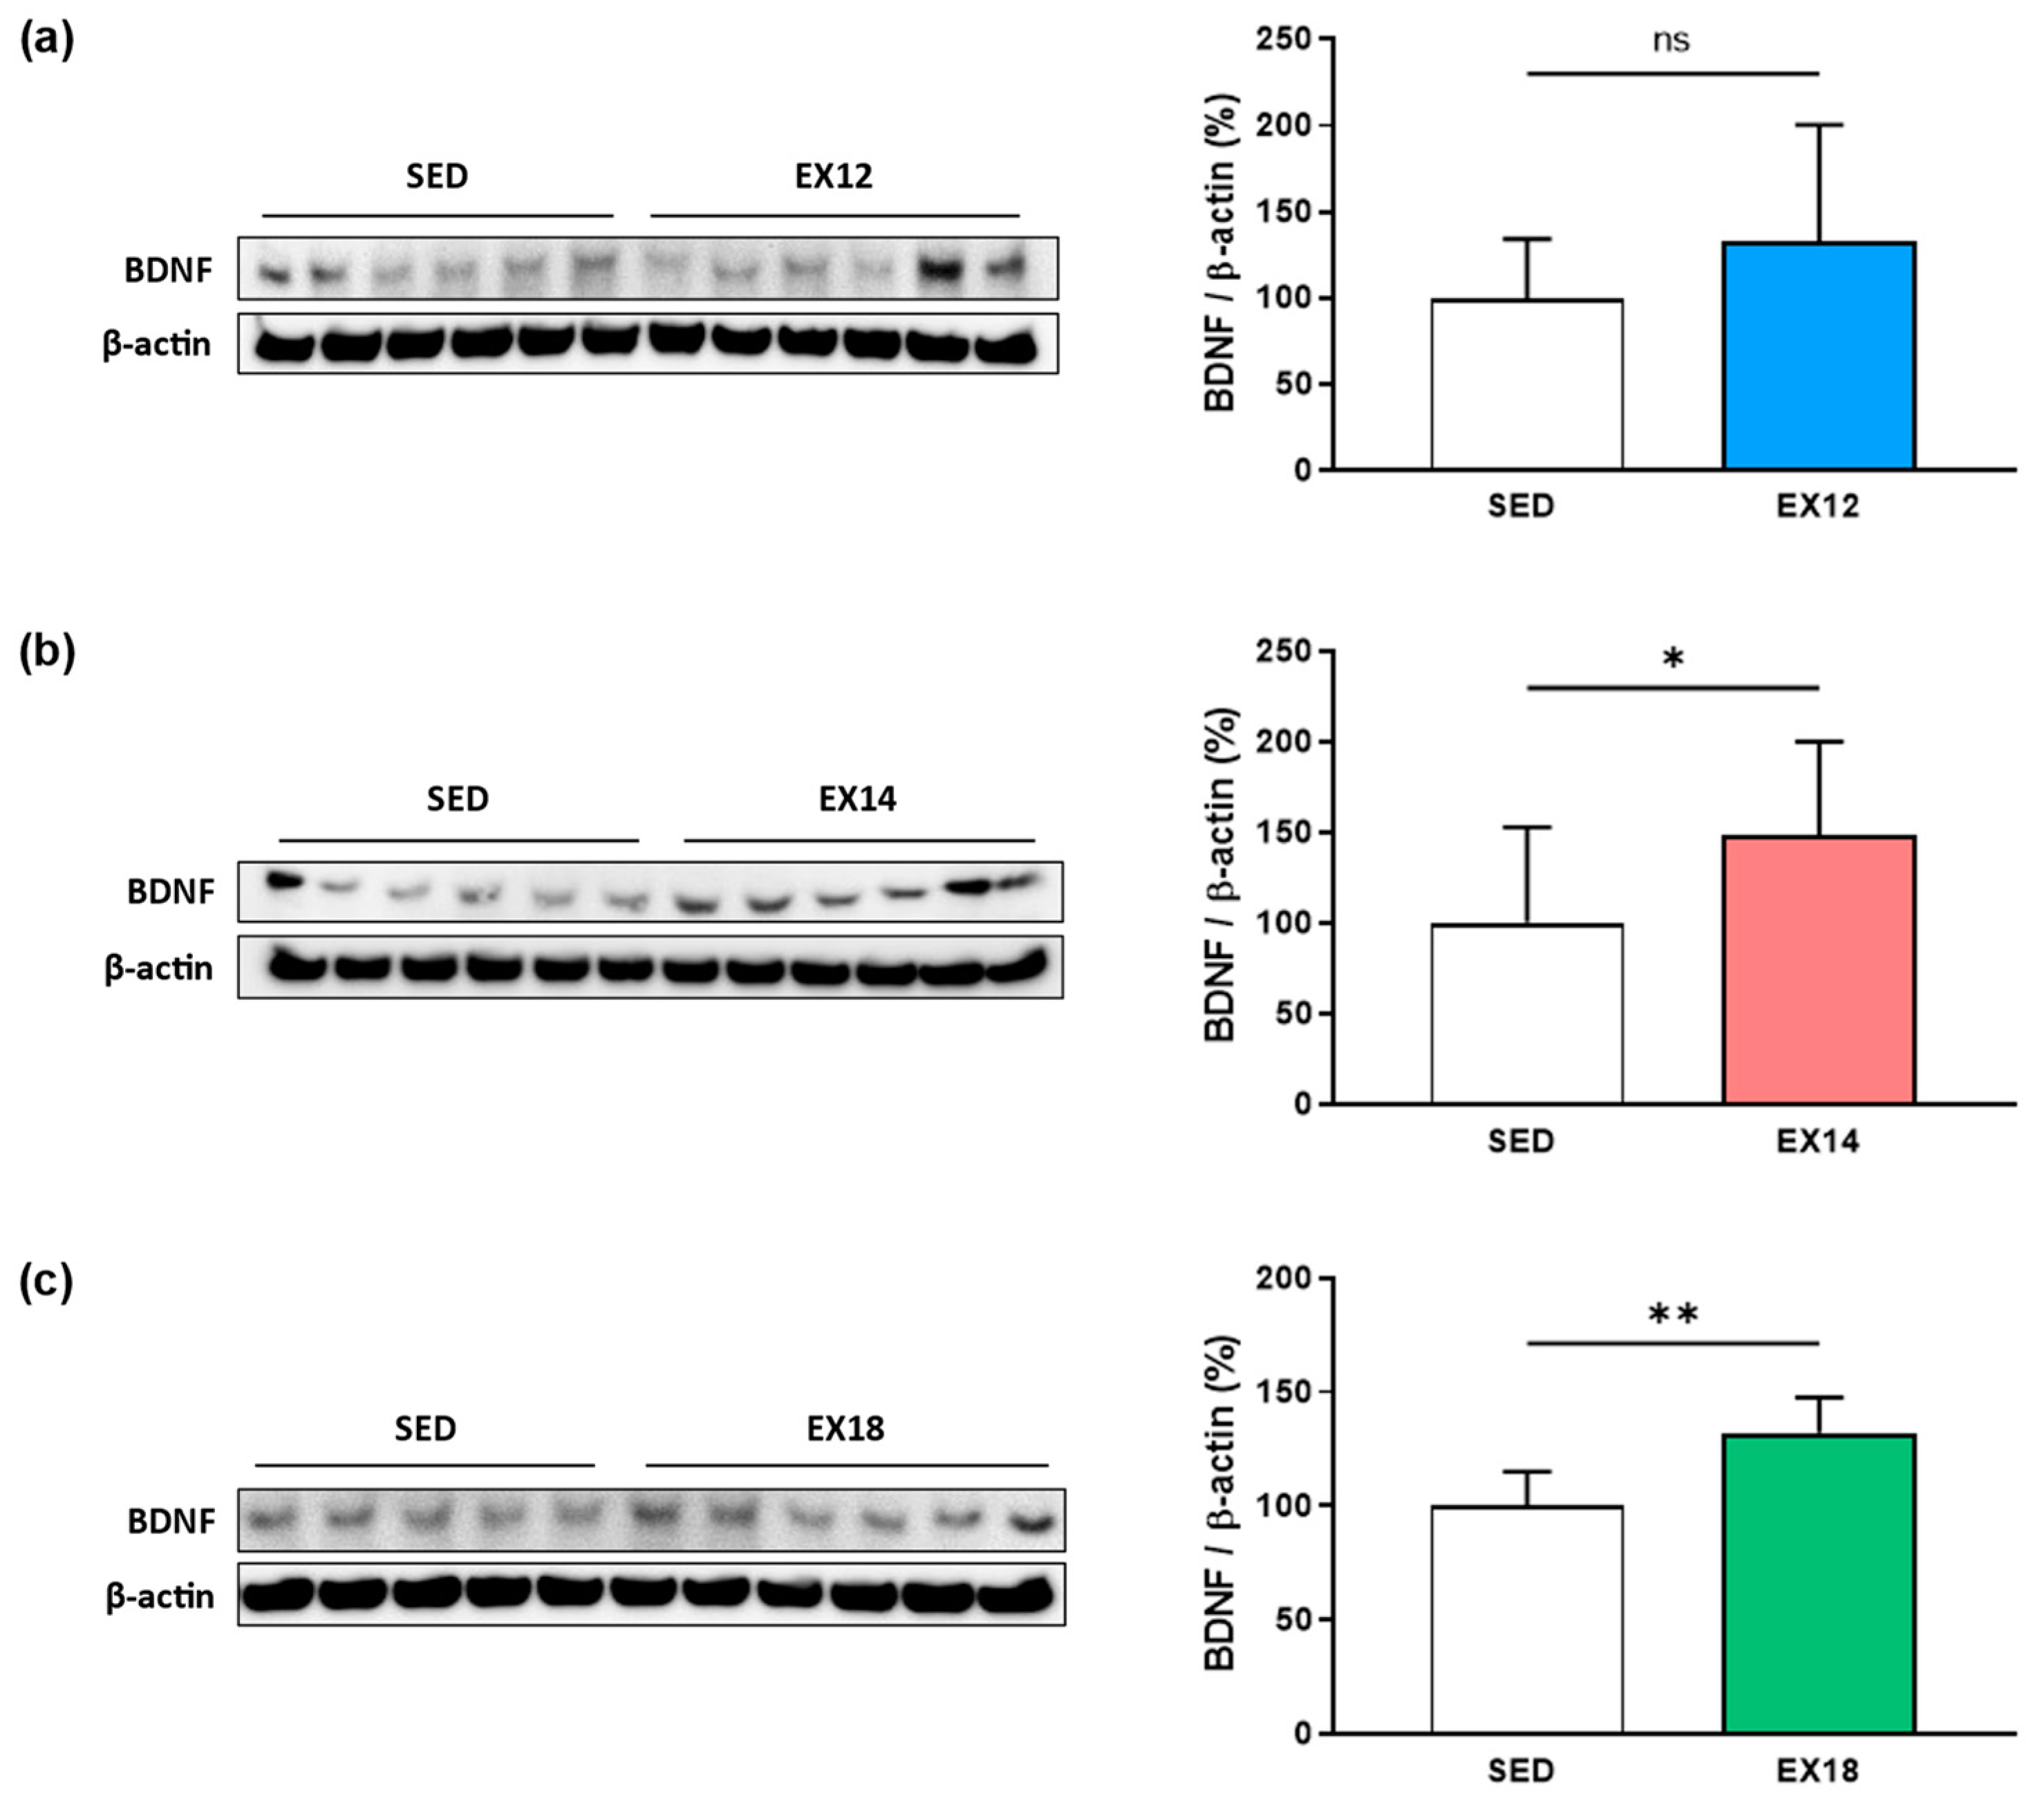
2.2. Exercise Intensity Affects Hippocampal BDNF Expression
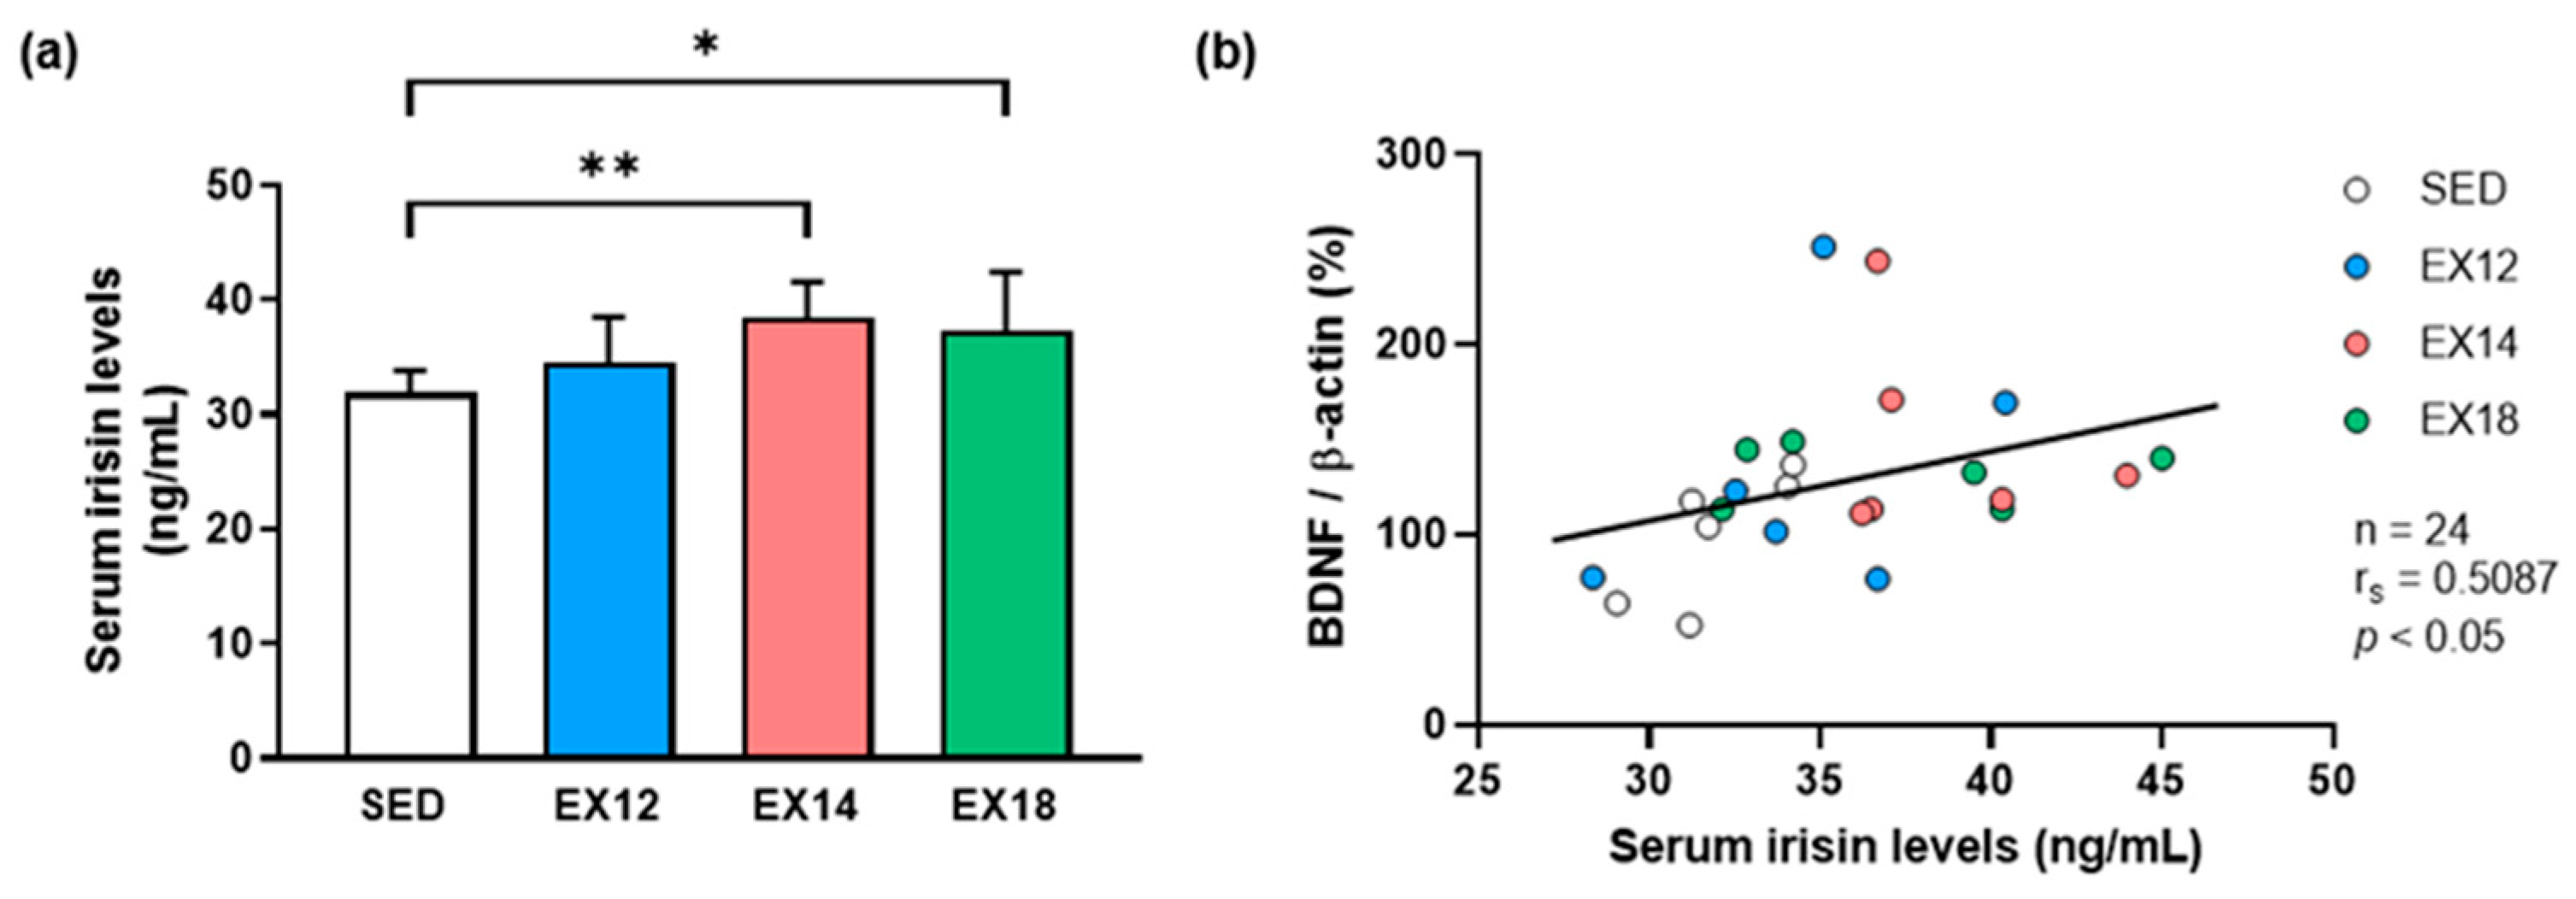
2.3. Exercise Intensity Affects Serum Irisin Levels That Correlate with Hippocampal BDNF Expression
2.3.1. Serum Irisin Levels
2.3.2. Correlation of Hippocampal BDNF Expression with Serum Irisin Levels
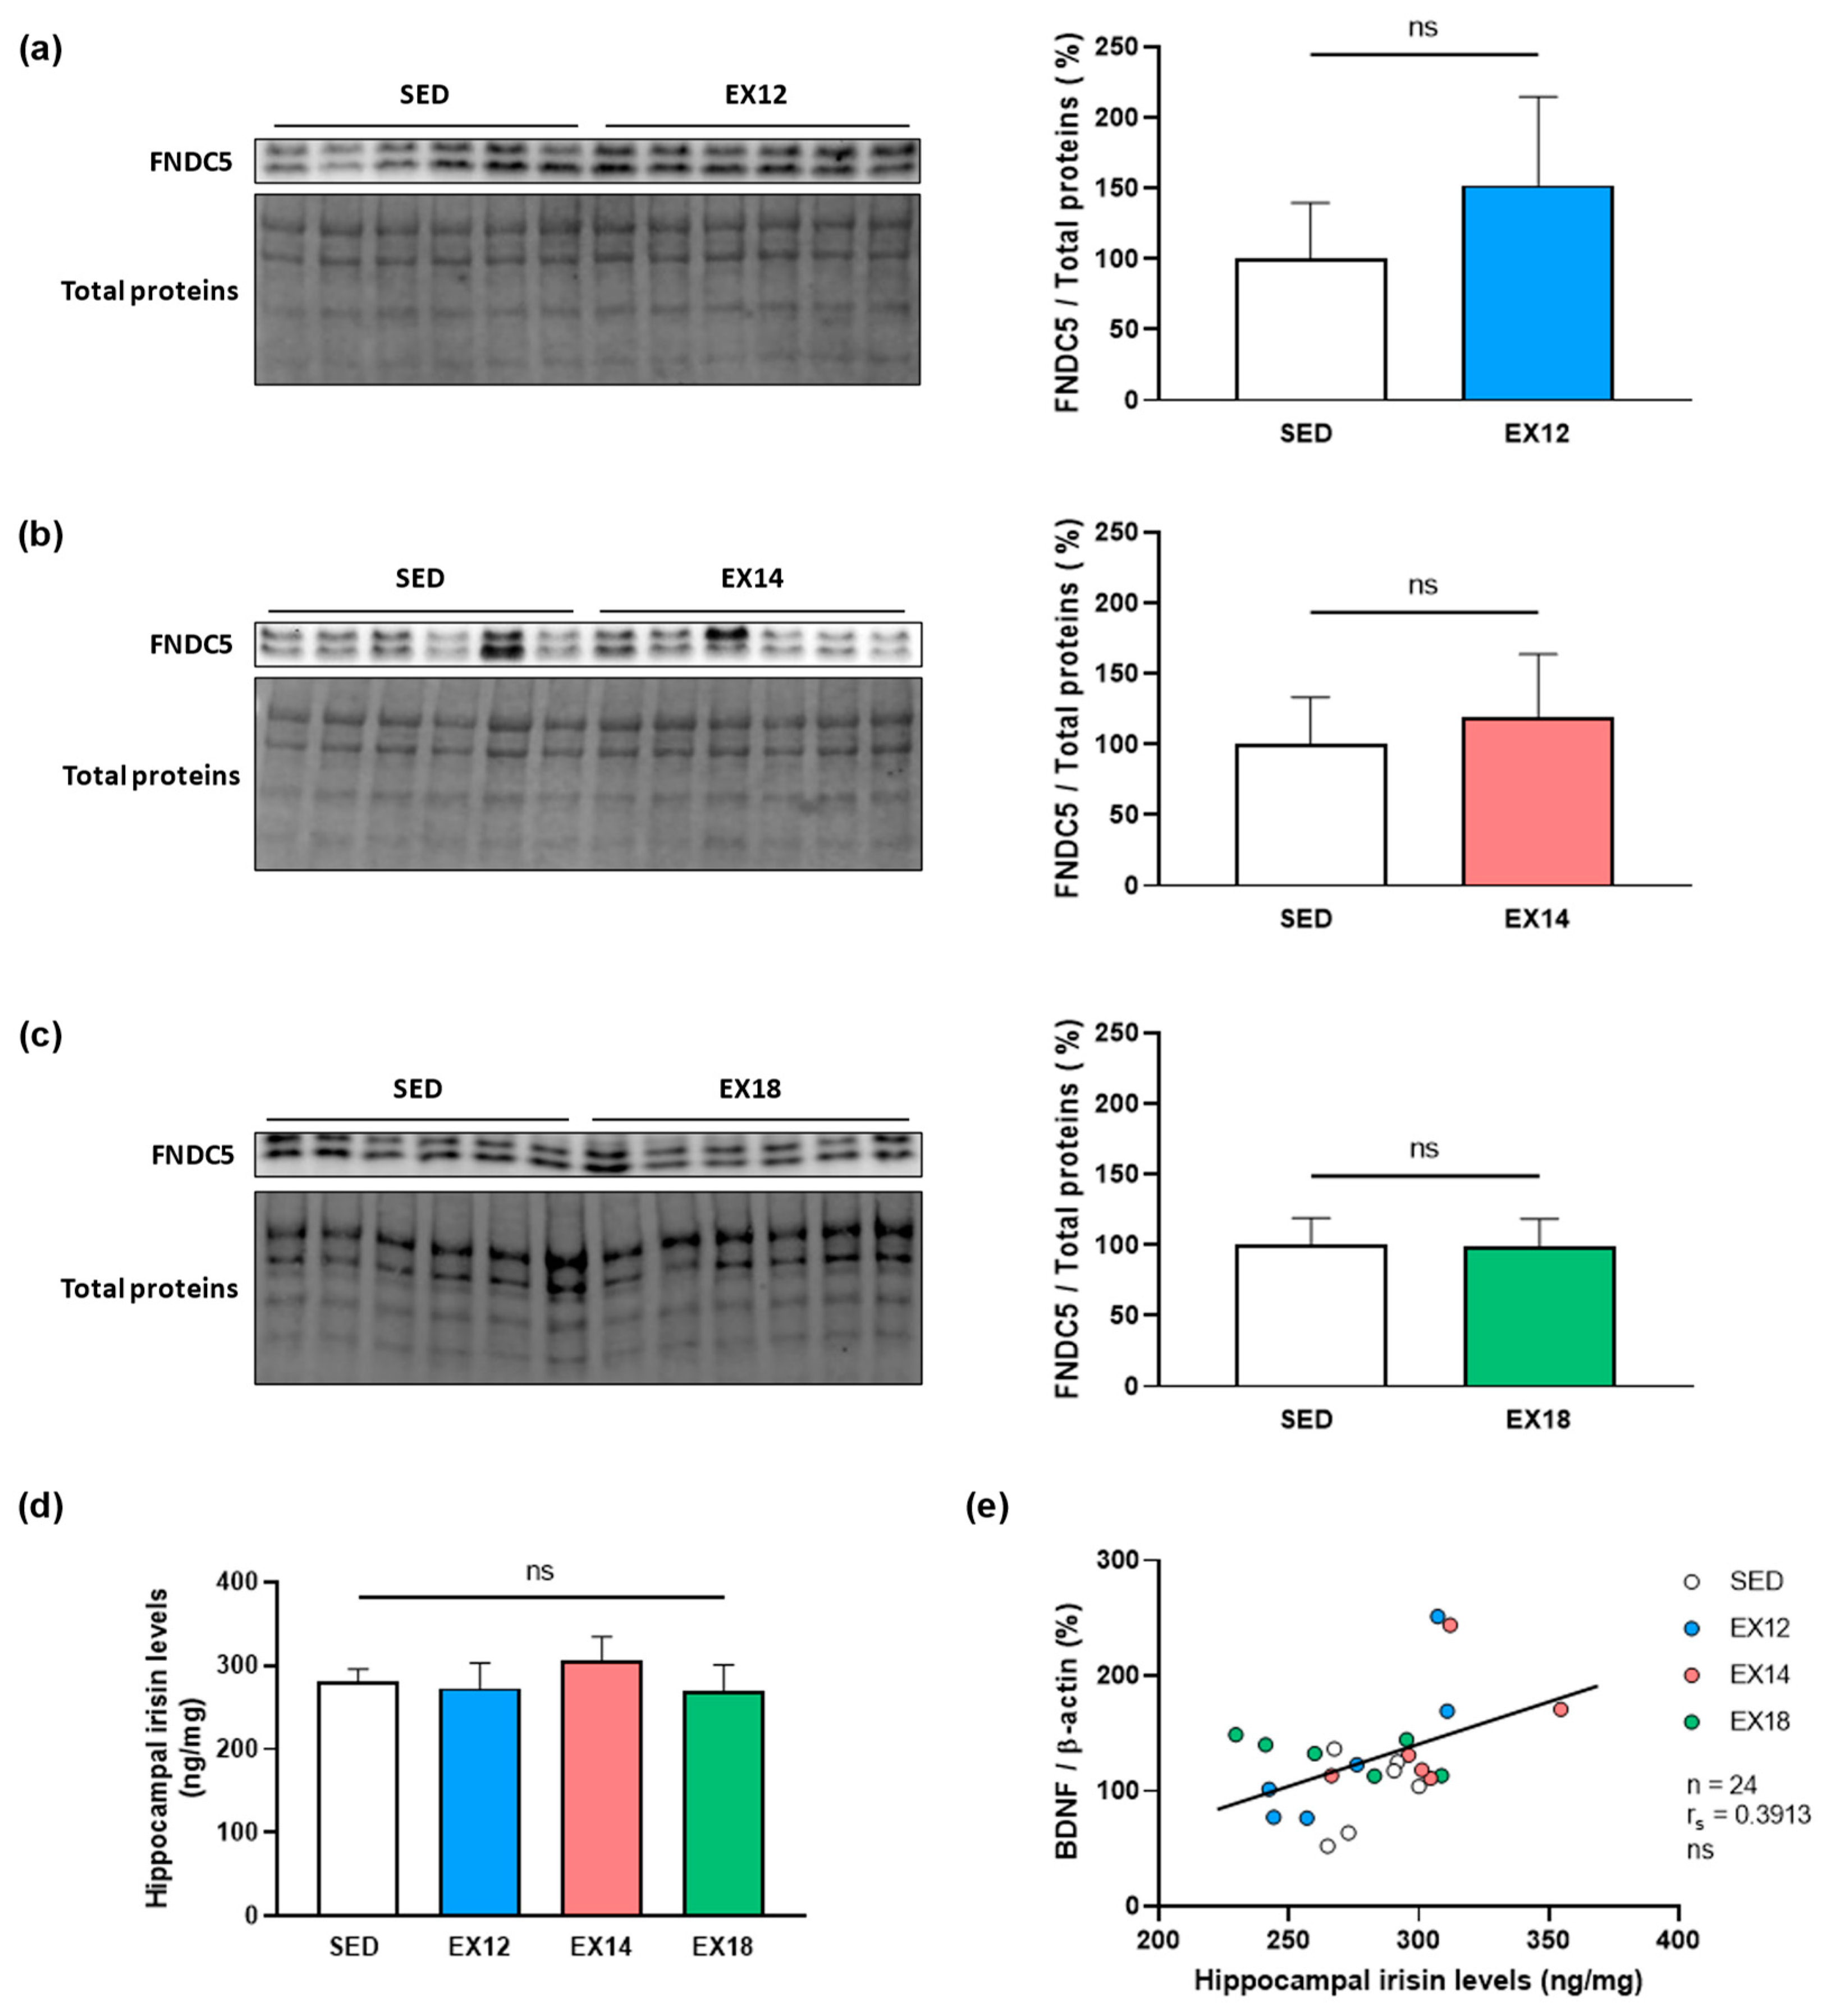
2.4. Exercise Intensity Does Not Impact Either Hippocampal FNDC5 Expression nor Irisin Levels Which Do Not Correlate with BDNF Expression in Hippocampus
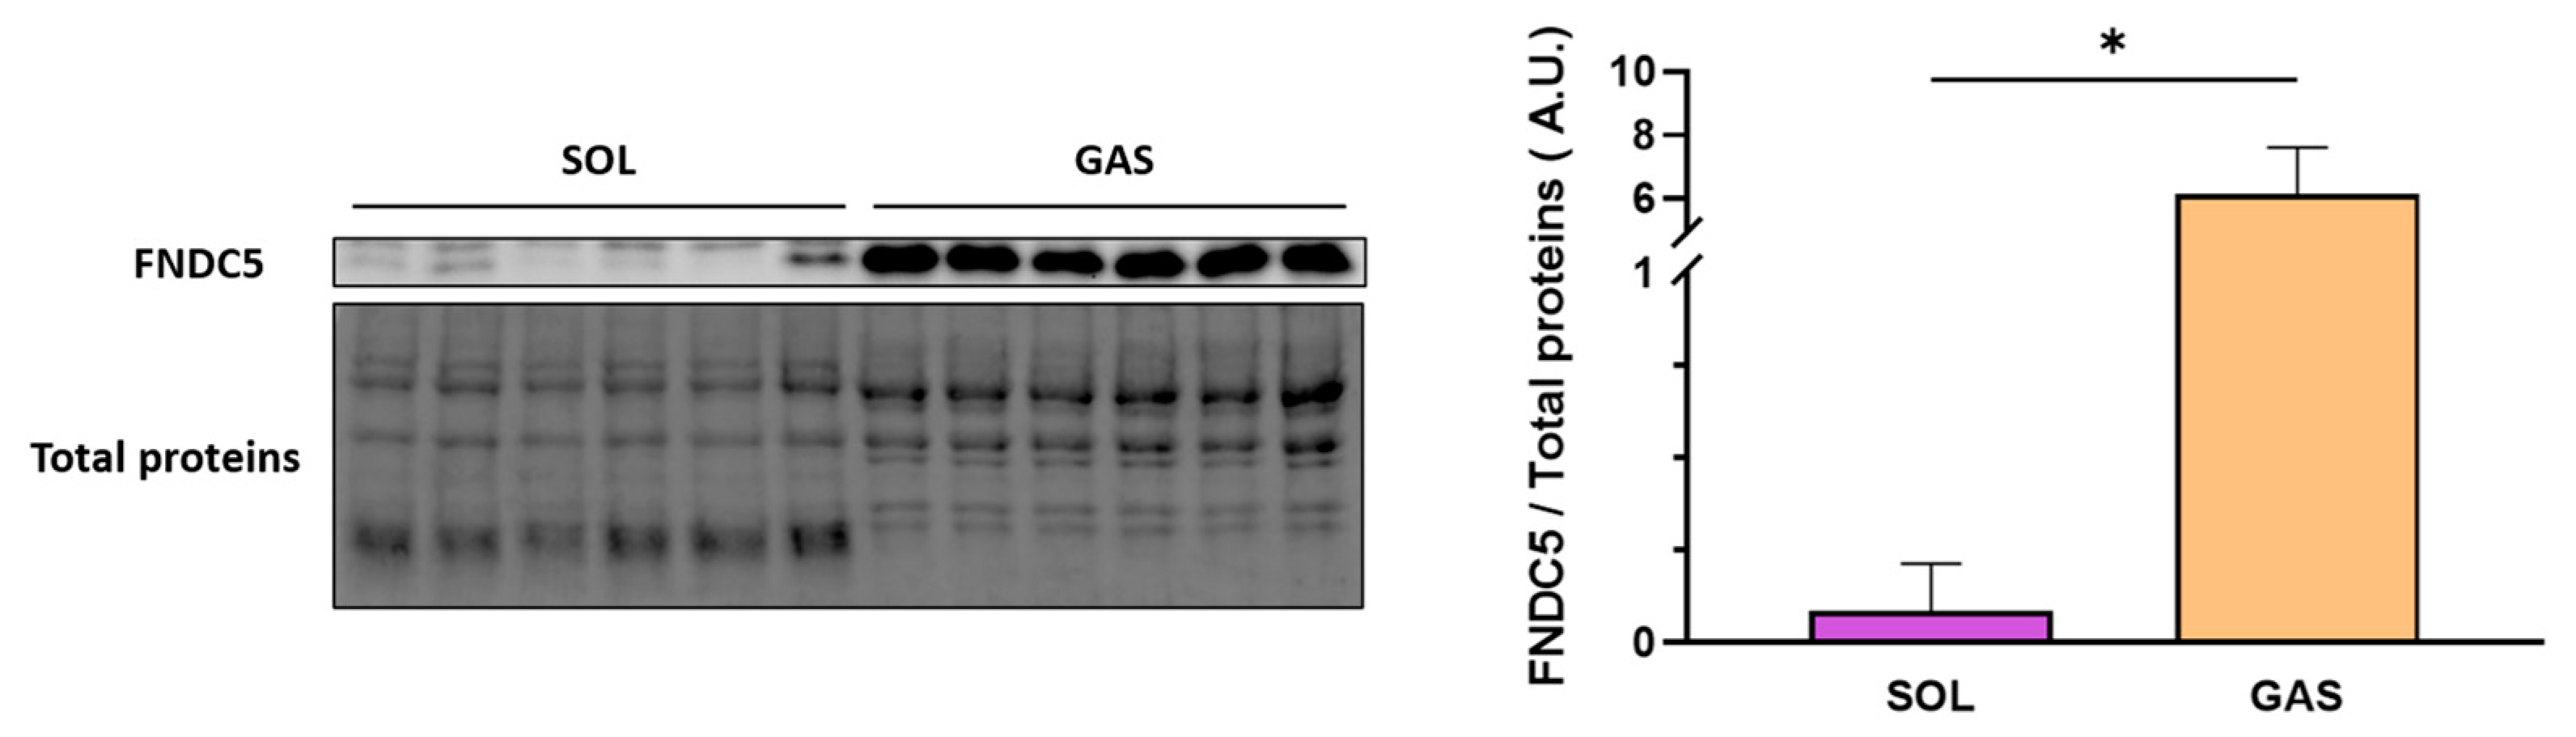
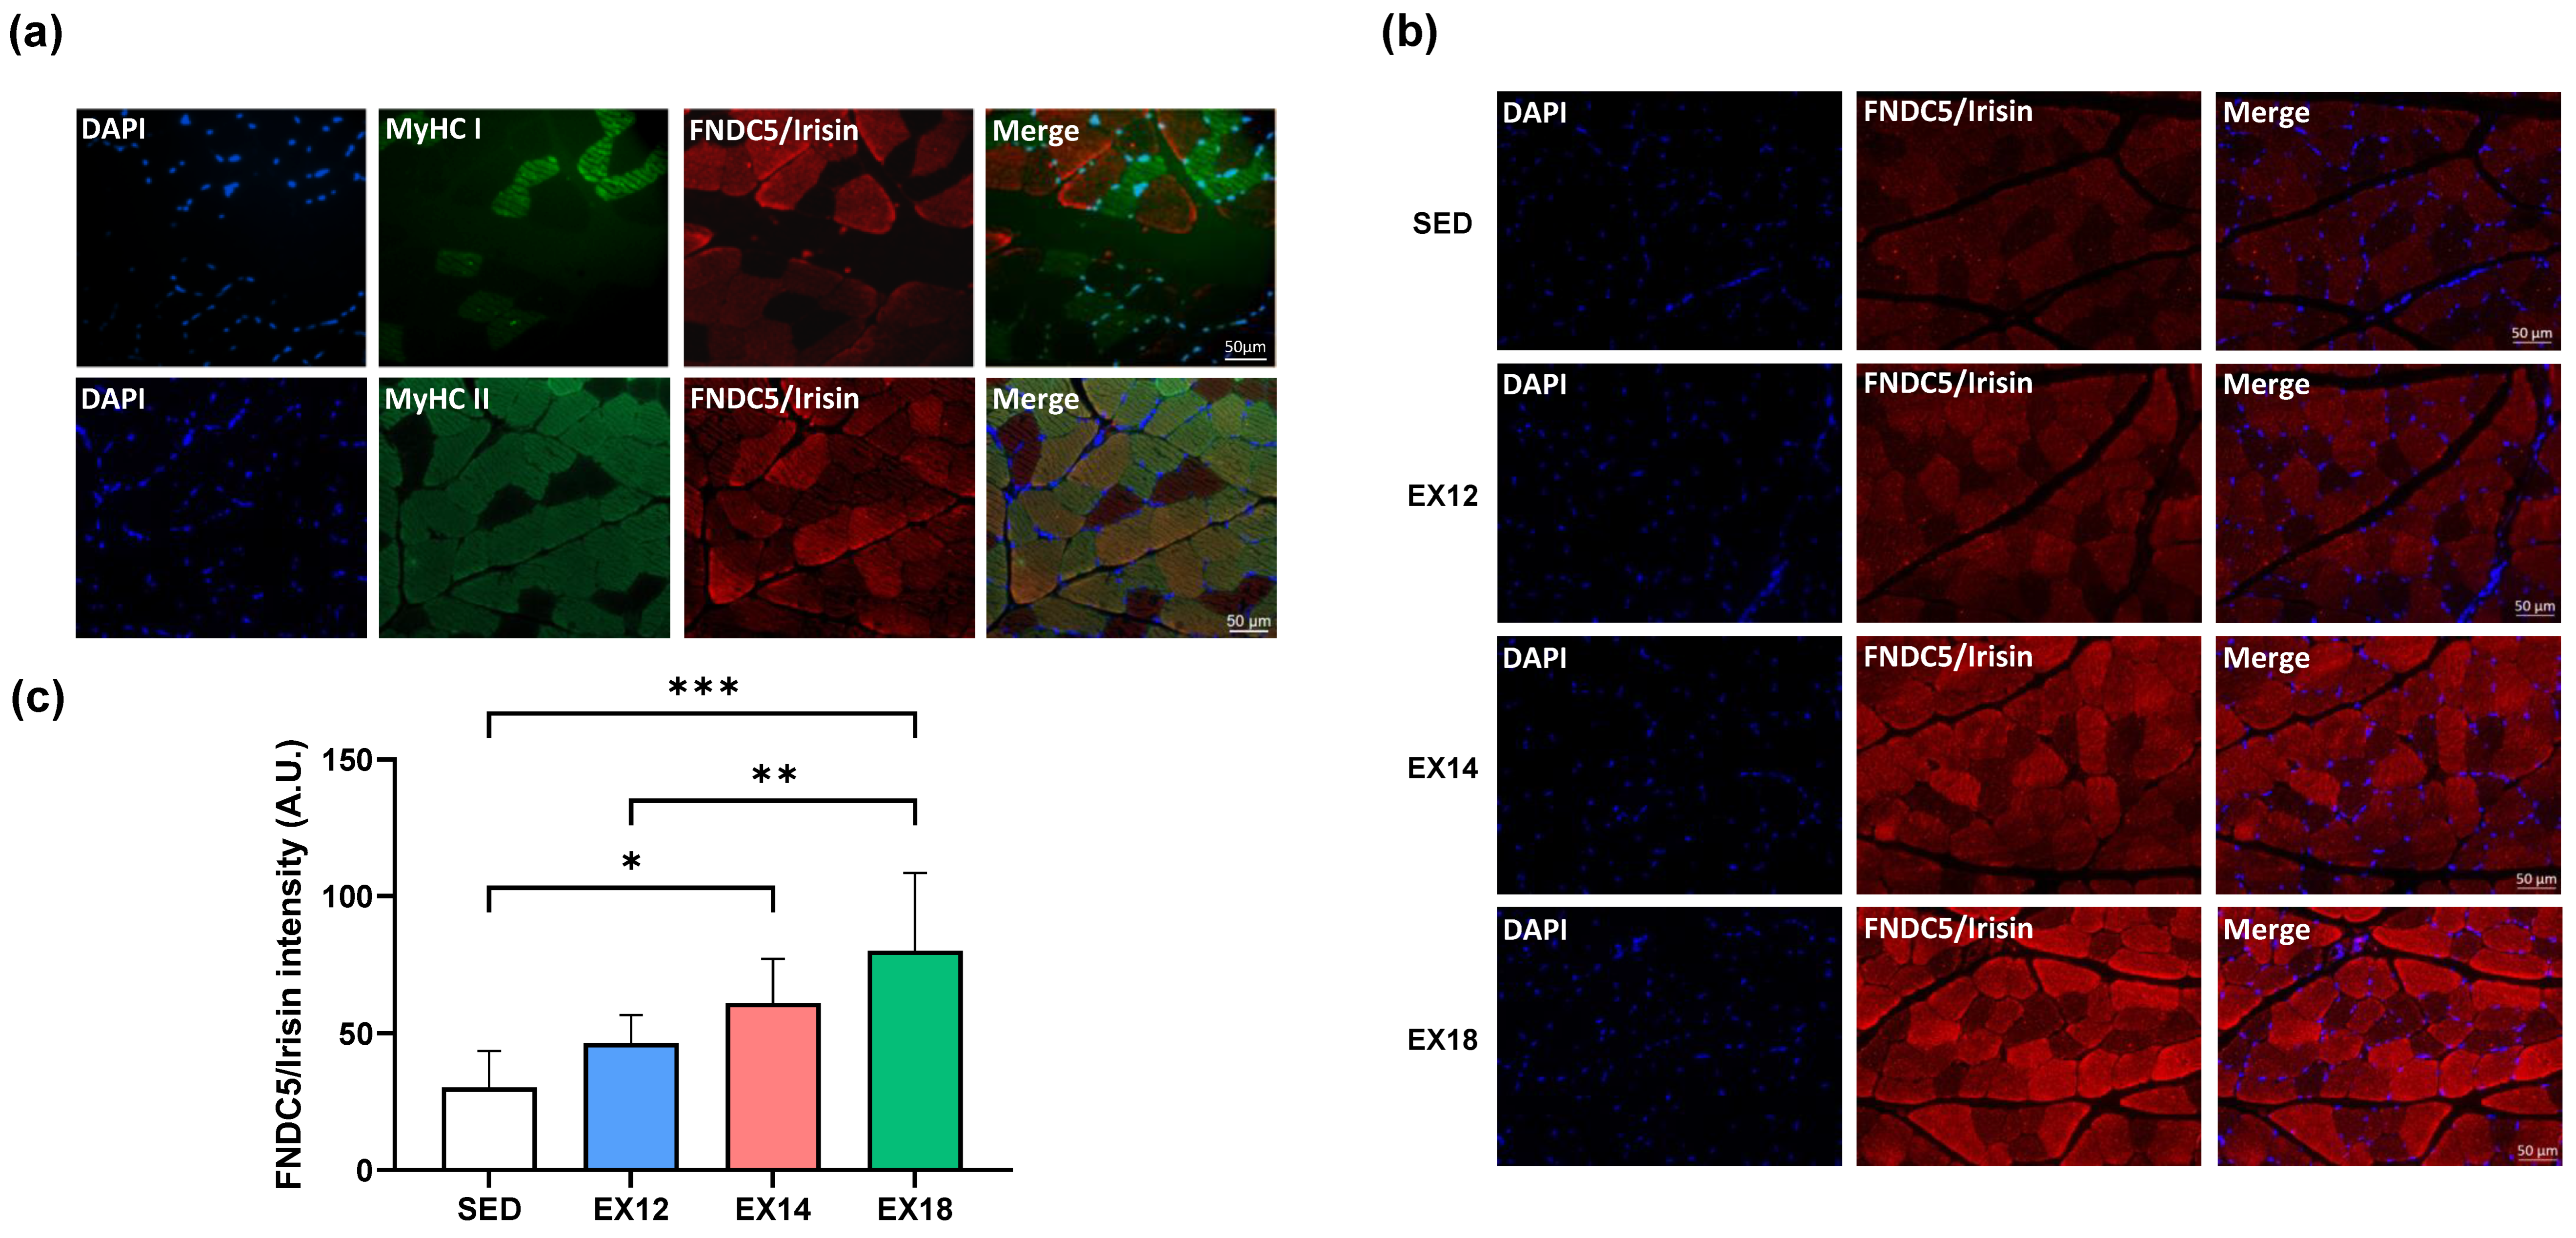
2.5. Exercise Intensity Impacts FNDC5/Irisin Expression and Localization in Muscles Depending on the Type of Fiber Metabolism
2.5.1. FNDC5 Expression in SOL Muscle after Different Extents of EX
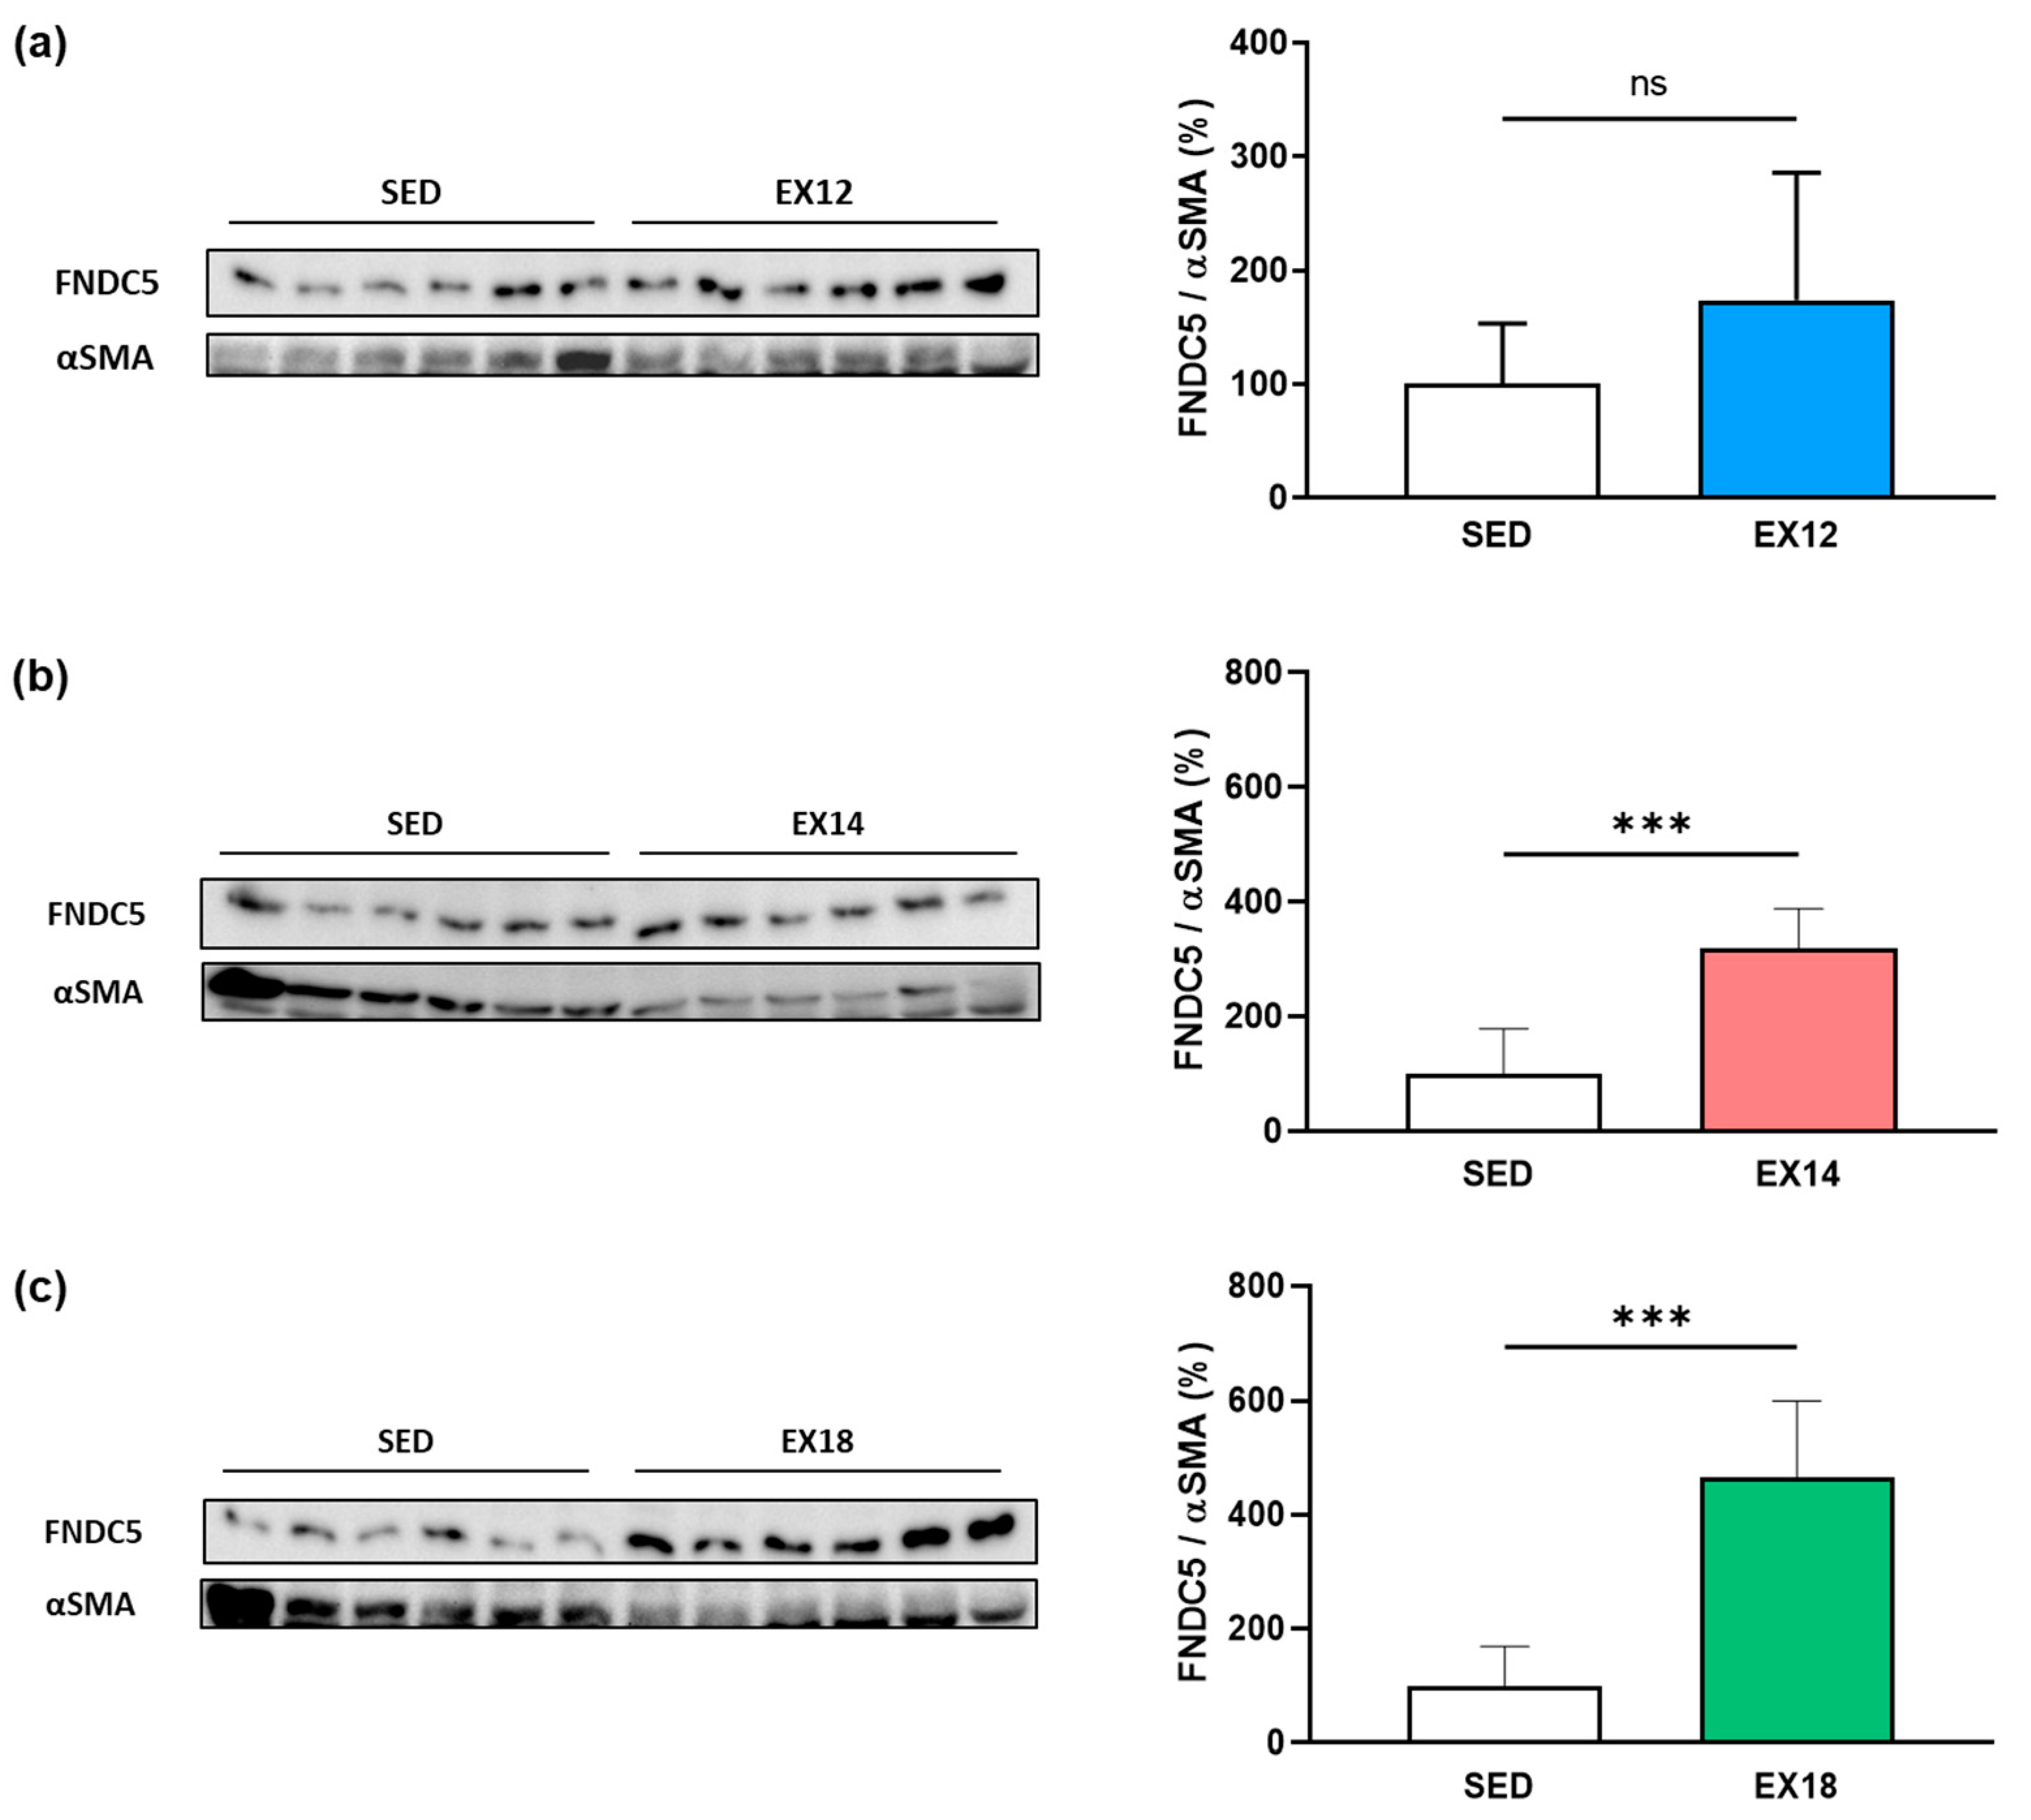
2.5.2. FNDC5 Expression in GAS Muscle after Different Extents of EX
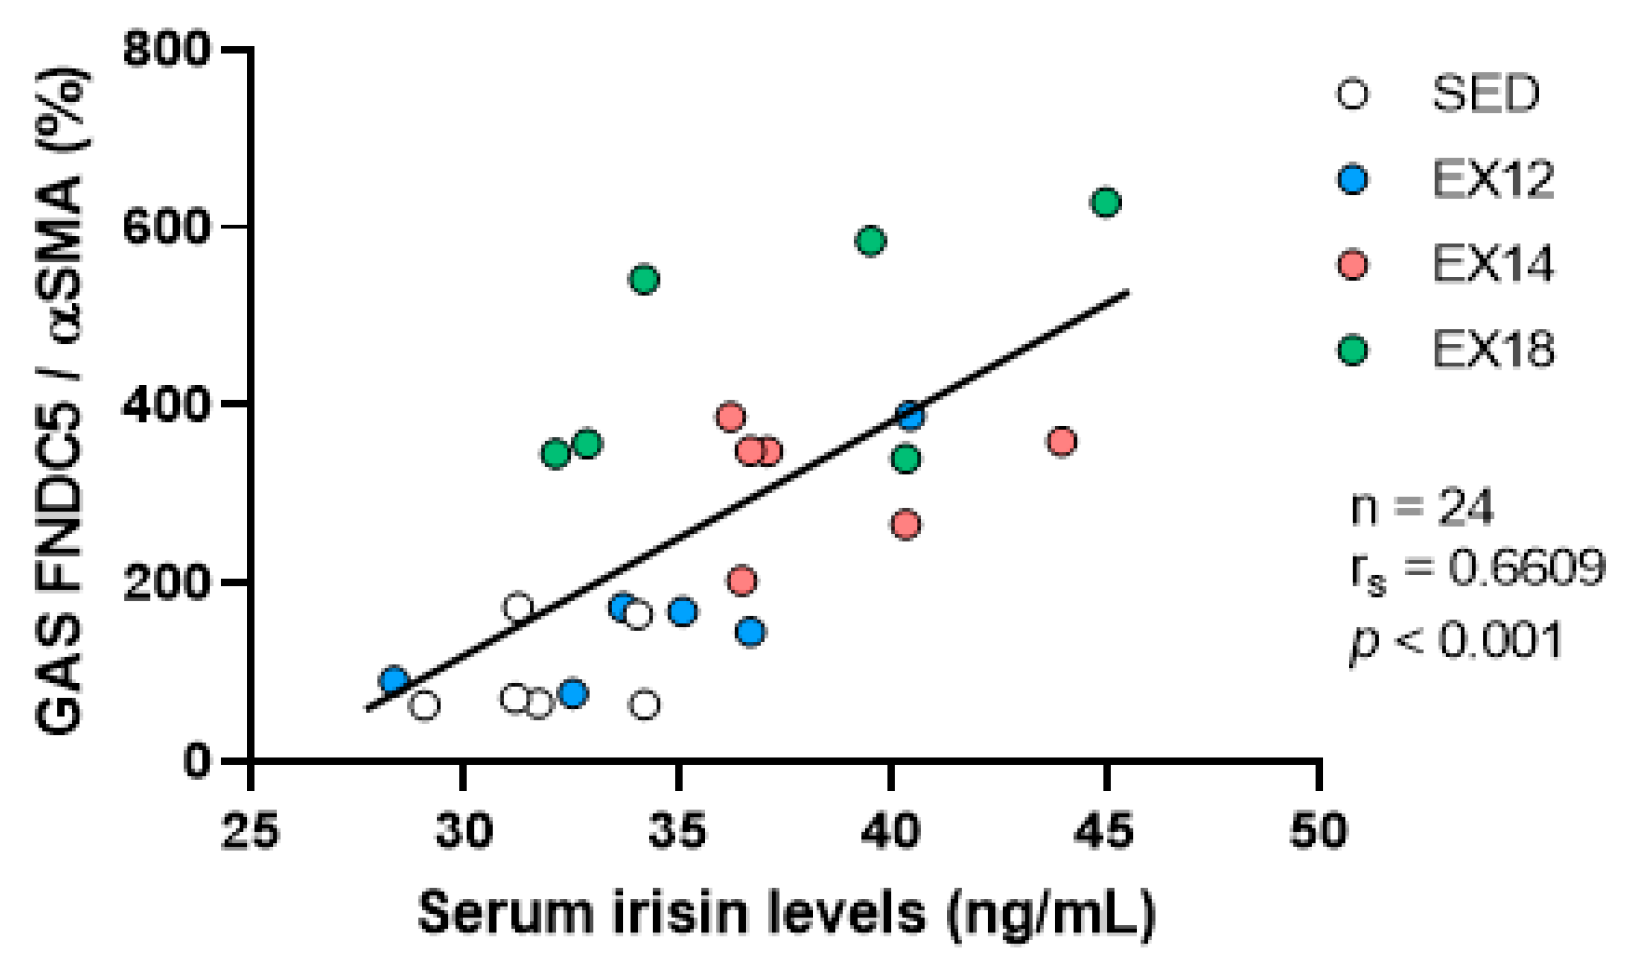
2.6. Correlation of GAS FNDC5/Irisin Expression with Serum Irisin Levels
3. Discussion
4. Materials and Methods
4.1. Animals
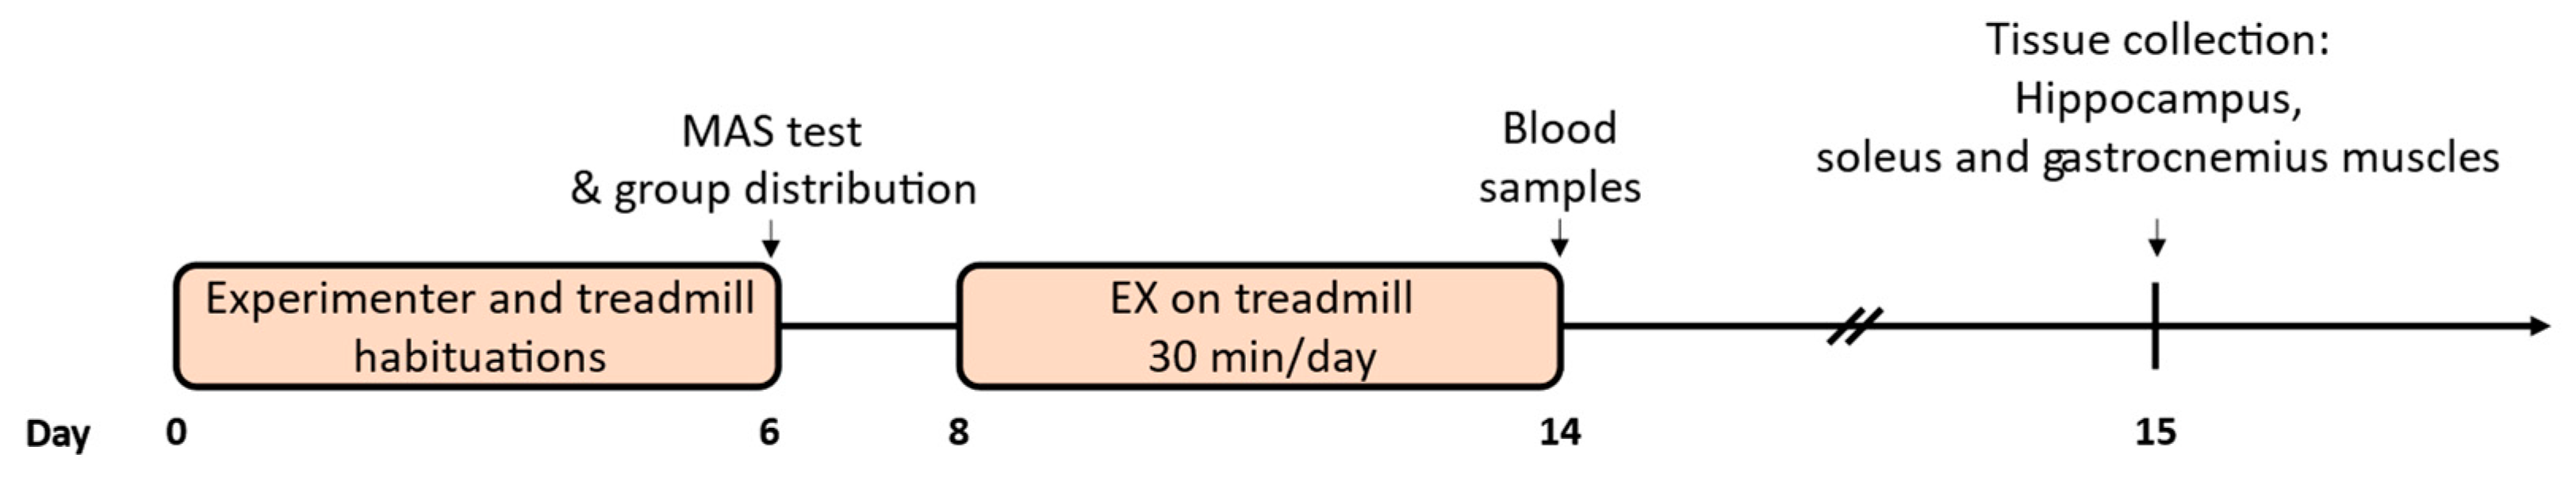
4.2. Physical Exercise Protocol and Animal Groups
4.3. Collection of Samples
4.4. Analysis of Samples
4.4.1. Western Blotting
4.4.2. Immunofluorescence
4.4.3. Enzyme-Link Immunosorbent Assay (ELISA)
4.5. Data and Statistical Analysis
5. Conclusions
Author Contributions
Funding
Institutional Review Board Statement
Data Availability Statement
Acknowledgments
Conflicts of Interest
References
- Myers, J. Exercise and cardiovascular health. Circulation 2003, 107, e2–e5. [Google Scholar] [CrossRef] [PubMed]
- Erickson, K.I.; Kramer, A.F. Aerobic Exercise Effects on Cognitive and Neural Plasticity in Older Adults. Br. J. Sports Med. 2008, 43, 22–24. [Google Scholar] [CrossRef]
- Erickson, K.I.; Voss, M.W.; Prakash, R.S.; Basak, C.; Szabo, A.; Chaddock, L.; Kim, J.S.; Heo, S.; Alves, H.; White, S.M.; et al. Exercise Training Increases Size of Hippocampus and Improves Memory. Proc. Natl. Acad. Sci. USA 2011, 108, 3017–3022. [Google Scholar] [CrossRef] [PubMed]
- Mandolesi, L.; Polverino, A.; Montuori, S.; Foti, F.; Ferraioli, G.; Sorrentino, P.; Sorrentino, G. Effects of Physical Exercise on Cognitive Functioning and Wellbeing: Biological and Psychological Benefits. Front. Psychol. 2018, 9, 509. [Google Scholar] [CrossRef] [PubMed]
- Vaynman, S.; Ying, Z.; Gomez-Pinilla, F. Hippocampal BDNF Mediates the Efficacy of Exercise on Synaptic Plasticity and Cognition. Eur. J. Neurosci. 2004, 20, 2580–2590. [Google Scholar] [CrossRef]
- Intlekofer, K.A.; Berchtold, N.C.; Malvaez, M.; Carlos, A.J.; McQuown, S.C.; Cunningham, M.J.; Wood, M.A.; Cotman, C.W. Exercise and Sodium Butyrate Transform a Subthreshold Learning Event into Long-Term Memory via a Brain-Derived Neurotrophic Factor-Dependent Mechanism. Neuropsychopharmacology 2013, 38, 2027–2034. [Google Scholar] [CrossRef]
- Piepmeier, A.T.; Etnier, J.L. Brain-Derived Neurotrophic Factor (BDNF) as a Potential Mechanism of the Effects of Acute Exercise on Cognitive Performance. J. Sport Health Sci. 2015, 4, 14–23. [Google Scholar] [CrossRef]
- Sleiman, S.F.; Chao, M.V. Downstream Consequences of Exercise Through the Action of BDNF. Brain Plast. 2015, 1, 143–148. [Google Scholar] [CrossRef]
- De Azevedo, K.P.M.; de Oliveira Segundo, V.H.; de Medeiros, G.C.B.S.; de Sousa Mata, Á.N.; García, D.Á.; de Carvalho Leitão, J.C.G.; Knackfuss, M.I.; Piuvezam, G. Effects of Exercise on the Levels of BDNF and Executive Function in Adolescents: A Protocol for Systematic Review and Meta-Analysis. Medicine 2019, 98, e16445. [Google Scholar] [CrossRef]
- Chen, M.J.; Ivy, A.S.; Russo-Neustadt, A.A. Nitric Oxide Synthesis Is Required for Exercise-Induced Increases in Hippocampal BDNF and Phosphatidylinositol 3′ Kinase Expression. Brain Res. Bull. 2006, 68, 257–268. [Google Scholar] [CrossRef]
- Lu, B. BDNF and Activity-Dependent Synaptic Modulation. Learn. Mem. 2003, 10, 86–98. [Google Scholar] [CrossRef] [PubMed]
- Wrann, C.D.; White, J.P.; Salogiannnis, J.; Laznik-Bogoslavski, D.; Wu, J.; Ma, D.; Lin, J.D.; Greenberg, M.E.; Spiegelman, B.M. Exercise Induces Hippocampal BDNF through a PGC-1α/FNDC5 Pathway. Cell Metab. 2013, 18, 649–659. [Google Scholar] [CrossRef]
- Delezie, J.; Handschin, C. Endocrine crosstalk between skeletal muscle and the brain. Front. Neurol. 2018, 9, 698. [Google Scholar] [CrossRef] [PubMed]
- Pedersen, B.K. Physical activity and muscle–brain crosstalk. Nat. Rev. Endocrinol. 2019, 15, 383–392. [Google Scholar] [CrossRef]
- Boström, P.; Wu, J.; Jedrychowski, M.P.; Korde, A.; Ye, L.; Lo, J.C.; Rasbach, K.A.; Boström, E.A.; Choi, J.H.; Long, J.Z.; et al. A PGC1-α-Dependent Myokine That Drives Brown-Fat-like Development of White Fat and Thermogenesis. Nature 2012, 481, 463–468. [Google Scholar] [CrossRef]
- Huh, J.Y.; Panagiotou, G.; Mougios, V.; Brinkoetter, M.; Vamvini, M.T.; Schneider, B.E.; Mantzoros, C.S. FNDC5 and Irisin in Humans: I. Predictors of Circulating Concentrations in Serum and Plasma and II. mRNA Expression and Circulating Concentrations in Response to Weight Loss and Exercise. Metabolism 2012, 61, 1725–1738. [Google Scholar] [CrossRef]
- Moreno-Navarrete, J.M.; Ortega, F.; Serrano, M.; Guerra, E.; Pardo, G.; Tinahones, F.; Ricart, W.; Fernández-Real, J.M. Irisin Is Expressed and Produced by Human Muscle and Adipose Tissue in Association with Obesity and Insulin Resistance. J. Clin. Endocrinol. Metab. 2013, 98, 769–778. [Google Scholar] [CrossRef]
- Islam, M.R.; Valaris, S.; Young, M.F.; Haley, E.B.; Luo, R.; Bond, S.F.; Mazuera, S.; Kitchen, R.R.; Caldarone, B.J.; Bettio, L.E.B.; et al. Exercise Hormone Irisin Is a Critical Regulator of Cognitive Function. Nat. Metab. 2021, 3, 1058–1070. [Google Scholar] [CrossRef]
- Asadi, Y.; Gorjipour, F.; Behrouzifar, S.; Vakili, A. Irisin Peptide Protects Brain against Ischemic Injury Through Reducing Apoptosis and Enhancing BDNF in a Rodent Model of Stroke. Neurochem. Res. 2018, 43, 1549–1560. [Google Scholar] [CrossRef] [PubMed]
- Cefis, M.; Prigent-Tessier, A.; Quirié, A.; Pernet, N.; Marie, C.; Garnier, P. The Effect of Exercise on Memory and BDNF Signaling Is Dependent on Intensity. Brain Struct. Funct. 2019, 224, 1975–1985. [Google Scholar] [CrossRef]
- El Hayek, L.; Khalifeh, M.; Zibara, V.; Abi Assaad, R.; Emmanuel, N.; Karnib, N.; El-Ghandour, R.; Nasrallah, P.; Bilen, M.; Ibrahim, P.; et al. Lactate Mediates the Effects of Exercise on Learning and Memory through SIRT1-Dependent Activation of Hippocampal Brain-Derived Neurotrophic Factor (BDNF). J. Neurosci. 2019, 39, 2369–2382. [Google Scholar] [CrossRef] [PubMed]
- Armstrong, R.B.; Phelps, R.O. Muscle Fiber Type Composition of the Rat Hindlimb. Am. J. Anat. 1984, 171, 259–272. [Google Scholar] [CrossRef] [PubMed]
- Pang, M.; Yang, J.; Rao, J.; Wang, H.; Zhang, J.; Wang, S.; Chen, X.; Dong, X. Time-dependent changes in increased levels of plasma irisin and muscle PGC-1α and FNDC5 after exercise in mice. Tohoku J. Exp. Med. 2018, 244, 93–103. [Google Scholar] [CrossRef] [PubMed]
- Korte, M.; Carroll, P.; Wolf, E.; Brem, G.; Thoenen, H.; Bonhoeffer, T. Hippocampal Long-Term Potentiation Is Impaired in Mice Lacking Brain-Derived Neurotrophic Factor. Proc. Natl. Acad. Sci. USA 1995, 92, 8856–8860. [Google Scholar] [CrossRef]
- Bartoletti, A.; Cancedda, L.; Reid, S.W.; Tessarollo, L.; Porciatti, V.; Pizzorusso, T.; Maffei, L. Heterozygous Knock-Out Mice for Brain-Derived Neurotrophic Factor Show a Pathway-Specific Impairment of Long-Term Potentiation But Normal Critical Period for Monocular Deprivation. J. Neurosci. 2002, 22, 10072–10077. [Google Scholar] [CrossRef] [PubMed]
- Kim, H.; Li, Q.; Hempstead, B.L.; Madri, J.A. Paracrine and Autocrine Functions of Brain-Derived Neurotrophic Factor (BDNF) and Nerve Growth Factor (NGF) in Brain-Derived Endothelial Cells. J. Biol. Chem. 2004, 279, 33538–33546. [Google Scholar] [CrossRef]
- Vaynman, S.; Ying, Z.; Gomez-Pinilla, F. Interplay between Brain-Derived Neurotrophic Factor and Signal Transduction Modulators in the Regulation of the Effects of Exercise on Synaptic-Plasticity. Neuroscience 2003, 122, 647–657. [Google Scholar] [CrossRef]
- Liu, Y.-F.; Chen, H.; Yu, L.; Kuo, Y.-M.; Wu, F.-S.; Chuang, J.-I.; Liao, P.-C.; Jen, C.J. Upregulation of Hippocampal TrkB and Synaptotagmin Is Involved in Treadmill Exercise-Enhanced Aversive Memory in Mice. Neurobiol. Learn. Mem. 2008, 90, 81–89. [Google Scholar] [CrossRef]
- Egan, M.F.; Kojima, M.; Callicott, J.H.; Goldberg, T.E.; Kolachana, B.S.; Bertolino, A.; Zaitsev, E.; Gold, B.; Goldman, D.; Dean, M.; et al. The BDNF Val66met Polymorphism Affects Activity-Dependent Secretion of BDNF and Human Memory and Hippocampal Function. Cell 2003, 112, 257–269. [Google Scholar] [CrossRef]
- Erickson, K.I.; Miller, D.L.; Roecklein, K.A. The Aging Hippocampus: Interactions between Exercise, Depression, and BDNF. Neuroscientist 2012, 18, 82–97. [Google Scholar] [CrossRef]
- Hopkins, M.E.; Davis, F.C.; VanTieghem, M.R.; Whalen, P.J.; Bucci, D.J. Differential Effects of Acute and Regular Physical Exercise on Cognition and Affect. Neuroscience 2012, 215, 59–68. [Google Scholar] [CrossRef]
- Cefis, M.; Chaney, R.; Wirtz, J.; Méloux, A.; Quirié, A.; Leger, C.; Prigent-Tessier, A.; Garnier, P. Molecular Mechanisms Underlying Physical Exercise-Induced Brain BDNF Overproduction. Front. Mol. Neurosci. 2023, 16, 1275924. [Google Scholar] [CrossRef]
- Okamoto, M.; Mizuuchi, D.; Omura, K.; Lee, M.; Oharazawa, A.; Yook, J.S.; Inoue, K.; Soya, H. High-Intensity Intermittent Training Enhances Spatial Memory and Hippocampal Neurogenesis Associated with BDNF Signaling in Rats. Cereb. Cortex 2021, 31, 4386–4397. [Google Scholar] [CrossRef] [PubMed]
- Afzalpour, M.E.; Chadorneshin, H.T.; Foadoddini, M.; Eivari, H.A. Comparing Interval and Continuous Exercise Training Regimens on Neurotrophic Factors in Rat Brain. Physiol. Behav. 2015, 147, 78–83. [Google Scholar] [CrossRef]
- Shirvani, H.; Arabzadeh, E. Metabolic Cross-Talk between Skeletal Muscle and Adipose Tissue in High-Intensity Interval Training vs. Moderate-Intensity Continuous Training by Regulation of PGC-1α. Eat. Weight Disord.—Stud. Anorex. Bulim. Obes. 2020, 25, 17–24. [Google Scholar] [CrossRef] [PubMed]
- Arabzadeh, E.; Shirvani, H.; Ebadi Zahmatkesh, M.; Riyahi Malayeri, S.; Meftahi, G.H.; Rostamkhani, F. Irisin/FNDC5 Influences Myogenic Markers on Skeletal Muscle Following High and Moderate-Intensity Exercise Training in STZ-Diabetic Rats. 3 Biotech 2022, 12, 193. [Google Scholar] [CrossRef] [PubMed]
- Wang, T.; Maltez, M.T.; Lee, H.W.; Ahmad, M.; Wang, H.-W.; Leenen, F.H.H. Effect of Exercise Training on the FNDC5/BDNF Pathway in Spontaneously Hypertensive Rats. Physiol. Rep. 2019, 7, e14323. [Google Scholar] [CrossRef]
- Kim, H.; Wrann, C.D.; Jedrychowski, M.; Vidoni, S.; Kitase, Y.; Nagano, K.; Zhou, C.; Chou, J.; Parkman, V.-J.A.; Novick, S.J.; et al. Irisin Mediates Effects on Bone and Fat via AV Integrin Receptors. Cell 2018, 175, 1756–1768. [Google Scholar] [CrossRef]
- Mu, A.; Wales, T.E.; Zhou, H.; Draga-Coletă, S.-V.; Gorgulla, C.; Blackmore, K.A.; Mittenbühler, M.J.; Kim, C.R.; Bogoslavski, D.; Zhang, Q.; et al. Irisin Acts through Its Integrin Receptor in a Two-Step Process Involving Extracellular Hsp90α. Mol. Cell 2023, 83, 1903–1920. [Google Scholar] [CrossRef]
- Short, S.M.; Talbott, G.A.; Juliano, R.L. Integrin-Mediated Signaling Events in Human Endothelial Cells. Mol. Biol. Cell 1998, 9, 1969–1980. [Google Scholar] [CrossRef]
- Fu, J.; Han, Y.; Wang, J.; Liu, Y.; Zheng, S.; Zhou, L.; Jose, P.A.; Zeng, C. Irisin Lowers Blood Pressure by Improvement of Endothelial Dysfunction via AMPK-Akt-eNOS-NO Pathway in the Spontaneously Hypertensive Rat. J. Am. Heart Assoc. 2016, 5, e003433. [Google Scholar] [CrossRef] [PubMed]
- Lavi, G.; Horwitz, A.; Einstein, O.; Zipori, R.; Gross, O.; Birk, R. Fndc5/Irisin Is Regulated by Myogenesis Stage, Irisin, Muscle Type and Training. Am. J. Transl. Res. 2022, 14, 7063–7079. [Google Scholar] [PubMed]
- Tsuchiya, Y.; Mizuno, S.; Goto, K. Irisin Response to Downhill Running Exercise in Humans. J. Exerc. Nutr. Biochem. 2018, 22, 12–17. [Google Scholar] [CrossRef]
- Men, X.-M.; Xu, Z.-W.; Tao, X.; Deng, B.; Qi, K.-K. FNDC5 Expression Closely Correlates with Muscle Fiber Types in Porcine Longissimus Dorsi Muscle and Regulates Myosin Heavy Chains (MyHCs) mRNA Expression in C2C12 Cells. PeerJ 2021, 9, e11065. [Google Scholar] [CrossRef] [PubMed]
- Yu, Q.; Kou, W.; Xu, X.; Zhou, S.; Luan, P.; Xu, X.; Li, H.; Zhuang, J.; Wang, J.; Zhao, Y.; et al. FNDC5/Irisin Inhibits Pathological Cardiac Hypertrophy. Clin. Sci. 2019, 133, 611–627. [Google Scholar] [CrossRef]
- Gouspillou, G.; Sgarioto, N.; Norris, B.; Barbat-Artigas, S.; Aubertin-Leheudre, M.; Morais, J.A.; Burelle, Y.; Taivassalo, T.; Hepple, R.T. The relationship between muscle fiber type-specific PGC-1α content and mitochondrial content varies between rodent models and humans. PLoS ONE 2014, 9, e0103044. [Google Scholar] [CrossRef]
- Alzoughool, F.; Al-Zghoul, M.B.; Ghanim, B.Y.; Atoum, M.; Aljawarneh, Y.; Idkaidek, N.; Qinna, N.A. Impact of Sustained Exogenous Irisin Myokine Administration on Muscle and Myocyte Integrity in Sprague Dawley Rats. Metabolites 2022, 12, 939. [Google Scholar] [CrossRef]
- Nygaard, H.; Slettaløkken, G.; Vegge, G.; Hollan, I.; Whist, J.E.; Strand, T.; Rønnestad, B.R.; Ellefsen, S. Irisin in Blood Increases Transiently after Single Sessions of Intense Endurance Exercise and Heavy Strength Training. PLoS ONE 2015, 10, e0121367. [Google Scholar] [CrossRef]
- Maak, S.; Norheim, F.; Drevon, C.A.; Erickson, H.P. Progress and Challenges in the Biology of FNDC5 and Irisin. Endocr. Rev. 2021, 42, 436–456. [Google Scholar] [CrossRef]


| Baseline Characteristics/Groups | SED | EX12 | EX14 | EX18 |
|---|---|---|---|---|
| Body weight (BW, g) | 373.30 ± 22.51 | 385.00 ± 17.61 | 390.80 ± 15.30 | 375.00 ± 11.40 |
| Soleus muscle weight (SOLW, mg) | 153.70 ± 25.14 | 180.10 ± 17.05 | 188.40 ± 14.49 * | 181.50 ± 26.13 |
| Gastrocnemius muscle weight (GASW, mg) | 654.70 ± 171.90 | 772.10 ± 108.70 | 813.20 ± 88.90 | 760.60 ± 85.53 |
| SOLW (mg)/BW (g) | 0.41 ± 0.07 | 0.47 ± 0.04 | 0.48 ± 0.04 | 0.48 ± 0.07 |
| GASW (mg)/BW (g) | 1.75 ± 0.41 | 2.01 ± 0.29 | 2.08 ± 0.19 | 2.03 ± 0.23 |
| Average MAS (m/min) | 27.00 ± 11.20 | 32.00 ± 1.60 | 30.00 ± 2.70 | 27.00 ± 5.00 |
| Target Proteins, MW | Primary Antibody | Secondary Antibody |
|---|---|---|
| FNDC5, 24 kDa | Abcam ab174833, rabbit monoclonal, 1/3000 + nonfat dry milk 5% | Jackson ImmunoResearch Lab 111-035-144, HRP-conjugated goat polyclonal, 1/25,000 |
| BDNF (mature form), 15 kDa | Abcam ab108319, rabbit monoclonal, 1/3000 + nonfat dry milk 5% | |
| αSMA (muscle internal control), 42 kDa | Abcam ab28052, mouse monoclonal, 1/5000 + nonfat dry milk 5% | Jackson ImmunoResearch Lab 115-035-166, HRP-conjugated goat polyclonal, 1/30,000 |
| β-actin (hippocampal internal control), 42 kDa | Sigma-Aldrich A5441, mouse monoclonal 1/5000 + nonfat dry milk 5% |
| Target Proteins | Target Cells | Primary Antibody | Secondary Antibody |
|---|---|---|---|
| FNDC5/Irisin | \ | Abcam ab174833, rabbit monoclonal, 1/150 | A11036 Invitrogen, Alexa Fluor 568, 1/800 |
| MyHC I | Slow muscle oxidative fibers | Abcam ab11083, mouse monoclonal, 1/200 | A11029 Invitrogen, Alexa Fluor 488, 1/1000 |
| MyHC II | Fast muscle glycolytic/oxidative fibers | Abcam ab51263, mouse monoclonal, 1/300 |
Disclaimer/Publisher’s Note: The statements, opinions and data contained in all publications are solely those of the individual author(s) and contributor(s) and not of MDPI and/or the editor(s). MDPI and/or the editor(s) disclaim responsibility for any injury to people or property resulting from any ideas, methods, instructions or products referred to in the content. |
© 2024 by the authors. Licensee MDPI, Basel, Switzerland. This article is an open access article distributed under the terms and conditions of the Creative Commons Attribution (CC BY) license (https://creativecommons.org/licenses/by/4.0/).
Share and Cite
Leger, C.; Quirié, A.; Méloux, A.; Fontanier, E.; Chaney, R.; Basset, C.; Lemaire, S.; Garnier, P.; Prigent-Tessier, A. Impact of Exercise Intensity on Cerebral BDNF Levels: Role of FNDC5/Irisin. Int. J. Mol. Sci. 2024, 25, 1213. https://doi.org/10.3390/ijms25021213
Leger C, Quirié A, Méloux A, Fontanier E, Chaney R, Basset C, Lemaire S, Garnier P, Prigent-Tessier A. Impact of Exercise Intensity on Cerebral BDNF Levels: Role of FNDC5/Irisin. International Journal of Molecular Sciences. 2024; 25(2):1213. https://doi.org/10.3390/ijms25021213
Chicago/Turabian StyleLeger, Clémence, Aurore Quirié, Alexandre Méloux, Estelle Fontanier, Rémi Chaney, Christelle Basset, Stéphanie Lemaire, Philippe Garnier, and Anne Prigent-Tessier. 2024. "Impact of Exercise Intensity on Cerebral BDNF Levels: Role of FNDC5/Irisin" International Journal of Molecular Sciences 25, no. 2: 1213. https://doi.org/10.3390/ijms25021213