Article

Comparative Analysis of Chloroplast Genome of Meconopsis (Papaveraceae) Provides Insights into Their Genomic Evolution and Adaptation to High Elevation

1
State Key Laboratory of Hybrid Rice, College of Life Sciences, Wuhan University, Wuhan 430072, China
2
Key Laboratory of Biodiversity and Environment on the Qinghai-Tibet Plateau of Ministry of Education, College of Life Sciences, Wuhan University, Wuhan 430072, China
3
Laboratory of Extreme Environment Biological Resources and Adaptive Evolution, School of Ecology and Environment, Tibet University, Lhasa 850000, China
4
Biology Experimental Teaching Center, School of Life Science, Wuhan University, Wuhan 430072, China
*
Author to whom correspondence should be addressed.
Int. J. Mol. Sci. 2024, 25(4), 2193; https://doi.org/10.3390/ijms25042193
Submission received: 1 December 2023 / Revised: 6 February 2024 / Accepted: 7 February 2024 / Published: 12 February 2024
(This article belongs to the Collection Feature Papers in Molecular Plant Sciences)

Abstract

:
The Meconopsis species are widely distributed in the Qinghai-Tibet Plateau, Himalayas, and Hengduan Mountains in China, and have high medicinal and ornamental value. The high diversity of plant morphology in this genus poses significant challenges for species identification, given their propensity for highland dwelling, which makes it a question worth exploring how they cope with the harsh surroundings. In this study, we recently generated chloroplast (cp) genomes of two Meconopsis species, Meconopsis paniculata (M. paniculata) and M. pinnatifolia, and compared them with those of ten Meconopsis cp genomes to comprehend cp genomic features, their phylogenetic relationships, and what part they might play in plateau adaptation. These cp genomes shared a great deal of similarities in terms of genome size, structure, gene content, GC content, and codon usage patterns. The cp genomes were between 151,864 bp and 154,997 bp in length, and contain 133 predictive genes. Through sequence divergence analysis, we identified three highly variable regions (trnD-psbD, ccsA-ndhD, and ycf1 genes), which could be used as potential markers or DNA barcodes for phylogenetic analysis. Between 22 and 38 SSRs and some long repeat sequences were identified from 12 Meconopsis species. Our phylogenetic analysis confirmed that 12 species of Meconopsis clustered into a monophyletic clade in Papaveraceae, which corroborated their intrageneric relationships. The results indicated that M. pinnatifolia and M. paniculata are sister species in the phylogenetic tree. In addition, the atpA and ycf2 genes were positively selected in high-altitude species. The functions of these two genes might be involved in adaptation to the extreme environment in the cold and low CO2 concentration conditions at the plateau.

1. Introduction

Chloroplast, a kind of plastid, is a photosynthetic organelle unique to higher plants and some algae, and it has the function of synthesizing starch, fatty acid, pigment, and protein [1]. Chloroplasts have a complete genetic system, and the independent genetic information within the system is called the chloroplast genomes (cp genomes) [2]. Most cp genomes have a typical quadripartite structure, and their covalently closed double-stranded ring structure is the most typical, which can be divided into regions: A large single copy area (LSC), a small single copy area (SSC), and two isometric inverted regions (IRa and IRb). The size of the cp genomes of higher plants generally ranges from 110 to 160 kb. Usually, there are between 120 and 130 genes with coding functions in the cp genomes, which can be roughly divided into 3 categories related to the photosynthetic system, transcription and translation, and other biosynthesis of amino acids, fatty acids, pigments, and so on [2]. The cp genomes are characterized by sequence conservation, structural simplicity, and uniparental inheritance [3]. The cp genomes are relatively simple and easy to obtain. Compared with the nuclear genome, the genetic information of the cp genomes is independent, providing valuable information in tracing the origin of species, revealing the direction of evolution and genealogical structure, and also a means to differentiate among taxa. With the rapid development of molecular biology, the sequencing technology of the genome has gradually become mature [4], along with the continuous innovation of biotechnology, the research at the genetic level has deepened, and the research on the use of genetic information from the cp genomes has gradually increased.
The genus Meconopsis is one of the more diverse genera in the Papaveraceae family, with more than 70 species, and it forms an important part of the ecological diversity of the Tibetan Plateau region [5]. The Meconopsis species are famous ornamental plants, known for their large flowers and colorful and beautiful appearance; they rank among the most striking flowers found in alpine plants. Meconopsis species have a long clinical history in China and other Asian countries, and their medicinal value is highly valued. Plant extracts from the Meconopsis species have been reported to possess the effects of clearing heat and detoxification, reducing swelling and pain, and having antioxidant and anti-tumor effects [6,7,8]. These plants are mainly distributed in the Qinghai-Tibet Plateau (QTP), the Hengduan Mountains, and the Himalayan region at an altitude of 2000~5800 m. Their habitats range from temperate forests to alpine meadows and alpine tundra with rhyolite flats [9,10]. The uplift of the QTP, which occurred during the Late Tertiary and Early Quaternary, dramatically changed the distribution and genetic differentiation of the Meconopsis species [9,11]. The uplift of the QTP and the evolution of climate caused ecological habitat changes [12]. After geographical isolation and natural selection, the separation of species is formed, which leads to the formation of new species. Frequent hybridization creates opportunities for new species to form, as pollen and seed dispersal or other factors lead to secondary contact between already isolated populations. Isolation, natural selection, and hybridization jointly drive the diversity of the Meconopsis species [13]. However, hybridization has also resulted in morphological (e.g., style length and presence of stylar discs) and karyotypic differences in some Meconopsis species, making it difficult to classify them on the basis of macromorphological features such as floral colors alone [14]. Consequently, it is crucial to look for more molecular data to improve species identification, and thus explore and refine the phylogenetic relationships within the genus. In comparison to traditional morphological markers, molecular markers have many advantages, including easy assay, stability regardless of environmental or external factors, and representation throughout entire genomes [15]. Therefore, molecular markers are used as important tools for evaluating genetic diversity among plant species and for plant molecular breeding. In plant species, the cp genome is widely used for phylogenetic analyses and molecular marker development to improve phylogenetic resolution at the interspecific level. A great deal of research has been conducted using molecular markers in the study of the phylogeny of the genus Meconopsis [16,17]. Previous studies have complemented previous morphology-based treatments on the phylogenetic relationships of a few Meconopsis species through large-scale sampling and the construction of phylogenetic models using molecular markers [5]. Numerous studies have concentrated on the medicinal usefulness and phylogeny of the Meconopsis species. However, there are few studies examining the adaptive evolution of the Meconopsis species to the distinctive alpine habitats they occupy.
Throughout its dispersal to diverse alpine regions, the Meconopsis species have undergone rapid evolutionary radiation, which makes it ideal for studying how alpine regions affect species formation and differentiation, and for understanding how these species are adapted to alpine environments [11]. High-altitude habitats typically exhibit distinct environmental features, including low temperature, intense radiation, and low CO2 concentration, which may produce some changes in environmental adaptation genes [18,19]. Evolution by natural selection is a direct response to selection pressure. Phylogenetic methods can utilize protein-coding genes (PCGs) to determine gene evolutionary rates and identify natural selection imprints [20]. The cp genomes are conserved and play an integral role in the photosynthetic process. This provides a valuable opportunity to investigate their adaptive evolution. Many plants’ high-altitude adaptation mechanisms focus on the nuclear genome [21,22,23], while there are fewer studies on the accelerated evolution of cp genomes due to high-altitude adaptation [24,25,26]. Previous studies have confirmed that genes of atp (atpA and atpF), ndh (ndhA, ndhF, and ndhH), and ycf (ycf1 and ycf4) families in chloroplasts of alpine species tend to exhibit higher evolutionary rates than those of low-altitude species [26]. As most Meconopsis species are found in alpine environments, it is possible to investigate the selection that their cp genomes undergo during environmental acclimatization.
In this study, our objective was to gather insights from the chloroplast genome to better understand the genetic characteristics and adaptive evolution of the Meconopsis species. For the first time, a cp genome characterization and adaptive analysis of Meconopsis was carried out. First, the cp genomes of two species of M. paniculata and M. pinnatifolia were newly sequenced. Together with 10 cp genomes (M. racemosa, M. henrici, M. punicea, M. quintuplinervia, M. pseudohorridula, M. simplicifolia, M. betonicifolia, M. horridula, M. integrifolia, and M. bella) available in GenBank, 12 cp genomes were comparatively analyzed using DNA data from NCBI, including genome size, gene content, structure, GC content, IR boundaries, nucleotide diversity, codon usage, and SSR distribution. On this basis, together with the cp genomes of 44 other Papaveraceae species (all available in NCBI), we reconstructed part of the topology of Papaveraceae and investigated the phylogenetic relationships of 12 species of the genus Meconopsis in the Papaveraceae family. In addition, we investigated some genes and loci at the genus level that may have accelerated evolution induced by extreme environments. In summary, in this study, we aimed to (1) understand the characteristics of the cp genomes of Meconopsis (two newly collected and all available in NCBI) and its evolutionary process and (2) understand whether natural selection has influenced the cp genomes of Meconopsis in adaptation to the extreme high-altitude environment.

2. Results and Discussion

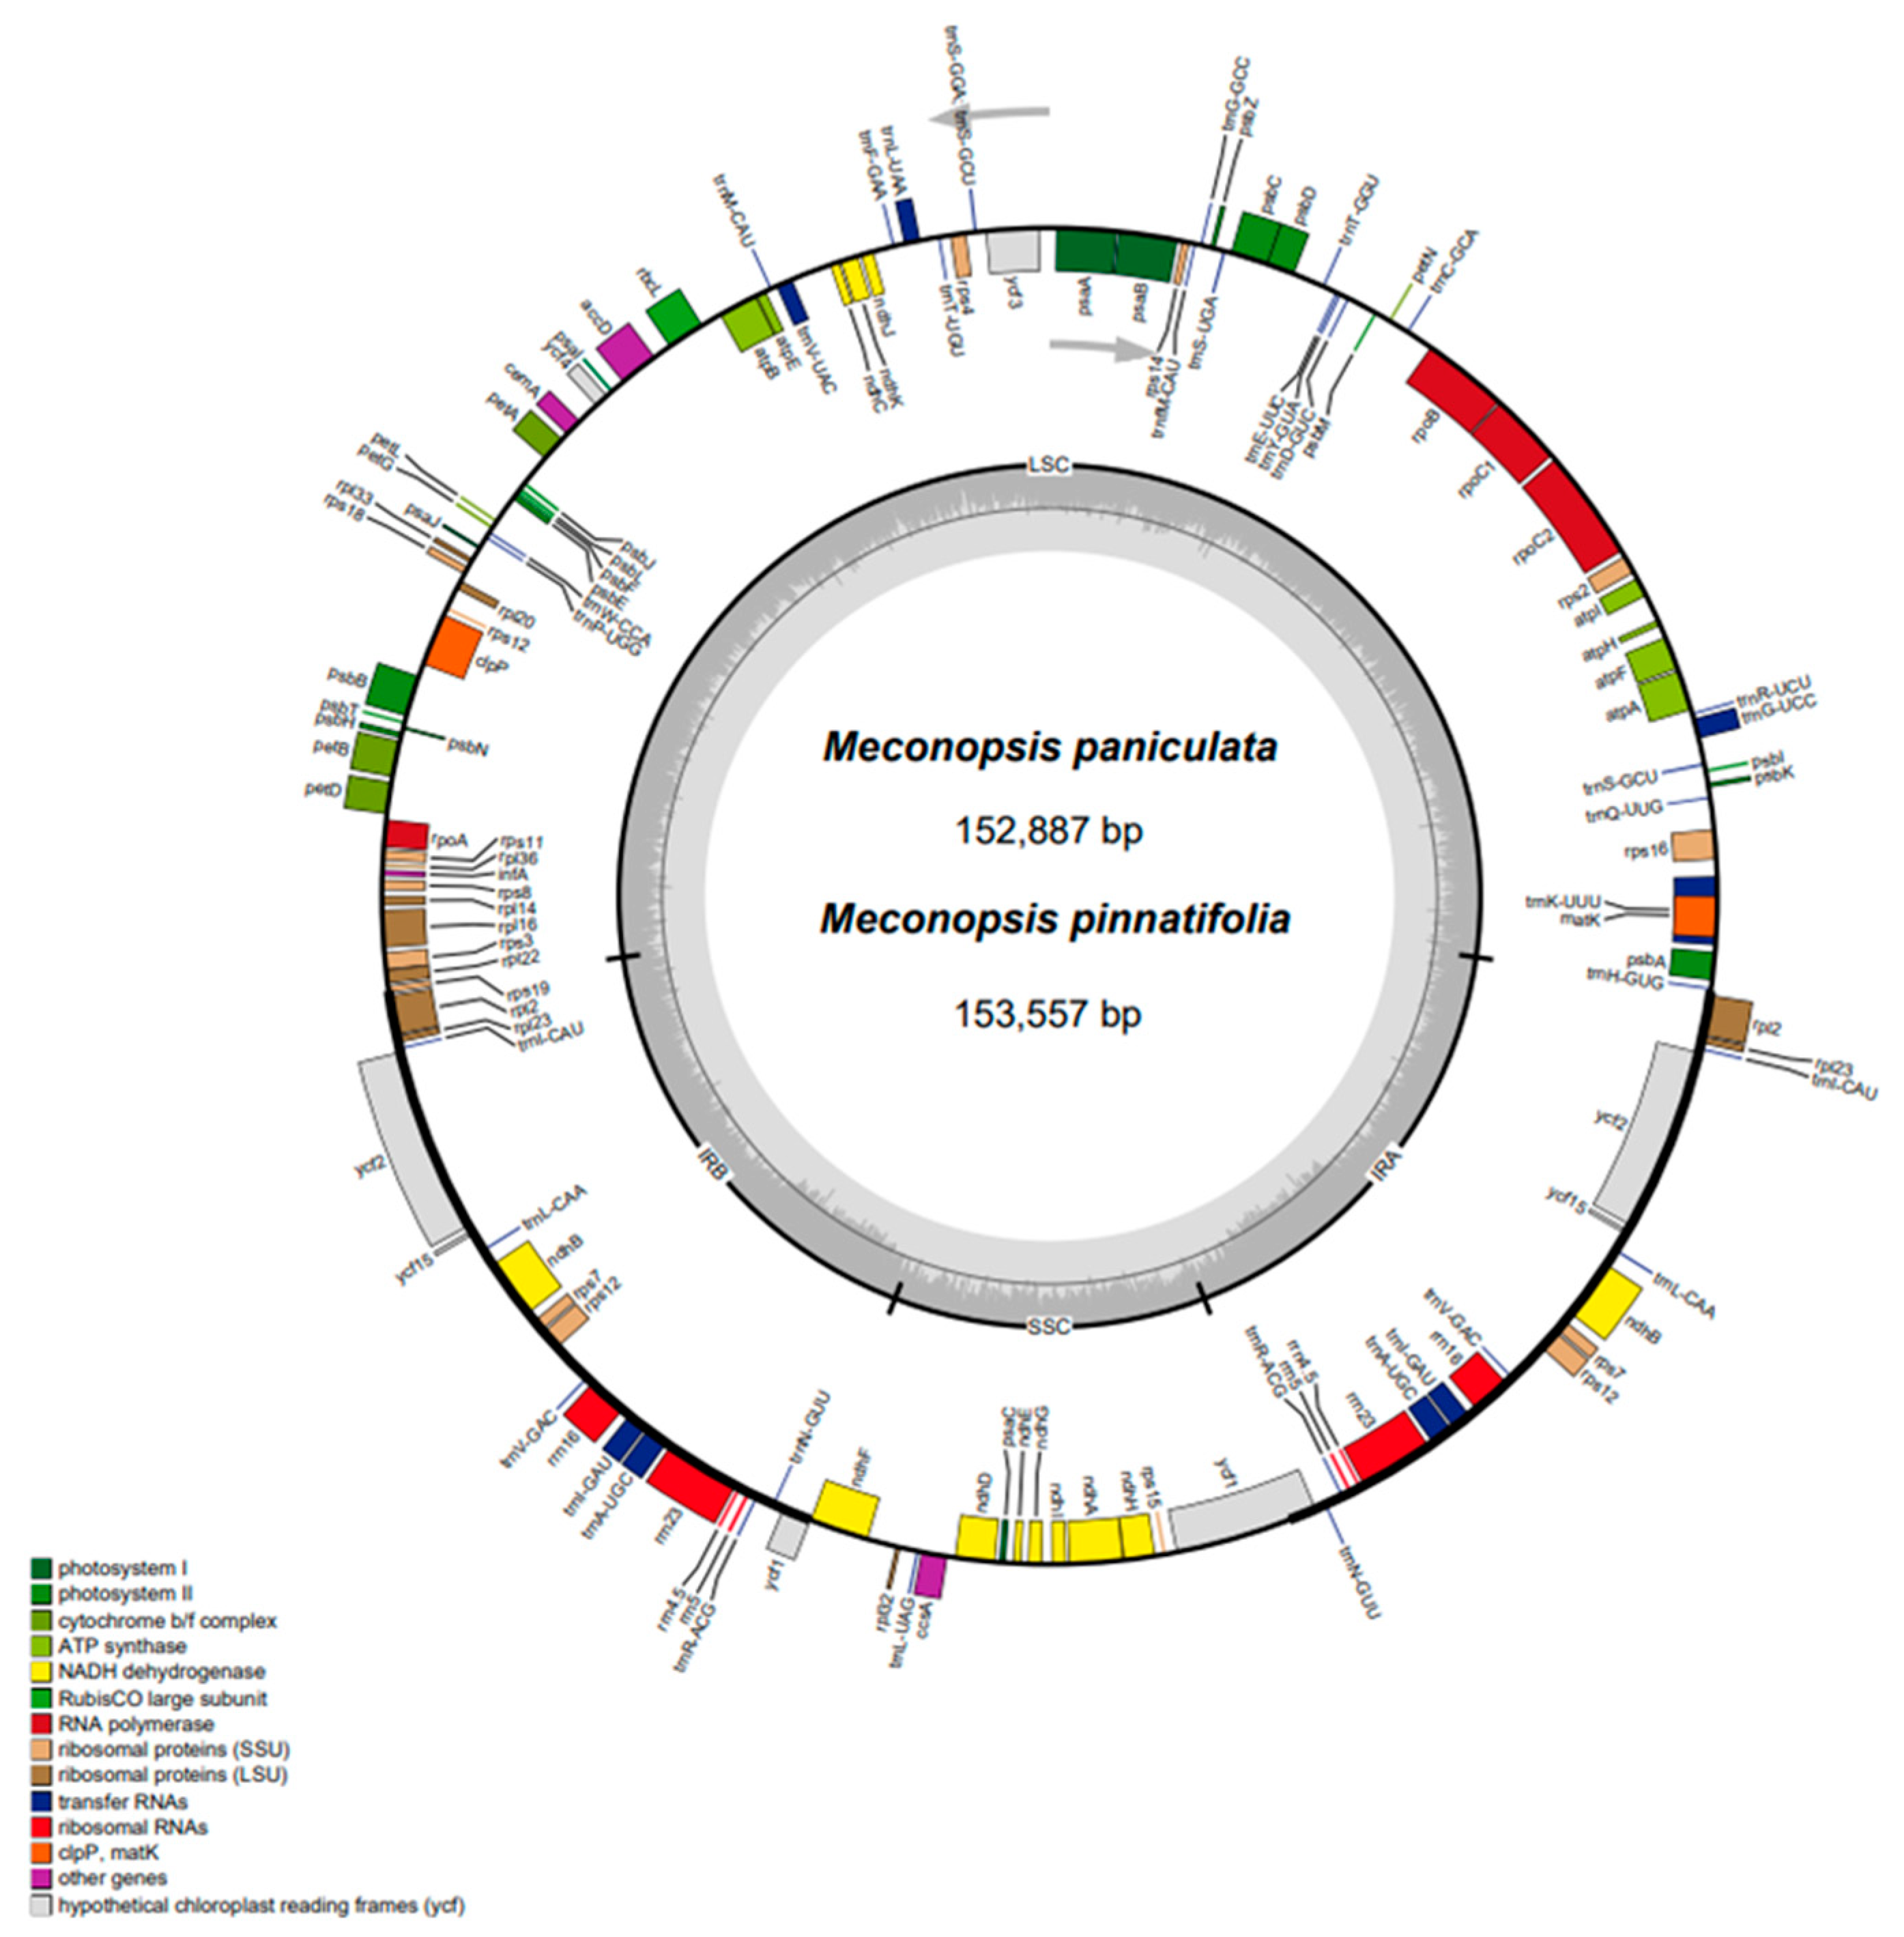
2.1. Characterization of the CP Genome Structure of Meconopsis Species

After filtering, the two newly sequenced species yielded over 4 gigabases (Gb) of clean data. When mapped with clean short reads, both data were assembled into high-quality contigs without any gap. These contigs were subsequently circularized, fully annotated, and manually checked against other cp genomes in the Papaveraceae family (Figure 1; Table 1). Overall, the cp genomes of the 12 species in the genus Meconopsis exhibited similar structural features (Table 2).
All 12 cp genomes had a typical 4-part structure, including 2 equidistant IR regions (IRb/IRa, ranging from 25,521~26,178 bp), one LSC region (82,809~85,153 bp) and one SSC region (17,646~17,905 bp). Among them, M. integrifolia cp genome size was the smallest (151,864 bp) and M. quintuplinervia cp genome size was the largest (154,997 bp). The total GC (guanine-cytosine) content was almost the same (38.5–38.9%), and the GC content of the two IR regions (42.9–43.2%) was higher than that of the LSC region (37.0–37.5%) and the SSC region (32.7–33.5%). The cp genomes exhibited a clear AT preference, which was most pronounced in the SSC region. In addition, all cp genomes had highly similar gene contents, consisting of 88 unique PCGs, 37 unique tRNA genes, and 8 unique rRNA genes, with 7 or 8 PCGs, 4 rRNA genes, and 7 tRNA genes located in the IR region being replicated (Table 1 and Table 2). The second copies of the rps19 and ycf1 genes of the cp genome of the genus Meconopsis were in a pseudogenized state. In all cp genomes, 18 PCGs and tRNA genes were detected to contain introns, with 2 PCGs, ClpP, and ycf3, containing 2 introns (Table 1). There were no significant differences in genome size, GC content, gene order, and gene content compared to cp genomes of other genera in the Papaveraceae family, which is consistent with observations in other higher plants [27,28].

2.2. IR Boundary Analysis

Genome structure, including gene number and gene order, is highly conserved in the Meconopsis species. However, structural changes still exist at the LSC/IR/SSC boundary. The contraction and expansion of the IR/SC boundary within the plant cp genome determines its size and are the primary mechanisms driving genome-wide size variations [29]. IR/SC boundary changes have been widely documented as a common evolutionary phenomenon reflecting cp genome expansion and contraction, leading to gene pseudogenization near the boundary [30]. We selected M. pinnatifolia as a control and investigated the boundaries of IR, LSC, and SSC regions to compare the cp genome structure. We investigated the boundaries of IR, LSC, and SSC regions in the Meconopsis species, Figure 2 showed some variations, and upon comparison, the boundaries did not exhibit significant differences. In most Meconopsis species, the ndhF gene was located predominantly in the SSC region, with its right end extending into the IRb region. In the case of most Meconopsis species, the ycf1 gene was situated on both sides of the SSC region and the IRa region, with a length ranging between 5312 and 5372 bp. Due to its specific location, another copy of ycf1 was found at the border of the IRb and SSC regions, resulting in a truncated pseudogene. The rps19 genes were positioned at the junction of the LSC and IRb regions. Similar to ycf1, they were also found at the junction of IRa, and in most instances, the second copy at the junction of IRa and LSC was also in a pseudogenized state. In contrast, in M. simplicifolia, the rps19 gene was situated at the junction of LSC and IRb, while the second copy was located within IRb. The rps19 genes in these species had evidently lost their protein-coding capacity because they were partially replicated in the IRb region, resulting in a pseudogene for rps19, mirroring the situation observed for the ycf1 gene.

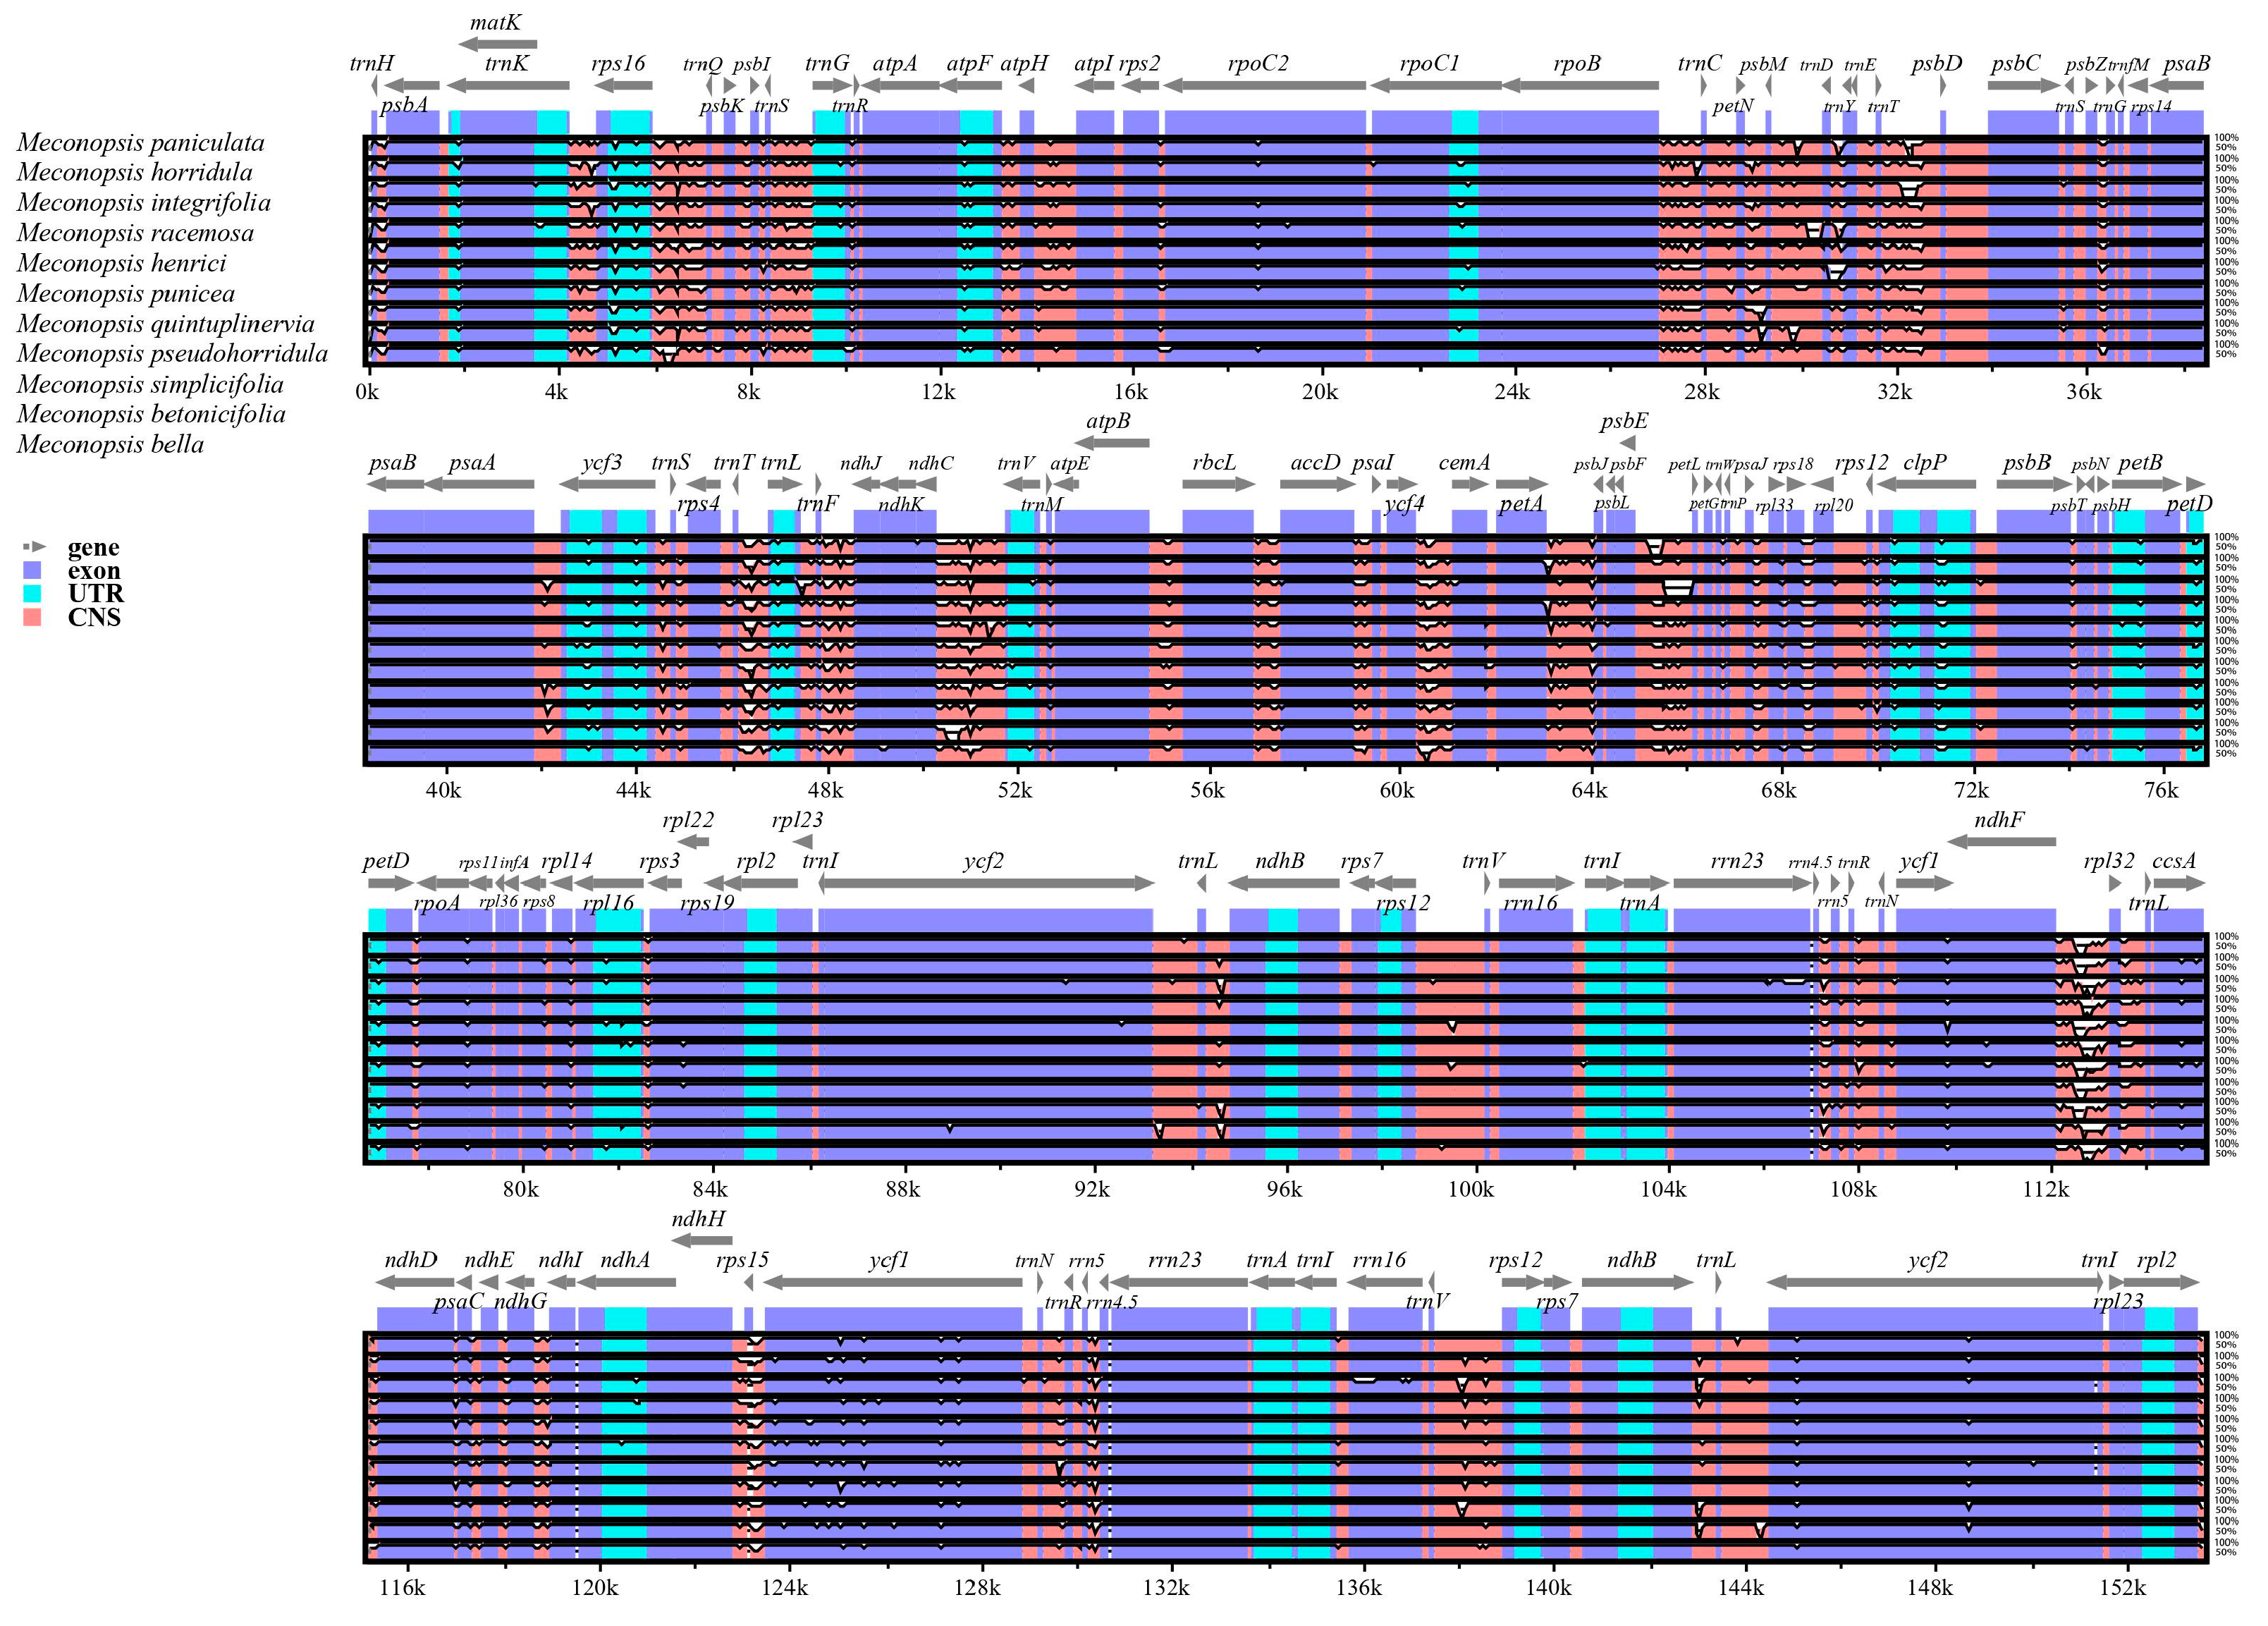
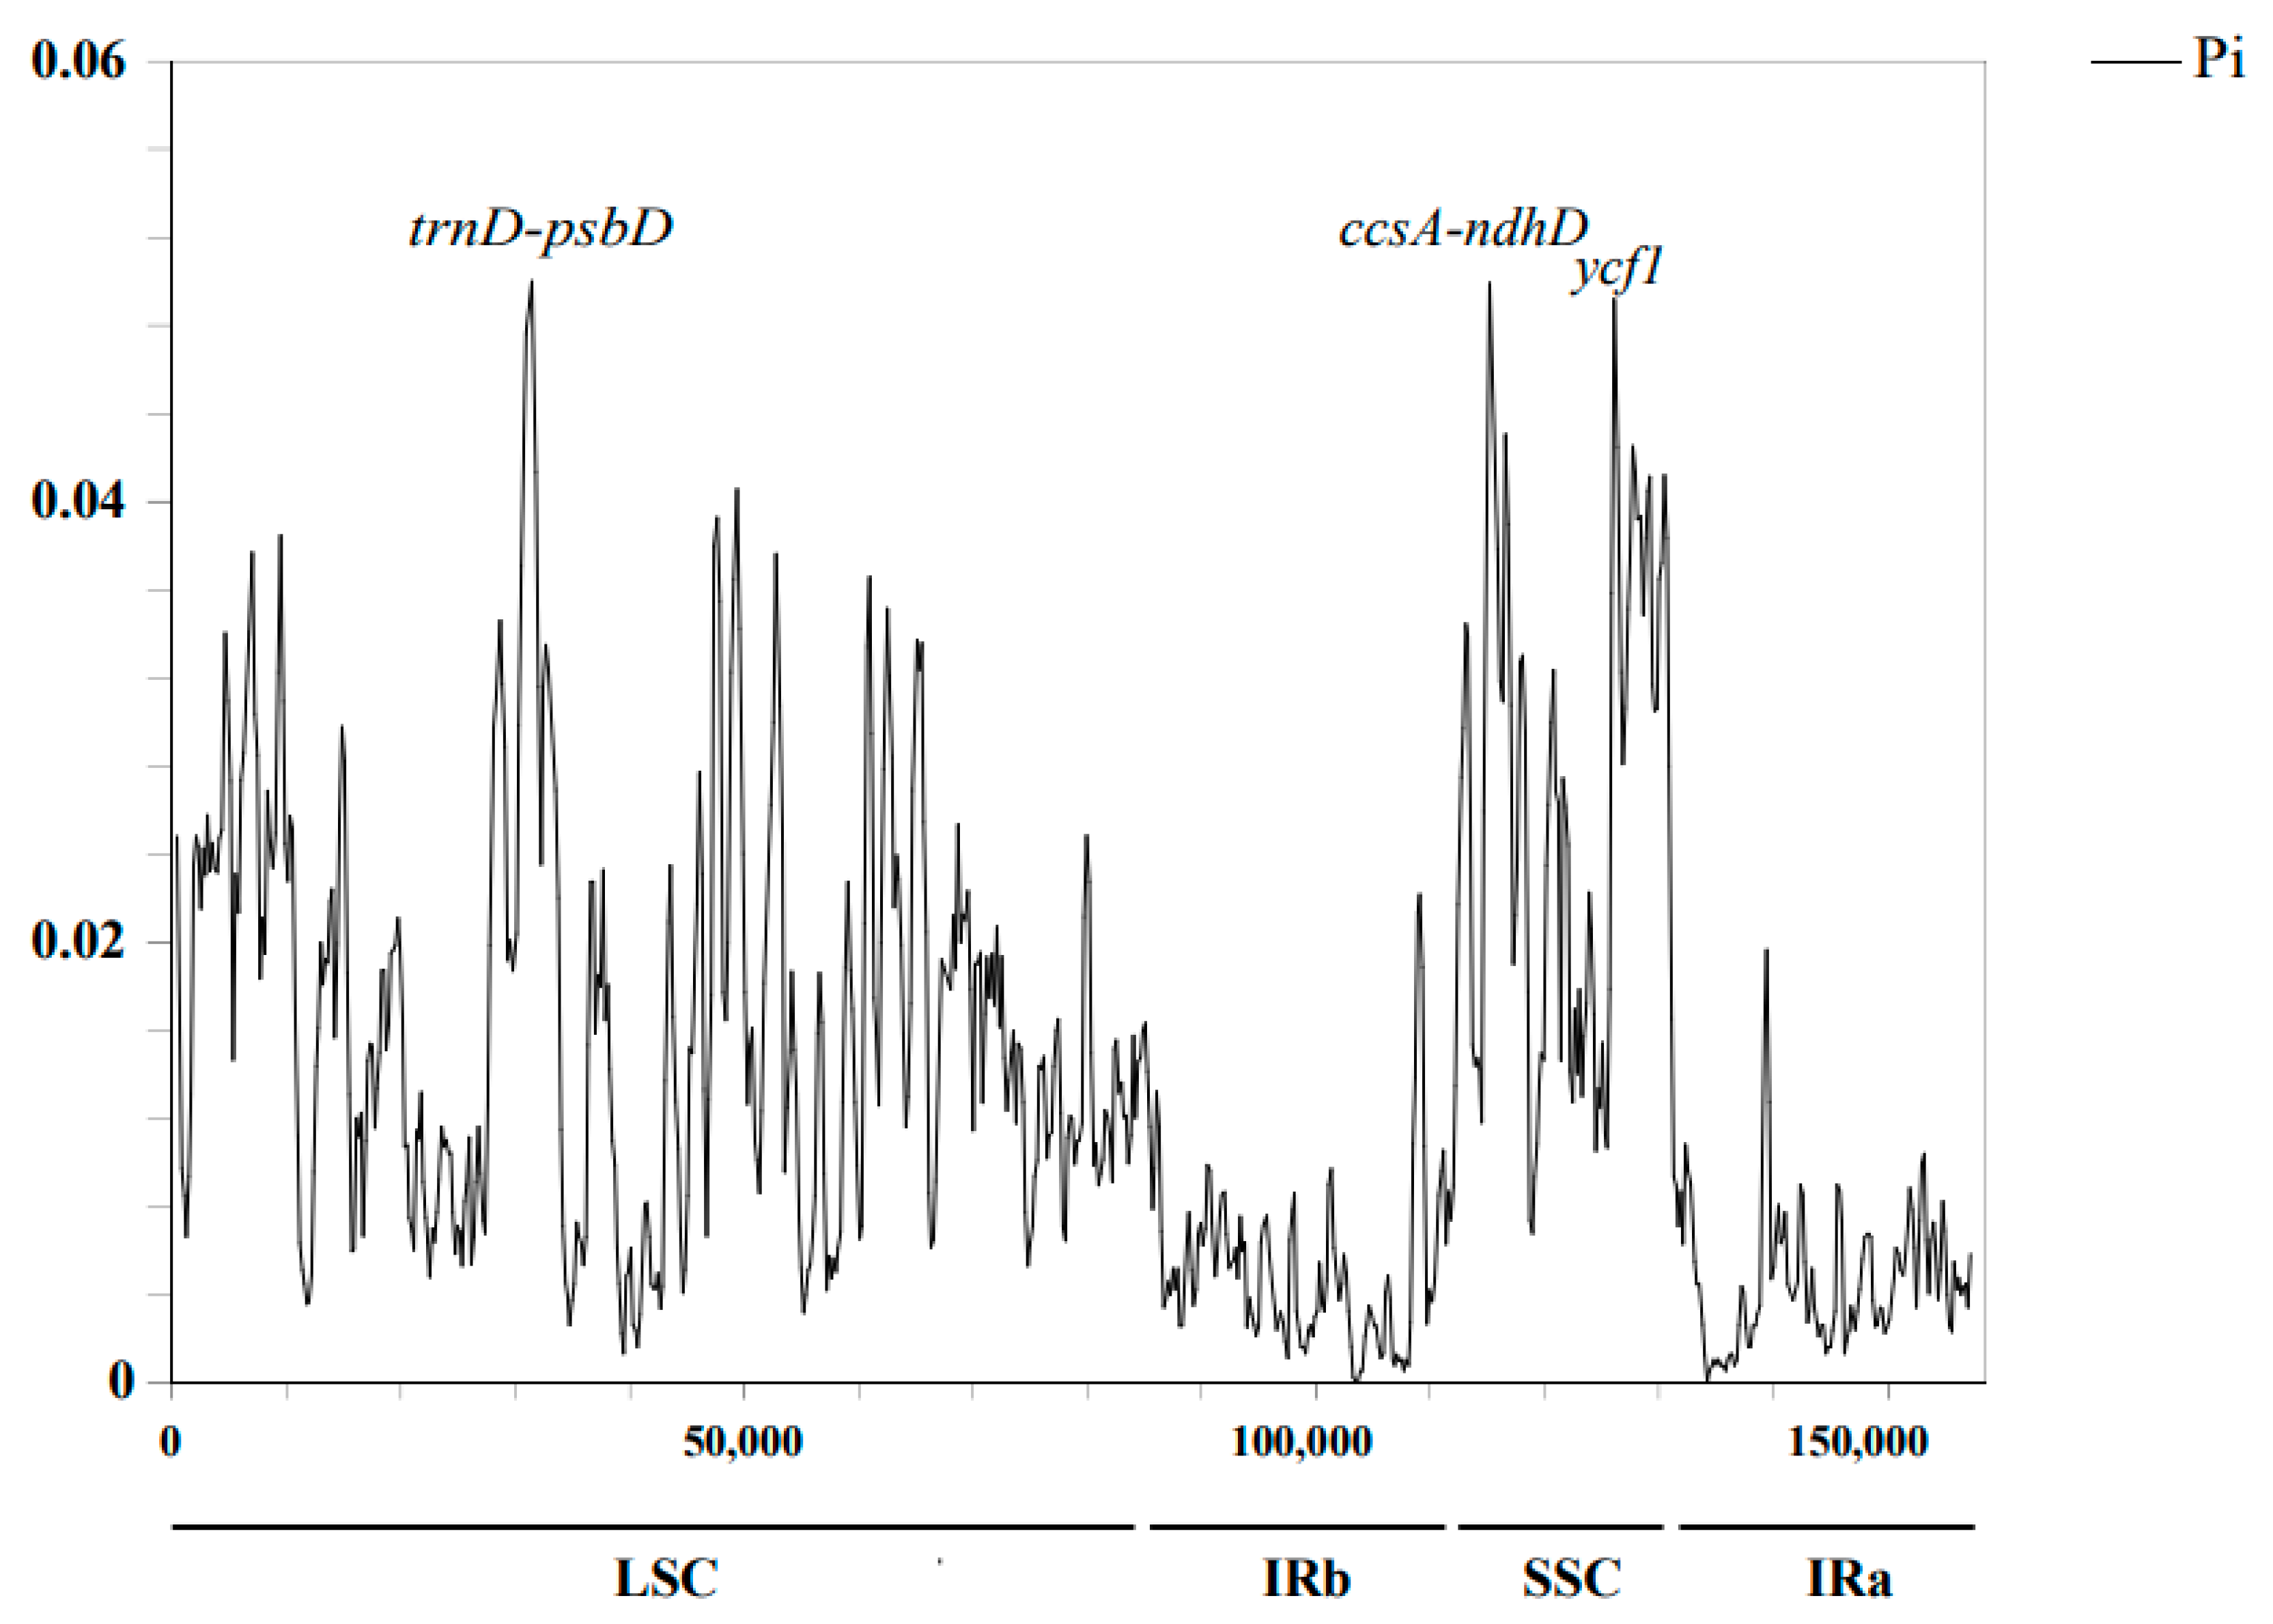
2.3. Genomic Sequence Divergence

Plant DNA barcoding refers to the use of gene sequencing technology to analyze and compare a segment of DNA sequence (approximately a chloroplast DNA fragment of about 650 bp) within a plant to determine the identity of a species by comparing the differences in DNA sequences between different species. DNA barcoding has become a fast and reliable molecular tool in species formation and taxonomy [31,32]. Previous studies showed that rbcL, matK, trnH-psbA in the cp genome and ITS in the nuclear sequence were universal DNA barcodes for land plants due to their high specificity and amplification efficiency [33]. However, due to the short DNA barcode sequences and limited genetic information, they are not specific enough to distinguish closely related species [34]. Therefore, there is a need to combine them with other molecular markers to improve the efficiency and accuracy of DNA barcoding technology for precise identification.
First, mVISTA is a bioinformatic tool that allows global or multiple sequence comparisons of chloroplast or mitochondrial genomes, revealing similarity and rearrangement information. The cp genome of M. pinnatifolia was used as a reference for comparison with 11 other cp genomes (Figure 3). As expected, most of the PCGs had high concordance. In non-coding regions, such as the intergenic regions trnD-trnY, trnT-psbD, petA-psbJ, psbE-petL, and ccsA-ndhD, significant variations were observed. Within the coding region, the ycf1 gene interval showed significant variation. Notably, M. paniculata, M. integrifolia, and M. henrici showed more and greater variation than other Meconopsis species.
The Pi values of these Meconopsis cp genomes were then calculated to validate the visualization results obtained from mVISTA and to further detect highly variable regions. As shown in Figure 4, both results indicated that the IR region was much more conserved than the LSC and SSC regions. The Pi values for the entire cp genome ranged from 0 to 0.06 when analyzed for all 12 species (Figure 4; Table S2). Six intergenic regions (trnD-psbD and ccsA-ndhD) and part of the ycf1 gene were more variable than the others (0.45–0.06), which was in line with the results of the mVISTA analysis. Among these regions, trnD-psbD exhibited the highest variability with a Pi value of 0.05.
Combining the results of Pi calculations with the mVISTA findings described above, we found that the entire cp genome exhibited regular features related to the phylogenetic relationships among the 12 species of the genus Meconopsis. Notably, three species within the genus Meconopsis, namely M. paniculata, M. integrifolia, and M. henrici, displayed alterations in regions of high variation. This observation suggests that there might be specific variations in different segments of the genus and that the search for highly variable loci within these changing segments could potentially enhance the precision of species identification.

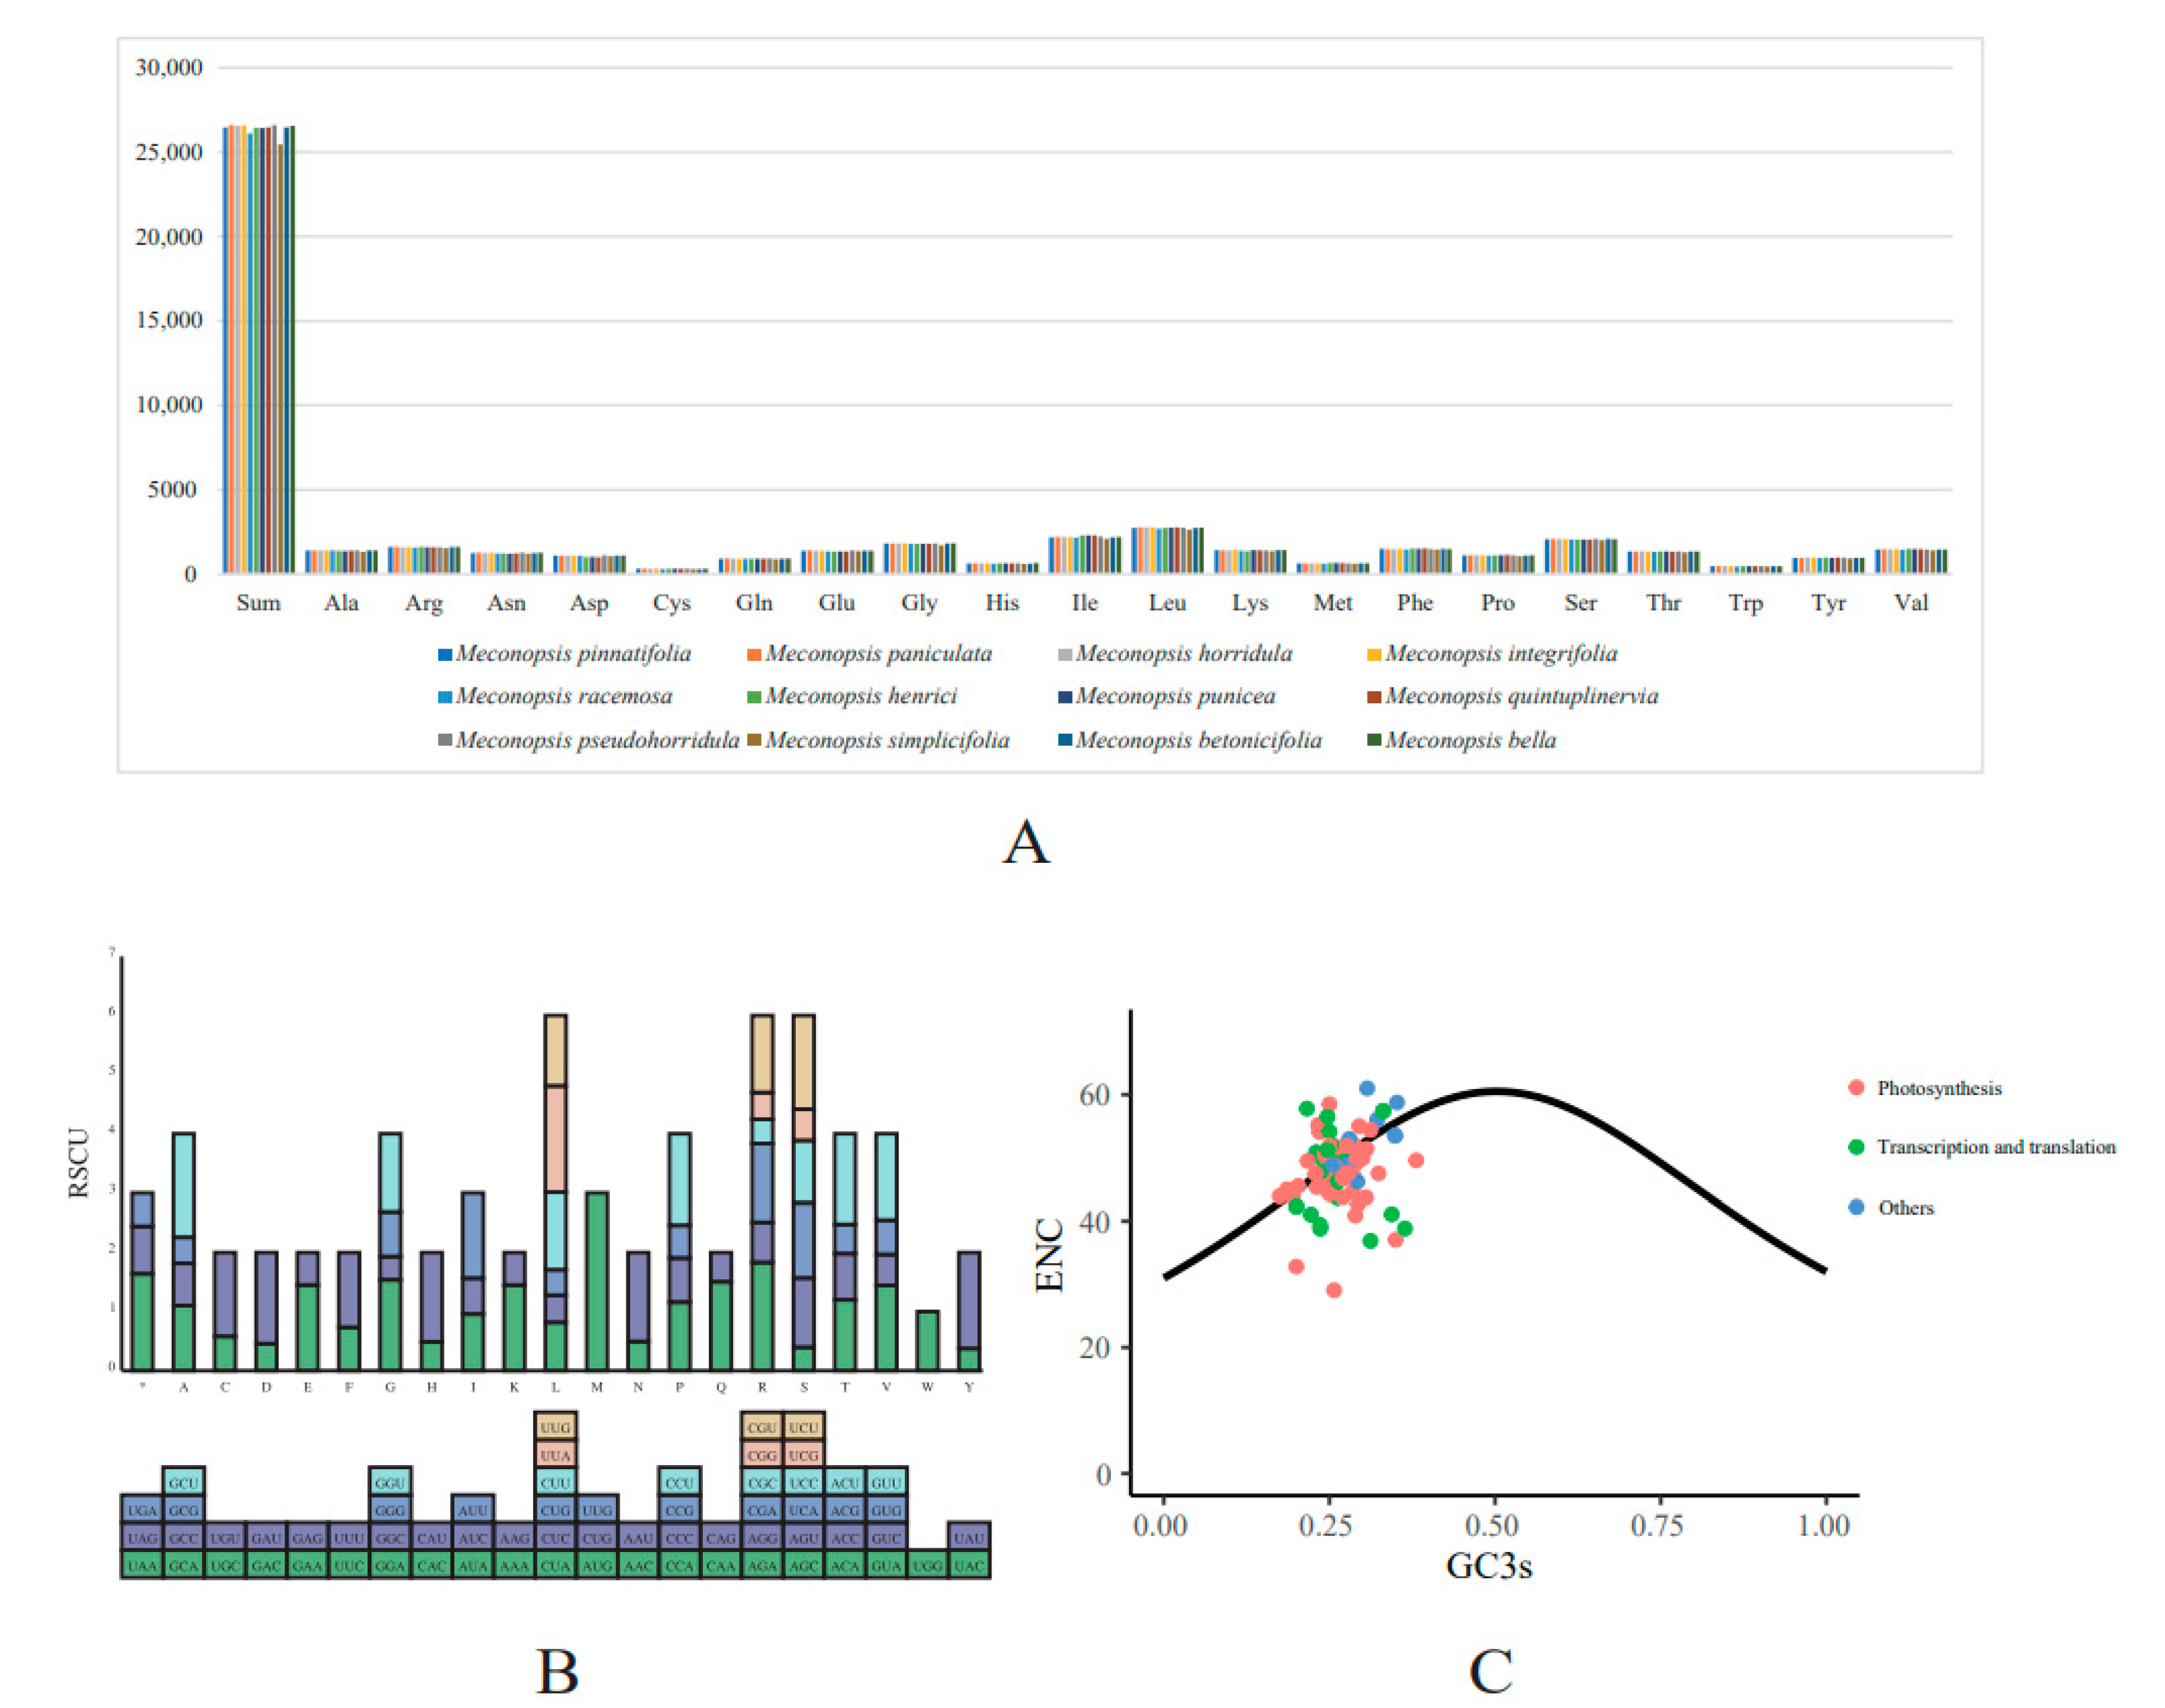
2.4. Codon Usage Analysis

Codon usage bias is an important factor reflecting the evolution of the cp genome. In general, factors such as mutation, natural selection, and phylogenetic relationships may lead to differences in codon use preferences [35]. We analyzed codon usage bias and relative synonymous codon usage (RSCU) of the shared PCGs of 12 Meconopsis species in this work. The genus Meconopsis had highly similar codon usage preferences and amino acid frequencies (Figure 5A,B and Figure S1; Table S3). In addition to the termination codons, we identified a total of 25,454 ~ 26,597 codons. Leu (10.36–10.49%), isoleucine (8.27–8.72%) and serine (7.77–7.92%) were used more frequently, and cysteine (1.17–1.26%), tryptophan (1.77–1.81%), methionine (2.41–2.56%), and histidine (2.41–2.49%) were used less frequently. Due to the simplicity of codons, most amino acids have multiple synonymous codons; for example, isoleucine has four codons. Nevertheless, it is important to note that only tryptophan and methionine do not have alternative codons [36]. Similar to other higher plants, for plants using multiple codons, the third nucleotide of the codon was more frequently occupied by A/T than C/G [37,38].
ENC-plot analysis was performed on each PCG. The results showed that the PCGs of the Meconopsis species had a consistent codon bias pattern (Figure 5C and Figure S2; Table S4). The calculated ENCs of most genes ranged from 30 to 60. Most of the PCGs were located near the expected ENC, suggesting that these genes were mainly random mutations. The distributions of a few photosynthesis-related genes and translation-associated ribosomal proteins were well below the standard curve, suggesting that natural selection or other factors might play an important role in shaping the evolution of these genes.

2.5. Repeat Sequence Analysis

SSRs have been described as powerful tools for species identification, population genetics, and phylogenetic studies [39,40,41]. The study identified 22 to 38 SSRs in 12 Meconopsis species (Figure 6B; Table S5). The highest content of SSRs was found in M. pinnatifolia and M. horridula. Among these repeat sequences, single-nucleotide SSRs were the most abundant (8–26) and consisted mainly of A/T. Some regular repeat sequences, such as A/T, AG/CT/AT, and AAAT/ATTTT/AACC/GGTT, were shared across all cp genomes, whereas other repetitive units of more than four nucleotides, such as ATCC/ATGG, AAAAT/ATTTTT, and AAGGGG/CCCCCTT, were more pronounced in specific cp genomes (Figure 6A). Among all cp genomes, the LSC contained the highest number of SSRs and two IRs contained the lowest number of SSRs, which was consistent with the previously mentioned pattern of Pi analysis (Figure 6C). The length of the repeated sequences in the 12 cp genomes ranged from 10 to 18 bp. Only forward and palindromic repeats were present in all Meconopsis cp genomes (Figure 6D; Table S6). A number of large and scattered repeat sequences were believed to be linked to genetic rearrangements and were considered to have a significant role in genome evolution [42,43]. In general, these repetitive sequences could prove invaluable for future population genetics studies.

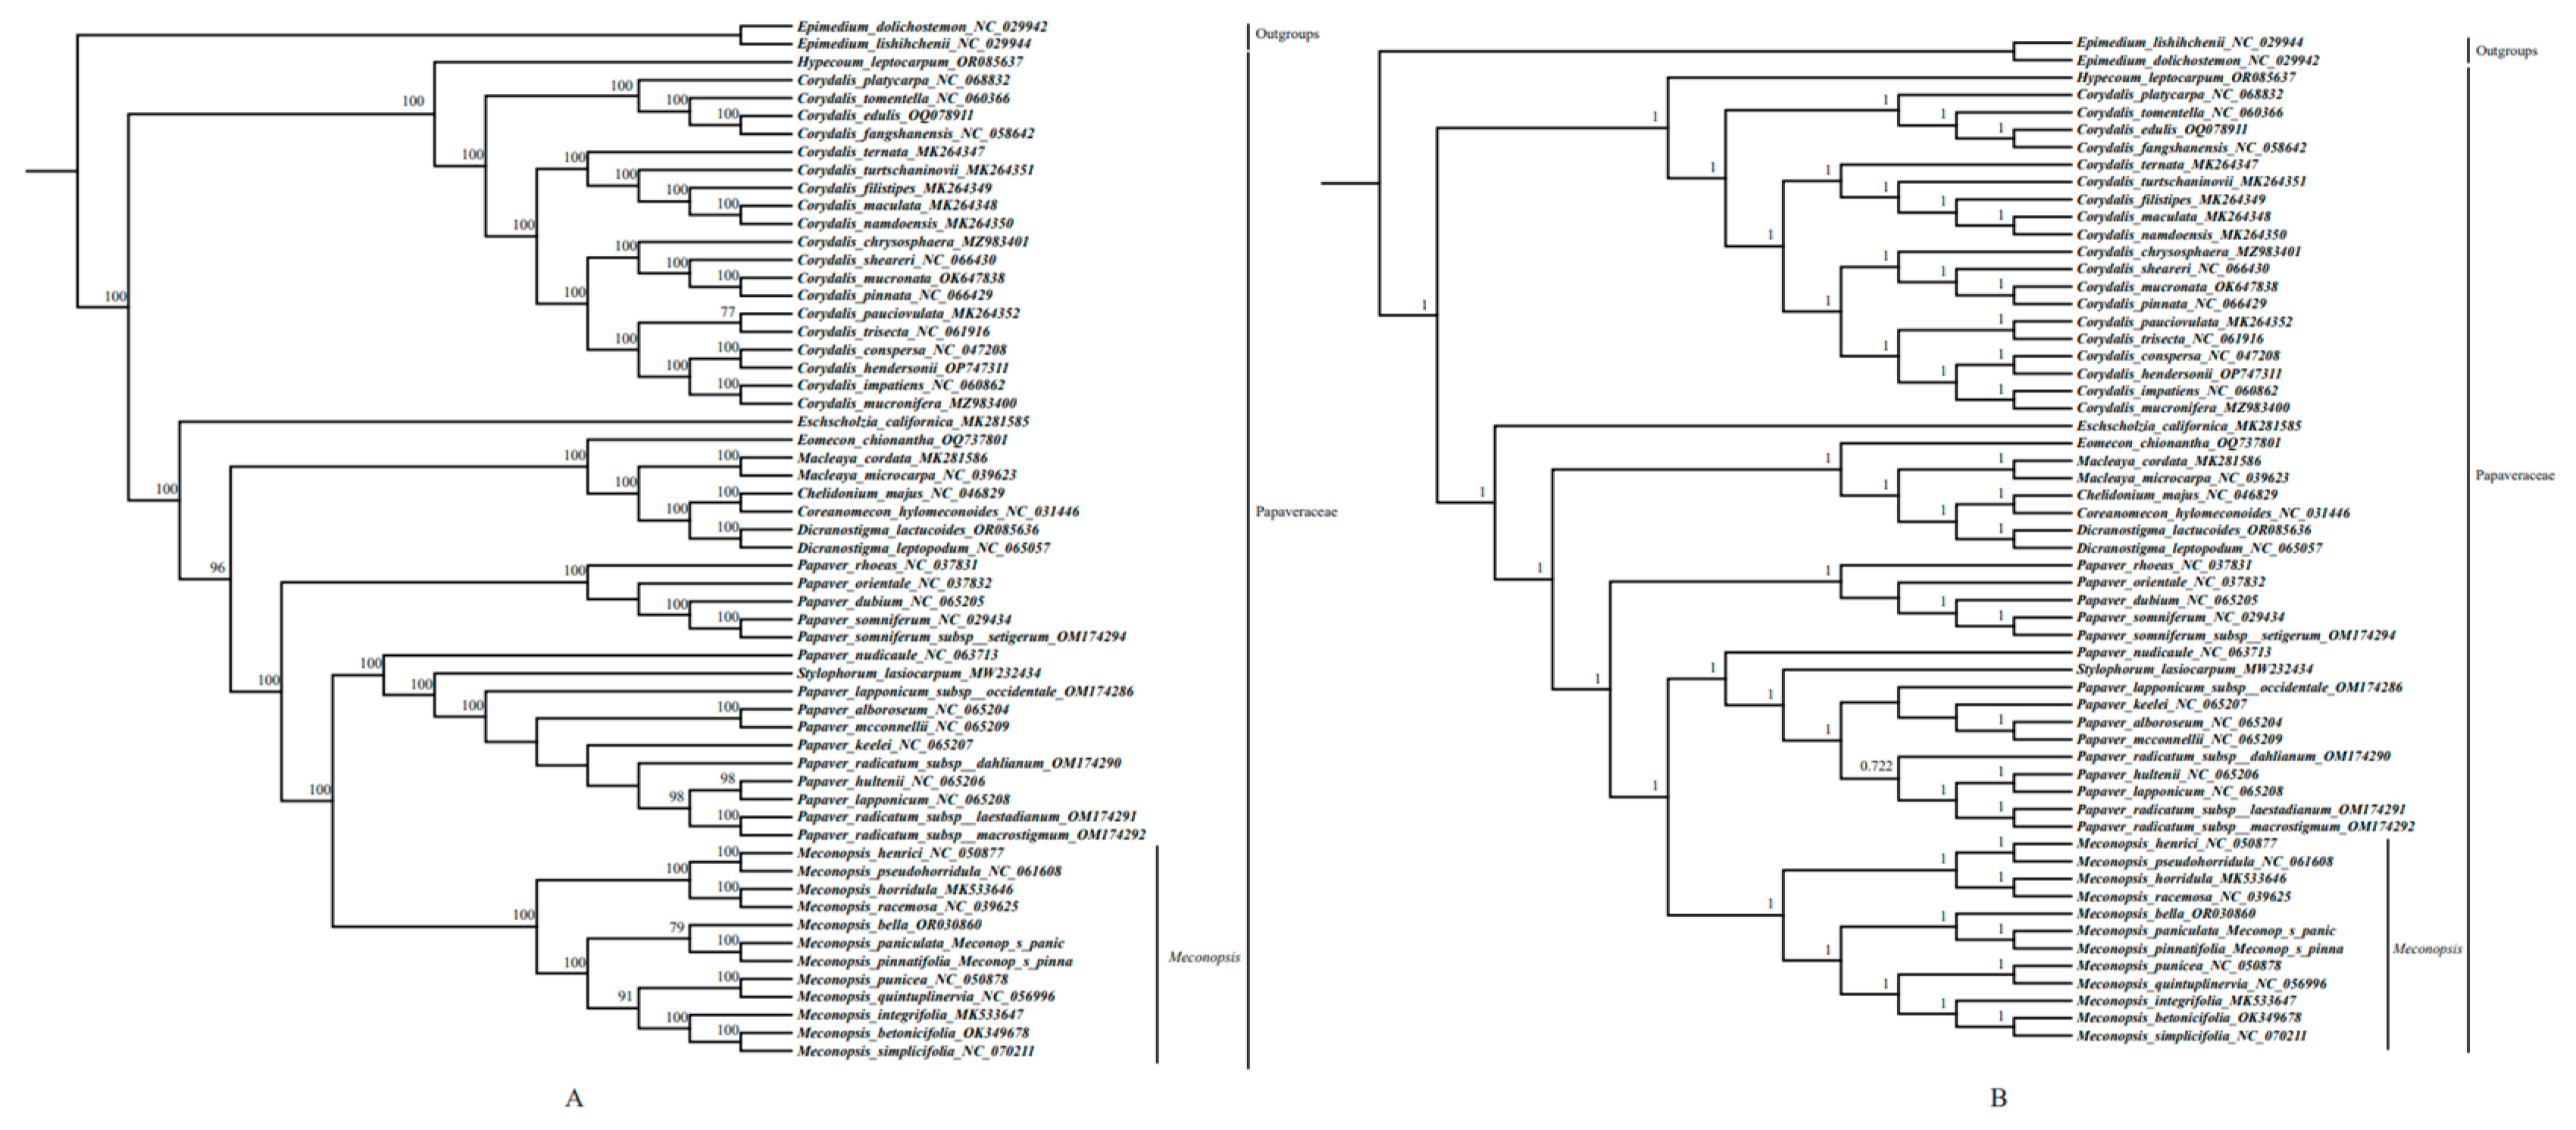
2.6. Phylogenetic Analysis

In order to investigate the phylogenetic relationships of the 12 Meconopsis species and the phylogenetic position of the genus Meconopsis within the Papaveraceae family, a phylogenetic tree was reconstructed using ML and BI methods using a total of 132 PCGs shared in the cp genomes of the 58 plants. The 56 species of 58 plants mentioned above belonged to the Papaveraceae family, and the outgroups were 2 non-Papaveraceae species, Epimedium dolichostemon (Berberidaceae) and Epimedium lishihchenii (Berberidaceae). The topologies generated by both methods were almost identical except for the Papaver genus and all nodes were well supported by high ML bootstrap and Bayesian posterior probability (Figure 7). Because of the high morphological and ecological diversity of the genus Meconopsis, the classification of the plants in the genus Meconopsis was relatively complex at the intra-generic level. As can be seen in Figure 7, these Meconopsis species could be divided mainly into four major clades, of which M. punicea, M. quintuplinervia, M. integrifolia, M. betonicifolia, and M. simplicifolia belong to subgen. Grandes, and M. henrici, M. pseudohorridula, M.racemosa and M. horridula belong to subgen. Cumminsia. The result was broadly similar to those of previous phylogenetic studies [5]. Phylogenetic analyses based on cp genomes showed that M. pinnatifolia and M. paniculata are sister species. In contrast to previous studies, the Meconopsis species were consistent in subgeneric classification but differed in sectional classification. Although M. betonicifolia and M. simplicifolia are sister species in the phylogenetic tree and both belong to subgen. Grandes, M. betonicifolia belongs to sect. Grandes, while M. simplicifolia belongs to sect. Simplicifoliae [5]. The use of different molecular markers and an increase in the variety of species studied might lead to changes in some branches of the phylogenetic tree, so we need to develop DNA barcodes with higher resolution to optimize the results and get more precise phylogenetic relationships.

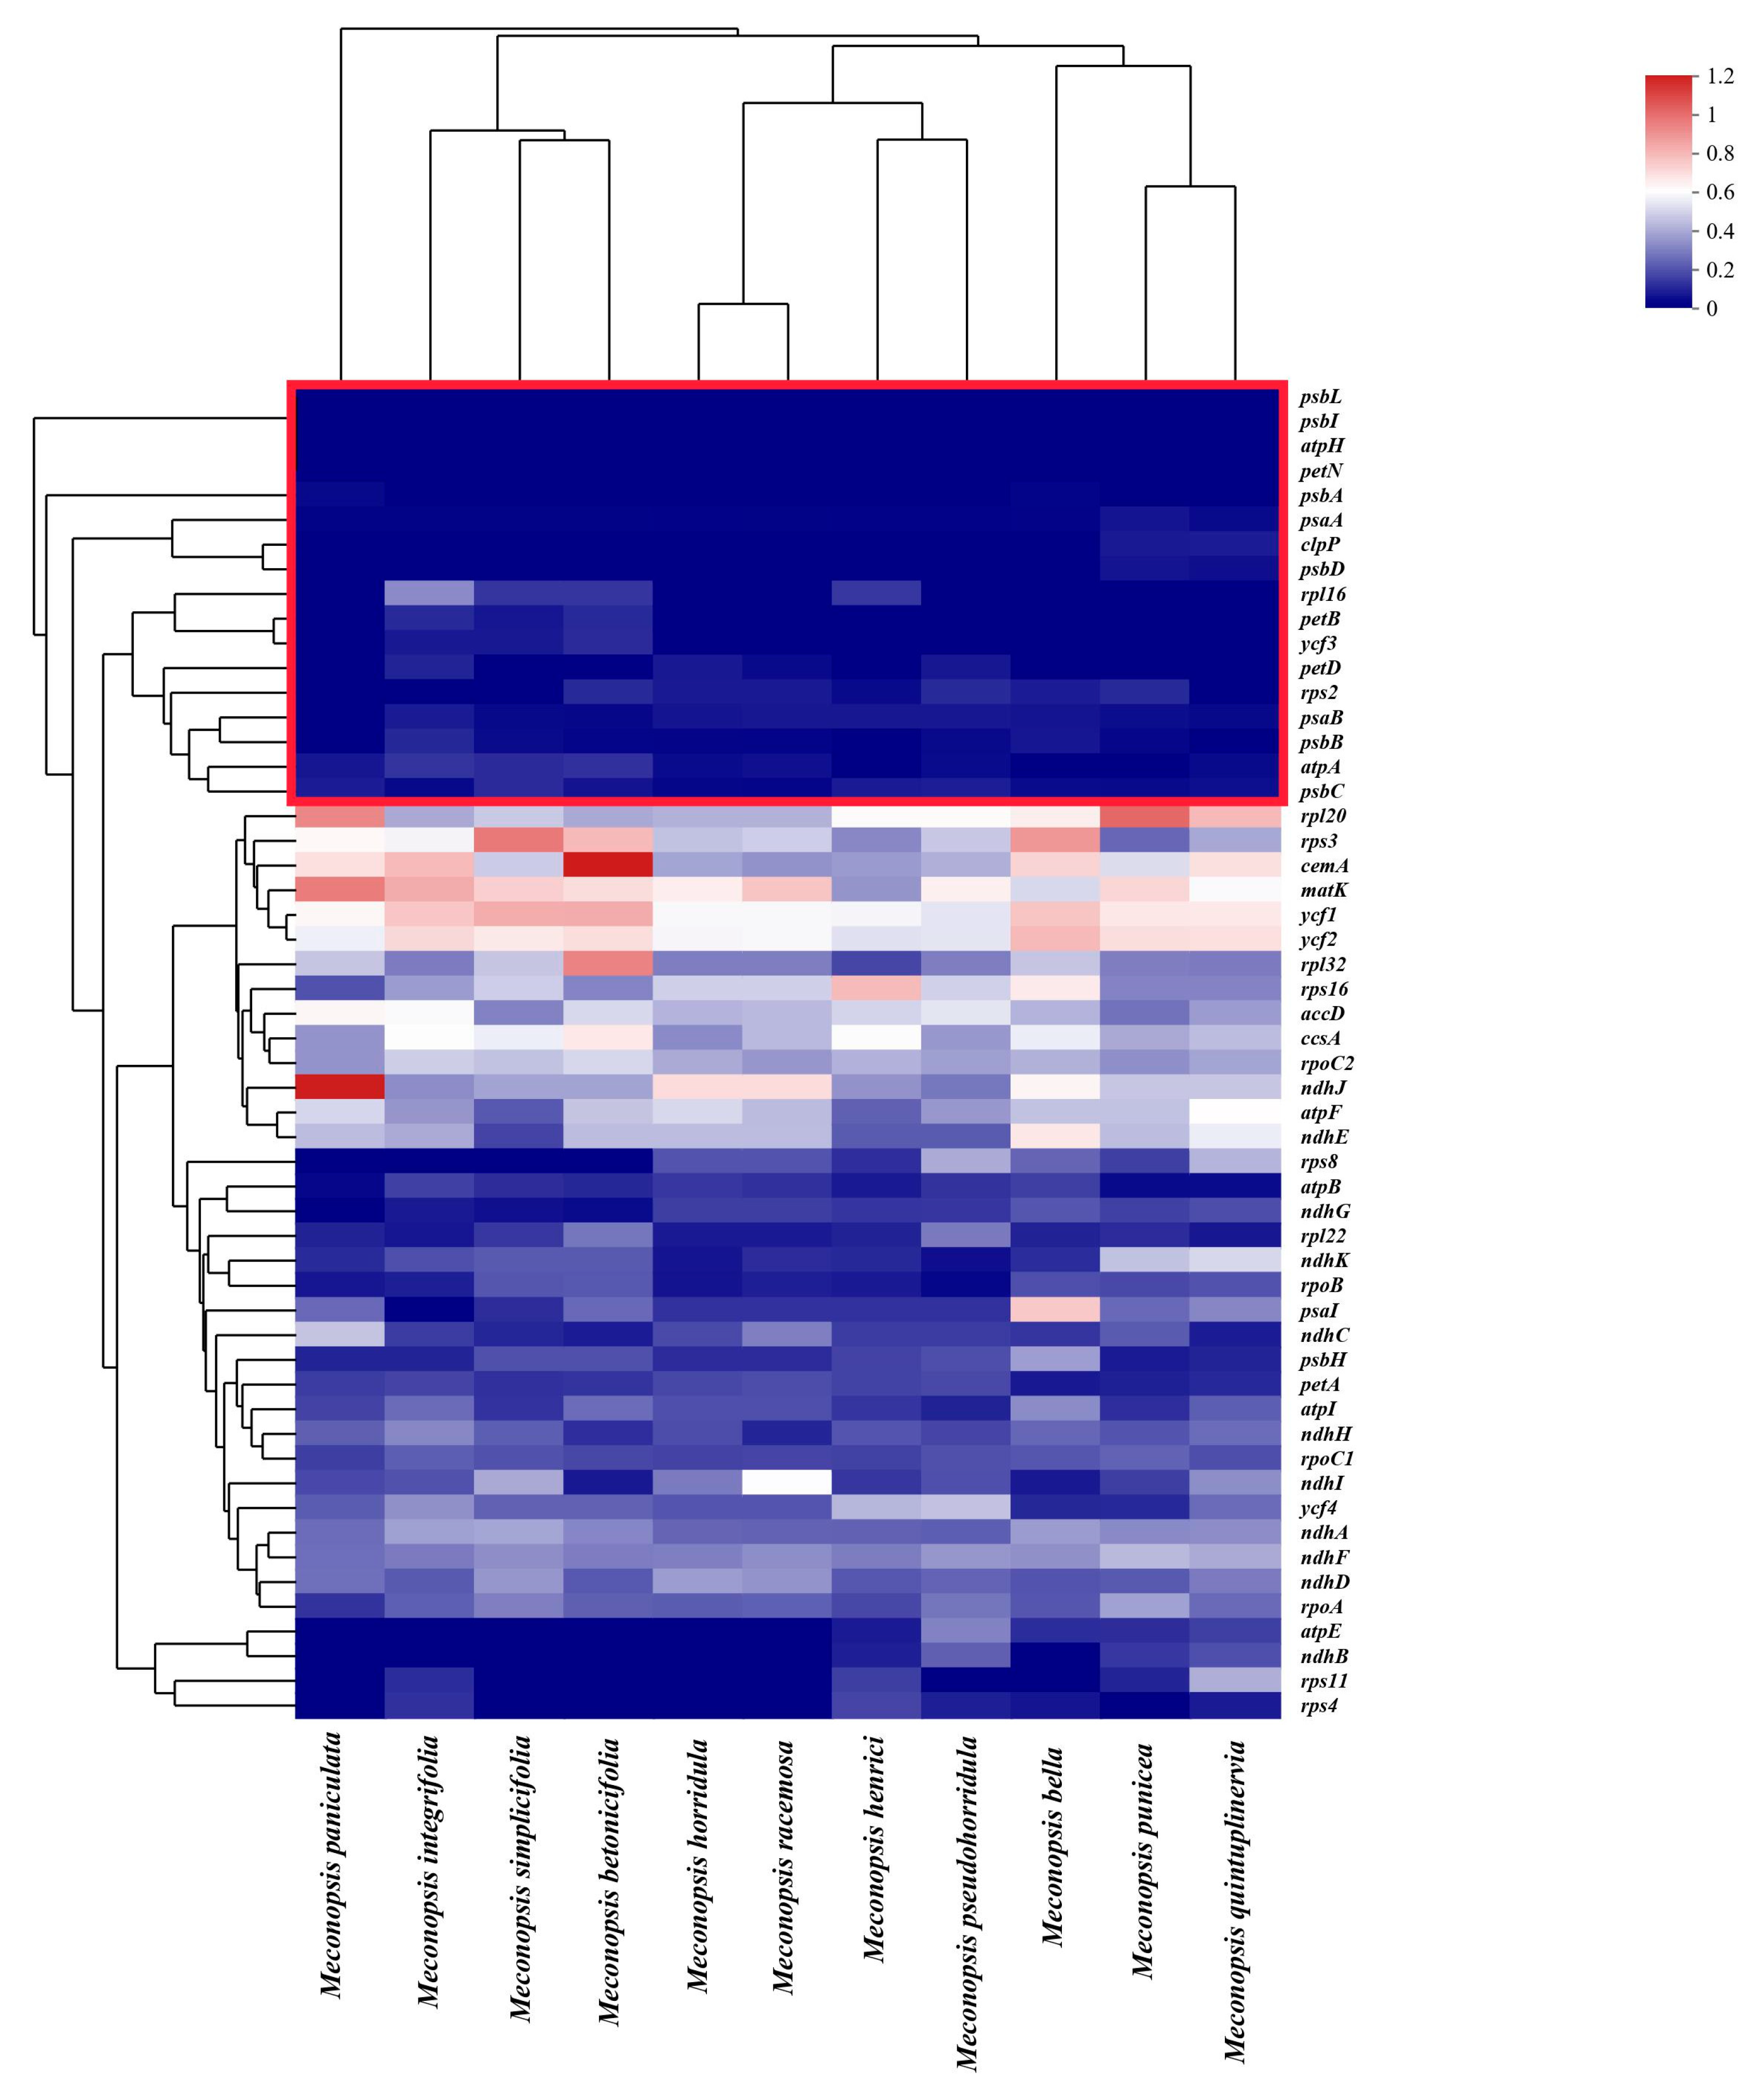
2.7. Selection and Adaptation Analyses

First, we calculated Ka/Ks ratios for the 88 unique PCGs between any 2 Meconopsis species, using M. pinnatifolia as a reference. Most of the genes were in a state of purifying selection (Ka/Ks ratio < 1) and most of them were in the range of 0~0.4, indicating that most of the PCGs were very conserved in the Meconopsis cp genomes at the amino acid level (Table S7). As can be seen from the heatmap, most of the conserved genes within the red line boxes were photosynthesis-related genes (Figure 8). Only a few genes, such as the cemA gene in the comparison of M. betonicifolia and M. pinnatifolia and the ndhJ gene in the comparison of M. paniculata and M. pinnatifolia were under accelerated selection (Ka/Ks ratio > 1).
Natural selection pressures among the Meconopsis species were detected using the 88 unique PCGs. Compared with other Meconopsis species distributed mainly at low altitudes, M. racemosa, M. henrici, M. pseudohorridula, and M. horridula grow at relatively high altitudes with colder climates and higher light radiation [44]. Therefore, whether species surviving in harsh environments at high altitudes have undergone adaptive evolution is a question worth investigating. Four species (M. racemosa, M. henrici, M. pseudohorridula, and M. horridula) living in relatively high-altitude ecological niches were used as foreground branches, and selection pressures were estimated using the branch-site model. The results showed that genes atpA and ycf2 were under positive selection (Table S7).
The atp and ycf families are frequently reported to be involved in adaptation to highland environments [45,46] and are now also confirmed in the Meconopsis species in this study. The atpA gene is a photosynthesis-related cp gene involved in energy metabolism that is relatively evolutionarily conserved and encodes the ATP synthase CF1 α-subunit protein. The ATP synthase CF1 α-subunit protein is a key enzyme in energy metabolism in plants and plays an important role in a variety of cellular processes. Studies have shown that ATP synthase activity is strongly associated with low-temperature stress. Under low-temperature stress, ATP synthase activity decreases, and ATP content is reduced. ATP synthase activity recovers upon restoration of warmth, and it is critical for plant response to environmental stresses (e.g., plant cold tolerance) [47]. Considering the accelerated evolution of the atpA gene under natural selection at high altitude, low temperature, and low CO2 in the QTP, it may promote ATP synthase specialization and increase the efficiency of energy transduction for photosynthesis, and therefore, may be involved in the adaptive response of the Meconopsis species to environmental stresses.
The ycf2 gene is the largest plastid gene reported in angiosperms. The ycf2 gene’s function is largely unknown but does not appear to be specifically related to photosynthesis [48]. The ycf2 gene has also been shown to encode a protein that is part of the ycf2-FtsHi Heteromeric AAA-ATPase Complex, which is closely related to the TIC complex and plays a role in chloroplast inner membrane where it plays a role in preprotein translocation [49]. The ycf2 gene, although it varies considerably across cp genomes, acts as a variable gene in many plant cp genomes and is involved in many biological functions [50,51]. Although no study has shown that the ycf2 gene is associated with adaptation to highland environments, the positive selection of the ycf2 gene suggests that the ycf2 gene may have other functions to help plants adapt to extreme environments, which are worth exploring in depth.

3. Materials and Methods

3.1. Plant Material Sampling, DNA Extracting, and DNA Sequencing

In this study, we investigated a total of 12 Meconopsis species, with special attention given to 2 specimens newly acquired from the QTP region of China in 2022. These specimens were collected at altitudes of 3632 m (M. paniculata) and 3944 m (M. pinnatifolia), as detailed in Table S1. The identification of these specimens was carried out by Professor Xing Liu from Wuhan University in China. To ensure the accessibility of these specimens, voucher samples were preserved in the herbarium of Wuhan University. In the process of gathering plant material, we prioritized the collection of young, fresh, and healthy leaves, which were promptly flash-frozen in liquid nitrogen. This preservation was followed by storage at −80 °C. Subsequently, we implemented a modified CTAB method to extract high-quality genomic DNA. The quality and concentration of the DNA were assessed by agarose gel electrophoresis. If a clear band with a large molecular weight appeared, the quality and concentration of the DNA were proved to be good. If electrophoretic tailing occurred, the DNA was degraded. The next step involved the construction of libraries, wherein genomic DNA underwent fragmentation and adapter ligation. For sequencing, we employed the Illumina Novaseq 6000 platform. This process included additional steps for amplification and purification. All the read data generated throughout this study have been documented and deposited in the NCBI Sequence Read Archive (SRA). Access to this dataset is available under the respective accession numbers SRR25926012 and SRR25926011, specific to each specimen.

3.2. Chloroplast Genome De Novo Assembly and Annotation

We utilized the Fastp v0.19.4 software to filter the raw data, which involved the elimination of adapter sequences as well as the removal of low-quality reads [52]. For the de novo assembly of the cp genomes of M. paniculata and M. pinnatifolia, we employed GetOrganelle v1.7.0 [53]. Subsequently, the assembled contig underwent correction using Pilon and validation through short-read mapping to the contig using Bowtie2 2.3.2 [54,55]. We used Geneious 8.0.4 to visualize the results. The contig was comprehensively covered by clean data through the alignment process [56]. Next, Geseq annotated the well-assembled sequence [57]. tRNAscanSE 2.0.5 software with the default setting was used to identify tRNA genes [58]. After aligning with a set of reference cp genomes, the initial annotations were systematically validated, and adjustments were made to determine the positions of start codons, terminal codons, and introns. Following alignment with a set of reference cp genomes, the original annotations were manually checked and adjusted to ensure their positions for initial codons, terminal codons, and introns were correct. The newly obtained cp genomes were deposited in GenBank with accession numbers OR521090 and OR521089.

3.3. Chloroplast Genome Visualization and Sequence Divergence Analysis

The basic features of 12 cp genomes were compared and analyzed using Geneious 8.0.4, including different regions, their GC content, and the proportions of different sequences [56]. In order to visualize the transcriptional direction, position of genes, and the structure feature of each cp genome, the circular maps of M. paniculata and M. pinnatifolia were drawn by using OrganellarGenomeDRAW (OGDRAW) 1.3.1 [59]. The alignments of the 12 complete cp genome sequences were compared using mVISTA with a LAGAN mode in order to show the variation region of the cp genome among the genus Meconopsis [60,61]. The gene distribution at the LSC, SSC, IRa, and IRb boundaries was further revealed using the online tool CPJSdraw [62]. Twelve cp genomes were aligned together. The nucleotide polymorphism (Pi) among cp genomes was calculated, intercompared, and visualized using DnaSP 6.12.03 software, employing a window length of 600 bp and a step size of 200 bp [63].

3.4. Analysis of Codon Usage

The relative synonymous codon usage (RSCU) of all the PCGs was calculated using Mega X [64]. RSCU stands for the preference for codon usage, which refers to the relative probability of a codon encoding a corresponding amino acid among synonymous codons for a particular codon. When the RSCU of a codon is greater than 1, it indicates that the codon is preferred when encoding the same amino acid.
The effective number of codons (ENC) is an important index to reflect the degree of non-equilibrium use preference of synonymous codons [65]. In general, the synonymous codon preference of highly expressed genes is larger, so the ENC value is smaller. GC3 refers to the GC content of the third position of all codons in the gene, that is, the frequency of G and C in the third position of the codon, in addition to methionine, tryptophan, and stop codons. CodonW v1.4.4 (JF Peden, Nottingham, UK) was used to calculate the GC3s and ENC of each PCG among the cp genomes. After comparing the results, the standard curve was constructed and shown using an R script. The standard curve in the ENC-GC3 graphic illustrated how the ENC-GC3 content formula fitted. The predominant cause of the observed codon bias stemmed from a variance in nucleotide composition at the third position of the codon, a phenomenon largely driven by mutation. This was particularly evident when the calculated effective number of codons (ENC) for a gene closely approximated the values outlined in the standard curve. Conversely, the position of a gene far below the standard curve indicated that the codon preference of the gene was affected by natural selection and other factors [66].

3.5. Analysis of Repeat Sequences in Organelle Genomes

The positions and types of simple sequence repeats (SSRs) in cp genomes were ascertained using MISA [67]. The minimum numbers of repeats were 10, 5, 4, 3, 3, and 3 for mono-, di-, tri-, tetra-, penta-, and hexanucleotides, respectively. REPuter was used to determine the positions and types of simple sequence repeats, employing specific parameters: A hamming distance of 3 and a minimum repeat size of 30 bp [68].

3.6. Phylogenetic Analysis

In order to investigate the phylogenetic relationships of the 12 Meconopsis species and the phylogenetic position of genus Meconopsis within the Papaveraceae family, we chose 58 species (all species of the Papaveraceae family of which cp genomes are available in NCBI, 2 newly collected Meconopsis species and 2 non-Papaveraceae species) to reconstruct a phylogenetic tree. These two non-Papaveraceae species were selected as outgroups because these two species were used as outgroups in the analysis of the chloroplast genomes of Meconopsis in previous studies [69]. A total of 132 common PCGs were extracted, aligned, and subsequently combined into a matrix using PhyloSuite v1.2.3 after manual assessment and modification [70]. The phylogenetic tree was then reconstructed using Epimedium lishihchenii and Epimedium dolichostemon as outgroups. For 8000 rapid bootstraps, ModelFinder automatically picked the TVM model for maximum likelihood (ML) analysis using IQ-TREE [71]. Subsequently, BI phylogenies were conducted with the assistance of MrBayes 3.2.6 and the GTR + I + G + F model (2 parallel runs, 2,000,000 generations), with the initial 25% of the sampled data being discarded as burn-in [72]. The Interactive Tree of Life displayed two created trees [73].

3.7. Selective Analysis

To assess the selective pressure on the Meconopsis species in high-altitude habitats, we conducted an analysis to determine the Ka/Ks ratio (where Ka represents the nonsynonymous substitution ratio and Ks stands for the synonymous substitution ratio) within a study involving 12 Meconopsis species. Using PhyloSuite, 88 common PCGs were extracted individually and simultaneously translated to their amino acid counterparts. By invoking KaKs_calculator 2.0, ParaAT was employed to automatically prepare intermediate files and calculate the Ka/Ks value [74,75,76]. Some rows (infA, petG, petL, psaC, psaJ, psbE, psbF, psbJ, psbK, psbM, psbN, psbT, psbZ, rbcL, rpl14, rpl23, rpl33, rpl36, rps12, rps14, rps15, rps18, rps19, rps7, and rpl2) and columns (M. horridulaM. paniculata) with too much Na were discarded. The extremely low synonymous substitution ratio might be to blame for this. If the Ka/Ks ratio was greater than 1, the gene pair was identified to be under positive selection, while a ratio lower than 1 indicated purifying selection.
The PAML v4.10.6 codeml program’s branch-site model was used to calculate the selection pressure brought on by environmental adaptation in the Meconopsis species [20]. The degree of selective pressure was gauged by utilizing the ratio of synonymous substitution rate (dS) to nonsynonymous substitution rate (dN). A likelihood ratio test (LRT) was conducted to compare the alternative model (“model = 2, NSsites = 2, omega = 0.5|1.5, and fix_omega = 0”) and the null model (“model = 2, NSsites = 2, omega = 1, and fix_omega = 1”), with the p-value of the LRT being examined by the Chi-squared test. Additionally, amino acid positions that could be subject to positive selection were assessed and selected using the Bayesian empirical Bayes (BEB) method. An amino acid site with a posterior probability greater than 0.95 was considered highly likely to be under positive selection, whilst a gene with a p-value of 0.05 and ω > 1 was assumed to be under positive selection.

4. Conclusions

In this study, 12 Meconopsis species were chosen for comprehensive analyses, including comparative, phylogenetic, and adaptive analyses of Meconopsis cp genomes. The results showed that the size, structure, GC content, gene content, and genome components of the cp genomes of all Meconopsis species were basically the same, and there was no rearrangement of gene order. In the sequence divergence analysis, we detected 3 highly variable regions (trnD-psbD, ccsA-ndhD, and ycf1 genes) in 12 Meconopsis species, which provided valuable reference evidence for the more accurate identification of the Meconopsis species in subsequent studies. In this section, the IR region was also detected to be more conserved than the SSC and LSC regions. The phylogenetic tree reconstructed using PCGs of the cp genome further demonstrated that the 12 Meconopsis species in this study belonged to 4 different sections. Meanwhile, three Meconopsis species (M. henrici, M. pseudohorridula, and M. horridula) at relatively high-altitude positions were classified as Subgen. Cumminsia. This phylogenetic relationship was also evidenced by various other characteristics of the cp genome, as shown in the mVISTA analyses variation across the cp genome as well as the Pi values calculated between the different segments. In terms of altitudinal adaptation, at the branching and site level, the atpA and ycf2 genes might be under positive selection for species growing at relatively high altitudes, suggesting the contribution of these two genes to adaptation to extreme environments. The above findings provided insights into the conservation and differentiation of the Meconopsis cp genome and laid the foundation for accurate species identification. Of course, larger-scale sampling is needed to learn more about the evolutionary features and environmental adaptation patterns of the Meconopsis cp genome.

Supplementary Materials

The following supporting information can be downloaded at https://www.mdpi.com/article/10.3390/ijms25042193/s1.

Author Contributions

Conceptualization, S.Z. and X.L. (Xing Liu); data curation, S.Z.; formal analysis, S.Z.; funding acquisition, X.L. (Xiaoyan Li) and X.L. (Xing Liu); methodology, S.Z., X.G. and X.Y.; resources, P.W., X.L. (Xinzhong Li) and X.L. (Xing Liu); software, S.Z., X.G. and X.Y.; supervision, X.L. (Xiaoyan Li) and X.L. (Xing Liu); visualization, S.Z.; Writing—original draft preparation, S.Z.; writing—review and editing, T.Y., C.L., X.L. (Xinzhong Li), P.W. and G.Z. All authors have read and agreed to the published version of the manuscript.

Funding

This research was funded by the Local Development Funds of Science and Technology Department of Tibet (XZ202001YD0028C, XZ202102YD0031C).

Institutional Review Board Statement

Not applicable.

Informed Consent Statement

Not applicable.

Data Availability Statement

The chloroplast sequences of M. pinnatifolia and M. paniculata have been uploaded to GenBank and the accession numbers are OR521089 and OR521090.

Acknowledgments

We are grateful to those who collected the samples. We would also like to thank Novogene for their NGS service.

Conflicts of Interest

The authors declare no conflicts of interest.

References

  1. Neuhaus, H.E.; Emes, M.J. Nonphotosynthetic metabolism in plastids. Annu. Rev. Plant Physiol. Plant Mol. Biol. 2000, 51, 111–140. [Google Scholar] [CrossRef]
  2. Daniell, H.; Lin, C.S.; Yu, M.; Chang, W.J. Chloroplast genomes: Diversity, evolution, and applications in genetic engineering. Genome Biol. 2016, 17, 134. [Google Scholar] [CrossRef] [PubMed]
  3. Meger, J.; Ulaszewski, B.; Vendramin, G.G.; Burczyk, J. Using reduced representation libraries sequencing methods to identify cpDNA polymorphisms in European beech (Fagus sylvatica L). Tree Genet. Genomes 2019, 15, 7. [Google Scholar] [CrossRef]
  4. Schloss, P.D.; Jenior, M.L.; Koumpouras, C.C.; Westcott, S.L.; Highlander, S.K. Sequencing 16S rRNA gene fragments using the PacBio SMRT DNA sequencing system. PeerJ 2016, 4, e1869. [Google Scholar] [CrossRef]
  5. Xiao, W.; Simpson, B.B. A New Infrageneric Classification of Meconopsis (Papaveraceae) Based on a Well-supported Molecular Phylogeny. Syst. Bot. 2017, 42, 226–233. [Google Scholar] [CrossRef]
  6. Guo, Q.; Bai, R.F.; Zhao, B.S.; Feng, X.; Zhao, Y.F.; Tu, P.F.; Chai, X.Y. An Ethnopharmacological, Phytochemical and Pharmacological Review of the Genus Meconopsis. Am. J. Chin. Med. 2016, 44, 439–462. [Google Scholar] [CrossRef] [PubMed]
  7. Zhou, G.; Chen, Y.; Liu, S.; Yao, X.; Wang, Y. In vitro and in vivo hepatoprotective and antioxidant activity of ethanolic extract from Meconopsis integrifolia (Maxim.) Franch. J. Ethnopharmacol. 2013, 148, 664–670. [Google Scholar] [CrossRef]
  8. Fan, J.P.; Wang, Y.Q.; Wang, X.B.; Wang, P.; Tang, W.; Yuan, W.J.; Kong, L.L.; Liu, Q.H. The Antitumor Activity of Meconopsis horridula Hook, a Traditional Tibetan Medical Plant, in Murine Leukemia L1210 Cells. Cell. Physiol. Biochem. 2015, 37, 1055–1065. [Google Scholar] [CrossRef]
  9. Xie, H.Y.; Ash, J.E.; Linde, C.C.; Cunningham, S.; Nicotra, A. Himalayan-Tibetan Plateau Uplift Drives Divergence of Polyploid Poppies: Meconopsis viguier (Papaveraceae). PLoS ONE 2014, 9, e99177. [Google Scholar] [CrossRef]
  10. Egan, P.A. Meconopsis autumnalis and M. manasluensis (Papaveraceae), two new species of Himalayan poppy endemic to central Nepal with sympatric congeners. Phytotaxa 2011, 20, 47–56. [Google Scholar] [CrossRef]
  11. Yang, F.-S.; Qin, A.-L.; Li, Y.-F.; Wang, X.-Q. Great Genetic Differentiation among Populations of Meconopsis integrifolia and Its Implication for Plant Speciation in the Qinghai-Tibetan Plateau. PLoS ONE 2012, 7, e37196. [Google Scholar] [CrossRef] [PubMed]
  12. Favre, A.; Päckert, M.; Pauls, S.U.; Jähnig, S.C.; Uhl, D.; Michalak, I.; Muellner-Riehl, A.N. The role of the uplift of the Qinghai-Tibetan Plateau for the evolution of Tibetan biotas. Biol. Rev. 2014, 90, 236–253. [Google Scholar] [CrossRef]
  13. Wu, S.; Wang, Y.; Wang, Z.; Shrestha, N.; Liu, J. Species divergence with gene flow and hybrid speciation on the Qinghai–Tibet Plateau. New Phytol. 2022, 234, 392–404. [Google Scholar] [CrossRef] [PubMed]
  14. An Account of the Genus Meconopsis. Nature 1934, 133, 777–778. [CrossRef]
  15. Sonah, H.; Deshmukh, R.K.; Sharma, A.; Singh, V.P.; Gupta, D.K.; Gacche, R.N.; Rana, J.C.; Singh, N.K.; Sharma, T.R. Genome-Wide Distribution and Organization of Microsatellites in Plants: An Insight into Marker Development in Brachypodium. PLoS ONE 2011, 6, e21298. [Google Scholar] [CrossRef] [PubMed]
  16. Liu, Y.C.; Liu, Y.N.; Yang, F.S.; Wang, X.Q. Molecular Phylogeny of Asian Meconopsis Based on Nuclear Ribosomal and Chloroplast DNA Sequence Data. PLoS ONE 2014, 9, e104823. [Google Scholar] [CrossRef]
  17. Zhao, C.; Wang, X.; Yang, F. Mechanisms underlying flower color variation in Asian species of Meconopsis: A preliminary phylogenetic analysis based on chloroplast DNA and anthocyanin biosynthesis genes. J. Syst. Evol. 2014, 52, 125–133. [Google Scholar] [CrossRef]
  18. Byars, S.G.; Papst, W.; Hoffmann, A.A. Local Adaptation And Cogradient Selection in The Alpine Plant, Poa Hiemata, Along a Narrow Altitudinal Gradient. Evolution 2007, 61, 2925–2941. [Google Scholar] [CrossRef]
  19. Peng, Y.; Yang, Z.; Zhang, H.; Cui, C.; Qi, X.; Luo, X.; Tao, X.; Wu, T.; Ouzhuluobu; Basang; et al. Genetic Variations in Tibetan Populations and High-Altitude Adaptation at the Himalayas. Mol. Biol. Evol. 2010, 28, 1075–1081. [Google Scholar] [CrossRef]
  20. Yang, Z. PAML 4: Phylogenetic Analysis by Maximum Likelihood. Mol. Biol. Evol. 2007, 24, 1586–1591. [Google Scholar] [CrossRef]
  21. Casati, P.; Stapleton, A.E.; Blum, J.E.; Walbot, V. Genome-wide analysis of high-altitude maize and gene knockdown stocks implicates chromatin remodeling proteins in response to UV-B. Plant J. 2006, 46, 613–627. [Google Scholar] [CrossRef]
  22. Zhang, J.; Tian, Y.; Yan, L.; Zhang, G.; Wang, X.; Zeng, Y.; Zhang, J.; Ma, X.; Tan, Y.; Long, N.; et al. Genome of Plant Maca (Lepidium meyenii ) Illuminates Genomic Basis for High-Altitude Adaptation in the Central Andes. Mol. Plant 2016, 9, 1066–1077. [Google Scholar] [CrossRef]
  23. Guo, X.; Hu, Q.; Hao, G.; Wang, X.; Zhang, D.; Ma, T.; Liu, J. The genomes of two Eutrema species provide insight into plant adaptation to high altitudes. DNA Res. 2018, 25, 307–315. [Google Scholar] [CrossRef]
  24. Hu, S.; Sablok, G.; Wang, B.; Qu, D.; Barbaro, E.; Viola, R.; Li, M.; Varotto, C. Plastome organization and evolution of chloroplast genes in Cardamine species adapted to contrasting habitats. BMC Genom. 2015, 16, 306. [Google Scholar] [CrossRef]
  25. Zhao, D.-N.; Ren, Y.; Zhang, J.-Q. Conservation and innovation: Plastome evolution during rapid radiation of Rhodiola on the Qinghai-Tibetan Plateau. Mol. Phylogenet. Evol. 2019, 144, 106713. [Google Scholar] [CrossRef]
  26. Shen, J.; Zhang, X.; Landis, J.B.; Zhang, H.; Deng, T.; Sun, H.; Wang, H. Plastome Evolution in Dolomiaea (Asteraceae, Cardueae) Using Phylogenomic and Comparative Analyses. Front. Plant Sci. 2020, 11, 376. [Google Scholar] [CrossRef]
  27. Zhou, J.; Cui, Y.; Chen, X.; Li, Y.; Xu, Z.; Duan, B.; Li, Y.; Song, J.; Yao, H. Complete Chloroplast Genomes of Papaver rhoeas and Papaver orientale: Molecular Structures, Comparative Analysis, and Phylogenetic Analysis. Molecules 2018, 23, 437. [Google Scholar] [CrossRef] [PubMed]
  28. Yan-Yan, L.; Sheng-Long, K.; Jun-Li, W.; Cao, Y.-N.; Jia-Mei, L. Complete chloroplast genome sequences of Corydalis edulis and Corydalis shensiana (Papaveraceae). Mitochondrial DNA Part B Resour. 2021, 6, 257–258. [Google Scholar]
  29. Huang, H.; Shi, C.; Liu, Y.; Mao, S.-Y.; Gao, L.-Z. Thirteen Camellia chloroplast genome sequences determined by high-throughput sequencing: Genome structure and phylogenetic relationships. BMC Evol. Biol. 2014, 14, 151. [Google Scholar] [CrossRef] [PubMed]
  30. Ren, F.; Wang, L.; Li, Y.; Zhuo, W.; Xu, Z.; Guo, H.; Liu, Y.; Gao, R.; Song, J. Highly variable chloroplast genome from two endangered Papaveraceae lithophytes Corydalis tomentella and Corydalis saxicola. Ecol. Evol. 2021, 11, 4158–4171. [Google Scholar] [CrossRef] [PubMed]
  31. Li, X.; Yang, Y.; Henry, R.J.; Rossetto, M.; Wang, Y.; Chen, S. Plant DNA barcoding: From gene to genome. Biol. Rev. 2014, 90, 157–166. [Google Scholar] [CrossRef]
  32. Nock, C.J.; Waters, D.L.; Edwards, M.A.; Bowen, S.G.; Rice, N.; Cordeiro, G.M.; Henry, R.J. Chloroplast genome sequences from total DNA for plant identification. Plant Biotechnol. J. 2010, 9, 328–333. [Google Scholar] [CrossRef]
  33. Group, C.P.W. A DNA barcode for land plants. Proc. Natl. Acad. Sci. USA 2009, 106, 12794–12797. [Google Scholar]
  34. Yang, J.; Feng, L.; Yue, M.; He, Y.-L.; Zhao, G.-F.; Li, Z.-H. Species delimitation and interspecific relationships of the endangered herb genus Notopterygium inferred from multilocus variations. Mol. Phylogenet. Evol. 2019, 133, 142–151. [Google Scholar] [CrossRef]
  35. Jia, J.; Xue, Q. Codon Usage Biases of Transposable Elements and Host Nuclear Genes in Arabidopsis thaliana and Oryza sativa. Genom. Proteom. Bioinform. 2009, 7, 175–184. [Google Scholar] [CrossRef] [PubMed]
  36. McClellan, D.A. The Codon-Degeneracy Model of Molecular Evolution. J. Mol. Evol. 2000, 50, 131–140. [Google Scholar] [CrossRef]
  37. Zhang, P.; Xu, W.; Lu, X.; Wang, L. Analysis of codon usage bias of chloroplast genomes in Gynostemma species. Physiol. Mol. Biol. Plants 2021, 27, 2727–2737. [Google Scholar] [CrossRef]
  38. Hu, J.; Zhao, M.; Hou, Z.; Shang, J. The complete chloroplast genome sequence of Salvia miltiorrhiza, a medicinal plant for preventing and treating vascular dementia. Mitochondrial DNA B Resour 2020, 5, 2460–2462. [Google Scholar] [CrossRef]
  39. Tuler, A.C.; Carrijo, T.T.; Nóia, L.R.; Ferreira, A.; Peixoto, A.L.; Ferreira, M.F.d.S. SSR markers: A tool for species identification in Psidium (Myrtaceae). Mol. Biol. Rep. 2015, 42, 1501–1513. [Google Scholar] [CrossRef] [PubMed]
  40. Varshney, R.K.; Graner, A.; Sorrells, M.E. Genic microsatellite markers in plants: Features and applications. Trends Biotechnol. 2005, 23, 48–55. [Google Scholar] [CrossRef] [PubMed]
  41. Li, B.; Lin, F.; Huang, P.; Guo, W.; Zheng, Y. Development of nuclear SSR and chloroplast genome markers in diverse Liriodendron chinense germplasm based on low-coverage whole genome sequencing. Biol. Res. 2020, 53, 1–12. [Google Scholar] [CrossRef]
  42. Rajendrakumar, P.; Biswal, A.K.; Balachandran, S.M.; Srinivasarao, K.; Sundaram, R.M. Simple sequence repeats in organellar genomes of rice: Frequency and distribution in genic and intergenic regions. Bioinformatics 2006, 23, 1–4. [Google Scholar] [CrossRef]
  43. Mehmood, F.; Abdullah, S.I.; Ahmed, I.; Waheed, M.T.; Mirza, B. Characterization of Withania somnifera chloroplast genome and its comparison with other selected species of Solanaceae. Genomics 2020, 112, 1522–1530. [Google Scholar] [CrossRef]
  44. Xuan, Z. Phylogenetic and geographic distribution of Meconopsis. Plant Divers. 1981, 3, 1–3. [Google Scholar]
  45. Xie, D.-F.; Tan, J.-B.; Yu, Y.; Gui, L.-J.; Su, D.-M.; Zhou, S.-D.; He, X.-J. Insights into phylogeny, age and evolution of Allium (Amaryllidaceae) based on the whole plastome sequences. Ann. Bot. 2020, 125, 1039–1055. [Google Scholar] [CrossRef]
  46. Fu, X.; Xie, D.-F.; Zhou, Y.-Y.; Cheng, R.-Y.; Zhang, X.-Y.; Zhou, S.-D.; He, X.-J. Phylogeny and adaptive evolution of subgenus Rhizirideum (Amaryllidaceae, Allium) based on plastid genomes. BMC Plant Biol. 2023, 23, 70. [Google Scholar] [CrossRef] [PubMed]
  47. Wang, Y.; Zhang, J.; Li, J.-L.; Ma, X.-R. Exogenous hydrogen peroxide enhanced the thermotolerance of Festuca arundinacea and Lolium perenne by increasing the antioxidative capacity. Acta Physiol. Plant. 2014, 36, 2915–2924. [Google Scholar] [CrossRef]
  48. Drescher, A.; Ruf, S.; Calsa, T.; Carrer, H.; Bock, R.; Jr, T.C. The two largest chloroplast genome-encoded open reading frames of higher plants are essential genes. Plant J. 2000, 22, 97–104. [Google Scholar] [CrossRef] [PubMed]
  49. Kikuchi, S.; Asakura, Y.; Imai, M.; Nakahira, Y.; Kotani, Y.; Hashiguchi, Y.; Nakai, Y.; Takafuji, K.; Bédard, J.; Hirabayashi-Ishioka, Y.; et al. A Ycf2-FtsHi Heteromeric AAA-ATPase Complex Is Required for Chloroplast Protein Import. Plant Cell 2018, 30, 2677–2703. [Google Scholar] [CrossRef] [PubMed]
  50. Liu, M.-L.; Fan, W.-B.; Wang, N.; Dong, P.-B.; Zhang, T.-T.; Yue, M.; Li, Z.-H. Evolutionary Analysis of Plastid Genomes of Seven Lonicera L. Species: Implications for Sequence Divergence and Phylogenetic Relationships. Int. J. Mol. Sci. 2018, 19, 4039. [Google Scholar] [CrossRef] [PubMed]
  51. D’agostino, N.; Tamburino, R.; Cantarella, C.; De Carluccio, V.; Sannino, L.; Cozzolino, S.; Cardi, T.; Scotti, N. The Complete Plastome Sequences of Eleven Capsicum Genotypes: Insights into DNA Variation and Molecular Evolution. Genes 2018, 9, 503. [Google Scholar] [CrossRef]
  52. Chen, S.F.; Zhou, Y.Q.; Chen, Y.R.; Gu, J. fastp: An ultra-fast all-in-one FASTQ preprocessor. Bioinformatics 2018, 34, 884–890. [Google Scholar] [CrossRef]
  53. Jin, J.J.; Yu, W.B.; Yang, J.B.; Song, Y.; dePamphilis, C.W.; Yi, T.S.; Li, D.Z. GetOrganelle: A fast and versatile toolkit for accurate de novo assembly of organelle genomes. Genome Biol. 2020, 21, 241. [Google Scholar] [CrossRef] [PubMed]
  54. Langmead, B.; Salzberg, S.L. Fast gapped-read alignment with Bowtie 2. Nat. Methods 2012, 9, U357–U359. [Google Scholar] [CrossRef] [PubMed]
  55. Walker, B.J.; Abeel, T.; Shea, T.; Priest, M.; Abouelliel, A.; Sakthikumar, S.; Cuomo, C.A.; Zeng, Q.; Wortman, J.; Young, S.K.; et al. Pilon: An Integrated Tool for Comprehensive Microbial Variant Detection and Genome Assembly Improvement. PLoS ONE 2014, 9, e112963. [Google Scholar] [CrossRef]
  56. Kearse, M.; Moir, R.; Wilson, A.; Stones-Havas, S.; Cheung, M.; Sturrock, S.; Buxton, S.; Cooper, A.; Markowitz, S.; Duran, C.; et al. Geneious Basic: An integrated and extendable desktop software platform for the organization and analysis of sequence data. Bioinformatics 2012, 28, 1647–1649. [Google Scholar] [CrossRef]
  57. Michael, T.; Pascal, L.; Tommaso, P.; Ulbricht-Jones, E.S.; Axel, F.; Ralph, B.; Stephan, G. GeSeq—versatile and accurate an-notation of organelle genomes. Nucleic Acids Res. 2017, 45, W6–W11. [Google Scholar]
  58. Chan, P.P.; Lowe, T.M. tRNAscan-SE: Searching for tRNA Genes in Genomic Sequences. Methods Mol. Biol. 2019, 1962, 1–14. [Google Scholar]
  59. Lohse, M.; Drechsel, O.; Bock, R. OrganellarGenomeDRAW (OGDRAW): A tool for the easy generation of high-quality custom graphical maps of plastid and mitochondrial genomes. Curr. Genet. 2007, 52, 267–274. [Google Scholar] [CrossRef]
  60. Frazer, K.A.; Pachter, L.; Poliakov, A.; Rubin, E.M.; Dubchak, I. VISTA: Computational tools for comparative genomics. Nucleic Acids Res. 2004, 32 (Suppl. S2), W273–W279. [Google Scholar] [CrossRef]
  61. Brudno, M.; Do, C.B.; Cooper, G.M.; Kim, M.F.; Davydov, E.; Green, E.D.; Sidow, A.; Batzoglou, S. LAGAN and Mul-ti-LAGAN: Efficient tools for large-scale multiple alignment of genomic DNA. Genome Res 2003, 13, 721–731. [Google Scholar] [CrossRef]
  62. Li, H.; Guo, Q.; Xu, L.; Gao, H.; Liu, L.; Zhou, X. CPJSdraw: Analysis and visualization of junction sites of chloroplast genomes. PeerJ 2023, 11, e15326. [Google Scholar] [CrossRef]
  63. Rozas, J.; Ferrer-Mata, A.; Sánchez-DelBarrio, J.C.; Guirao-Rico, S.; Librado, P.; Ramos-Onsins, S.E.; Sánchez-Gracia, A. DnaSP 6: DNA Sequence Polymorphism Analysis of Large Data Sets. Mol. Biol. Evol. 2017, 34, 3299–3302. [Google Scholar] [CrossRef]
  64. Kumar, S.; Stecher, G.; Li, M.; Knyaz, C.; Tamura, K. MEGA X: Molecular Evolutionary Genetics Analysis across Computing Platforms. Mol. Biol. Evol. 2018, 35, 1547–1549. [Google Scholar] [CrossRef]
  65. Wright, F. The ‘effective number of codons’ used in a gene. Gene 1990, 87, 23–29. [Google Scholar] [CrossRef]
  66. Zhao, Y.; Zheng, H.; Xu, A.; Yan, D.; Jiang, Z.; Qi, Q.; Sun, J. Analysis of codon usage bias of envelope glycoprotein genes in nuclear polyhedrosis virus (NPV) and its relation to evolution. BMC Genom. 2016, 17, 677. [Google Scholar] [CrossRef]
  67. Beier, S.; Thiel, T.; Münch, T.; Scholz, U.; Mascher, M. MISA-web: A web server for microsatellite prediction. Bioinformatics 2017, 33, 2583–2585. [Google Scholar] [CrossRef] [PubMed]
  68. Kurtz, S.; Choudhuri, J.V.; Ohlebusch, E.; Schleiermacher, C.; Stoye, J.; Giegerich, R. REPuter: The manifold applications of repeat analysis on a genomic scale. Nucleic Acids Res. 2001, 29, 4633–4642. [Google Scholar] [CrossRef] [PubMed]
  69. Zhu, Y.; Zhang, D. Complete chloroplast genome sequences of two species used for Tibetan medicines, Meconopsis punicea vig. and M. henrici vig. (Papaveraceae). Mitochondrial DNA Part B 2019, 5, 48–50. [Google Scholar] [CrossRef] [PubMed]
  70. Zhang, D.; Gao, F.; Jakovlić, I.; Zou, H.; Zhang, J.; Li, W.X.; Wang, G.T. PhyloSuite: An integrated and scalable desktop platform for streamlined molecular sequence data management and evolutionary phylogenetics studies. Mol. Ecol. Resour. 2020, 20, 348–355. [Google Scholar] [CrossRef] [PubMed]
  71. Nguyen, L.-T.; Schmidt, H.A.; Von Haeseler, A.; Minh, B.Q. IQ-TREE: A Fast and Effective Stochastic Algorithm for Estimating Maximum-Likelihood Phylogenies. Mol. Biol. Evol. 2015, 32, 268–274. [Google Scholar] [CrossRef]
  72. Ronquist, F.; Teslenko, M.; van der Mark, P.; Ayres, D.L.; Darling, A.; Höhna, S.; Larget, B.; Liu, L.; Suchard, M.A.; Huelsenbeck, J.P. MrBayes 3.2: Efficient Bayesian Phylogenetic Inference and Model Choice across a Large Model Space. Syst. Biol. 2012, 61, 539–542. [Google Scholar] [CrossRef] [PubMed]
  73. Letunic, I.; Bork, P. Interactive Tree Of Life (iTOL) v5: An online tool for phylogenetic tree display and annotation. Nucleic Acids Res. 2021, 49, W293–W296. [Google Scholar] [CrossRef] [PubMed]
  74. Zhang, Z.; Xiao, J.; Wu, J.; Zhang, H.; Liu, G.; Wang, X.; Dai, L. ParaAT: A parallel tool for constructing multiple protein-coding DNA alignments. Biochem. Biophys. Res. Commun. 2012, 419, 779–781. [Google Scholar] [CrossRef] [PubMed]
  75. Wang, D.; Zhang, Y.; Zhang, Z.; Zhu, J.; Yu, J. KaKs_Calculator 2.0: A Toolkit Incorporating Gamma-Series Methods and Sliding Window Strategies. Genom. Proteom. Bioinform. 2010, 8, 77–80. [Google Scholar] [CrossRef]
  76. Zhang, Z. KaKs_Calculator 3.0: Calculating Selective Pressure on Coding and Non-Coding Sequences. Genom. Proteom. Bioinform. 2022, 20, 536–540. [Google Scholar] [CrossRef]
Figure 1. The cp genome map of two newly sequenced Meconopsis species, M. paniculata and M. pinnatifolia. The outer circle showed the transcription direction; genes inside were transcribed in the clockwise direction while genes outside were transcribed counterclockwise. LSC/SSC/IR zones were shown in the inner circle. Genes belonging to different functional groups were color coded.
Ijms 25 02193 g001
Figure 2. The comparison of the LSC, IR, and SSC border regions among the 12 Meconopsis chloroplast genomes. JLB, JSB, JSA, and JLA denoted the junction sites of LSC and IRb, IRb and SSC, SSC and IRa, and IRa and LSC, respectively. The number above the gene features refers to the distance between the ends of genes and the border sites.
Ijms 25 02193 g002
Figure 3. Sequence identity plot comparing the 12 Meconopsis chloroplast genomes with M. pinnatifolia as a reference by using mVISTA. The horizontal axis represents the coordinates of cp genomes in the alignment result. Exons, introns, and conserved noncoding sequences (CNSs) are marked as different colors.
Ijms 25 02193 g003
Figure 4. Comparative analysis of the nucleotide polymorphism (Pi) values among the 12 cp genomes of Meconopsis.
Ijms 25 02193 g004
Figure 5. Usage preference of amino acids (AAs) and codons for PCGs. (A) AA usage of all the PCGs in each Meconopsis species. (B) RSCU for every AA in M. pinnatifolia. For each amino acid, a color represented a unique codon. (C) ENC-GC3 plot for M. pinnatifolia; each gene was displayed as a dot, and different colors mean genes in distinct functional groups.
Ijms 25 02193 g005
Figure 6. Repeats analysis among cp genomes of Meconopsis. (A) Distribution of all repeat units for SSRs in each species. (B) The number of different types of SSRs in each species. (C) Distribution of SSRs, respectively, in LSC, SSC, and IR regions. (D) The number of different types for long repeats.
Ijms 25 02193 g006
Figure 7. (A) Maximum likelihood (ML) phylogenetic tree of 58 species, reconstructed with 132 PCGs (bootstrap below 70% are hidden). (B) Bayesian Inference (BI) phylogenetic tree of 58 species, reconstructed with 132 PCGs (bootstrap below 0.7 are hidden). Two non-Papaveraceae species, Epimedium dolichostemon, and Epimedium lishihchenii, were set as outgroups.
Ijms 25 02193 g007
Figure 8. Heatmap representing pairwise Ka/Ks ratios of PCGs among the Meconopsis species. The color bias toward red indicates that there is a higher Ka/Ks ratio between genes.
Ijms 25 02193 g008
Table 1. Gene annotation of the M. paniculata and M. pinnatifolia chloroplast genome.
CategoryGroupGenes
Photosynthesis related genesRubiscorbcL
Photosystem IpsaA, psaB, psaC, psaI, psaJ
Photosystem IIpsbA, psbB, psbT, psbK, psbI, psbH, psbM, psbN, psbD, psbC, psbZ, psbJ, psbL, psbE, psbF
ATP synthaseatpA, atpB, atpE, atpF a, atpH, atpI
Cytochrome b/f complexpetA, petB a, petD a, petN, petL, petG
Cytochrome C synthesisccsA
NADPH dehydrogenasendhA a, ndhB a,c (×2), ndhC, ndhD, ndhE, ndhF, ndhH, ndhG, ndhJ, ndhK, ndhI
Transcription- and
translation-related
genes
TranscriptionrpoA, rpoB, rpoC2, rpoC1 a
Ribosomal proteinsrps2, rps3, rps4, rps7 c (×2), rps8, rps11, rps12 a,c (×2), rps14, rps15, rps16 a, rps18, rps19, rpl2 a,c (×2), rpl14, rpl16 a, rpl20, rpl22, rpl23 c (×2), rpl32, rpl33, rpl36
Translation initiation factorinfA
RNA genesRibosomal RNArrn16 c (×2), rrn23 c (×2),
rrn4.5 c (×2), rrn5 c (×2)
Transfer RNAtrnH-GUG, trnK-UUU a, trnQ-UUG, trnS-GCU, trnS-UGA, trnS-GGA, trnG-GCC a, trnR-UCU, trnR-ACG c (×2), trnC-GCA, trnD-GUC, trnY-GUA, trnE-UUC, trnT-UGU, trnG-UCC, trnfM-CAU, trnL-CAA c (×2), trnL-UAA a, trnL-UAG, trnF-GAA, trnV-GAC c (×2), trnV-UAC a, trnM-CAU, trnT-GGU, trnW-CCA, trnP-UGG, trnI-CAU c (×2), trnI-GAU a,c (×2), trnA-UGC a,c (×2),
trnN-GUU c (×2)
Other genesRNA processingmatK
Carbon metabolismcemA
Fatty acid synthesisaccD
ProteolysisClpP b
Conserved ORFsycf1c (×2), ycf2 c (×2), ycf3 b, ycf4, ycf15 c,d (×2)
a genes with one intron, b genes with two introns, c two gene copies in IRs, d genes only M. paniculata have.
Table 2. Summary statistics of chloroplast genomes of the Meconopsis species.
Genome FeatureM. paniculataM. pinnatifoliaM. racemosaM. henriciM. puniceaM. quintuplinerviaM. pseudohorridulaM. simplicifoliaM. betonicifoliaM. horridulaM. integrifoliaM. bella
Genome size (bp)152,887153,557153,763153,788153,281154,997154,190152,772151,935153,785151,864153,073
LSC size (bp)83.36684,06783,86883,64483,99985,15384,06483,77883,14783,90182,80983,562
SSC size (bp)17,85717,89417,90517,82217,72817,87617,77017,64617,74617,89817,75317,833
IR size (bp)25,83225,79825,99526,16125,77725,98426,17825,67425,52125,99325,64925,839
Number of genes133131129133133133134131131127127133
Protein genes888684888888888486878888
tRNA genes373737373737373737292937
rRNA genes886888888888
Duplicated genes in IRs191817191919201918191919
GC content (%)38.8%38.8%38.8%38.5%38.5%38.5%38.6%38.7%38.8%38.8%38.8%38.9%
GC content in LSC (%)37.3%37.3%37.3%37.0%37.0%37.1%37.0%37.3%37.3%37.2%37.4%37.5%
GC content in SSC (%)33.2%33.3%33.1%32.8%32.7%32.8%33.0%33.0%33.0%33.2%33.3%33.5%
GC content in IRs (%)43.1%43.1%43.1%43.0%42.9%43.0%43.0%43.1%43.1%43.1%43.1%43.2%
Disclaimer/Publisher’s Note: The statements, opinions and data contained in all publications are solely those of the individual author(s) and contributor(s) and not of MDPI and/or the editor(s). MDPI and/or the editor(s) disclaim responsibility for any injury to people or property resulting from any ideas, methods, instructions or products referred to in the content.

