Article

Quantitative Shotgun Proteomic Analysis of Bacteria after Overexpression of Recombinant Spider Miniature Spidroin, MaSp1

1
Department of Biological Sciences, University of the Pacific, Stockton, CA 95211, USA
2
Japantown Dental, San Jose, CA 95112, USA
*
Author to whom correspondence should be addressed.
Int. J. Mol. Sci. 2024, 25(6), 3556; https://doi.org/10.3390/ijms25063556
Submission received: 18 February 2024 / Revised: 12 March 2024 / Accepted: 19 March 2024 / Published: 21 March 2024

Abstract

:
Spider silk has extraordinary mechanical properties, displaying high tensile strength, elasticity, and toughness. Given the high performance of natural fibers, one of the long-term goals of the silk community is to manufacture large-scale synthetic spider silk. This process requires vast quantities of recombinant proteins for wet-spinning applications. Attempts to synthesize large amounts of native size recombinant spidroins in diverse cell types have been unsuccessful. In these studies, we design and express recombinant miniature black widow MaSp1 spidroins in bacteria that incorporate the N-terminal and C-terminal domain (NTD and CTD), along with varying numbers of codon-optimized internal block repeats. Following spidroin overexpression, we perform quantitative analysis of the bacterial proteome to identify proteins associated with spidroin synthesis. Liquid chromatography with tandem mass spectrometry (LC MS/MS) reveals a list of molecular targets that are differentially expressed after enforced mini-spidroin production. This list included proteins involved in energy management, proteostasis, translation, cell wall biosynthesis, and oxidative stress. Taken together, the purpose of this study was to identify genes within the genome of Escherichia coli for molecular targeting to overcome bottlenecks that throttle spidroin overexpression in microorganisms.

1. Introduction

Spider silk has extraordinary mechanical properties, including high tensile strength and large extensibility, giving rise to remarkable toughness [1]. Because dragline silk is the easiest to collect, it has been extensively studied by research scientists across the planet. Dragline silk is used as a safety line and for locomotion. Black widow spider (Latrodectus hesperus) dragline silk, commonly referred to as major ampullate (MA) silk, has been shown to consist of several distinct proteins. These proteins include major ampullate spidroin 1 (MaSp1), 2 (MaSp2), and 3 (MaSp3), along with low molecular weight cysteine-rich proteins 1, (CRP1), 2 (CRP2), 4 (CRP4), and cysteine-rich secretory protein 3 (CRISP3) [2,3,4,5,6]. The MA spidroins represent large molecular weight proteins (~250 kDa) with internal block repeats flanked by non-repetitive N- and C-terminal domains (NR-NTD and NR-CTDs) [7]. The internal block repeats are composed of highly repetitive short amino acid motifs of GGX, GPGXX, and poly-glycine-alanine (G = glycine, P = proline, and X represents Y = tyrosine, L= leucine, or Q = glutamine) [8], while the NTD and CTD consist of approximately 100 amino acids that are conserved across spidroin family members [9]. This sequence conservation supports the assertion that the NTD and CTD serve critical functional roles during assembly, extrusion, and fiber performance [10]. Despite differences in amino acid sequences, structural biochemical analyses have shown the NTD and CTD both fold into five-helix bundles that facilitate solubility and connectivity of spidroins [11,12,13]. Moreover, the NTD and CTD have been shown to be important in protein dimerization, with implications as chief participants that regulate the spider silk assembly pathway [12,13,14,15]. Specifically, the CTD has been shown to contain a conserved cysteine residue involved in spidroin homo-dimerization [15].
Because of the diversity of spider silk and its outstanding mechanical properties, it has attracted the interests of scientists for utilization in commercial, military, medical, and engineering applications. However, the inability to farm spiders and harvest their natural silk due to their cannibalistic nature, their difficulty in “milking” or removing silk manually, and their venomous nature limit the ability to domesticate spiders for harvesting silk on a large-scale. Thus, given these challenges, scientists have focused on synthetic silk production through wet-spinning or electrospinning methodologies [16,17,18]. Because synthetic fiber production requires vast amounts of recombinant spider silk proteins for spinning, a variety of heterologous protein expression systems have been explored, including goats [19], yeast [20,21], insects [22], plants [23], mammalian cells [24], silkworms and bacteria [25,26,27]; however, none of these systems have produced satisfactory yields of native-size recombinant spidroins on a cost-effective scale to transition into large-scale global manufacturing of synthetic spider silk. In part, the intrinsic molecular features of MA spidroins, which include their long protein chains with internal block repeats, coupled with GC-rich codons that specify large amounts of glycine and alanine, make expression of full-length spidroins in non-spider cells that lack the molecular machinery to transcribe and translate these structural proteins a challenging task. Attempts to devise strategies to genetically alter microbial strains to enhance spidroin expression have been pursued; however, these studies have focused on the expression of the internal block repeats of MA spidroins but have excluded the highly conserved NTD and CTD [28]. Because bacteria represent an economically favorable choice for large-scale native-size recombinant spidroin production, we have focused on the identification of important targets within the bacterial proteome that participate in spidroin biosynthesis, specifically searching for bottleneck proteins that currently throttle high expression of recombinant spidroins. We hypothesize that the discovery of pivotal bacterial “gatekeepers” will provide new avenues to overcome the restriction points of recombinant spidroin expression.
In summary, we have expressed mini-spidroins that include the NTD and CTD, along with various numbers of internal block repeats of MaSp1, and we have performed a global proteomic profiling analysis. The specific goal of our proteomic study was to identify bacterial proteins directly involved in spidroin synthesis, aiming to discover impediments that occur during spidroin overexpression. With the long-term objective of producing large quantities of spidroins, our proteomic profiling following enforced expression of MaSp1 mini-spidroins provides an important list of candidates within the bacterial genome that represent potential targets to advance the development of customized genetically engineered strains of bacteria for optimal spidroin expression.

2. Results

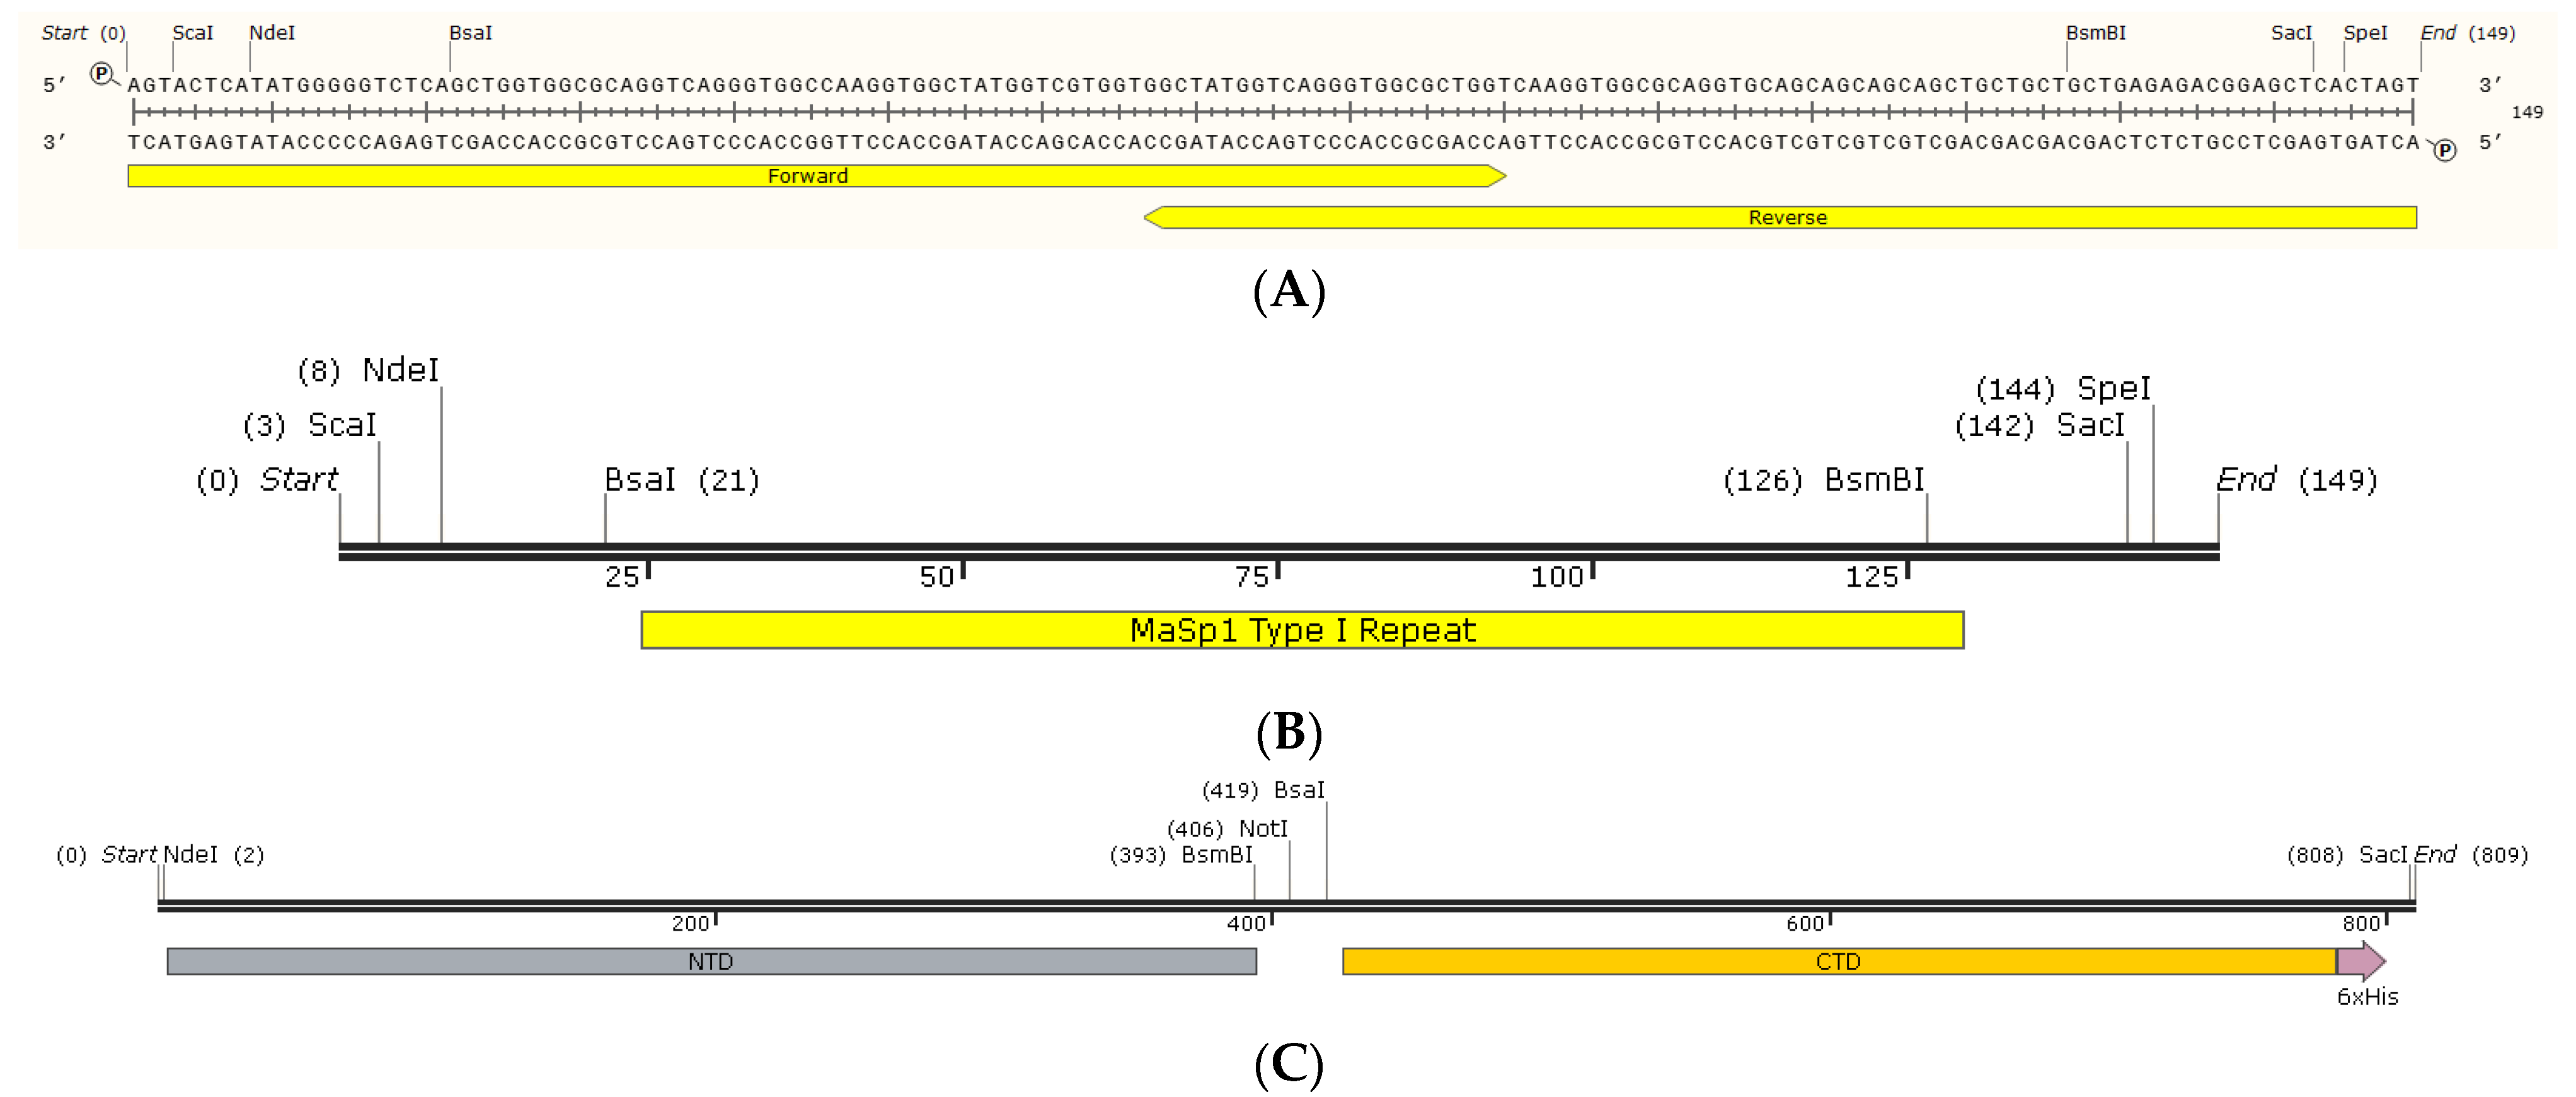
2.1. MaSp1 NTD-nx-CTD Constructs as Miniature Spidroins (Mini-Spidroins)

One of the major barriers to large-scale synthetic spider silk production is the ability to manufacture vast quantities of recombinant spidroins. Because bacteria divide rapidly and are relatively inexpensive to culture, we investigated the impact of overexpression of mini-spidroins on the bacterial proteome with the goal of identifying important regulators to target for enhanced mini-spidroin recombinant expression. Two different mini-spidroin lengths were created using nucleic acid sequence information from L. hesperus MaSp1 (NTD-nx-CTD; n = number of internal block repeats): NTD-2x-CTD and NTD-4x-CTD. A single type I block repeat of MaSp1, the most common ensemble repeat within the primary sequence of MaSp1 [7], was generated by annealing two oligonucleotides that were codon-optimized for bacterial expression, along with the integration of the restriction sites BsaI and BsmBI to facilitate seamless expansion of the internal block repeats (Figure 1A,B). The natural NTD and CTD cDNAs were amplified from a black widow cDNA library prepared from silk-producing glands [29]; these products were also engineered to harbor overlapping sequences, along with the incorporation of internal BsmBI and BsaI sites to allow for insertion of MaSp1 block repeats to create pET24a-NTD-2x-CTD and pET24a-NTD-4x-CTD expression vectors (Figure 1C).
Following the assembly of the MaSp1 NTD-nx-CTD expression vector, the predicted molecular weights of the 2x- and 4x-MaSp1 mini-spidroins were determined to be 31.6 to 37.1 kDa, and their glycine and alanine contents ranged from 15.6 to 21.4% and 21.1 to 22.9%, respectively. The primary amino acid sequences of the NTD-2x-CTD and NTD-4x-CTD mini-spidroins are shown (Table 1).

2.2. Expression of MaSp1 Mini-Spidroins in Bacteria

After assembly of the NTD-nx-CTD MaSp1 gene fusions, the coding regions were verified via DNA sequence analysis, and then the expression vectors were transformed into BL21 (DE3)pLysS cells. Whole cell lysates were collected after recombinant protein induction to confirm mini-spidroin expression via Western blot analysis. Western blot analysis using an anti-histidine mouse monoclonal antibody detected NTD-2x-CTD and NTD-4x-CTD mini-spidroins (Figure 2, lanes 2 and 4). The experimental masses of NTD-2x-CTD and NTD-4x-CTD were consistent with their predicted masses (Table 1). Interestingly, a higher molecular weight immunoreactive species (smear) was also observed in the crude lysate of NTD-4x-CTD expressing cells (Figure 2A, lane 4). This likely represents the inability of the thermal energy, detergent, and reducing agent to dissociate NTD-4x-CTD aggregates, as larger molecular weight spidroins expressed in bacteria have been shown to be difficult to break into monomeric units [28]. To further confirm the presence of MaSp1 mini-spidroin expression in the bacteria, we performed in-solution tryptic digestion followed by nLC-MS/MS analysis using crude bacterial lysates. In both NTD-2x-CTD and NTD-4x-CTD-induced crude bacterial lysates, the MS/MS analysis routinely identified six unique peptides that mapped back to the MaSp1 mini-spidroins. These precursor ions (monoisotopic) corresponded to m/z values of 764.43 (M2H+), 1149.53 (M2H+), 2764.25 (M3H+), 2831.31 (M4H+), 4702.08 (M4H+), and 4720.28 (M4H+); the precursor ion mass m/z 4720.28 after fragmentation with HCD is shown (Figure 2B).
Typically, our MS/MS studies yielded approximately 70% sequence coverage of MaSp1 mini-spidroins. We were unable to detect the C-terminus of the mini-spidroins because they lacked an arginine (R) or lysine (K) tryptic cleavage site; protease digestion led to a peptide ion with m/z of 9510.7 (MH+), which was beyond the quadrupole capabilities of the mass spectrometer (Table 1, underlined region). Taken together, the Western blot analysis and nLC-ESI MS/MS analyses support the expression of both MaSp1 2x and 4x mini-spidroins in the bacteria.

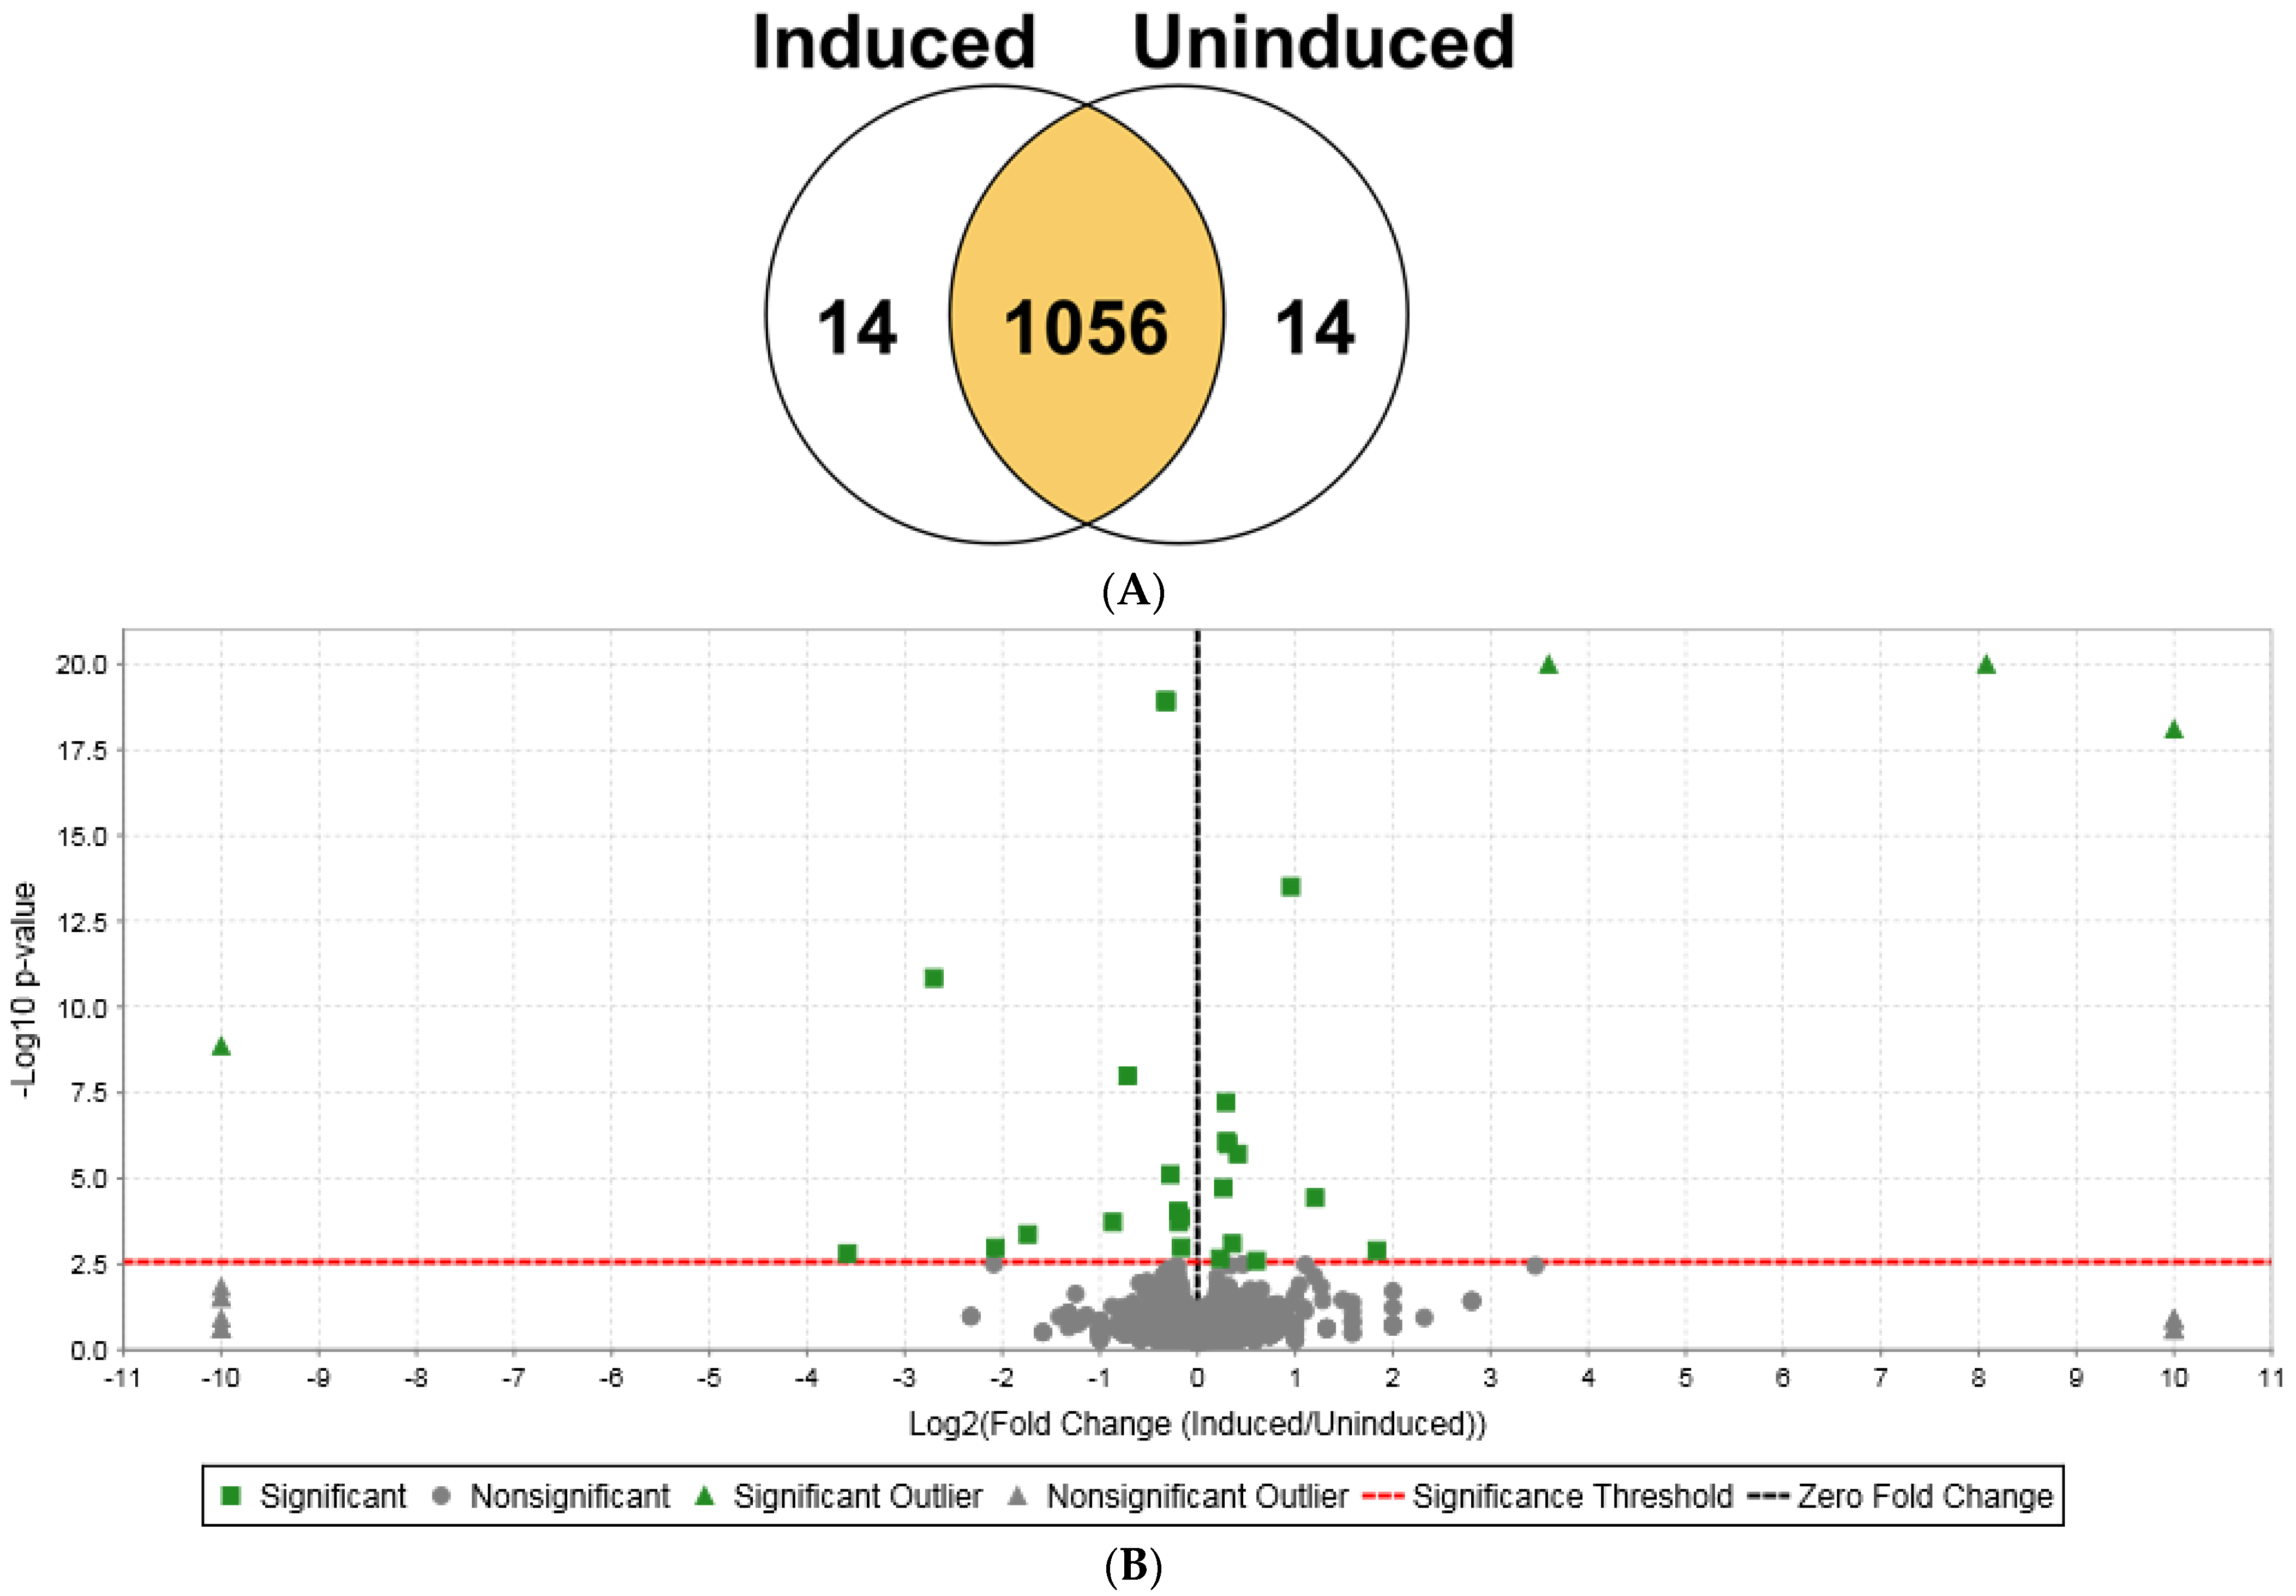
2.3. Quantitative Shotgun Proteomic Analysis of Bacteria Expressing MaSp1 Mini-Spidroins

To identify bacterial gene products influenced by MaSp1 mini-spidroin expression, we investigated global changes in the bacterial proteome after enforced expression of MaSp1. To reduce the complexities of downstream genetic regulatory networks responding to prolonged IPTG induction, we focused on short-term changes within the bacterial proteome after 2 h of IPTG treatment. Quantitative shotgun proteomic analyses were performed on IPTG-induced and non-induced bacteria carrying NTD-nx-CTD expression vectors. nLC-MS/MS analysis of biological replicates from bacterial cells expressing NTD-2x-CTD mini-spidroins produced 251,735 MS/MS spectra, leading to the identification of 1084 proteins. To compare the relative quantitative profiles of the induced versus non-induced lysates, we analyzed the proteomic data using a Fisher’s exact test (p-value less than 0.05) and a Benjamini-Hochberg multiple test correction. Based on the relative quantitative profiles, 28 proteins were differentially expressed, with 14 upregulated and 14 downregulated proteins (Figure 3A,B). All 28 differentially expressed proteins were mathematically statistically significant (Table 2 and Supplementary Table S1); however, we set the boundaries for quantitative significance at ratios of greater than or equal to 1.2 (up and down), similar to other reported studies [30]. During quantitation of the expression data, the Scaffold 5 algorithm defined outliers when fold changes were log2 ≥ ±10 (+OLR or −OLR) and/or the p-values were 1.00 × 10⁻²⁰ or smaller. In the volcano plot, four proteins were demonstrated to be outliers, including galactoside O-acetyltransferase, beta-galactosidase, MaSp1 NTD-2x-CTD, and D-galactose-binding periplasmic protein (Figure 3A,B; Table 2).
The p-values for MaSp1 NTD-2x-CTD and beta-galactosidase were 1.00 × 10⁻²⁰, and their fold-increases were 12.07 and 270.33, respectively (Table 2). Of the 14 induced proteins, 13 were shown to have increases of ≥1.20, while 10 of the downregulated proteins were demonstrated to have decreases of ≥1.20 (Table 2; Supplementary Table S1). Proteomic profiling revealed several proteins involved in lactose or galactose metabolism, including beta-galactosidase, galactoside O-acetyltransferase, D-galactose-binding periplasmic protein, galactose/methyl galactoside import ATP-binding protein, and HTH-type transcriptional regulator GalS, supporting the assertion that the molecular circuitry was responsive to the addition of IPTG, a molecular analog of allolactose. It also demonstrated robust expression of the NTD-2x-CTD spidroin construct (>12 fold), with an increase in the expression of the cellular stress proteins chaperone protein DnaK, chaperone protein HtpG, and catalase-peroxidase (Table 2 and Supplementary Table S1).
Protein studies employing shotgun proteomics of NTD-4x-CTD-expressing bacterial cell lysates via nLC-ESI MS/MS analysis also led to the identification of 1084 proteins, which corresponded to 259,158 MS/MS spectra. Using similar statistical tools applied to the NTD-2x-CTD construct, we examined the proteomic data by performing a Fisher’s exact test and a Benjamini–Hochberg multiple test correction. A Venn diagram of the relative quantitative values between the induced and non-induced samples showed that 209 proteins were differentially expressed with statistical significance, representing 19.3% of all the identified proteins (Figure 4A,B). Eight hundred and seventy-five proteins showed no change in expression levels (Figure 4A). Of the 209 differentially expressed proteins, 125 were upregulated, while 84 were downregulated (Table 3; Supplementary Table S2). In the volcano plot, there were 9 upregulated and 3 downregulated statistically significant outliers (Figure 4B).
The nine upregulated outliers included galactoside O-acetyltransferase, quinone oxidoreductase 2, chaperedoxin, alanine racemase, uncharacterized protein YiaF, 3-methyl-2-oxobutanoate hydroxymethyltransferase, uncharacterized lipoprotein YajG, MaSp1 NTD-4x-CTD, and beta-galactosidase (Figure 4B, upper right pane; Table 3), while the three downregulated outliers comprised D-galactose-binding periplasmic protein, ribonuclease P protein component, and transcriptional regulator MntR (Figure 4B, upper left pane; Table 3). A total of 50 of the 125 induced proteins displayed ≥3-fold increases, while 75 proteins exhibited fold changes ranging from 1.2 to 2.8 (Table 3 and Supplementary Table S2). Some prominent upregulated proteins included agmatinase (SpeB), cytochrome bo(3) ubiquinol oxidase subunit 1 (CyoA), peroxiredoxin (OsmC), and cold shock protein (CspA). Of the 84 proteins that displayed reduced protein expression, 10 proteins displayed decreases ranging from 3- to 12-fold, while 25 proteins showed reductions in the range of 1.20 to 1.77. Notable downregulated proteins included ATP-dependent RNA helicase (HrpA), glycine-tRNA ligase beta subunit (GlyS), elongation factor 4, aspartate–ammonia ligase, and ribonuclease P protein component—all components of translation (Table 3).

3. Discussion

3.1. Experimental Strategy

In these studies, we provide new insight into gene expression profile changes experienced by bacteria following the induction of MaSp1 mini-spidroins. To our knowledge, this represents the first study that employs quantitative shotgun proteomics on a global scale to investigate changes in the entire bacterial proteome during spidroin expression, incorporating the NTD, CTD, and internal block repeats—a combination that most closely mimics the natural state of spidroins in arachnids. Enforced expression of MaSp1 mini-spidroins led to the identification of a multitude of differentially expressed proteins within the bacterial proteome. More proteins were identified using the NTD-4x-CTD construct relative to NTD-2x-CTD (209 proteins versus 28, respectively), which likely reflects the propensity of additional internal block repeats to promote aggregation, a current barrier involving the expression of larger molecular weight spidroin constructs in heterologous expression systems. The NTD-4x-CTD protein profiling list included bacterial proteins that were elevated, as well as gene products that were reduced during mini-spidroin expression (Table 3 and Supplementary Table S2). Collectively, our proteomic data provide important insight to delineate bottlenecks that occur during recombinant spidroin expression, offering potential countermeasures to achieve higher expression of spidroins in bacteria.

3.2. Identified Targets

In our analysis, as previously mentioned, we observed more statistically significant changes in protein expression for the NTD-4x-CTD construct relative to the NTD-2x-CTD mini-spidroin (Table 2 and Table 3). Examination of the expression of the mini-spidroins via Western blot analysis revealed aggregation of our NTD-4x-CTD construct, a scenario that was not observed when using the NTD-2x-CTD construct (Figure 2, lanes 2 and 4). Evidence to support the responsiveness of the molecular circuitry of the bacteria was demonstrated by IPTG addition, which resulted in the induction of proteins associated with lactose metabolism, including beta-galactosidase, galactoside O-acetyltransferase, D-galactose-binding periplasmic protein, and alpha-galactosidase (Table 2 and Table 3). These expression profile changes were found to be statistically significant. Similar effects of IPTG on bacterial gene expression have been reported via DNA microarray analysis and proteomic studies [31,32].
Deeper inspection of our proteomic data revealed, particularly with the NTD-4x-CTD construct, the appearance of oxidative stress, resource management challenges, and protein aggregation. It has been reported that high-level expression of recombinant proteins in host cells promotes metabolic adaptations, including increased energy production [33]. This, in turn, results in a rise in reactive oxygen species (ROS), including superoxide anion O2, hydrogen peroxide, and radical hydroxide HO·, via cellular respiration. In relation to oxidative stress, we observed elevated expression of several proteins involved in energy production, ROS metabolism, and membrane synthesis. These proteomic changes suggest increased respiratory chain activity for energy production by BL21 cells, which is accompanied by the breakdown of additional cellular fuel sources to handle the high energy demands of increased transcription and translation. This assertion is supported by increased levels of quinone oxidoreductase (QorB), a respiratory chain component of E. coli that catalyzes the reduction of quinones to increase ATP production. Increased respiration and energy production is also often associated with elevations in ROS. This correlates with increased levels of alkyl hydroperoxide reductase C (AhpC) and peroxiredoxin (OsmC), which are both proteins involved in hydrogen peroxide metabolism [34,35]. We also observed 6.6-fold elevated levels of agmatinase (SpeB), an enzyme that catalyzes the conversion of agmatine to putrescine. Putrescine catabolism is a metabolic response linked to oxidative stress [36]. Both agmatinase and GTP cyclohydrolase 1 type 2 homolog (Ybg1) proteins have also been shown to have functions to protect against oxidative damage [37]. Interestingly, the speB gene was identified as one of forty-seven mutated genes in a MaSp1-hosting SoluBL21 strain generated through directed evolution [38]. This mutant strain produced the highest level of spidroins compared to nine other strains. This increase was associated with a single mutation within the speB gene, giving rise to a Ser33 to Ala33 alteration in the protein chain [38]. According to this study, the published data did not address whether this mutation resulted in a loss-of-function of SpeB enzymatic activity; therefore, it is difficult to integrate its relationship with our proteomic findings. In our studies, SpeB levels increased during NTD-4x-CTD induction, suggesting that overexpression of our recombinant MaSp1 construct influenced the same stress response pathway. Collectively, both studies seem to pinpoint agmatinase as an important modulator during spidroin expression in bacteria.
Specifically, elevated levels of chaperedoxin (CnoX), a holdase, have been reported to prevent protein aggregation [39]. The elevation of CnoX expression corresponds to the formation of mini-spidroin aggregation, suggesting that CnoX potentially represents an outstanding target to reverse perturbations in proteostasis during spidroin overproduction. During spidroin overexpression, it would seem critical to maintain spidroin solubility (no aggregation or reduced protein mis-folding), which is intricately linked to the viability of bacteria. Additionally, we observed a 3-fold increase in CspA, an RNA-binding protein that is normally induced during a cold-shock response to abrupt shifts to growth conditions at lower temperatures [40]. Interestingly, it has been reported that the growth of bacteria expressing recombinant spidroins is enhanced by shifts to colder temperatures (e.g., 16 °C or 20 °C), yet the underlying mechanism(s) mediating this increase was not elucidated [27,41]. In light of our observations, a shift to lower growth temperatures likely further enhances expression of CspA, assisting in recombinant spidroin synthesis. CspA has been shown to participate in melting of secondary structure within mRNAs, functioning as a thermosensor to facilitate translation [42]. It would appear that elevated levels of CspA after NTD-4x-CTD expression could be assisting in alleviating the secondary structure of MaSp1 mRNA, facilitating increased translation of MaSp1 transcripts. Intriguingly, an analysis of the transcriptome of black widow spiders does predict a protein with a 55% similar identity (64% positive) to bacterial CspA, suggesting a potential linkage and overlapping biological function during spidroin expression in spiders [43]. In the future, we plan on co-overexpressing both CspA and NTD-nx-CTD constructs to improve spidroin production in bacteria. Some of our best candidates identified in our proteomic analysis represent uncharacterized bacterial proteins (accession numbers P0ADK0, P0ADA5, P0AD33, and P77376), which will require further investigation to elucidate their specific roles in spidroin expression (Table 3). Other identified candidates with elevated protein levels are curious, such as alanine racemase, which catalyzes the interconversion of L- and D-alanine [44]. D-alanine is an essential component of the peptidoglycan layer of the bacterial cell wall, which might indicate that overexpression of spidroins in bacteria promotes a form of cell wall stress, influencing cell well assembly. It is also worth noting that we observed a considerable number of additional proteins involved in outer membrane biogenesis, including chain length determinant protein (WzzB), 3-deoxy-manno-octulosonate cytidylyltransferase (KdsB), and phosphoethanolamine transferase (EptA). This supports the hypothesis that overexpression of our mini-spidroins is influencing membrane biogenesis.
If synthetic spider silk is going to be implemented on a global scale, vast quantities of recombinant spidroins will be required for production. These materials must be obtained in a cost-efficient manner, which leads scientists back to improving expression in heterologous recombinant protein systems. Expression in bacteria seems to represent the logical choice. Taken together, our findings reveal several targets for genetic manipulation to establish customized engineered strains of E. coli. Moreover, it will be exciting to use these engineered strains to express longer versions of the MaSp1 mini-spidroins that carry more internal block repeats, and our seamless cloning strategy readily allows for expansion to larger constructs (e.g., NTD-8x-CTD, NTD-16x-CTD, NTD-32x-CTD).

4. Materials and Methods

4.1. Site-Directed Mutagenesis of Parental pET24a Vector

Prior to construction of the MaSp1 expression vectors, site-directed mutagenesis was performed on the parental pET24a cloning vector to destroy the BsmBI restriction site. Three sites were targeted for destruction. These sites were named 923, 2500, and 3627, which reflected their location in base pairs (bp) within the parental pET24a cloning vector (Novagen Inc, Madison, WI, USA). Primers were designed to alter a single nucleotide within the BsmBI restriction sites. The primer sequences utilized for the mutations were as follows: 923F 5′-TGA TTG CGC CTG AGC TAG ACG AAA TAC CGC ATC GC-3′, 923R 5′-GCG ATG CGG TAT TTC GTC TAG CTC AGG CGC AAT CA-3′, 2500F 5′-GAC AAG CTG TGA CCG CCT CCG GGA GCT GCA T-3′, 2500R 5′-ATG CAG CTC CCG GAG GCG GTC ACA GCT TGT C-3′, 3627F 5′-GGT TTT TCT TTT CAC CAG TTA GAC GGG CAA CAG CTG A-3′, and 3627R 5′-TCA GCT GTT GCC CGT CTA ACT GGT GAA AAG AAA AAC C-3′ (underlined nucleotides represent BsmBI mutation). Mutations were introduced using the QuikChange II Site-Directed Mutagenesis kit according to the manufacturer’s instructions (Agilent Technologies, Folsom, CA, USA). Briefly, the pET24a parental vector was denatured, annealed with mutagenic primers, extended with PfuUltra DNA polymerase, digested with DpnI, and then transformed into bacterial cells. We first targeted the BsmBI site, positioned at 923 bp. Following mutant strand synthesis and DpnI digestion, the products were transformed into XL1-Blue cells and then plated on media supplemented with 30 μg/mL kanamycin. Colonies were picked and inoculated in Luria broth (LB) and cultured overnight at 37 °C with shaking (200 rpm). To confirm the mutation, purified pET24a plasmid DNA was digested using BsmBI at 55 °C for 2 h, and the products were analyzed using agarose gel electrophoresis. Once the 923 site was mutated, this plasmid was subjugated to a second round of site-directed mutagenesis to alter the second BsmBI site located at 2500 bp. Essentially, all the steps previously described for mutagenesis were identical, but a different primer set was utilized for the mutation of the second BsmBI site within the plasmid. After the BsmBI site at 2500 bp was confirmed to be mutated, the pET24a containing double mutations at 923 and 2500 bp underwent site-directed mutagenesis a final time; a third round to mutate the BsmBI site at position 3627. The final triple-mutated pET24a vector (pET24a triple mutant) was confirmed via restriction digest analysis.

4.2. Plasmid Construct Assembly

In order to create the MaSp1 block repeat for multimerization and expression studies, two oligonucleotides were codon-optimized for expression in Escherichia coli. Because the desired coding region of the Latrodectus hesperus MaSp1 block repeat approached the limitations of primer synthesis, forward and reverse oligonucleotides were designed with short 3′ complementary ends for annealing purposes, while their 5′ single-stranded overhangs allowed for filing by Taq DNA polymerase. The MaSp1 forward primer sequence was 5′-AGT ACT CAT ATG GGG GTC TCA GCT GGT GGC GCA GGT CAG GGT GGC CAA GGT GGC TAT GGT CGT GGT GGC TAT GGT CAG GGT GGC GCT GGT-3′, whereas the MaSp1 reverse primer was 5′-ACT AGT GAG CTC CGT CTC TCA GCA GCA GCA GCT GCT GCT GCT GCA CCT GCG CCA CCT TGA CCA GCG CCA CCC TGA CCA TAG CC-3′ (nitrogenous bases that are underlined denote complementary base sequences to facilitate annealing). The forward primer and reverse primers were engineered to incorporate ScaI-NdeI-BsaI and SpeI-SacI-BsmBI sites, respectively (bolded nitrogenous bases). These primers were designed to incorporate unique restriction sites on the 5′-termini of the synthetic MaSp1 block repeat (1×) in order to facilitate subcloning into the mutated pET24a vector. A single block repeat of the MaSp1 coding region was further amplified using two gene-specific primers with the forward and reverse sequences 5′-AGT ACT CAT ATG GGG GTC TCA GCT GG-3′ and 5′-ACT AGT GAG CTC CGT CTC TCA GCA GC-3′, respectively. Following PCR, the products were gel extracted using a QIAquick Gel Extraction Kit according to the manufacturer’s instructions (Qiagen, Hilden, Germany). The gel-extracted DNA fragments were then ligated into pBAD TOPO, and the inserts were subject to DNA sequencing (Sequetech Corporation, Mountain View, CA, USA) to confirm the presence of the synthetic MaSp1 gene. The MaSp1 block repeat was removed by NdeI and SacI and ligated into the pET24a triple mutant vector to create pET24a-MaSp1-1x.

4.3. Seamless Cloning Strategy

After construction of the pET24a-MaSp1-1x vector, we multimerized the MaSp1 block repeat. In order to eliminate superfluous codon addition at the junctions during the expansion of the MaSp1 synthetic block repeats, we implemented a seamless cloning strategy using three restriction enzymes: BsaI, BsmBI, and SacI; this approach closely followed a previously published study with non-silk genes [45]. Briefly, the pET24a-MaSp1-1x construct was digested with BsaI and SacI, creating a MaSp1-1x block repeat with an intact BsmBI site, while another pET24a-MaSp1-1x construct was digested with BsmBI and SacI, generating compatible ends for ligation and expansion into pET24a-MaSp1-2x. Once the pET24a-MaSp1-2x cloning vector was confirmed, it was used in a similar method as described above to create pET24a-MaSp1-4x. All plasmids containing MaSp1-block expansions were sent for DNA sequencing to confirm that the fusion resulted in seamless joints (Sequetech Corporation, Mountain View, CA, USA).

4.4. Construction of NTD and CTD of MaSp1

The cDNAs encoding the NTD and CTD of MaSp1 were amplified with gene-specific primers using a cDNA library prepared from a black widow spider. These primers were designed to incorporate restriction sites on their 5′-termini to facilitate seamless cloning of the codon-optimized MaSp1 block repeats released from pET24a-MaSp1-nx (nx, where n stands for the number of MaSp1 block iterations). The oligonucleotides used to amplify the coding region of the MaSp1 NTD were designed to create restriction sites on the 5′ termini of the forward (NdeI; bolded) and reverse primers (PvuII-NotI-BsmBI; bolded), respectively. The NTD forward (NTD-F1) and reverse primer (NTD-R1) sequences were 5′-CAT ATG CAA GCC AAC ACG CCA TGG T-3′ and 5′-CAG CTG AGA CCG CGG CCG CCG TCT CTC AGC GGC GTA TAC ATC GTT GGC AGA TGC CTG T-3′, respectively. The forward (CTD-F1) and reverse (CTD-R1) primers used to amplify the MaSp1 CTD were 5′-CCG CTG AGA GAC GGC GGC CGC GGT CTC AGC TGC CAG TGG ACC TGG TCA AAT TTA TTA TGG ACC CC-3′ and 5′-GAG CTC CTA GTG GTG GTG GTG GTG GTG GGC GAA TGC ATT TTG AAC AGA TTG AG-3′, respectively. The 5′ termini of the CTD forward primer added the restriction sites BsmBI-NotI-BsaI, while the reverse primer added a 6x histidine tag and SacI restriction site. Once the MaSp1 cDNAs encoding the NTD and CTD were amplified, they were ligated (separately) into pBAD TOPO to create pBAD-TOPO-NTD and pBAD-TOPO-CTD, respectively. The cDNAs encoding the NTD and CTD were excised from pBAD-TOPO via double restriction digestion using NdeI and BsmBI or BsmBI and SacI, respectively, and then they were gel-extracted. Through the incorporation of the BsmBI and NotI restriction sites, the 3′ end of the NTD PCR product was complementary to the 5′ end of the CTD PCR product, allowing the NTD segment to be partially annealed to the CTD cDNA, a principle that facilitated the fusion of the two products. Briefly, the gel-extracted digestion products of the NTD- and CTD-encoding segments were combined, denatured for 3 min at 95 °C, then allowed to anneal at 50 °C for 3 min, followed by extension of their overhangs with Taq DNA polymerase. After extension, the composite NTD–CTD gene segment was amplified via PCR using the gene-specific NTD-F1 and CTD-R1 primers. The amplified product was ligated into pBAD TOPO and removed via NdeI and SacI digestion, followed by ligation into the triple BsmBI mutant pET24a vector, creating pET24a-NTD-CTD.

4.5. MaSp1 Mini-Spidroin Design

To assemble the final mini-spidroin expression vectors, the pET24a-NTD-CTD vector (triple mutant) and multiple iterations of pET24a-MaSp1 (e.g., pET24a-MaSp1-2x and 4x) were digested with BsaI and BsmBI. The released MaSp1 block repeat(s) from pET24a-MaSp1-nx were inserted into the pET24a NTD-CTD vector to create pET24a-NTD-MaSp1-nx-CTD; these constructs were often abbreviated as NTD-nx-CTD. All the plasmids were checked via restriction digestion and DNA sequencing analysis.

4.6. Recombinant Protein Expression and Western Blot Analysis

For recombinant protein expression in E. coli, BL21 (DE3)pLysS chemically competent cells were transformed with pET24a-NTD-MaSp1-nx-CTD plasmids and induced at OD600 = 0.5 with 1 mM IPTG. Bacterial cells were grown for 2 h at 37 °C with shaking at 200 rpm. After 2 h, cell densities were determined using visible spectroscopy at 600 nm with a NanoDrop™ 2000c spectrophotometer (Thermo Fisher Scientific, Tracy, CA, USA) and normalized to ensure equivalent bacterial cell densities. Equivalent cell densities were double-pelleted and then prepared for Western blotting and MS/MS analyses. For SDS-PAGE analysis, the double-pellets were re-suspended in protein loading buffer, sonicated, boiled at 95 °C for 10 min, and centrifuged at 16,000× g for 10 min. Electrophoresis was performed at 150 V (15 V/cm) for 45 min. After electrophoresis, the proteins were transferred to a PVDF membrane for 7 min at 25 V using the Pierce™ G2 Fast Blotter. The PVDF membrane was blocked for 1 h in 5% powdered milk dissolved in 1× Tris-buffered saline with 0.1% Tween 20® detergent (TBS-T buffer). The antigens were detected using a mouse anti-histidine IgG monoclonal antibody, followed by antigen–antibody detection with a goat anti-mouse IgG secondary antibody conjugated with horse radish peroxidase (HRP). Antigen–antibody complexes were visualized using Thermo Fisher’s chemiluminescent Pierce™ ECL Western blotting substrate.
For MS/MS analyses, two biological replicates of induced and non-induced cells were washed three times with 1× phosphate-buffered saline (PBS pH = 7.5), then subject to in-solution tryptic digestion.

4.7. In-Solution Tryptic Digestion

The bacterial cell pellets were lysed with a final concentration of 3M urea (dissolved in 50 mM Tris, pH = 8). After cell lysis, chromosomal DNA was sheared via sonication, followed by reduction of protein disulfide bonds with 5 mM DTT, then sulfhydryl alkylation using 20 mM iodoacetamide (IAA). Excess IAA was quenched via treatment with 20 mM DTT. All incubations with DTT and IAA were performed for 45 min at room temperature. Following reduction and alkylation, the samples were diluted with water to adjust the concentration to 1 M urea. The proteins were digested overnight at 37 °C using 2 μg of trypsin (1:50 ratio of trypsin/substrate). To reduce miscleavage events, the overnight digests were further supplemented with an additional 1 μg of trypsin for 2 h. After digestion, the lysates were centrifuged at 16,000× g for 3 min, and the supernatants were transferred to new Eppendorf tubes. Tryptic digestions were terminated with the addition of 1% trifluoroacetic acid (TFA). Prior to desalting and concentration of peptides using Pierce™ C18 Spin columns, the tryptic digests were adjusted to 5% acetonitrile (ACN), then the tryptic peptides were subject to purification according to the manufacturer’s instructions.

4.8. Mass Spectrometry and Chromatography

Mass spectrometry analysis was performed using an Orbitrap Fusion™ Tribrid™ mass spectrometer equipped with an Easy-Spray ion source (Thermo Fisher Scientific) operated in data-dependent acquisition mode (DDA) with Xcalibur 4.0 software (Thermo Fisher Scientific). Survey scans were acquired using the Orbitrap (OT) mass detector with a resolution setting of 120,000. Precursor ions were isolated with the quadrupole window set to a range of m/z 300–1500 Da. The intensity threshold for precursor ion fragmentation was set at 1.0 × 10⁵. Charge states of precursor ions with +2 to +8 were selected for fragmentation. MS/MS data were collected with the OT set to a resolution of 30,000 and fragmentation was performed using HCD with a collision energy of 30%.
For analysis, 250 ng of tryptic digest were injected into the Easy-Spray PepMax® C18 analytical column using a Dionex Ultimate 3000 autosampler. Each biological replicate was injected into the mass spectrometer three times (technical triplicates). The C18 UHPLC column was 75 micron i.d. × 15 cm, 100 Å; Thermo Fisher Scientific, Tracy, CA, USA). A 140 min chromatography run was performed that utilized a customized ACN gradient. Solvents A (water) and B (100% ACN) were both supplemented with 0.1% formic acid. The following 140 min gradient conditions were employed: 2% B for 5 min, 2–22% B for 70 min, 22–38% B for 25 min, 38–95% for 10 min, and 95 to 2% for 30 min. The flow rate was 300 nL per min, and the needle voltage for ionization was set at 1900 Volts.

4.9. Data Analysis

The MS/MS spectra were analyzed using Proteome Discoverer 2.4 (Thermo Fisher Scientific, Tracy, CA, USA). A Uniprot protein database for E. coli (strain K12; sp_canonical Taxon ID = 83333) was downloaded on 15 April 2022, containing all the SwissProt and Trembl entries. The predicted protein sequences of NTD-nx-CTD of MaSp1 were manually added to the E. coli protein database. The following settings were used for the database searches: precursor ion mass tolerance was set to 10 ppm, while the fragment ion mass tolerance was set to 0.02 Da. Variable modifications included carbamidomethylation of cysteine (C), deamination of glutamine and asparagine (Q and N), and oxidation of methionine (M). The Percolator algorithm was used to enhance statistical confidence in protein identifications and was set to a 1% false discovery rate (FDR). After the Proteome Discoverer analysis, data files with msf extensions were imported into Scaffold 5 Q + S (Proteome Software, Seattle, WA, USA) and subject to quantitative analysis. The raw data files can be obtained from the Center for Computational Mass Spectrometry MassIVE (massive.ucsd.edu).

Supplementary Materials

The following supporting information can be downloaded at: https://www.mdpi.com/article/10.3390/ijms25063556/s1.

Author Contributions

Conceptualization, C.V.; methodology, C.V., K.R. and J.A.H.M.; software, C.V. and K.R.; investigation, C.V., K.R., J.A.H.M. and M.Y.; resources, C.V.; writing—original preparation, C.V. and K.R.; writing—review and editing, C.V., K.R., J.A.H.M. and M.Y.; supervision, C.V.; project administration, C.V.; funding acquisition, C.V. All authors have read and agreed to the published version of the manuscript.

Funding

This research was funded by the National Science Foundation (DBI 1531417) to Craig Vierra.

Institutional Review Board Statement

Not applicable.

Informed Consent Statement

Not applicable.

Data Availability Statement

Data supporting the reported results will be available from the corresponding author.

Acknowledgments

We are grateful for the discussion of the proteomics data with William Chan, Avery Whipple, and Jillian Lim.

Conflicts of Interest

The authors have no conflicts of interest.

References

  1. Gosline, J.M.; Guerette, P.A.; Ortlepp, C.S.; Savage, K.N. The mechanical design of spider silks: From fibroin sequence to mechanical function. J. Exp. Biol. 1999, 202, 3295–3303. [Google Scholar] [CrossRef] [PubMed]
  2. Larracas, C.; Hekman, R.; Dyrness, S.; Arata, A.; Williams, C.; Crawford, T.; Vierra, C.A. Comprehensive proteomic analysis of spider dragline silk from black widows: A recipe to build synthetic silk fibers. Int. J. Mol. Sci. 2016, 17, 1537. [Google Scholar] [CrossRef] [PubMed]
  3. Watanabe, Y.; Arakawa, K. Molecular mechanisms of the high performance of spider silks revealed through multi-omics analysis. Biophys. Physicobiol. 2023, 20, e200014. [Google Scholar] [CrossRef] [PubMed]
  4. Xu, M.; Lewis, R.V. Structure of a protein superfiber: Spider dragline silk. Proc. Natl. Acad. Sci. USA 1990, 87, 7120–7124. [Google Scholar] [CrossRef] [PubMed]
  5. Hinman, M.B.; Lewis, R.V. Isolation of a clone encoding a second dragline silk fibroin. Nephila clavipes dragline silk is a two-protein fiber. J. Biol. Chem. 1992, 267, 19320–19324. [Google Scholar] [CrossRef]
  6. Chaw, R.C.; Correa-Garhwal, S.M.; Clarke, T.H.; Ayoub, N.A.; Hayashi, C.Y. Proteomic evidence for components of spider silk synthesis from black widow silk glands and fibers. J. Proteome Res. 2015, 14, 4223–4231. [Google Scholar] [CrossRef]
  7. Ayoub, N.A.; Garb, J.E.; Tinghitella, R.M.; Collin, M.A.; Hayashi, C.Y. Blueprint for a high-performance biomaterial: Full-length spider dragline silk genes. PLoS ONE 2007, 2, e514. [Google Scholar] [CrossRef]
  8. Lewis, R.V. Spider silk: Ancient ideas for new biomaterials. Chem. Rev. 2006, 106, 3762–3774. [Google Scholar] [CrossRef]
  9. Beckwitt, R.; Arcidiacono, S. Sequence conservation in the C-terminal region of spider silk proteins (spidroin) from Nephila clavipes (tetragnathidae) and Araneus bicentenarius (araneidae). J. Biol. Chem. 1994, 269, 6661–6663. [Google Scholar] [CrossRef]
  10. Zhu, H.; Rising, A.; Johansson, J.; Zhang, X.; Lin, Y.; Zhang, L.; Yi, T.; Mi, J.; Meng, Q. Tensile properties of synthetic pyriform spider silk fibers depend on the number of repetitive units as well as the presence of N- and C-terminal domains. Int. J. Biol. Macromol. 2020, 154, 765–772. [Google Scholar] [CrossRef] [PubMed]
  11. Chakraborty, R.; Fan, J.S.; Lai, C.C.; Raghuvamsi, P.V.; Chee, P.X.; Anand, G.S.; Yang, D. Structural basis of oligomerization of N-terminal domain of spider aciniform silk protein. Int. J. Mol. Sci. 2020, 21, 4466. [Google Scholar] [CrossRef]
  12. Askarieh, G.; Hedhammar, M.; Nordling, K.; Saenz, A.; Casals, C.; Rising, A.; Johansson, J.; Knight, S.D. Self-assembly of spider silk proteins is controlled by a pH-sensitive relay. Nature 2010, 465, 236–238. [Google Scholar] [CrossRef] [PubMed]
  13. Hagn, F.; Thamm, C.; Scheibel, T.; Kessler, H. pH-dependent dimerization and salt-dependent stabilization of the N-terminal domain of spider dragline silk--implications for fiber formation. Angew. Chem. Int. Ed. Engl. 2011, 50, 310–313. [Google Scholar] [CrossRef] [PubMed]
  14. Kronqvist, N.; Otikovs, M.; Chmyrov, V.; Chen, G.; Andersson, M.; Nordling, K.; Landreh, M.; Sarr, M.; Jornvall, H.; Wennmalm, S.; et al. Sequential pH-driven dimerization and stabilization of the N-terminal domain enables rapid spider silk formation. Nat. Commun. 2014, 5, 3254. [Google Scholar] [CrossRef] [PubMed]
  15. Sponner, A.; Vater, W.; Rommerskirch, W.; Vollrath, F.; Unger, E.; Grosse, F.; Weisshart, K. The conserved C-termini contribute to the properties of spider silk fibroins. Biochem. Biophys. Res. Commun. 2005, 338, 897–902. [Google Scholar] [CrossRef] [PubMed]
  16. Copeland, C.G.; Bell, B.E.; Christensen, C.D.; Lewis, R.V. Development of a process for the spinning of synthetic spider silk. ACS Biomater. Sci. Eng. 2015, 1, 577–584. [Google Scholar] [CrossRef]
  17. Hsia, Y.; Gnesa, E.; Pacheco, R.; Kohler, K.; Jeffery, F.; Vierra, C. Synthetic spider silk production on a laboratory scale. J. Vis. Exp. 2012, 65, e4191. [Google Scholar]
  18. Teule, F.; Cooper, A.R.; Furin, W.A.; Bittencourt, D.; Rech, E.L.; Brooks, A.; Lewis, R.V. A protocol for the production of recombinant spider silk-like proteins for artificial fiber spinning. Nat. Protoc. 2009, 4, 341–355. [Google Scholar] [CrossRef]
  19. Vendrely, C.; Scheibel, T. Biotechnological production of spider-silk proteins enables new applications. Macromol. Biosci. 2007, 7, 401–409. [Google Scholar] [CrossRef]
  20. Heidebrecht, A.; Scheibel, T. Recombinant production of spider silk proteins. Adv. Appl. Microbiol. 2013, 82, 115–153. [Google Scholar]
  21. Fahnestock, S.R.; Bedzyk, L.A. Production of synthetic spider dragline silk protein in Pichia pastoris. Appl. Microbiol. Biotechnol. 1997, 47, 33–39. [Google Scholar] [CrossRef]
  22. Huemmerich, D.; Scheibel, T.; Vollrath, F.; Cohen, S.; Gat, U.; Ittah, S. Novel assembly properties of recombinant spider dragline silk proteins. Curr. Biol. 2004, 14, 2070–2074. [Google Scholar] [CrossRef]
  23. Menassa, R.; Zhu, H.; Karatzas, C.N.; Lazaris, A.; Richman, A.; Brandle, J. Spider dragline silk proteins in transgenic tobacco leaves: Accumulation and field production. Plant Biotechnol. J. 2004, 2, 431–438. [Google Scholar] [CrossRef]
  24. Lazaris, A.; Arcidiacono, S.; Huang, Y.; Zhou, J.F.; Duguay, F.; Chretien, N.; Welsh, E.A.; Soares, J.W.; Karatzas, C.N. Spider silk fibers spun from soluble recombinant silk produced in mammalian cells. Science 2002, 295, 472–476. [Google Scholar] [CrossRef] [PubMed]
  25. Fahnestock, S.R.; Irwin, S.L. Synthetic spider dragline silk proteins and their production in Escherichia coli. Appl. Microbiol. Biotechnol. 1997, 47, 23–32. [Google Scholar] [CrossRef] [PubMed]
  26. Xu, J.; Dong, Q.; Yu, Y.; Niu, B.; Ji, D.; Li, M.; Huang, Y.; Chen, X.; Tan, A. Mass spider silk production through targeted gene replacement in Bombyx mori. Proc. Natl. Acad. Sci. USA 2018, 115, 8757–8762. [Google Scholar] [CrossRef]
  27. Schmuck, B.; Greco, G.; Barth, A.; Pugno, N.; Johansson, J.; Rising, A. High-yield production of a super-soluble miniature spidroin for biomimetic high-performance materials. Mater. Today 2021, 50, 16–23. [Google Scholar] [CrossRef]
  28. Xia, X.X.; Qian, Z.G.; Ki, C.S.; Park, Y.H.; Kaplan, D.L.; Lee, S.Y. Native-sized recombinant spider silk protein produced in metabolically engineered Escherichia coli results in a strong fiber. Proc. Natl. Acad. Sci. USA 2010, 107, 14059–14063. [Google Scholar] [CrossRef]
  29. Hu, X.; Kohler, K.; Falick, A.M.; Moore, A.M.; Jones, P.R.; Sparkman, O.D.; Vierra, C. Egg case protein-1. A new class of silk proteins with fibroin-like properties from the spider Latrodectus hesperus. J. Biol. Chem. 2005, 280, 21220–21230. [Google Scholar] [CrossRef]
  30. Burnand, B.; Kernan, W.N.; Feinstein, A.R. Indexes and boundaries for “quantitative significance” in statistical decisions. J. Clin. Epidemiol. 1990, 43, 1273–1284. [Google Scholar] [CrossRef] [PubMed]
  31. Ping, L.; Zhang, H.; Zhai, L.; Dammer, E.B.; Duong, D.M.; Li, N.; Yan, Z.; Wu, J.; Xu, P. Quantitative proteomics reveals significant changes in cell shape and an energy shift after IPTG induction via an optimized silac approach for Escherichia coli. J. Proteome Res. 2013, 12, 5978–5988. [Google Scholar] [CrossRef]
  32. Wei, Y.; Lee, J.M.; Richmond, C.; Blattner, F.R.; Rafalski, J.A.; LaRossa, R.A. High-density microarray-mediated gene expression profiling of Escherichia coli. J. Bacteriol. 2001, 183, 545–556. [Google Scholar] [CrossRef]
  33. Chevallier, V.; Andersen, M.R.; Malphettes, L. Oxidative stress-alleviating strategies to improve recombinant protein production in Cho cells. Biotechnol. Bioeng. 2020, 117, 1172–1186. [Google Scholar] [CrossRef]
  34. Seaver, L.C.; Imlay, J.A. Alkyl hydroperoxide reductase is the primary scavenger of endogenous hydrogen peroxide in Escherichia coli. J. Bacteriol. 2001, 183, 7173–7181. [Google Scholar] [CrossRef]
  35. Dubbs, J.M.; Mongkolsuk, S. Peroxiredoxins in bacterial antioxidant defense. Subcell. Biochem. 2007, 44, 143–193. [Google Scholar]
  36. Schneider, B.L.; Hernandez, V.J.; Reitzer, L. Putrescine catabolism is a metabolic response to several stresses in Escherichia coli. Mol. Microbiol. 2013, 88, 537–550. [Google Scholar] [CrossRef] [PubMed]
  37. Guo, Y.; Li, Y.; Zhan, W.; Wood, T.K.; Wang, X. Resistance to oxidative stress by inner membrane protein ElaB is regulated by OxyR and RpoS. Microb. Biotechnol. 2019, 12, 392–404. [Google Scholar] [CrossRef]
  38. Connor, A.; Wigham, C.; Bai, Y.; Rai, M.; Nassif, S.; Koffas, M.; Zha, R.H. Novel insights into construct toxicity, strain optimization, and primary sequence design for producing recombinant silk fibroin and elastin-like peptide in E. coli. Metab. Eng. Commun. 2023, 16, e00219. [Google Scholar] [CrossRef] [PubMed]
  39. Goemans, C.V.; Vertommen, D.; Agrebi, R.; Collet, J.F. Cnox is a chaperedoxin: A holdase that protects its substrates from irreversible oxidation. Mol. Cell 2018, 70, 614–627.e7. [Google Scholar] [CrossRef]
  40. Jones, P.G.; Inouye, M. The cold-shock response—A hot topic. Mol. Microbiol. 1994, 11, 811–818. [Google Scholar] [CrossRef] [PubMed]
  41. Yang, Y.-X.; Qian, Z.-G.; Zhong, J.-J.; Xia, X.-X. Hyper-production of large proteins of spider dragline silk masp2 by Escherichia coli via synthetic biology approach. Process Biochem. 2016, 51, 484–490. [Google Scholar] [CrossRef]
  42. Phadtare, S.; Severinov, K. Comparative analysis of changes in gene expression due to RNA melting activities of translation initiation factor IF1 and a cold shock protein of the CspA family. Genes. Cells 2009, 14, 1227–1239. [Google Scholar] [CrossRef]
  43. Clarke, T.H.; Garb, J.E.; Hayashi, C.Y.; Arensburger, P.; Ayoub, N.A. Spider transcriptomes identify ancient large-scale gene duplication event potentially important in silk gland evolution. Genome Biol. Evol. 2015, 7, 1856–1870. [Google Scholar] [CrossRef]
  44. Hernandez, S.B.; Cava, F. Environmental roles of microbial amino acid racemases. Environ. Microbiol. 2016, 18, 1673–1685. [Google Scholar] [CrossRef]
  45. Scior, A.; Preissler, S.; Kochh, M.; Deuerling, E. Directed PCR-free engineering of highly repetitive DNA sequences. BMC Biotechnol. 2011, 11, 87. [Google Scholar] [CrossRef]
Figure 1. Construction of MaSp1 pET24a-NTD-nx-CTD expression plasmids (n = number of internal block repeats). (A) Oligonucleotides used for the creation of the 35 amino acid type I MaSp1 repeat (forward and reverse primers used for annealing and extension), along with engineered restriction sites on the 5′-termini of the oligonucleotides are shown. (B) Single copy of the MaSp1 block repeat. (C) Fusion of the NTD and CTD coding regions separated by an internal BsmBI and BsaI restriction site for the insertion of MaSp1 block repeats; arrow on CTD represents a 6x-his tag.
Ijms 25 03556 g001
Figure 2. Detection of MaSp1 mini-spidroin expression in bacteria. (A) Western blot analysis of crude whole-cell lysates from BL21 DE3 after isopropyl β-D-1-thiogalactopyranoside (IPTG) induction. Lane 1, Thermo Scientific™ PageRuler™ Prestained Protein Ladder in kDa; lane 2, NTD-2x-CTD induced; lane 3, NTD-2x-CTD non-induced; lane 4, NTD-4x-CTD induced; lane 5, NTD-4x-CTD non-induced. Asterisk (*) represents NTD-4x-CTD immunoreactive aggregate complex. (B) nLC-MS/MS analysis of BL21(DE3)pLysS whole-cell lysate after expression of mini-spidroins. MS/MS spectrum of precursor ion mass m/z 4720.28 (M4H+, monoisotopic), whose peptide sequence maps to the MaSp1 block repeat. B- and y-ions represent product ion masses after fragmentation of the precursor ion m/z 4720.28 using HCD. X- and y-axes represent mass-to-charge values and abundance, respectively.
Ijms 25 03556 g002
Figure 3. Quantitative proteomic analysis of bacterial proteome after 2 h of NTD-2x-CTD induction versus non-induced control cells. (A) Venn diagram of the quantitative profile of proteins identified between induced and non-induced conditions. To assess statistical significance, a Fisher’s exact test with a significance level of p = 0.003 and a Benjamini–Hochberg multiple test correction was applied. (B) Volcano plot of the mean quantitative profiles of induced versus non-induced proteins expressed by the NTD-2x-CTD constructs. To assess statistical significance, a Fisher’s exact test with a significance level of p = 0.003 and a Benjamini–Hochberg multiple test correction was applied. Green squares represent statistically significant proteins, whereas grey circles represent statistically insignificant proteins. Green triangles indicate statistically significant outliers (either very high expression levels or small p-values or both), whereas grey triangles depict statistically insignificant outliers. The black dotted vertical line draws the zero-fold change line, whereas the red dotted horizontal line outlines the significance threshold.
Ijms 25 03556 g003
Figure 4. Quantitative shotgun proteomic analysis of bacterial proteome after 2 h of NTD-4x-CTD induction. (A) Venn diagram of the quantitative profile of proteins identified between induced and non-induced conditions. To assess statistical significance, a Fisher’s exact test and a Benjamini–Hochberg multiple test correction was applied. (B) Volcano plot of the mean quantitative profiles of induced versus non-induced proteins. To assess statistical significance, a Fisher’s exact test with a significance level boundary of p = 0.019 and a Benjamini–Hochberg multiple test correction was applied. Green squares represent statistically significant proteins, whereas grey circles represent statistically insignificant proteins. Green triangles depict statistically significant outliers (either very high expression levels or small p-values or both), whereas grey triangles indicate statistically insignificant outliers. The black dotted vertical line draws the zero-fold change line, whereas the red dotted horizontal line outlines the significance threshold.
Ijms 25 03556 g004
Table 1. Amino acid sequences for NTD-nx-CTD (n = 2 and 4) constructs. NTD and CTD are bolded and flank the internal block repeats. Underlined regions denote a tryptic peptide that was unable to be detected using mass spectrometry.
RepeatsAmino Acid Sequence
MQANTPWSSKANADAFINSFISAASNTGSFSQDQMEDMSLIGNTLMAAMDNMGGRITPSKLQALDMAFASSVAEIAASEGGDLGVTTNAIADALTSAFYQTTGVVNSRFISEIRSLIGMFAQASANDVYAAGGAGQGGQGGYGRGGYGQGGAGQGGAGAAAAAAAAGGAGQGGQGGYGRGGYGQGGAGQGGAGAAAAAAAAASGPGQIYYGPQSVAAPAAAAASALSAPATSARISSHASALLSNGPTNPASISNVISNAVSQISSSNPGASACDVLVQALLELVTALLTIIGSSNIGSVNYDSSGQYAQVVTQSVQNAFAHHHHHH
MQANTPWSSKANADAFINSFISAASNTGSFSQDQMEDMSLIGNTLMAAMDNMGGRITPSKLQALDMAFASSVAEIAASEGGDLGVTTNAIADALTSAFYQTTGVVNSRFISEIRSLIGMFAQASANDVYAAGGAGQGGQGGYGRGGYGQGGAGQGGAGAAAAAAAAGGAGQGGQGGYGRGGYGQGGAGQGGAGAAAAAAAAGGAGQGGQGGYGRGGYGQGGAGQGGAGAAAAAAAAGGAGQGGQGGYGRGGYGQGGAGQGGAGAAAAAAAAASGPGQIYYGPQSVAAPAAAAASALSAPATSARISSHASALLSNGPTNPASISNVISNAVSQISSSNPGASACDVLVQALLELVTALLTIIGSSNIGSVNYDSSGQYAQVVTQSVQNAFAHHHHHH
Table 2. List of NTD-2x-CTD statistically significant differentially expressed proteins. Gene names, protein names, and accession numbers (Acc. #) were derived from UniProt. Fold-change ratio (FCR) and outliers (OLR) are also shown. Increased protein levels are represented with a ‘+’ symbol, whereas reduced protein levels are represented by a ‘−’. O.S. = Oxidative stress; asterisks represent components of lac operon and lactose metabolism.
GeneProteinAcc. #FCRp-ValueFunction
lacAGalactoside O-acetyltransferase *P07464+OLR7.89 × 10−19Lactose metabolism
lacZBeta-galactosidase *P00722+OLR +270.331.00 × 10−20Lactose metabolism
N/AMaSp1 NTD-2x-CTDN/A+OLR +12.091.00 × 10−20Target protein
ybglGTP cyclohydrolase 1 type 2 homologP0AFP6+3.571.26 × 10−3O.S. resistance
melAAlpha-galactosidase *P06720+2.303.59 × 10−5Lactose metabolism
pnpPolyribonucleotide nucleotidyltransferaseP05055+1.943.08 × 10−14mRNA degradation
slyDFKBP-type peptidyl-prolyl cis-trans isomerase SlyDP0A9K9+1.522.52 × 10−3Chaperone
ytfQGalactofuranose-binding protein YtfQP39325−1.641.04 × 10−8Sugar transport
gatBPTS system galactitol-specific EIIB componentP37188−1.821.87 × 10−4Sugar transport
pliGInhibitor of g-type lysozymeP76002−3.334.28 × 10−4Inhibitor
mdoGGlucans biosynthesis protein GP33136−4.201.06 × 10−3Cell wall synthesis
galSHTH-type transcriptional regulator GalSP25748−6.501.47 × 10−11Repressor of mgl operon
mglAGal./methyl galactoside import ATP-binding protein *P0AAG8−12.001.53 × 10−3Lactose metabolism
mglBD-galactose-binding periplasmic protein *P0AEE5−OLR1.39 × 10−9Lactose metabolism
Table 3. List of NTD-4x-CTD statistically significant differentially expressed proteins. Gene names, protein names, and accession numbers (Acc. #) were derived from UniProt. Elevated levels are represented with a ‘+’ symbol, whereas diminished levels are represented with a ‘−’ symbol. Asterisks represent components of lac operon and lactose metabolism; FCR = fold-change ratio.
GeneProteinAcc. #p-ValueFCRFunction
lacAGalactoside O-acetyltransferase *P074641.03 × 10−14+OLRLactose metabolism
qorBQuinone oxidoreductase 2P393158.38 × 10−4+OLRElectron transport in respiratory chain
cnoXChaperedoxinP773958.38 × 10−4+OLRProtein deaggregation
dadXAlanine racemase, catabolicP290125.79 × 10−3+OLRIsomerizes L- to D-alanine
yiaFUncharacterized protein YiaFP0ADK01.60 × 10−3+OLRUncharacterized
panB3-methyl-2-oxobutanoate hydroxymethyltransferaseP310571.60 × 10−3+OLRPantothenate biosynthesis
yajGUncharacterized lipoprotein YajGP0ADA55.79 × 10−3+OLRUncharacterized
N/AMaSp1 NT4XCTN/A1.00 × 10−20+OLRTarget protein
lacZBeta-galactosidase*P007221.00 × 10−20+OLRLactose metabolism
yfcZUPF0381 protein YfcZP0AD339.29 × 10−4+14.00Uncharacterized
wzzBChain length determinant proteinP763725.22 × 10−3+11.00Lipopolysaccharide biosynthesis
kdsB3-deoxy-manno-octulosonate cytidylyltransferaseP049519.18 × 10−3+10.00Lipopolysaccharide biosynthesis
efeOIron uptake system component EfeOP0AB249.18 × 10−3+10.00Iron uptake
metQD-methionine-binding lipoprotein MetQP286351.68 × 10−9+9.80Methionine transport system
ydgJUncharacterized oxidoreductase YdgJP773761.60 × 10−2+9.00Uncharacterized
osmCPeroxiredoxin OsmCP0C0L27.66 × 10−4+8.50Hydroperoxide metabolism
cddCytidine deaminaseP0ABF61.18 × 10−4+7.67Pyrimidine salvage pathway
ycdYChaperone protein YcdYP759152.24 × 10−3+7.50Molybdoenzyme chaperone
cyoBCytochrome bo(3) ubiquinol oxidase subunitP0ABI84.95 × 10−7+6.83Terminal enzyme in respiratory chain
speBAgmatinaseP606518.45 × 10−6+6.60Putrescine biosynthesis
ushAProtein UshAP070242.42 × 10−4+6.00Nucleotidase
yicCUPF0701 protein YicCP238393.99 × 10−4+5.75sRNA degradation
ybglGTP cyclohydrolase 1 type 2 homologP0AFP62.71 × 10−5+5.50Oxidative stress resistance
yfcEPhosphodiesterase YfcEP670951.68 × 10−4+5.40Phosphodiesterase
nagAN-acetylglucosamine-6-phosphate deacetylaseP0AF184.38 × 10−4+5.00Peptidoglycan synthesis
acrBMultidrug efflux pump subunit AcrBP312246.89 × 10−3+5.00Transporter
gprL-glyceraldehyde 3-phosphate reductaseQ468514.80 × 10−5+4.86Oxidoreductase activity
btsTPyruvate/proton symporter BtsTP393964.80 × 10−5+4.86Pyruvate transport
iscXProtein IscXP0C0L92.75 × 10−3+4.75Iron–sulfur cluster assembly
gorGlutathione reductaseP067151.76 × 10−3+4.00Oxidative stress prevention
fmtMethionyl-tRNA formyltransferaseP238828.04 × 10−5+3.90Initiation of protein synthesis
gnsAProtein GnsAP0AC921.92 × 10−4+3.89Membrane lipid synthesis
maeANAD-dependent malic enzymeP266166.69 × 10−3+3.80Oxidation–reduction
eptAPhosphoethanolamine transferase EptAP308451.03 × 10−2+3.60Membrane synthesis
grcAAutonomous glycyl radical cofactorP680666.75 × 10−4+3.56Glucose fermentation
zntAZinc/cadmium/lead-transporting P-type ATPaseP376171.56 × 10−2+3.40Metal ion transporter
melAAlpha-galactosidase *P067201.67 × 10−7+3.37Lactose metabolism
mtlDMannitol-1-phosphate 5-dehydrogenaseP094245.98 × 10−4+3.27Oxidoreductase
iscAIron-binding protein IscAP0AAC85.55 × 10−4+3.17Iron-binding protein
rihCNon-specific ribonucleoside hydrolase RihCP225641.42 × 10−2+3.17Ribonucleoside cleavage
yhhXUncharacterized oxidoreductase YhhXP468538.68 × 10−3+3.14Uncharacterized
gpml2,3-bisphosphoglycerate-independent phosphoglycerate mutaseP376891.55 × 10−7+3.03Glycolysis
lppMajor outer membrane lipoprotein LppP697769.98 × 10−8+3.03Outer membrane lipoprotein
yfcDUncharacterized Nudix hydrolase YfcDP655561.28 × 10−2+3.03Uncharacterized
cspACold shock protein CspAP0A9X91.19 × 10−4+3.00RNA chaperone
carACarbamoyl-phosphate synthase small chainP0A6F11.87 × 10−4+3.00Arginine and pyrimidine biosynthesis
dcrBInner membrane lipoprotein DcrBP0AEE17.85 × 10−3+3.00Membrane fluidity and homeostasis
hslO33 kDa chaperoninP0A6Y51.89 × 10−3+3.00Oxidative stress chaperone
trxCThioredoxin 2P0AGG41.28 × 10−2+3.00Oxidative stress response
malMMaltose operon periplasmic proteinP038411.89 × 10−3+3.00Maltose transport
spyPeriplasmic chaperone SpyP777541.45 × 10−2−3.25Chaperone
galSHTH-type transcriptional regulator GalSP257481.62 × 10−7−3.60Repression of mgl operon
dnaXDNA polymerase III subunit tauP067106.16 × 10−3−4.33DNA replication
ppkPolyphosphate kinaseP0A7B11.25 × 10−2−5.00Polyphosphate synthesis
mglAGalactose/methyl galactoside import ATP-binding protein MglA *P0AAG86.91 × 10−3−5.50Galactose import
pliGInhibitor of g-type lysozymeP760022.98 × 10−6−6.00Inhibits g-type lysozyme
hrpAATP-dependent RNA helicase HrpAP433299.59 × 10−4−12.00RNA helicase
mglBD-galactose-binding periplasmic protein *P0AEE52.11 × 10−11−OLRLactose metabolism
rnpARibonuclease P protein componentP0A7Y85.44 × 10−3−OLRtRNA processing
mntRTranscriptional regulator MntRP0A9F15.44 × 10−3−OLRManganese transport regulation
Disclaimer/Publisher’s Note: The statements, opinions and data contained in all publications are solely those of the individual author(s) and contributor(s) and not of MDPI and/or the editor(s). MDPI and/or the editor(s) disclaim responsibility for any injury to people or property resulting from any ideas, methods, instructions or products referred to in the content.

