Article

Co-Expression Network Analysis Unveiled lncRNA-mRNA Links Correlated to Epidermal Growth Factor Receptor-Tyrosine Kinase Inhibitor Resistance and/or Intermediate Epithelial-to-Mesenchymal Transition Phenotypes in a Human Non-Small Cell Lung Cancer Cellular Model System

by
Valentina Fustaino
*,
Giuliana Papoff
,
Francesca Ruberti
and
Giovina Ruberti
*,†
Institute of Biochemistry and Cell Biology, National Research Council (IBBC-CNR), Campus Adriano Buzzati Traverso, Via E. Ramarini 32, 00015 Monterotondo (Roma), Italy
*
Authors to whom correspondence should be addressed.
These authors contributed equally to this work.
Int. J. Mol. Sci. 2024, 25(7), 3863; https://doi.org/10.3390/ijms25073863
Submission received: 13 February 2024 / Revised: 24 March 2024 / Accepted: 25 March 2024 / Published: 29 March 2024
(This article belongs to the Special Issue Cellular Plasticity, Epithelial-Mesenchymal Transition and Metastasis)

Abstract

:
We investigated mRNA-lncRNA co-expression patterns in a cellular model system of non-small cell lung cancer (NSCLC) sensitive and resistant to the epithelial growth factor receptor (EGFR) tyrosine kinase inhibitors (TKIs) erlotinib/gefitinib. The aim of this study was to unveil insights into the complex mechanisms of NSCLC targeted therapy resistance and epithelial-to-mesenchymal transition (EMT). Genome-wide RNA expression was quantified for weighted gene co-expression network analysis (WGCNA) to correlate the expression levels of mRNAs and lncRNAs. Functional enrichment analysis and identification of lncRNAs were conducted on modules associated with the EGFR-TKI response and/or intermediate EMT phenotypes. We constructed lncRNA-mRNA co-expression networks and identified key modules and their enriched biological functions. Processes enriched in the selected modules included RHO (A, B, C) GTPase and regulatory signaling pathways, apoptosis, inflammatory and interleukin signaling pathways, cell adhesion, cell migration, cell and extracellular matrix organization, metabolism, and lipid metabolism. Interestingly, several lncRNAs, already shown to be dysregulated in cancer, are connected to a small number of mRNAs, and several lncRNAs are interlinked with each other in the co-expression network.

1. Introduction

Lung cancer is a leading cause of cancer-related deaths worldwide, with extremely high morbidity and mortality rates. NSCLC is the most common type of lung cancer, and it represents 85% of all cases [1,2].
Increasing evidence highlights the important role of non-coding RNA (ncRNA) in regulating the tumorigenesis process by modulating crucial signaling pathways, gene expression of proto-oncogenes or tumor suppressors. Non-coding sequences covering 98% of the human genome are divided into different classes based on their length, localization, and/or function. MicroRNA (miRNA), long non-coding RNA (lncRNA), and circular RNA (circRNA) are either up- or downregulated in cancer types and can promote or suppress the progression of the disease. LncRNAs, arbitrarily defined as non-coding transcripts of more than 200 nucleotides (200 nt) according to the recent classification and nomenclature, are RNA mostly generated by RNA Polymerase II [3]. LncRNAs can be grouped according to their position relative to the protein-coding genes. As a result, they can be roughly divided into antisense, enhancer, bidirectional (divergent), intronic transcript lncRNAs, and large intergenic non-coding RNAs. LncRNAs may regulate gene expression via multiple mechanisms at the epigenetic, transcriptional, and post-transcriptional levels [4]. LncRNAs have been shown to participate in the regulation of a variety of cell activities through interaction with other RNAs, DNAs, or proteins, including cell differentiation, proliferation, invasion, apoptosis, and autophagy. Cooperation among lncRNAs can further amplify the role of lncRNAs in physiological and pathological processes [5,6,7]. Transcriptional dysregulation of lncRNAs has been correlated to cancer growth, metastasis, and drug resistance in NSCLC [8,9,10,11,12,13,14,15]. TKIs targeting EGFR are the primary treatment for NSCLC harboring activating mutations in the EGFR TK domain; unfortunately, resistance to EGFR-TKIs is unavoidable, and most of the patients experience a rapid cancer relapse [16,17,18].
The association between EMT plasticity and drug resistance is very well documented by many in silico, in vitro, and in vivo studies [19,20]. The EMT is a cellular process in which polarized epithelial cells undergo multiple molecular and biochemical changes and lose their identity to acquire a mesenchymal phenotype. Importantly, EMT is a complex, dynamic, and multifaceted process characterized by a spectrum of intermediate phenotypes whose molecular hallmarks remain poorly characterized and cells can be stably arrested in an intermediate, or hybrid, state, contributing to cancer collective cell migration, and cell cluster formation and dissemination, associated with enhanced tumor aggressiveness and worse clinical outcomes [21,22]. Intermediate epithelial/mesenchymal phenotypes have also been described in lung, breast, prostate, ovarian, pancreatic, and many other cancer types by our research group [23,24,25,26,27,28,29,30]. The intrinsic complexity of the process of EMT transformation in cancer epithelial cells and the influence of genomic and microenvironmental elements in its shaping are emerging from bioinformatics and mathematical modeling studies [31,32].
NcRNAs regulate the EMT at multiple levels, including gene regulation of transcription factors, cell adhesion, cytoskeleton organization, and cell motility signaling pathways. The impact of ncRNAs, including lncRNA, is still far from being fully understood. Although lncRNAs are usually described as EMT promoters or EMT-suppressors, some of them have controversial functions in different types of tumors or different conditions, underlying the complexity and plasticity of tumor cells [33,34]. Furthermore, the contribution of lncRNAs to intermediate EMT phenotypes is still unknown.
Many studies consider only differences in the expression of genes between different samples, ignoring the underlying connection of each gene. Weighted gene co-expression network analysis (WGCNA) is a systematic bioinformatics method used to describe correlation patterns among genes in samples and can identify clusters of highly correlated genes (hereafter modules). This approach also explores the relationship between modules and phenotypes of interest [35].
In this study, we performed a WGNA on a microarray gene expression dataset (GSE80344) publicly available at the NCBI’s Gene Expression Omnibus (GEO) database and previously reported by us [30]. The dataset was obtained from eight human NSCLC cancer cell lines: two EGFR-TKI (erlotinib, gefitinib)-sensitive cell lines and six derived EGFR-TKI-resistant cell lines. We aimed to identify lncRNA–mRNA sub-networks associated with resistance to EGFR-TKIs and/or intermediate EMT phenotypes. Our analysis led to the selection of three modules highly correlated with coding genes involved in key biological pathways and processes, including Rho (A, B, C) GTPase and/or Rho GTPase regulation, apoptosis, positive regulation of I-kappaB kinase/NF-kappaB signaling, NLRP3 inflammasome complex assembly, cell adhesion, cell migration, cell–extracellular matrix interactions, metabolism, lipid metabolism, interleukin (4, 12, and 13), phosphatidylinositol, and RAS signaling pathways, and signaling pathways associated with cancer. Interestingly, several lncRNAs are highly connected to genes belonging to these pathways. This analysis may offer novel insights into the functional study of unknown lncRNAs correlated to EGFR-TKI resistance and intermediate EMT phenotypes to reach a better understanding of the molecular pathways contributing to these phenotypes.

2. Results

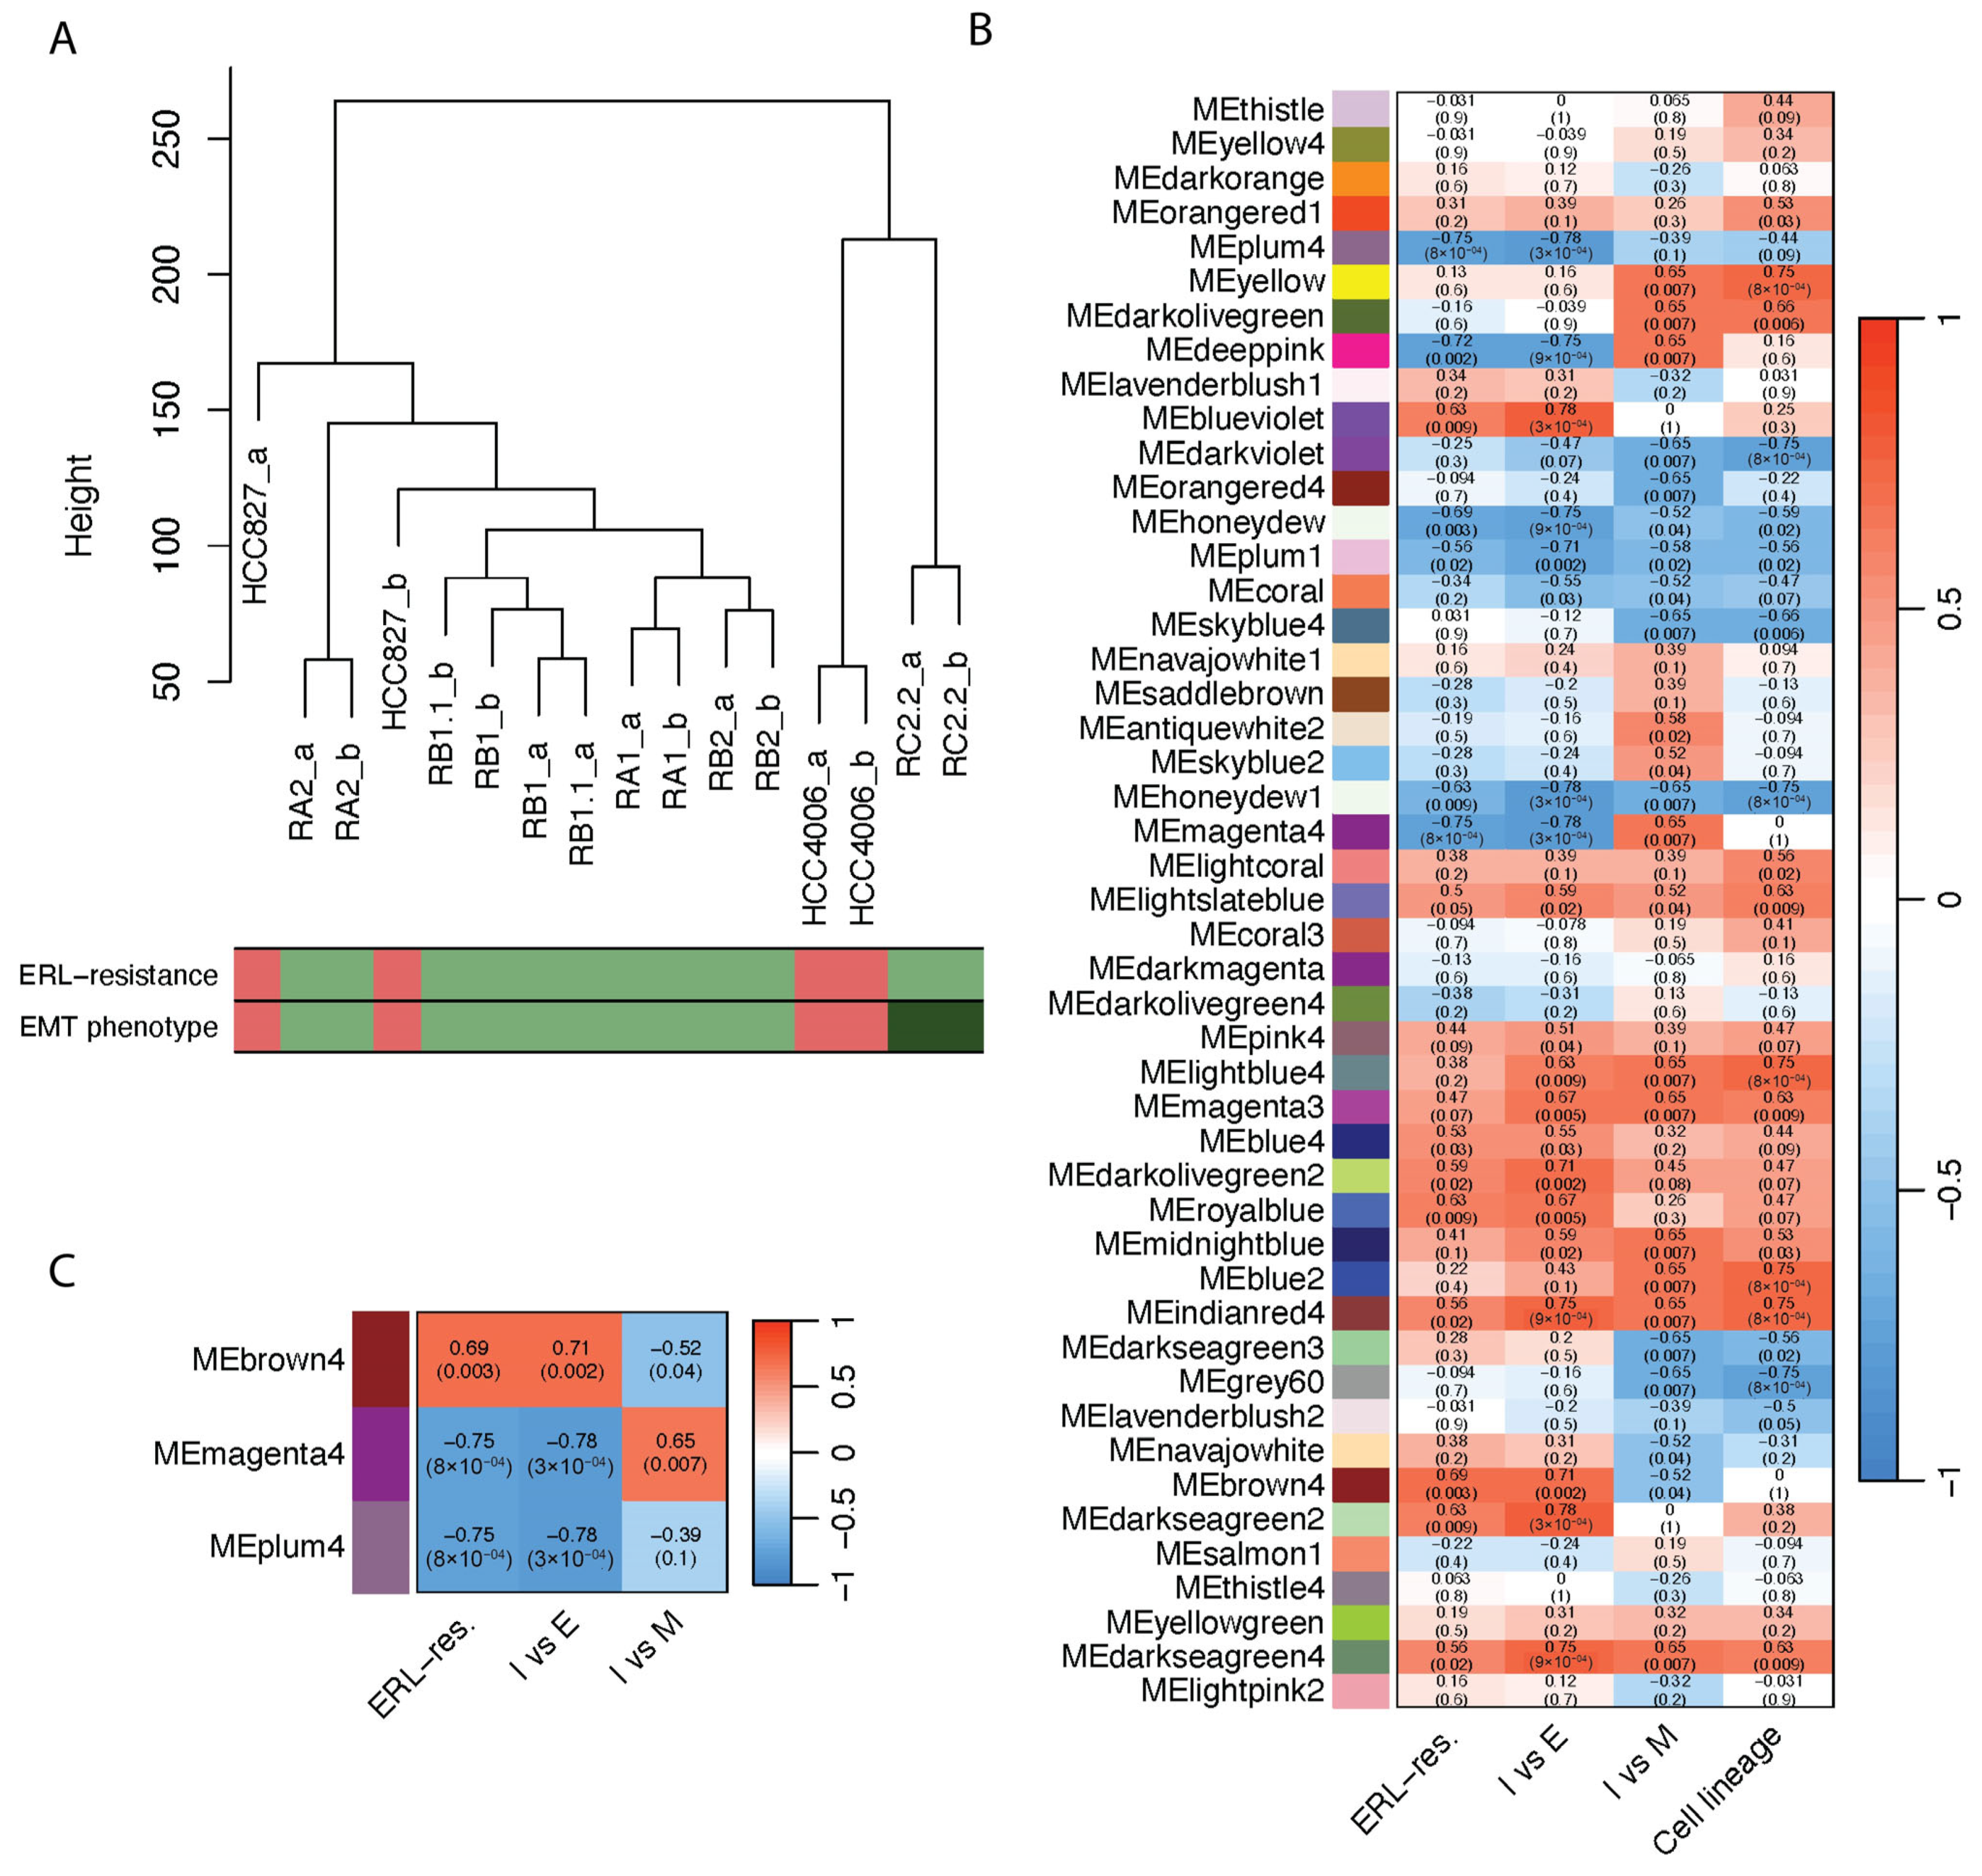
2.1. Construction of a Weighted Gene Co-Expression Network

A weighted co-expression network of the transcriptome of our NSCLC cellular model system was built with the objective of defining modules related to phenotypes of interest and, among those, selecting the most relevant lncRNAs. An unsigned WGCNA was performed in R complying with the pipeline defined by Peter Langfelder and Steve Horvath to identify genes both positively and negatively correlated with the phenotype traits (Figure 1A) [35]. Briefly, we used the Pearson correlation to calculate the co-expression of probes and a power adjacency function to build the network by determining a soft threshold β = 7, based on the criterion of approximate scale-free topology (Figure 1B). Using the Dynamic Tree Cut and Merged Dynamic algorithms, the gene probes were grouped into modules according to their topological overlap matrix (TOM) scores (Figure 1C; see Methods for details). The assignment of probes to each module, as well as their connectivity measures and module memberships, are reported in Table S1.
At the end of this step, we had a WGCNA network of the transcriptome of the NSCLC cell lines, where each connection was weighted, and this weight allowed the subdivision of the network into 47 modules of highly correlated genes.

2.2. Definition of Module–Trait Relationships and Detection of Key Modules

The modules identified by WGCNA were then correlated with the phenotypic traits of interest: EGFR-TKI resistance (ERL-res) and intermediate EMT phenotypes (Figure 2). For the definition of the intermediate EMT phenotypes, we used two comparisons: “I vs. E”, to select modules with gene expression differences between cell lines with intermediate EMT phenotypes (I) and epithelial cell lines (E); and “I vs. M”, to select modules with gene expression differences between cell lines with intermediate EMT phenotypes and mesenchymal cell lines (M). We used a binary code for all phenotypic traits as suggested by the WGCNA package manual [35] (Table S2). To identify genes associated with both intermediate EMT phenotypes and EGFR-TKI resistance, we focused our attention on modules with: (a) high significant correlation with ERL-res and “I vs. E” traits (|ρs| > 0.65, p-value < 0.05); (b) significant correlation with the “I vs. M” trait (p-value < 0.05). From these analyses, we identified modules positively or negatively correlated to the phenotypic traits, although upregulated or downregulated genes are both present in each module (Table S1).
To avoid biased results dictated by the difference in cellular origins of the NSCLC model system, we discarded from the selection all the modules (n = 19) that had a significant correlation with the cell lineage trait.
Based on this rationale, we selected three modules: brown4 (Table S3), deeppink (Table S4), and magenta4 (Table S5). We also selected the module plum4 (Table S6) because of its high and significant correlation with ERL-resistance (ρs = 0.75, p-value < 0.05) and its enrichment in probes specific for lncRNAs. Next, to verify that connectivity and memberships had good correlations with our phenotypic trait of interest, we performed a correlation analysis using the absolute values of module membership and gene significance as well as gene significance and intramodular connectivity of probes (Figure S1). Data regarding positive and negative membership and the gene significance of the individual members of modules are listed in Tables S1 and S3–S6. While brown4, magenta4, and plum4 modules resulted in good significant correlations between gene significance and module membership and/or connectivity (ρs > 0.3, p-value < 0.05), the deeppink module showed unacceptable parameters; therefore, it was not further investigated (Figure S1).
To summarize, among the 47 modules individuated by the WGCNA, we selected 3 modules: brown4, magenta4, and plum4. They have a high significant global correlation with ERL-resistance and/or intermediate EMT phenotypes; and good significant correlations between the gene significance of these phenotypic traits and the centrality measures of module members (Figure 2C).

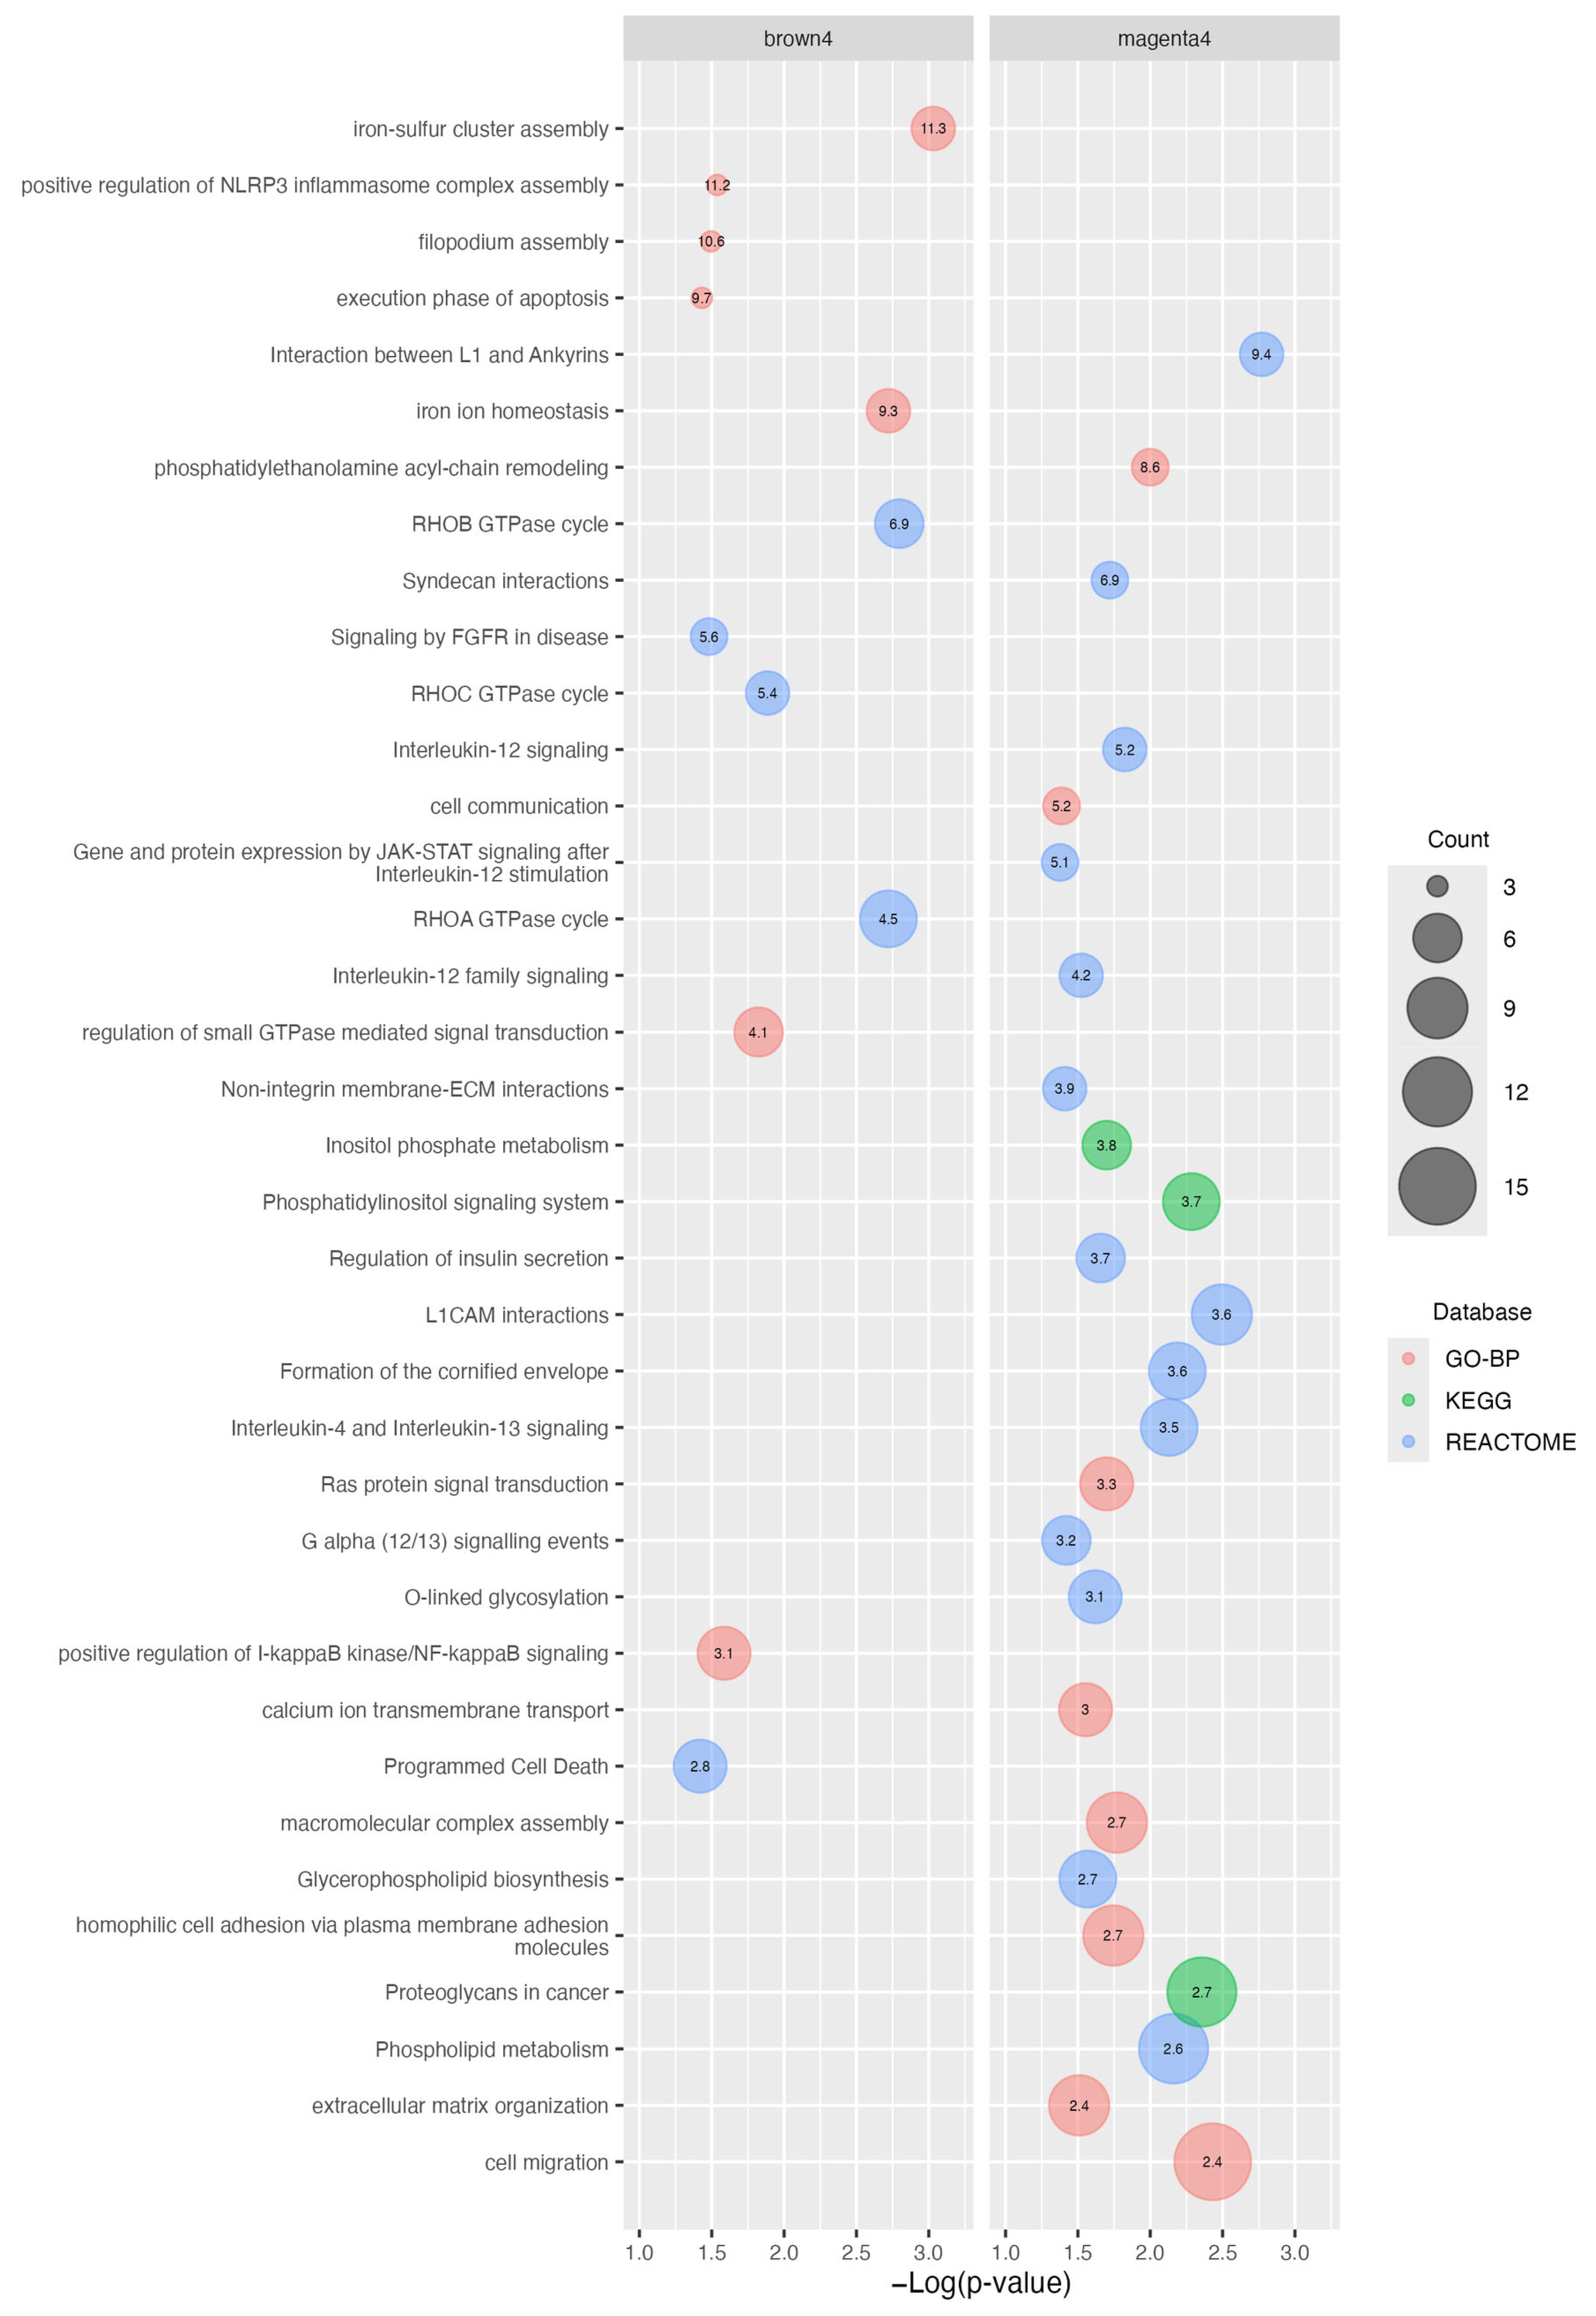
2.3. Functional Enrichment Analysis of the Brown4 and Magenta4 Modules

We then investigated the biological pathways affecting protein coding genes in the brown4 and magenta4 modules. We performed a functional enrichment analysis using the biological processes and pathway terms of the DAVID database. The results of the top enriched pathways (fold-enrichment > 2) are presented in Figure 3, while all significant enriched terms are reported in Tables S7 and S8. In the brown4 module, the genes were mainly enriched in seven Gene Ontology biological processes (GO-BP) and in five Reactome pathways, including Rho GTPases, Rho GTPase regulation, apoptosis, positive regulation of I-kappaB kinase/NF-kappaB signaling and positive regulation of NLRP3 inflammasome complex assembly, iron ion homeostasis, or iron–sulfur cluster (Figure 3).
Magenta4 shows enrichment in several pathways: 3 KEGG, 8 GO-BP, and 14 Reactome pathways. Remarkably, a good portion of enriched pathways belong to cell adhesion, cell migration, cell–extracellular matrix interactions, metabolism, and/or lipid and phospholipid metabolism terms, interleukin signaling pathways, particularly 4, 12, and 13, Phosphatidylinositol, and RAS pathways (Figure 3).
It was not possible to obtain an accurate functional enrichment analysis in plum4, as it has a small size and a high portion of lncRNAs. Despite this, it shows a slight enrichment in the negative regulation of transport GO-BP term (Table S9).
Taken together, the functional enrichment analysis identified about 37 key biological processes and signaling pathways that could be involved in ERL-resistance and/or intermediate EMT-phenotypes. Among these, terms regarding Rho GTPase signaling, apoptosis, cell migration, lipid metabolism and cancer-related signaling pathways, seem to be recurrent between and within the consulted databases.

2.4. Selection of the Most Relevant LncRNAs

To identify the lncRNAs with the best correlation in the module network, as well as the phenotypic traits of interest, we selected the lncRNAs with high significative scoring of module membership (|MM| > 0.7, p-value < 0.05) and gene significance (|GS| > 0.7, p-value < 0.05). A summary of the best lncRNAs of the brown4, magenta4, and plum4 modules, ranked according to their intramodular connectivity (Ki), is listed in Table 1 and Table 2. Within each module, several biotypes were found, including long intergenic non-coding RNA (lincRNA), miRNA host genes, divergent lncRNAs, and antisense lncRNAs. A relevant number of lncRNAs were present in the modules: brown4—20 lncRNAs (23 probes mapping to 20 genes); magenta4—26 lncRNAs (29 probes mapping to 26 genes); and plum4—8 lncRNAs (9 probes mapping to 8 genes) (Table 1, Table 2, and Table S10).

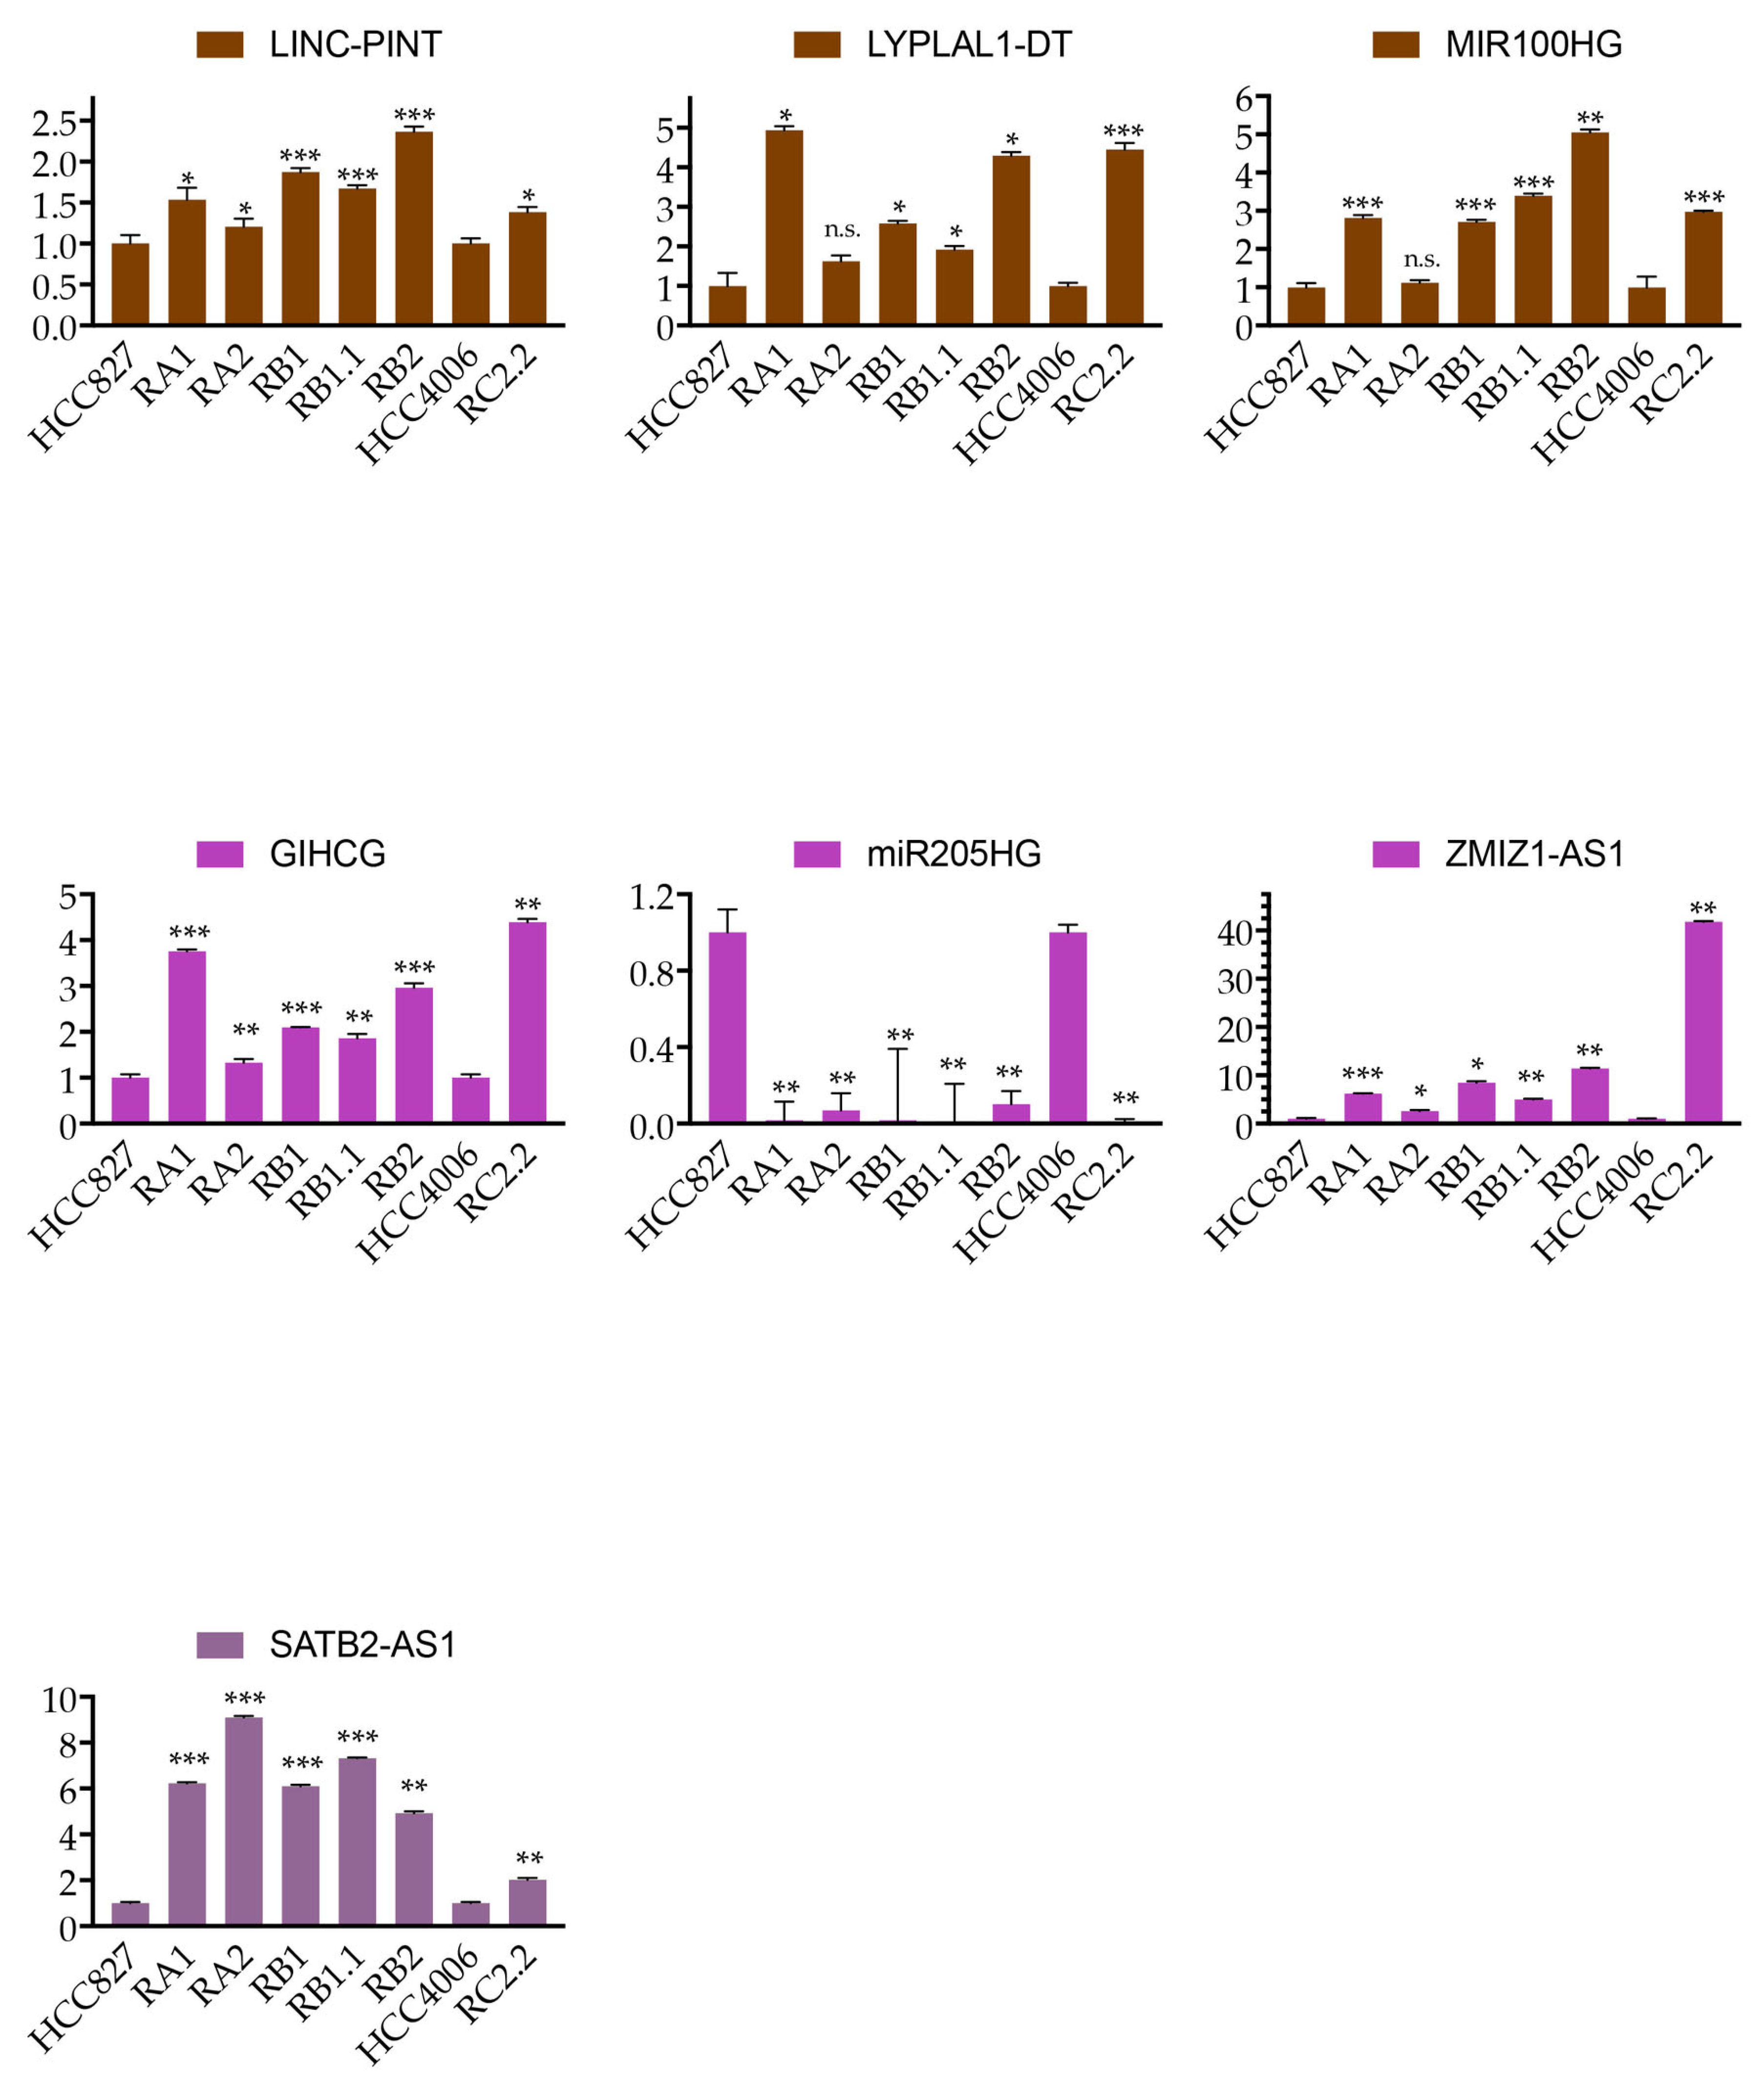
2.5. Expression Validation of Selected LncRNAs

The expression of some lncRNAs, differentially expressed in the erlotinib-sensitive and -resistant NSCLC cell lines in the microarray data and belonging to the three selected WGCNA modules, was validated by RT-qPCR. RNA expression was analyzed after verification of sensitivity to erlotinib, as described in the Material and Methods section, by MTT viability assays. As previously described, both HCC827 and HCC4006 cell lines are highly sensitive to erlotinib targeting the EGFR, while their derived cell lines (i.e., RA1, RA2, RB1, RB1.1, and RB2 derived from HCC827 and RC2.2 derived from HCC4006) are stably resistant to erlotinib (IC50 > 10 μM).
LINC-PINT, LYPLAL1-DT, and MIR100HG of the brown4 module; GIHCG, ZMIZ1-AS1 of the magenta4 module; and SATB2-AS1 of the plum4 module are all upregulated in the erlotinib-resistant cell lines, while MIR205HG of the magenta4 module is downregulated (Figure 4). These data agree with the microarray expression profile previously reported [30]. The direction of the correlation of lncRNAs with the phenotypic traits of interest, as well as the direction of their correlation with modules, are listed in Table S10.

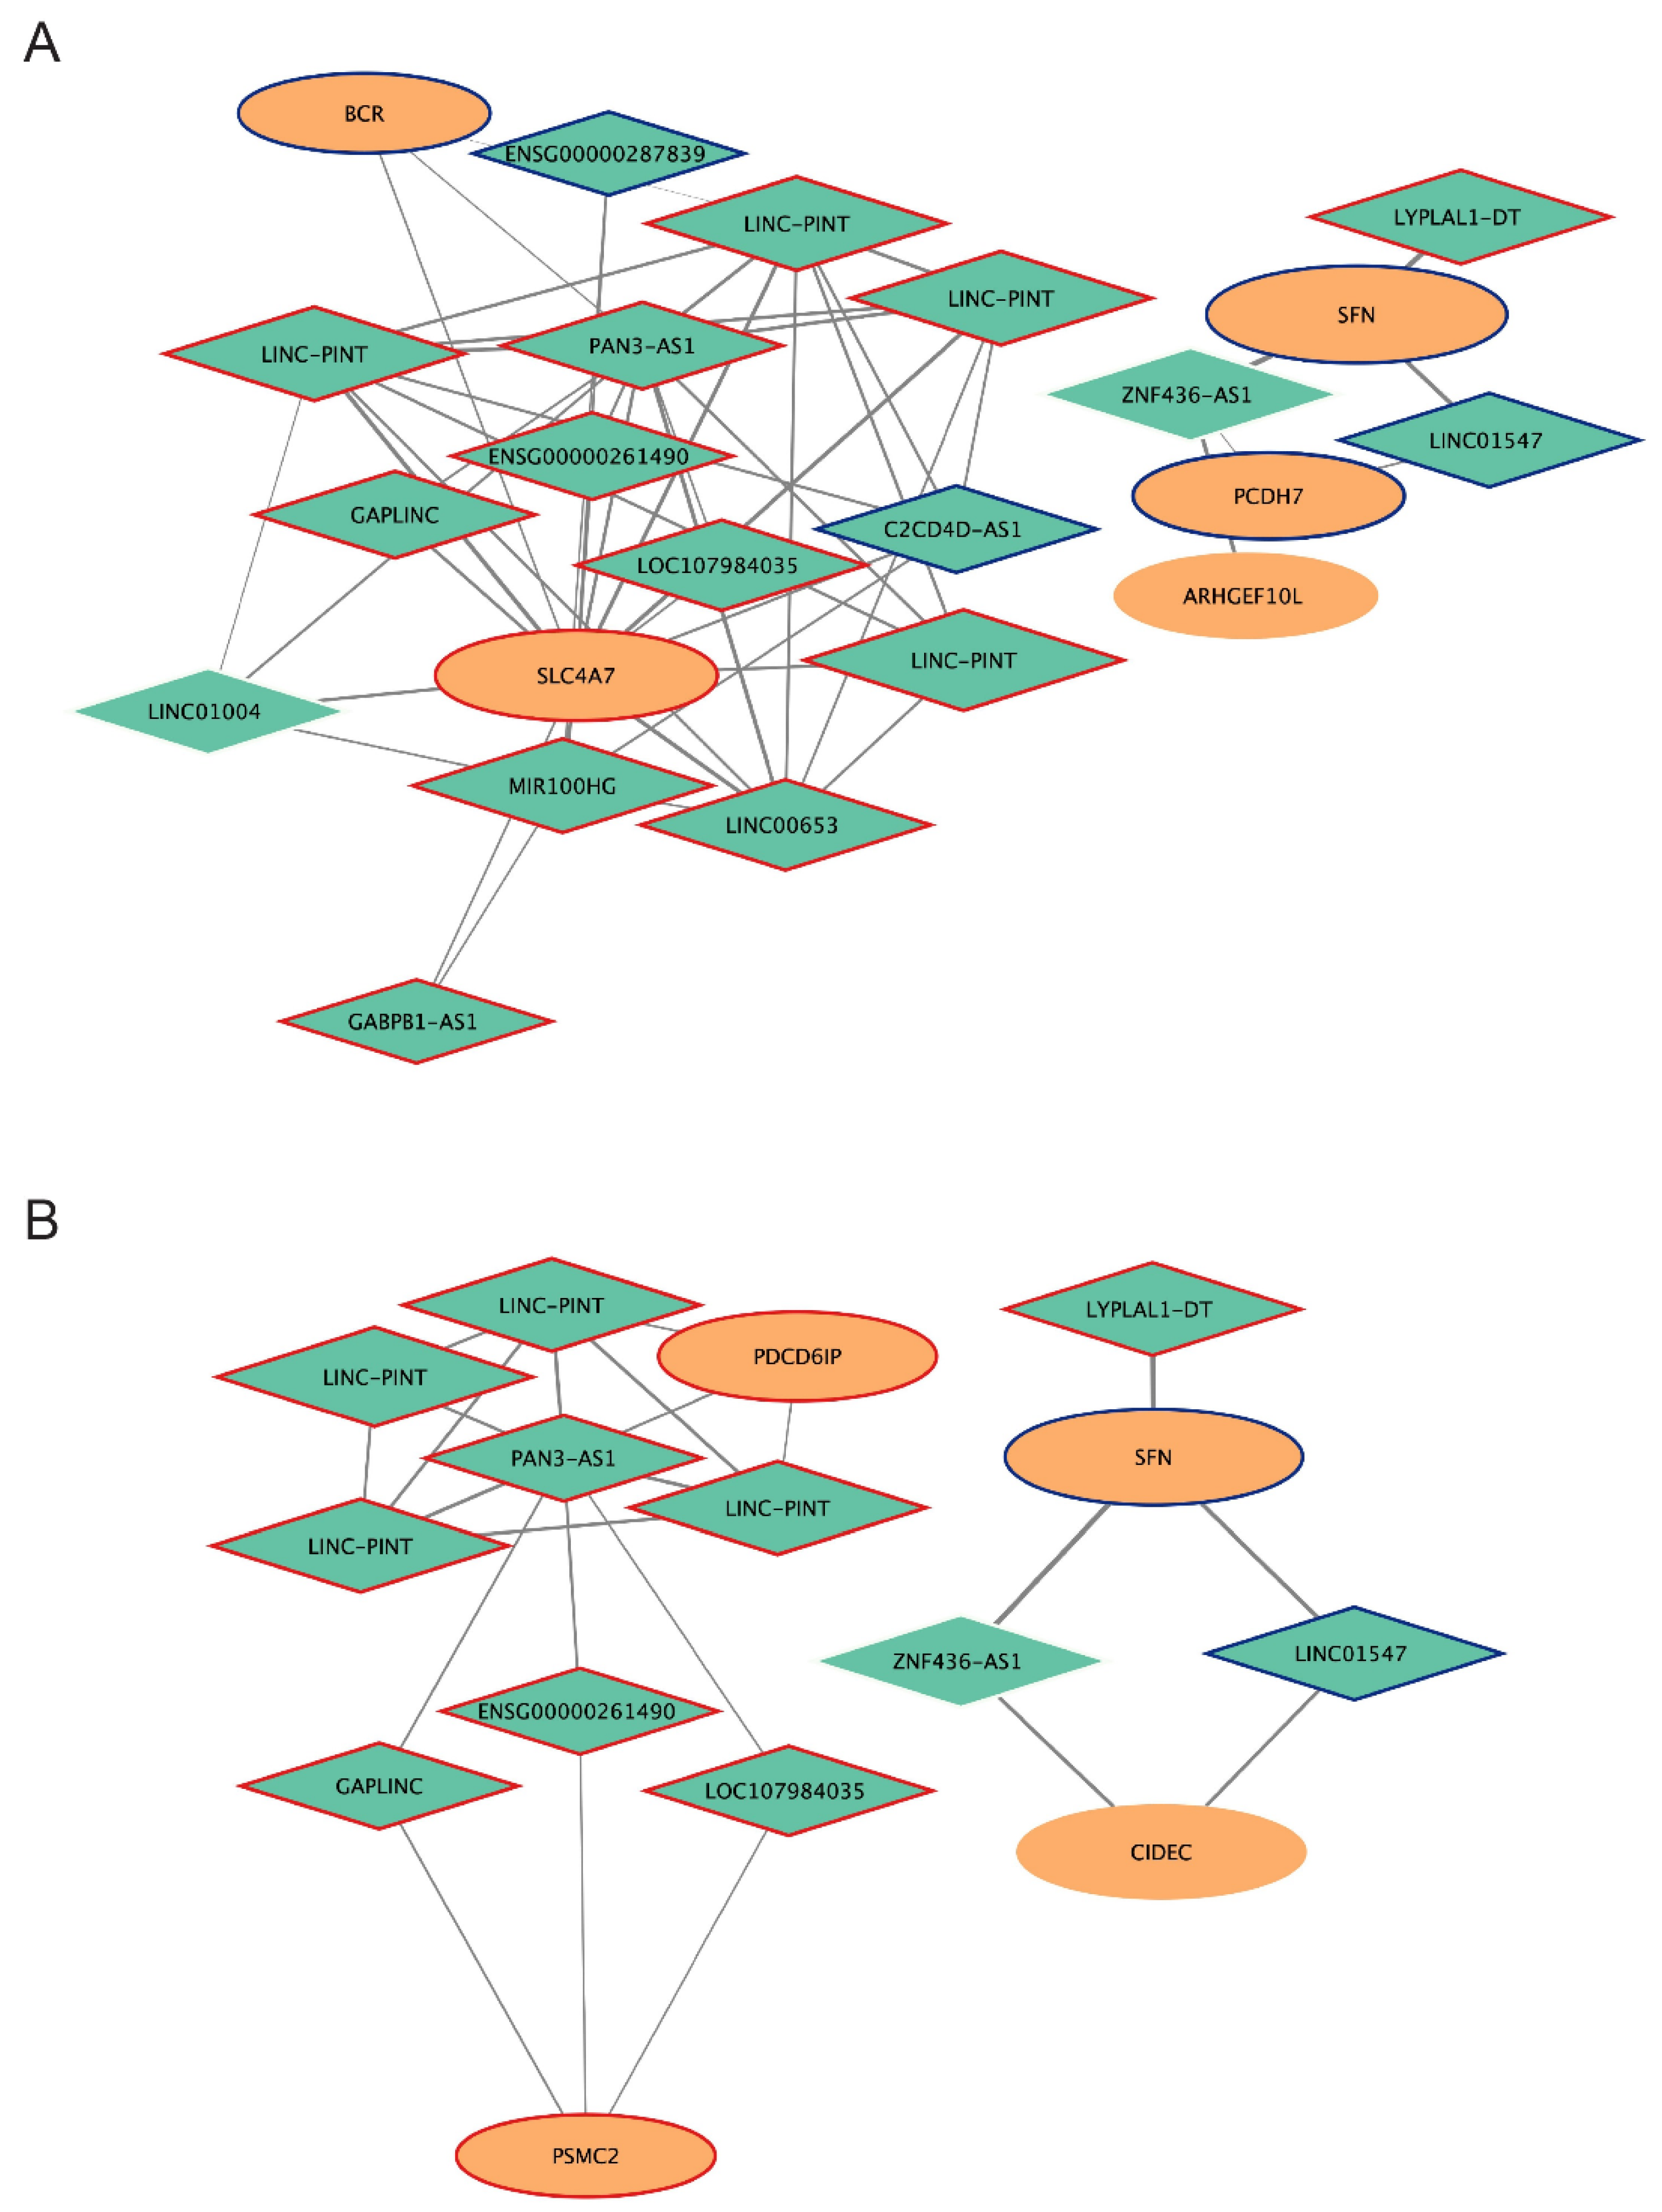
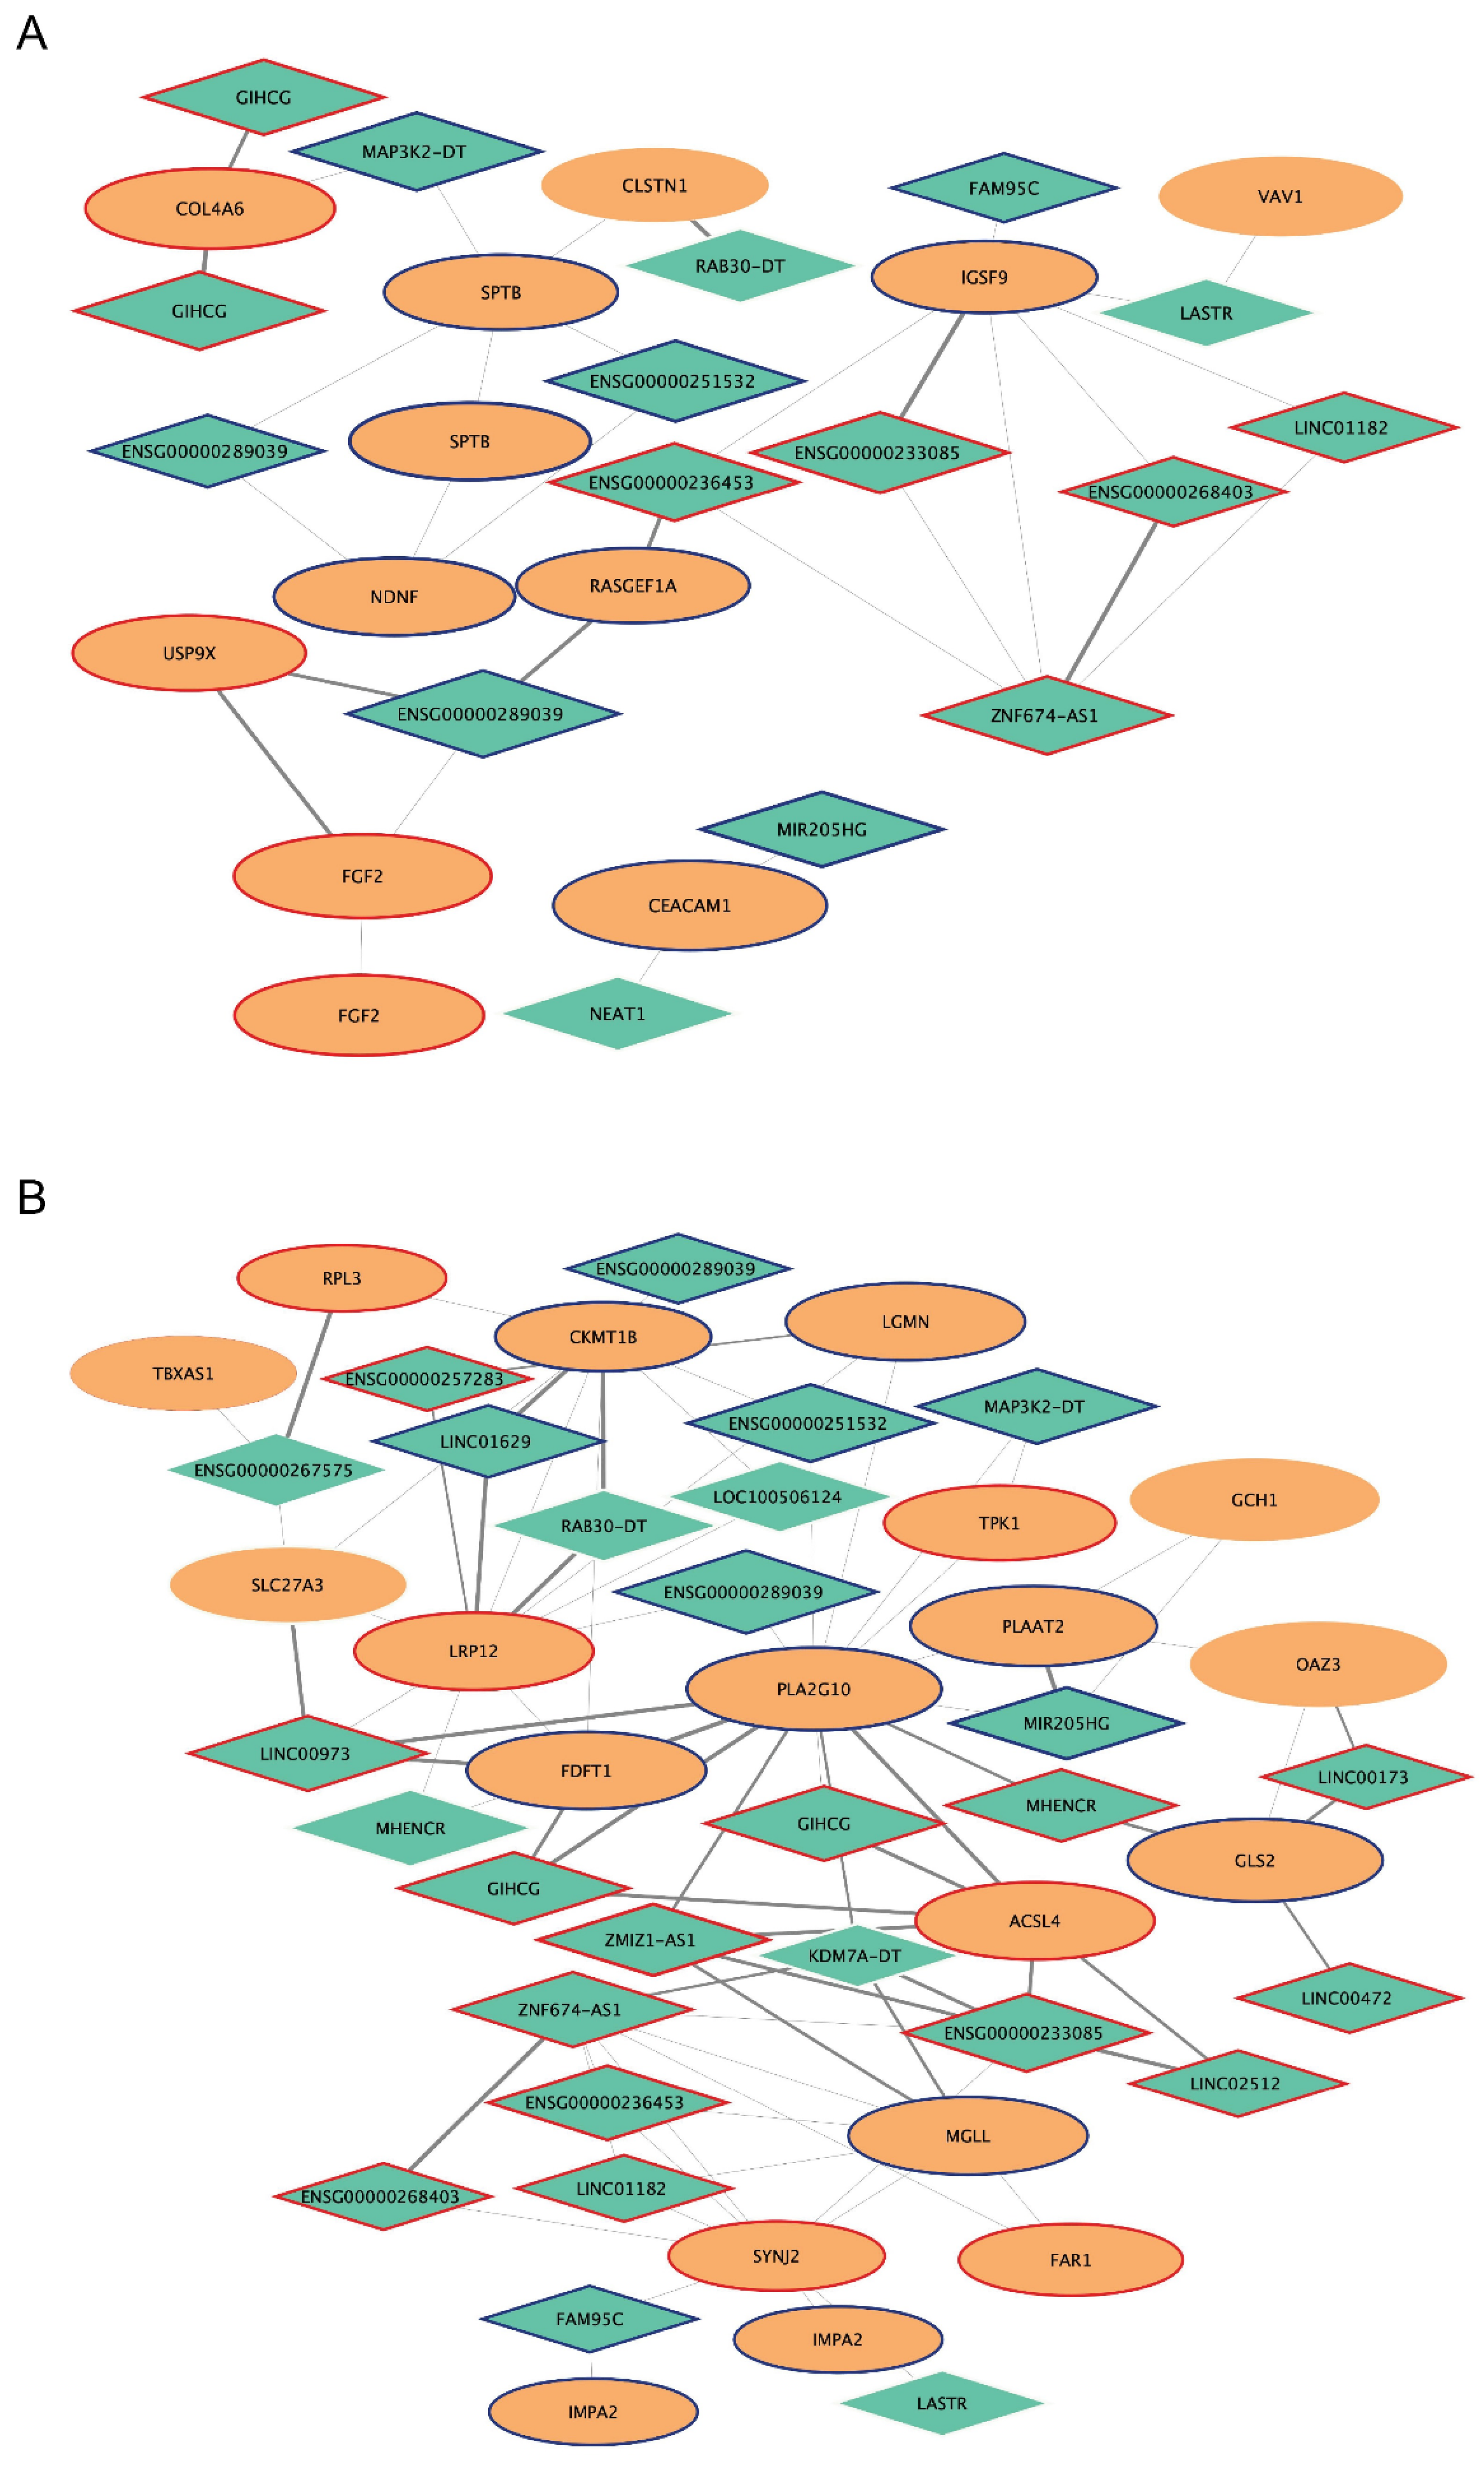
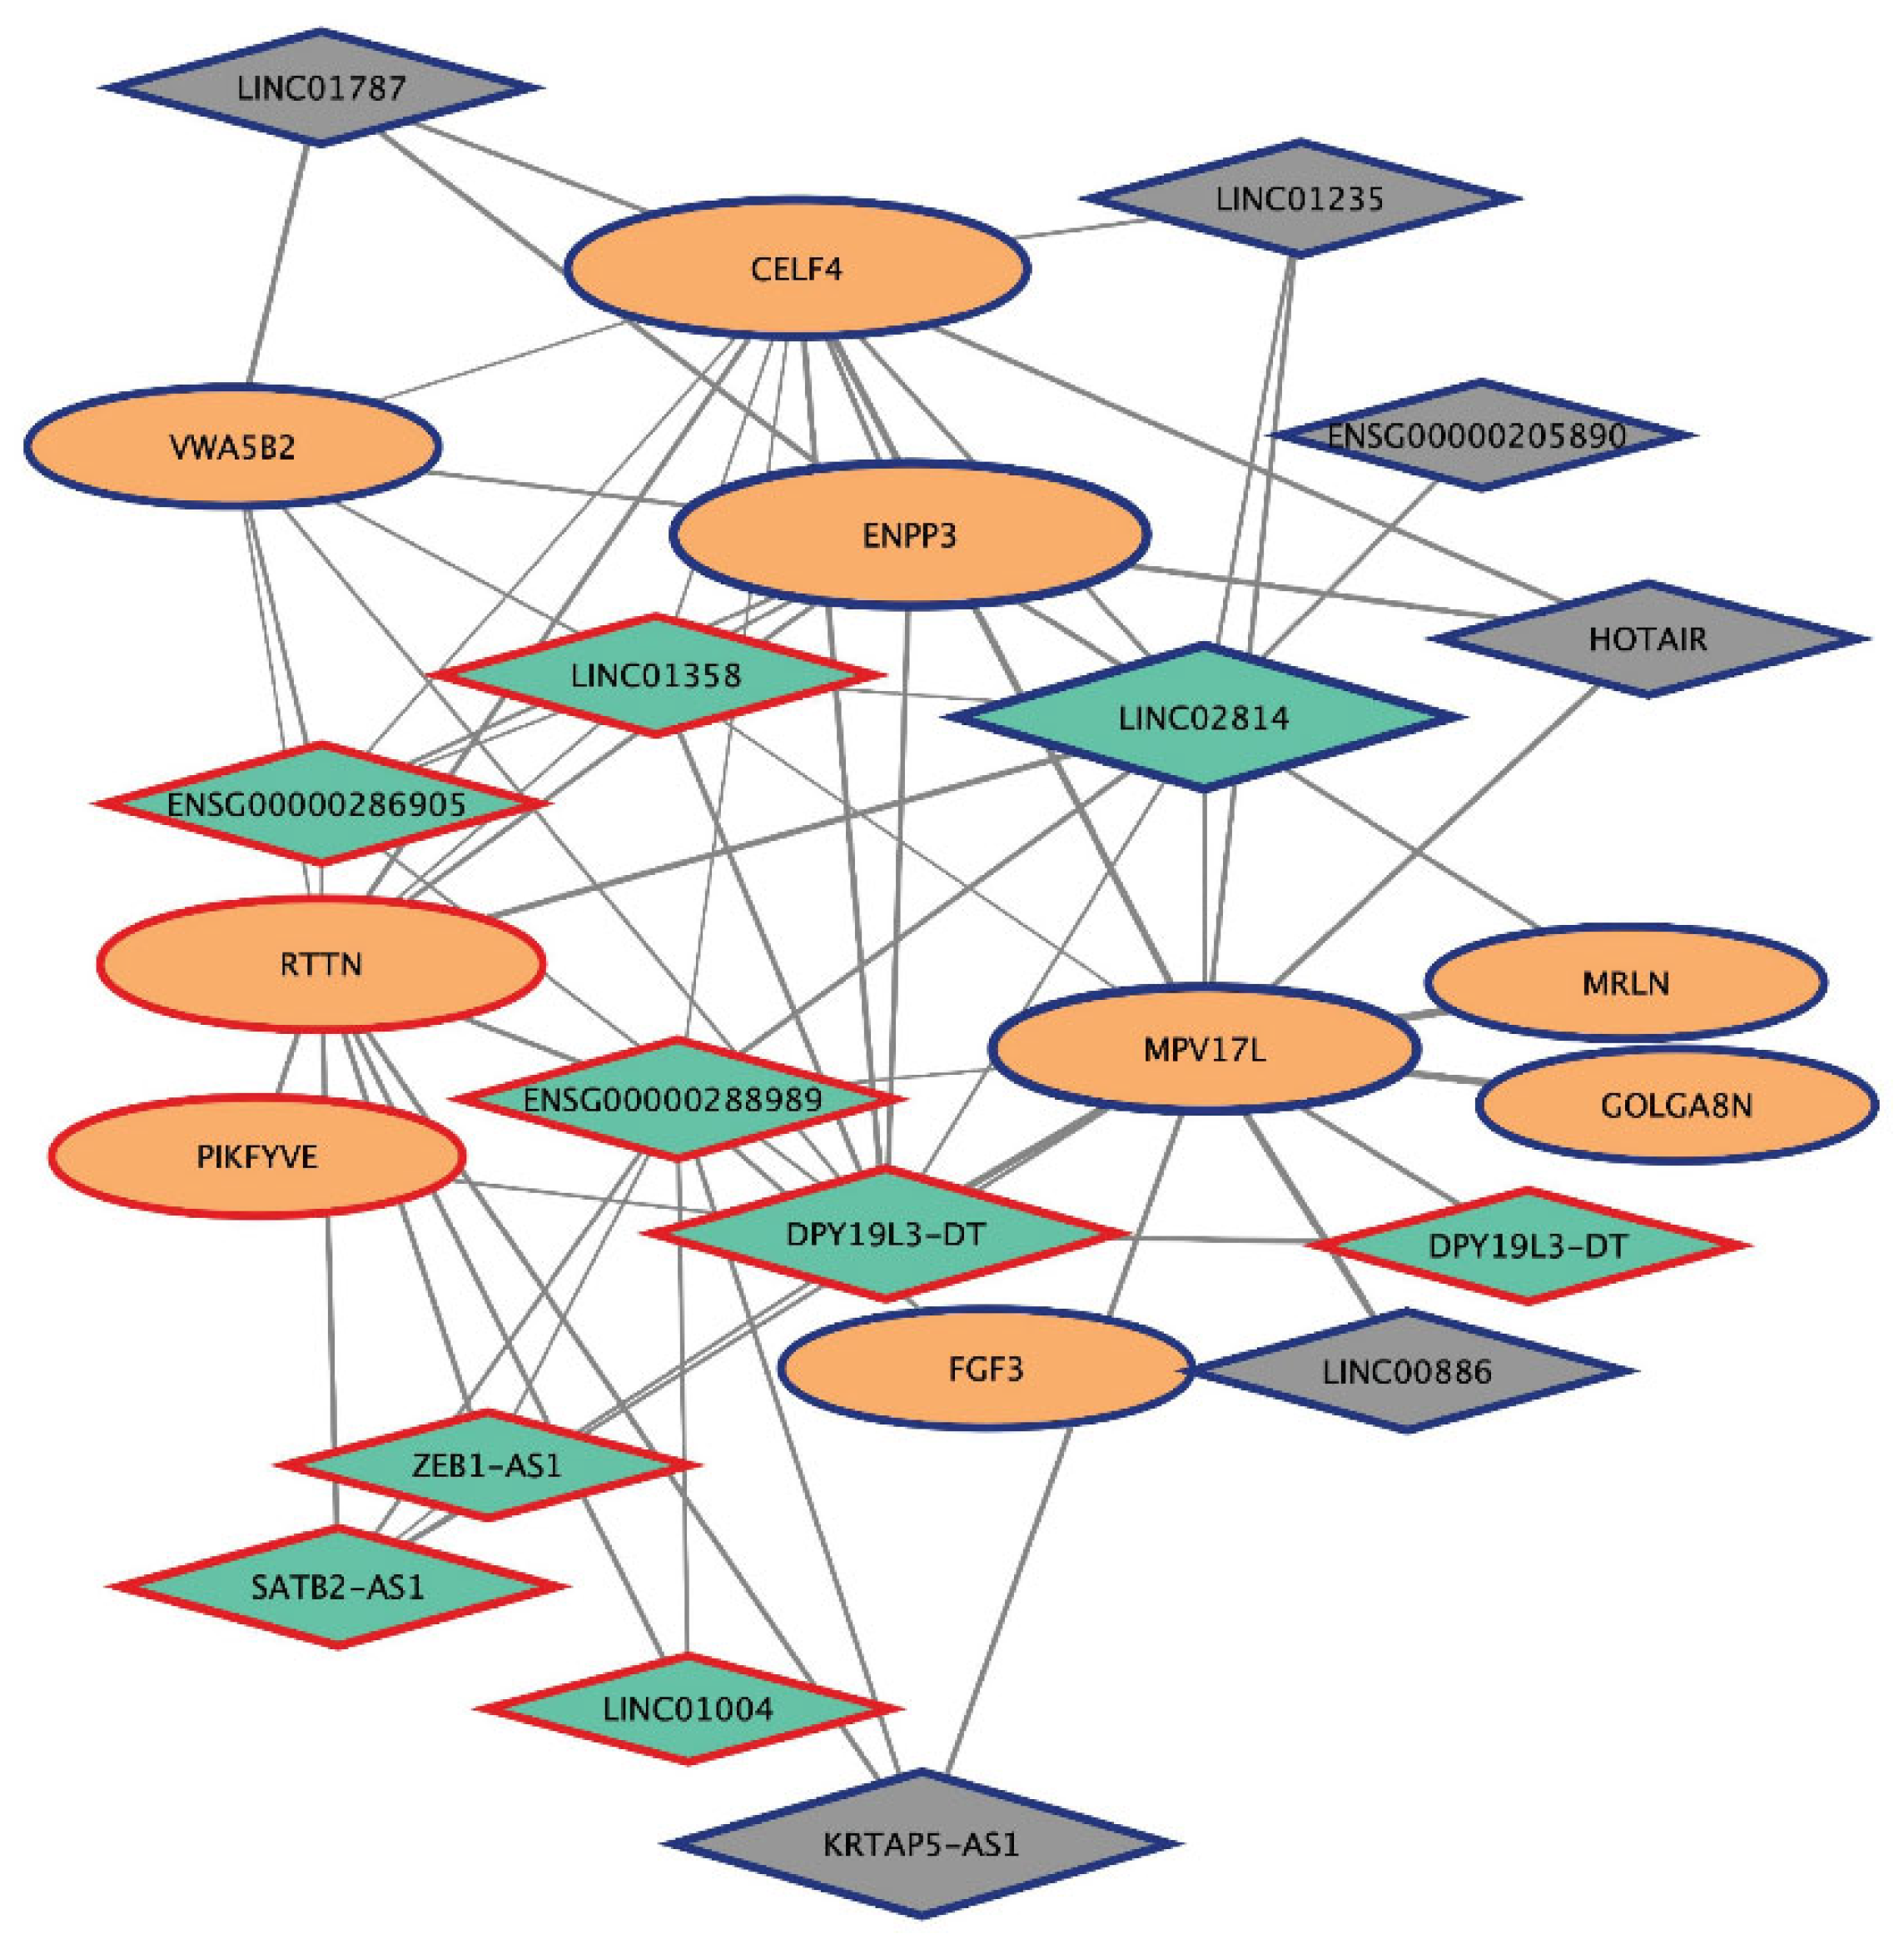
2.6. Analysis of mRNA-lncRNA Sub-Networks

Co-expression networks were built for the three selected modules, as described in methods, to investigate the best connected lncRNA–mRNA genes and, in turn, to study the involved biological processes and signaling pathways of module functional enrichment analysis (Figure 3, Tables S7–S9). It is worth mentioning that, because our data are at probe-level, each gene in the network could be represented by multiple nodes, one for each probe.
The network of the brown4 module contains 87 mRNAs (93 probes) and 29 lncRNAs (34 probes), 20 of them represent the best lncRNAs as highlighted by our selection criteria, mentioned above and in the Methods section (Table 1 and Table S7, Figure S2). Interestingly, 14/20 lncRNA nodes (C2CD4D-AS, ENSG00000261490, ENSG00000287839, GABPB1-AS1, GAPLINC, LINC-PINT, LINC00653, LINC01004, LINC01547, LOC107984035, LYPLAL1-DT, MIR100HG, PAN3-AS1, ZNF436-AS1) show connectivity with 5 mRNAs (ARHGEF10L, BCR, PCDH7, SFN, SLC4A7) belonging to Rho GTPase and/or Rho GTPase regulation enriched pathways (Figure 5A, Table S7). As shown in Figure 5A, multiple probes for the lncRNA LINC-PINT, all mapping to the same transcripts, are in the subnetwork. Moreover, 8/20 lncRNAs (ENSG00000261490, GAPLINC, LINC-PINT, LINC01547, LOC107984035, LYPLAL1-DT, PAN3-AS1, ZNF436-AS1) show connectivity with 4 mRNAs (CIDEC, PDCD6IP, PSMC2, SFN) belonging to apoptotic enriched processes and pathways (Figure 5B, Table S7). It is to be considered that some lncRNAs of the two sub-networks are in common (ENSG00000261490, GAPLINC, LINC-PINT, LINC01547, LOC107984035, LYPLAL1-DT, PAN3-AS1, ZNF436-AS1), highlighting the link between Rho GTPase and apoptotic pathways. The lncRNAs LINC-PINT, LOC107984035, MIR100HG, PAN3-AS1 were also connected to mRNAs (APOL3, CARD11, MYD88, SLC44A2) of the enriched Gene Ontology term positive regulation of I-kappaB kinase/NF-kappaB signaling and positive regulation of NLRP3 inflammasome complex assembly (Figure S2). None of the selected lncRNAs were connected to the genes of the iron ion homeostasis or iron-sulfur cluster assembly enriched pathways.
The network of the magenta4 module contains 212 mRNAs (231 probes) and 34 lncRNAs (37 probes), 26 of them represent the best lncRNAs selected (Table 1, Table S8, and Figure S3). Interestingly, 15/26 lncRNA nodes (ENSG00000233085, ENSG00000236453, ENSG00000251532, ENSG00000268403, ENSG00000289039, FAM95C, GIHCG, LASTR, LINC01182, MAP3K2-DT, MHENCR, MIR205HG, NEAT1, RAB30-DT, ZNF674-AS1) show connectivity with 11 mRNAs (CEACAM1, CLSTN1, COL4A6, FGF2, IGSF9, ITPR2, NDNF, RASGEF1A, SPTB, USP9X, VAV1) belonging to cell adhesion, cell migration, and cell–extracellular matrix interactions (Table S8, Figure 6). Moreover, 24/26 lncRNAs (ENSG00000233085, ENSG00000236453, ENSG00000251532, ENSG00000257283, ENSG00000267575, ENSG00000268403, ENSG00000289039, FAM95C, GIHCG, KDM7A-DT, LASTR, LINC00173, LINC00472, LINC00973, LINC01182, LINC01629, LINC02512, LOC100506124, MAP3K2-DT, MHENCR, MIR205HG, RAB30-DT, ZMIZ1-AS1, ZNF674-AS1) show connectivity with 19 mRNAs (ACSL4, CKMT1B, FAR1, FDFT1, GCH1, GLS2, IMPA2, ITPR2, LGMN, LRP12, MGLL, OAZ3, PLA2G10, PLAAT2, RPL3, SLC27A3, SYNJ2, TBXAS1, TPK1) belonging to metabolism, and/or lipid and phospholipid metabolism terms (Table S8, Figure 6). In addition, 7/26 lncRNAs (ENSG00000257283, ENSG00000289039, GIHCG, LASTR, LINC00173, LINC00973, MHENCR) show connectivity with 5 mRNAs (FGF2, MUC1, STAT4, VAV1, ZEB1) belonging to interleukin signaling pathways, in particular 4, 12, and 13. Finally, 13/26 lncRNAs (ENSG00000233085, ENSG00000236453, ENSG00000268403, ENSG00000289039, FAM95C, GIHCG, LASTR, LINC00173, LINC01182, LINC02512, MAP3K2-DT, MHENCR, ZNF674-AS1) show connectivity with 8 mRNAs (COL4A6, FGF2, IMPA2, ITPR2, LPAR2, RASGEF1A, STAT4, SYNJ2) belonging to Phosphatidylinositol, RAS, and signaling pathways associated with cancer (Table S8, Figure S3).
The network of plum4, a small module characterized by many lncRNAs, contains 9 mRNAs (9 probes) and 14 lncRNAs (15 probes), of which 8 represent the best lncRNAs selected (Table 2 and Table S9, Figure 7). Five out of eight lncRNA nodes (DPY19L3-DT, ENSG00000288989, LINC01358, LINC02814, SATB2-AS1) show connectivity with a single mRNA coding for the mitochondrial inner membrane protein-like protein, MPV17L, predicted to be involved in several processes, including cellular response to reactive oxygen species and apoptosis.
Interestingly, the presence of several interconnected lncRNAs in the brown4 and plum4 modules offers the possibility of investigating the effects of lncRNA cooperation in cell signaling pathways and NSCLC-associated phenotypes.

3. Discussion

NSCLC is the most widespread of all lung cancers and a leading cause of cancer-related mortality worldwide. TKIs targeting the EGFR protein serve as a critical pillar in the treatment of NSCLC, but unfortunately, resistance is unavoidable. Identifying the potential key factors of drug resistance to EGFR-TKIs is essential to treating patients with EGFR mutant lung cancer and to developing novel therapeutic strategies. LncRNAs act as versatile regulators involved in diverse biological processes in cancer, including drug resistance [8,9,10,11,12,13,14,15] and EMT [33,34]. However, their contribution to intermediate EMT phenotypes is still unknown.
LncRNAs are generally expressed at lower levels than protein-coding RNAs; therefore, they might be overlooked by conventional pair-wise gene expression comparisons [36]. However, despite their low abundance, they can exert pronounced effects via their interplay with other nucleic acid and protein molecules.
WGCNA has many advantages over other differential expression analysis methods since its focus is on co-expression patterns, which helps discover functional modules containing related genes. Therefore, we decided to use WGCNA to interrogate the gene expression data of erlotinib-sensitive and -resistant NSCLC cell lines that we isolated in the lab, characterized also by an intermediate EMT phenotype [30,37], to identify lncRNA–mRNA links.
In this study, a total of 20,192 probes (mapping to 13,904 Ensembl gene ID) were used to carry out WGCNA, and 47 modules with sizes ranging from 32 to 4725 probes per module were generated. The three most significant modules, brown4, magenta4 and plum4, were selected for further analysis. Several critical and interesting biological processes, lncRNAs and mRNAs were identified.
Intriguingly, the brown4 module shows 14 out of 20 selected lncRNA nodes connected with 5 mRNAs, belonging to Rho GTPase and/or Rho GTPase regulation enriched pathways.
The role of Rho GTPases, as key regulators of biological processes relevant for cancer development and progression, has been investigated for decades [38,39]. The Rho GTPases, a family of highly conserved GTPases that are encoded by 20 genes in humans, regulate a range of cellular functions. They are activated via the dysregulation of expression and/or activity of a myriad of oncogenic cell surface receptors, including growth factor receptors. In turn, Rho GTPases signal to multiple downstream effectors that regulate migration/invasion via de novo actin polymerization, cell polarization, metastasis, EMT, cell proliferation, cell cycle progression, apoptosis/survival, vesicle trafficking, angiogenesis, cell–cell, and cell-substrate adhesions.
The interaction of the Rho GTPases with several targets, the signals originated from distinct subcellular pools of Rho GTPases, and their spatial and temporally regulation can drive diverse physiological and pathological outcomes [39]. The impact of lncRNAs on Rho GTPase signaling has been shown to be exerted through direct modulation of their expression, by influencing the expression of miRNAs that negatively regulate Rho GTPases, or by acting as molecular sponges of relevant miRNAs [40,41]. Interestingly, among the lncRNAs and connected mRNAs of the brown4 network (Figure S2) belonging to the enriched Rho GTPase pathway, there is a bicarbonate transporter (SLCA47), already shown to be dysregulated in epithelial cancers, and several linked lncRNAs (C2CD4D-AS, ENSG00000261490, ENSG00000287839, GABPB1-AS1, GAPLINC, LINC-PINT, LINC00653, LINC01004, LOC107984035, MIR100HG, PAN3-AS1) (Figure 5).
Within the last decade, numerous studies have demonstrated that intracellular pH homeostasis is often dramatically altered in cancer. Because of the vital importance of the acid–base balance, all living cells have systems to maintain the stability of their intracellular and extracellular pH (pHi and pHe). Evidence has emerged that the high metabolic requirement of proliferating cancer cells, the shift toward a glycolytic metabolism as a response to hypoxia, as well as oncogene-driven changes in gene expression, lead in cancer tissues to an increase in pHi compared to normal cells with a pHe decrease, hence a reversal of pHi < pHe of normal tissue cells. Therefore, the dysregulation of the expression and activity of pH-regulatory proteins, H+ and HCO3− transporters are areas of intense study in cancer [42,43,44,45,46,47].
The Na+-HCO3− co-transporter SLC4A7 (also known as NBCn1), a key contributor to epithelial pH homeostasis, is upregulated at the mRNA level in our erlotinib-resistant cell lines. Interestingly, it is heavily connected to several lncRNAs in the brown4 network. SLC4A7 is also a target of mTORC1 signaling and sustains the mTORC1-dependent control of nucleotide synthesis [48,49]. Moreover, SLC4A7 has also been reported to promote EMT and metastasis of the head and neck squamous cell carcinoma; similarly, pHi dynamics studies as well as mRNA and protein expression of acid-base transporters among breast cancer patients showed that increased SLC4A7 expression predicts proliferative activity and metastasis [50,51].
Another gene worthy of mention is BCR, which is connected to lncRNAs in the brown4 module (Figure 5) and shows a downregulation at the mRNA level in the erlotinib-resistant cell lines. Indeed, Bcr protein may have opposing regulatory activities toward small GTP-binding proteins because the C-terminus of Bcr is a GTPase-activating protein (GAP) domain, which stimulates GTP hydrolysis by RAC1, RAC2, and CDC42 [52,53,54]. Instead, the central Dbl homology (DH) domain functions as a guanine nucleotide exchange factor (GEF) that modulates the GTPases CDC42, RHOA, and RAC1 by promoting their conversion from the GDP-bound to the GTP-bound form [52,55].
Functionally, Bcr may act as an important negative regulator of Rac1 activity in different cell types [53]. Rac1, a widely expressed Rho GTPase, is a major player in the assembly of actin-rich membrane protrusions (i.e., ruffles) implicated in cancer cell migration [56,57]. Growth factors and other extracellular stimuli activate Rac1 via GEFs, and active GTP-bound Rac1 subsequently propagates motility signals via downstream effectors [58,59]. Recently, Rac-GEFs responsible for Rac1-mediated lung cancer cell migration upon EGFR and c-Met activation have been identified [60]. Whether BCR downregulation leads to Rac1 activation in lung adenocarcinoma has not yet been investigated.
In the brown4 module, LINC-PINT, LYPLAL1-DT, and MIR100HG are among the most significant lncRNAs connected to the Rho enriched pathways; they show good values of membership (MM = 0.9), connectivity (kWithin scaled ≥ 0.6), and gene significance for ERL-resistance (GS ≥ 0.6) and EMT intermediate phenotype (GS ≥ 0.7).
The long intergenic non-protein-coding RNA, p53-induced transcript (LINC-PINT) contributes to a variety of biological processes impacting cancer cell growth and metastasis, with involvement in processes ranging from DNA damage responses to cell senescence and apoptosis [61].
The lysophospholipase-like 1-divergent transcript (LYPLAL1-DT) has been shown to act as a small cell lung cancer (SCLC) oncogenic lncRNA by in vitro and in vivo studies, promoting cell proliferation, migration, and invasion [62].
MIR100HG can regulate cell proliferation, apoptosis, cell cycle transition, and cell differentiation. It has been functionally related to several signaling pathways, such as TGF-β, Wnt, Hippo, and ERK/MAPK. Dysregulation of MIR100HG has been detected in a diversity of cancers [63,64].
These lncRNAs, already shown to be dysregulated in epithelial cancers, have not yet been investigated in these specific NSCLC cancer phenotypes or in the Rho signaling pathways; therefore, further investigation is required.
In the larger magenta4 module, the co-expression lncRNA-mRNA network analysis highlighted two main enriched functional pathways: one related to cell adhesion, cell migration, and cell–extracellular matrix interactions, and the other belonging to metabolism and/or lipid metabolism (Figure 6).
In the first functional pathway, 15 of the 26 best selected lncRNA nodes show connectivity with 11 mRNAs. Among the lncRNAs, GIHCG and MIR205HG show very good parameters of module membership (MM = −0.9 and 0.9, respectively) and gene significance for both ERL-resistance and EMT intermediate phenotypes (GS = 0.8 and −0.8, respectively), and good connectivity measures (kWithin scaled = 0.6 and 0.5, respectively).
GIHCG was found to be upregulated in several cancer types, including hepatocellular carcinoma and cervical and renal carcinoma, and showed a role in proliferation and cell migration regulation [65,66,67].
Interestingly, using the baseline gene-expression data and corresponding drug response data from two large cell line screens (Genomics of Drug Sensitivity in Cancer, and Cancer Therapeutics Response Portal), Nath et al. found that MIR205HG can be considered a biomarker of erlotinib response in lung cancer cells [68].
Among others, FGF2 and USP9X mRNA, both upregulated in our resistant cell lines, are present in this network. The X-linked ubiquitin-specific peptidase 9 (USP9X) is a member of the deubiquitinase family shown to be significantly increased in several tumors, including non-small cell lung cancer [69]. Overexpression of USP9X in cancer activates multiple important pathways, including the PI3K/AKT, Rho/Rho-associated protein kinase, Notch, NK-κB, and Wnt/β-catenin pathways [70]. Autocrine signaling of fibroblast growth factors (FGF) and their receptors (FGFR) has been shown in NSCLC cell lines [71,72], and activation of an FGF2–FGFR1 autocrine loop has been reported in EGFR-TKI-resistant cell lines [73].
Moreover, 24 out of 26 lncRNAs show connectivity with 19 mRNAs involved in metabolism and lipid metabolism pathways. Among the lncRNA are GIHCG (discussed in the previous paragraph) and ZMIZ1-AS1 that show a MM—0.8; kWithin scaled equal to 0.5 and a good gene significance for ERL-resistance (GS = 0.8) and EMT intermediate phenotype (GS = 0.8).
The Zinc Finger MIZ-Type Containing 1-Antisense RNA 1, ZMIZ1-AS1, has been previously shown to be upregulated in an erlotinib-resistant cell line derived from HCC827 and by RNA pull-down assay and mass spectrometry to interact with the nuclear ribonucleoprotein hnRNPA1 [74].
It is very well known that tumor initiation and progression require the metabolic reprogramming of cancer cells through the regulation of the expression and activity of enzymes and transporters. Cancer cells should adapt to the increased energy demand, nutrient availability, and oxidative stress associated with cancer cell proliferation [75]. The epithelial-to-mesenchymal transition has also been linked with complex metabolic reprogramming [76,77]. Among the metabolic alterations observed in lung cancer, those associated with lipid metabolism have recently received increasing attention [78,79].
The lncRNA-mRNA network of the magenta4 module correlated to metabolic pathways includes, among others, some interesting genes: ACSL4, FDFT1, MGLL, and GLS2. The ACSL4 gene, upregulated in the erlotinib-resistant cell lines, is a member of the long-chain fatty acyl CoA synthetase (ACSLs) family of enzymes that contributes significantly to lipid metabolism, playing a role in both anabolic (fatty acid synthesis and lipogenesis) and catabolic pathways (lipolysis and fatty acid β-oxidation). ACSLs affect the behavior of malignant cells, including proliferation, migration, invasion, apoptosis, and drug resistance. ACSL4 has also been involved in ferroptosis, a cell death pathway caused by excessive accumulation and failure to eliminate iron-dependent lethal toxic lipid reactive oxygen species (ROS) [80]. A cholesterogenic gene, Farnesyl-Diphosphate Farnesyltransferase 1 (FDFT1), downregulated in the erlotinib-resistant cell lines, is a gene encoding a membrane-associated enzyme located at a branch point in the mevalonate pathway. It is the first specific enzyme in cholesterol biosynthesis, and its relevance to tumor progression and tumor environment has been recently reviewed [81].
Monoacylglycerol lipase (MGLL, MGL, or MAGL) is an enzyme belonging to the family of serine hydrolases that preferentially catalyzes the hydrolysis of mono-triglycerides to glycerol and fatty acids. This enzyme is also the most important degrading enzyme for the endocannabinoid 2-arachidonoylglycerol (2-AG). MGLL inhibitors have been considered important agents in many diseases for their anti-nociceptive, anxiolytic, anti-inflammatory, and anti-cancer properties [82]. Interestingly, this gene is downregulated in the erlotinib-resistant cell lines and gene knock-out in mice leads to an increased incidence of lung cancer and the activation of EGFR and ERK [83].
The GLS2 gene, downregulated in the erlotinib-resistant cell lines, plays an important role in the regulation of glutamine catabolism. GLS2 protein promotes mitochondrial respiration and increases ATP generation in cells by catalyzing the synthesis of glutamate and alpha-ketoglutarate. The GSL2 oncogene or tumor suppressor gene in different cancer types has also been correlated with EMT [84,85].
The network of the small plum4 module (Figure 7) is characterized by the presence of many lncRNAs, including SATB2-AS1, special AT-rich sequence binding protein 2 antisense RNA 1 (MM = −0.9; kWithin scaled = 0.6; GSERL-resistance and GSEMT intermediate phentotype = 0.8), which has been reported to promote tumor cell growth in osteosarcoma [86], and NSCLC [87]; in contrast, it inhibits tumor cell metastasis in colorectal cancer through positive regulation of SATB2 gene expression [88]. Accordingly, in our erlotinib-resistant NSCLC cell lines, both SATB2-AS1 (plum4 module) and SATB2 (deeppink module) are upregulated, suggesting a similar positive regulation of the coding gene by the lncRNA.

4. Material and Methods

4.1. Reagents

Chemicals and molecular biology reagents, if not otherwise stated, were purchased from Merck Life Science, Milan, Italy or Thermo Fisher Scientific, Milan, Italy; Erlotinib Hydrochloride Salt was purchased from LC Laboratories, Woburn, MA, USA; and MTT, 3-(4,5-methylthiazol-2-yl)-2,5-diphenyltetrazolium bromide, was purchased from Sigma-Aldrich. MTT stock solution (5 mg/mL in H2O, sterilized by filtration) was stored at 4 °C for 1 month. Applied Biosystem PowerUp SYBR Green Master Mix for qPCR was from Thermo Fisher Scientific, Milan, Italy. The Reverse Transcription System was from Promega Italia Srl, Milan, Italy.

4.2. Cell Culture

For the model of NSCLC, the study used EGFR-TKI (erlotinib/gefitinib)-sensitive and -resistant cell lines derived and characterized in our laboratory and previously described [30,37]. Our model system is composed of two parental EGFR-mutated cell lines that are sensitive to EGFR-TKI, HCC827 (ATCC CRL-2868) and HCC4006 (ATCC CRL-2871), and six EGFR-TKI-resistant cell lines: five HCC827-derived cell lines (RA1, RA1, RA2, RB1, RB1.1, and RB2), and one HCC4006-derived cell line (RC2.2). Concisely, NSCLC cells were maintained in RPMI 1640 medium (BioWhittaker, Lonza, Euroclone, Milan, Italy) supplemented with 10 mM Hepes pH 6.98–7.30, 1 mM L-glutamine, 100 U/mL penicillin/streptomycin (BioWhittaker, Lonza), and heat-inactivated 10% fetal bovine serum (FBS) (Merck Life Science, Milan, Italy). All cells were cultured at 37 °C in a 5% CO2 humidified incubator.
The MTT assay was performed as previously described [37]. Briefly, cells (10–20 × 104 cells/well) in a 96-well plate were treated with an increasing concentration of erlotinib (from 64 pM up to 10–20 μM) in complete tissue culture medium for 72 h. Next, cells were washed with PBS, incubated for 4 h with MTT (1 mg/mL), and processed for color detection upon solubilization with DMSO. The samples were quantified spectrophotometrically at 570 nm, with a reference wavelength of 630 nm, using a Varioskan Lux multimode microplate reader (Thermofisher Scientific, Waltham, MA, USA). Data analysis was achieved using GraphPad Prism v 7.0 software (GraphPad Software Inc., La Jolla, CA, USA), and IC50 was obtained after nonlinear regression curve fitting, according to log (inhibitor) versus normalized response with a variable slope curve model.

4.3. RNA Extraction and Real-Time qPCR Analysis

Total RNA was extracted from the erlotinib-sensitive and -resistant cell lines using the total RNA purification plus kit (Norgen Biotek Corporation, Thorold, ON, Canada) and retro-transcribed with the GoScript Reverse Transcription System (Promega Italia, Srl, Milan, Italy) using random primers. Quantitative real time PCR (qRT-PCR) analysis was performed in an Applied Biosystem 7500 Fast Real-Time PCR System (from Thermo Fisher Scientific, Milan, Italy) using Applied Biosystem PowerUp SYBR Green Master Mix for qPCR. Sequences of specific primers are shown in Table S11. Ribosomal protein L31 (RPL31) was used as a reference gene to normalize the quantitation of target genes for differences in the amount of total RNA in each sample. The relative fold change of target genes in resistant cell lines in comparison to HCC827 and HCC4006 parental cell lines was calculated using the 2−ΔΔCt method. The data were analyzed using Applied Biosystem SDS (Ver. 1.4) software (Thermo Fisher Scientific, Milan, Italy).

4.4. Weighted Gene Co-Expression Network Analysis (WGCNA) and Module Identification

WGCNA is an approach utilizing gene expression data to construct co-expression networks weighted for high correlations [35] and was used in this study to evaluate the correlation between lncRNA and mRNA expression in NSCLC cell lines that are sensitive and resistant to EGFR-TKI. The gene expression dataset GSE80344 of sample biological duplicates (n = 16), publicly available at the NCBI’s Gene Expression Omnibus (GEO) database, was used as input for the WGCNA.
The gene expression raw microarray data were background corrected, log2 transformed, and quantile normalized using the limma package as previously reported [89]. Probes with low signal intensities and low variation were cut-off: 20,192 probes (mapping to 13,904 Ensembl gene ID) with signal intensities >5.5 and relative standard deviation (RSD) >0.3 were submitted to the following analysis: of these probes, 3591 map to lncRNAs (2386 Ensembl Gene ID).
The weighted correlation network analysis was performed with the WGCNA v.1.70.3 package of R v.4.1 software [35,90]. We used the WGCNA package to construct a weighted gene co-expression network, detect sub-clusters of genes, and correlate them to the phenotypic traits of our interest: intermediate EMT phenotype and ERL-resistance. Briefly, we obtained the expression correlation square matrix by calculating the Pearson correlation coefficient for all possible probe pairs. To construct a co-expression network, we used the scale-free topology criterion to choose the best parameter of the adjacency function: aij = |sij|β [90]. The fit was calculated using different β parameters (soft threshold) and selecting the β parameter of the fitting with R2 ≃ 0.9. The adjacency measures were transformed into topology overlapping matrix (TOM) scores (or weights), which reflect the relative interconnectedness between two nodes [91]. The TOM-based dissimilarity (dω = 1 − TOM) was used for the hierarchical clustering of probes and the definition of the network modules. In particular, the modules (i.e., groups of highly correlated probes) were formed by hierarchical clustering (method = “average”), followed by the Dynamic Tree Cut algorithm (deepSplit = 2, minModuleSize = 30) and a merging of close clusters with the Merge Dynamic algorithm (cutHeight = 0.2).

4.5. Modules and Probes Selection

The first principal component of module gene expression data (module eigengene) was used to relate modules to each probe expression profile (module membership, MM) by the Pearson coefficient (ρ), and to phenotypical traits of cell lines by Spearman’s rank correlation coefficient (ρs). The Spearman’s rank correlation was also used to calculate the gene/probe significance (GS), which in this work is the correlation between individual probe values and the biological trait of interest.
The student asymptotic p-values were calculated to assign a significance value to the correlation coefficients. p-values < 0.05 were considered significant.
For each gene/probe, connectivity (K) was represented by node degree (i.e., the sum of connection strengths with the other network nodes) and was calculated with three measures to study how connected a gene/probe is with respect to the other genes/probes: whole network connectivity (k), intramodular connectivity (kWithin), and scaled intramodular connectivity (kWithin scaled).
Modules of interest were selected according to their correlation with the EMT intermediate phenotype (“I vs. E”) and/or ERL-resistance (|ρs| > 0.65, p-value < 0.05). Modules with a significant correlation (p-value < 0.05) with the “cell lineage” trait were discarded, as were modules with a not-significant correlation with the “I vs. M” trait (p-value > 0.05).
LncRNAs and mRNAs with significant MM and GS for intermediate EMT or erlotinib resistance greater than 0.7 were selected at probe level.
Module networks were finally imported into Cytoscape v.3.8.1 for visualization and topology analysis. For each node, we considered only the first 10 edges with a weight greater than the 0.8 quantile of module edge weights.
In the Discussion section, we summarized the gene parameters for module membership, gene significance, and connectivity as the average of probe values mapping to those genes.

4.6. Functional Annotations

Function annotations of modules were performed using the DAVID web tool [92] by using the official gene symbol identifiers and the terms of the BBID, BIOCARTA, KEGG, and Reactome databases. We performed pathway enrichment analysis, selecting terms with a count >2 and a p-value < 0.05.

5. Conclusions

In conclusion, in a NSCLC cellular model system, we identified three clusters of co-expressed genes whose expression correlates with resistance to EGFR-TKI and/or intermediate EMT phenotypes. These clusters of genes, with a potential biological significance for the selected NSCLC features, show strong links between some lncRNAs and mRNAs that could be a milestone for future mechanistic studies aimed at investigating the unknown function and action mechanisms of lncRNAs in NSCLC.

Supplementary Materials

The following supporting information can be downloaded at: https://www.mdpi.com/article/10.3390/ijms25073863/s1.

Author Contributions

Conceptualization, F.R. and G.R.; methodology and investigation, V.F. (performed the bioinformatics studies), G.P. (performed the cell culture experiments), F.R. (performed the RNA and qPCR studies); formal analysis, V.F., F.R. and G.R.; data curation, V.F., F.R. and G.R.; writing—V.F., F.R. and G.R.; writing—review and editing, V.F., F.R. and G.R.; visualization, V.F. and F.R.; supervision and project administration, F.R. and G.R.; Funding Acquisition, G.R. All authors have read and agreed to the published version of the manuscript.

Funding

This work was supported by LazioInnova, POR FESR 2014–2020 Bando “Life 2020_Progetti Integrati” for the project “PISTA (PI3K for Solid Tumor therApy)” (grant n. A0112-2016-13408 to G.R.) and LazioInnova POR FESR Lazio 2014 to 2020 HDACiPLAT Project (grant number A0375-2020-36575 to G.R.).

Institutional Review Board Statement

Not applicable.

Informed Consent Statement

Not applicable.

Data Availability Statement

All data generated or analyzed during this study are included in this published article and its Supplementary Information Files.

Acknowledgments

The authors wish to thank the members of the laboratory for stimulating discussions.

Conflicts of Interest

The authors declare no conflicts of interest.

References

  1. Sung, H.; Ferlay, J.; Siegel, R.L.; Laversanne, M.; Soerjomataram, I.; Jemal, A.; Bray, F. Global cancer statistics 2020: GLOBOCAN estimates of incidence and mortality worldwide for 36 cancers in 185 countries. CA Cancer J. Clin. 2021, 71, 209–249. [Google Scholar] [CrossRef] [PubMed]
  2. Siegel, R.L.; Miller, K.D.; Wagle, N.S.; Jemal, A. Cancer statistics, 2023. CA Cancer J. Clin. 2023, 73, 17–48. [Google Scholar] [CrossRef]
  3. Mattick, J.S.; Amaral, P.P.; Carninci, P.; Carpenter, S.; Chang, H.Y.; Chen, L.L.; Chen, R.; Dean, C.; Dinger, M.E.; Fitzgerald, K.A.; et al. Long non-coding RNAs: Definitions, functions, challenges and recommendations. Nat. Rev. Mol. Cell Biol. 2023, 24, 430–447. [Google Scholar] [CrossRef] [PubMed]
  4. Statello, L.; Guo, C.J.; Chen, L.L.; Huarte, M. Gene regulation by long non-coding RNAs and its biological functions. Nat. Rev. Mol. Cell Biol. 2021, 22, 96–118. [Google Scholar] [CrossRef] [PubMed]
  5. Wu, M.; Lin, Z.; Li, X.; An, J.; Zheng, Q.; Yang, Y.; Lu, D. HULC cooperates with MALAT1 to aggravate liver cancer stem cells growth through telomere repeat-binding factor 2. Sci. Rep. 2016, 6, 36045. [Google Scholar] [CrossRef] [PubMed]
  6. Akerman, I.; Tu, Z.; Beucher, A.; Rolando, D.M.Y.; Sauty-Colace, C.; Benazra, M.; Nakic, N.; Yang, J.; Wang, H.; Pasquali, L. Human pancreatic β cell lncRNAs control cell-specific regulatory networks. Cell Metab. 2017, 25, 400–411. [Google Scholar] [CrossRef] [PubMed]
  7. Shao, T.; Xie, Y.; Shi, J.; Yang, C.; Zou, H.; Li, Y.; Xu, J.; Li, X. Surveying lncRNA-lncRNA cooperations reveals a dominant effect on tumor immunity cross cancers. Commun. Biol. 2022, 5, 1324. [Google Scholar] [CrossRef] [PubMed]
  8. Hu, Q.; Ma, H.; Chen, H.; Zhang, Z.; Xue, Q. LncRNA in tumorigenesis of non-small-cell lung cancer: From bench to bedside. Cell Death Discov. 2022, 8, 359. [Google Scholar] [CrossRef] [PubMed]
  9. Jiang, M.C.; Ni, J.J.; Cui, W.Y.; Wang, B.Y.; Zhuo, W. Emerging roles of lncRNA in cancer and therapeutic opportunities. Am. J. Cancer Res. 2019, 9, 1354–1366. [Google Scholar] [PubMed]
  10. Carlevaro-Fita, J.; Lanzós, A.; Feuerbach, L.; Hong, C.; Mas-Ponte, D.; Pedersen, J.S.; Abascal, F.; Amin, S.B.; Bader, G.D.; Barenboim, J.; et al. Cancer LncRNA Census reveals evidence for deep functional conservation of long noncoding RNAs in tumorigenesis. Commun. Biol. 2020, 3, 56. [Google Scholar] [CrossRef] [PubMed]
  11. Sun, R.; Wang, R.; Chang, S.; Li, K.; Sun, R.; Wang, M.; Li, Z. Long Non-Coding RNA in Drug Resistance of Non-Small Cell Lung Cancer: A Mini Review. Front. Pharmacol. 2019, 10, 1457. [Google Scholar] [CrossRef] [PubMed]
  12. Yang, Y.; Li, H.; Hou, S.; Hu, B.; Liu, J.; Wang, J. The Noncoding RNA Expression Profile and the Effect of lncRNA AK126698 on Cisplatin Resistance in Non-Small-Cell Lung Cancer Cell. PLoS ONE 2013, 8, e65309. [Google Scholar] [CrossRef] [PubMed]
  13. Tian, X.; Zhang, H.; Zhang, B.; Zhao, J.; Li, T.; Zhao, Y. Microarray Expression Profile of Long Non-Coding RNAs in Paclitaxel-Resistant Human Lung Adenocarcinoma Cells. Oncol. Rep. 2017, 38, 293–300. [Google Scholar] [CrossRef] [PubMed]
  14. Cheng, N.; Li, X.; Zhao, C.; Ren, S.; Chen, X.; Cai, W.; Zhao, M.; Zhang, Y.; Li, J.; Wang, Q.; et al. Microarray Expression Profile of Long Non-Coding RNAs in EGFR-TKIs Resistance of Human Non-Small Cell Lung Cancer. Oncol. Rep. 2015, 33, 833–839. [Google Scholar] [CrossRef] [PubMed]
  15. Wu, Y.; Yu, D.-D.; Hu, Y.; Yan, D.; Chen, X.; Cao, H.-X.; Yu, S.-R.; Wang, Z.; Feng, J.-F. Genome-Wide Profiling of Long Non-Coding RNA Expression Patterns in the EGFR-TKI Resistance of Lung Adenocarcinoma by Microarray. Oncol. Rep. 2016, 35, 3371–3386. [Google Scholar] [CrossRef] [PubMed]
  16. Kobayashi, S.; Boggon, T.J.; Dayaram, T.; Jänne, P.A.; Kocher, O.; Meyerson, M.; Johnson, B.E.; Eck, M.J.; Tenen, D.G.; Halmos, B. EGFR Mutation and Resistance of Non-Small-Cell Lung Cancer to Gefitinib. N. Engl. J. Med. 2005, 352, 786–792. [Google Scholar] [CrossRef] [PubMed]
  17. Kosaka, T.; Yatabe, Y.; Endoh, H.; Yoshida, K.; Hida, T.; Tsuboi, M.; Tada, H.; Kuwano, H.; Mitsudomi, T. Analysis of Epidermal Growth Factor Receptor Gene Mutation in Patients with Non-Small Cell Lung Cancer and Acquired Resistance to Gefitinib. Clin. Cancer Res. 2006, 12, 5764–5769. [Google Scholar] [CrossRef] [PubMed]
  18. Passaro, A.; Mok, T.; Peters, S.; Popat, S.; Ahn, M.J.; de Marinis, F. Recent Advances on the Role of EGFR Tyrosine Kinase Inhibitors in the Management of NSCLC with Uncommon, Non Exon 20 Insertions, EGFR Mutations. J. Thorac. Oncol. 2021, 16, 764–773. [Google Scholar] [CrossRef] [PubMed]
  19. Jakobsen, K.R.; Demuth, C.; Sorensen, B.S.; Nielsen, A.L. The Role of Epithelial to Mesenchymal Transition in Resistance to Epidermal Growth Factor Receptor Tyrosine Kinase Inhibitors in Non-Small Cell Lung Cancer. Transl. Lung Cancer Res. 2016, 5, 172–182. [Google Scholar] [CrossRef] [PubMed]
  20. Dongre, A.; Weinberg, R.A. New Insights into the Mechanisms of Epithelial–Mesenchymal Transition and Implications for Cancer. Nat. Rev. Mol. Cell Biol. 2019, 20, 69–84. [Google Scholar] [CrossRef] [PubMed]
  21. Kalluri, R.; Weinberg, R.A. The Basics of Epithelial-Mesenchymal Transition. J. Clin. Investig. 2009, 119, 1420–1428. [Google Scholar] [CrossRef] [PubMed]
  22. Nieto, M.A. Epithelial Plasticity: A Common Theme in Embryonic and Cancer Cells. Science 2013, 342, 1234850. [Google Scholar] [CrossRef] [PubMed]
  23. Jolly, M.K.; Boareto, M.; Huang, B.; Jia, D.; Lu, M.; Ben-Jacob, E.; Onuchic, J.N.; Levine, H. Implications of the Hybrid Epithelial/Mesenchymal Phenotype in Metastasis. Front. Oncol. 2015, 5, 155. [Google Scholar] [CrossRef] [PubMed]
  24. Brabletz, S.; Schuhwerk, H.; Brabletz, T.; Stemmler, M.P. Dynamic EMT: A Multi-Tool for Tumor Progression. EMBO J. 2021, 40, e108647. [Google Scholar] [CrossRef] [PubMed]
  25. Jolly, M.K.; Mani, S.A.; Levine, H. Hybrid Epithelial/Mesenchymal Phenotype(s): The ‘Fittest’ for Metastasis? Biochim. Biophys. Acta-Rev. Cancer 2018, 1870, 151–157. [Google Scholar] [CrossRef] [PubMed]
  26. Pastushenko, I.; Brisebarre, A.; Sifrim, A.; Fioramonti, M.; Revenco, T.; Boumahdi, S.; Van Keymeulen, A.; Brown, D.; Moers, V.; Lemaire, S.; et al. Identification of the Tumour Transition States Occurring during EMT. Nature 2018, 556, 463–468. [Google Scholar] [CrossRef] [PubMed]
  27. Deshmukh, A.P.; Vasaikar, S.V.; Tomczak, K.; Tripathi, S.; den Hollander, P.; Arslan, E.; Chakraborty, P.; Soundararajan, R.; Jolly, M.K.; Rai, K.; et al. Identification of EMT Signaling Cross-Talk and Gene Regulatory Networks by Single-Cell RNA Sequencing. Proc. Natl. Acad. Sci. USA 2021, 118, e2102050118. [Google Scholar] [CrossRef] [PubMed]
  28. Yang, J.; Antin, P.; Berx, G.; Blanpain, C.; Brabletz, T.; Bronner, M.; Campbell, K.; Cano, A.; Casanova, J.; Christofori, G.; et al. Guidelines and Definitions for Research on Epithelial–Mesenchymal Transition. Nat. Rev. Mol. Cell Biol. 2020, 21, 341–352. [Google Scholar] [CrossRef]
  29. Canciello, A.; Cerveró-Varona, A.; Peserico, A.; Mauro, A.; Russo, V.; Morrione, A.; Giordano, A.; Barboni, B. “In Medio Stat Virtus”: Insights into Hybrid E/M Phenotype Attitudes. Front. Cell Dev. Biol. 2022, 10, 1038841. [Google Scholar] [CrossRef] [PubMed]
  30. Fustaino, V.; Presutti, D.; Colombo, T.; Cardinali, B.; Papoff, G.; Brandi, R.; Bertolazzi, P.; Felici, G.; Ruberti, G. Characterization of Epithelial-Mesenchymal Transition Intermediate/Hybrid Phenotypes Associated to Resistance to EGFR Inhibitors in Non-Small Cell Lung Cancer Cell Lines. Oncotarget 2017, 8, 103340–103363. [Google Scholar] [CrossRef] [PubMed]
  31. Malagoli Tagliazucchi, G.; Wiecek, A.J.; Withnell, E.; Secrier, M. Genomic and Microenvironmental Heterogeneity Shaping Epithelial-to-Mesenchymal Trajectories in Cancer. Nat. Commun. 2023, 14, 789. [Google Scholar] [CrossRef] [PubMed]
  32. Tripathi, S.; Xing, J.; Levine, H.; Jolly, M.K. Mathematical Modeling of Plasticity and Heterogeneity in EMT. Methods Mol. Biol. 2021, 2179, 385–413. [Google Scholar] [CrossRef] [PubMed]
  33. Khanbabaei, H.; Ebrahimi, S.; García-Rodríguez, J.L.; Ghasemi, Z.; Pourghadamyari, H.; Mohammadi, M.; Kristensen, L.S. Non-Coding RNAs and Epithelial Mesenchymal Transition in Cancer: Molecular Mechanisms and Clinical Implications. J. Exp. Clin. Cancer Res. 2022, 41, 278. [Google Scholar] [CrossRef] [PubMed]
  34. Gugnoni, M.; Ciarrocchi, A. Long Noncoding RNA and Epithelial Mesenchymal Transition in Cancer. Int. J. Mol. Sci. 2019, 20, 1924. [Google Scholar] [CrossRef] [PubMed]
  35. Langfelder, P.; Horvath, S. WGCNA: An R Package for Weighted Correlation Network Analysis. BMC Bioinform. 2008, 9, 559. [Google Scholar] [CrossRef] [PubMed]
  36. Derrien, T.; Johnson, R.; Bussotti, G.; Tanzer, A.; Djebali, S.; Tilgner, H.; Guernec, G.; Martin, D.; Merkel, A.; Knowles, D.G.; et al. The GENCODE v7 catalog of human long noncoding RNAs: Analysis of their gene structure, evolution, and expression. Genome Res. 2012, 22, 1775–1789. [Google Scholar] [CrossRef] [PubMed]
  37. Presutti, D.; Santini, S.; Cardinali, B.; Papoff, G.; Lalli, C.; Samperna, S.; Fustaino, V.; Giannini, G.; Ruberti, G. MET Gene Amplification and MET Receptor Activation Are not Sufficient to Predict Efficacy of Combined MET and EGFR Inhibitors in EGFR TKI-Resistant NSCLC Cells. PLoS ONE 2015, 10, e0143333. [Google Scholar] [CrossRef] [PubMed]
  38. Svensmark, J.H.; Brakebusch, C. Rho GTPases in Cancer: Friend or Foe? Oncogene 2019, 38, 7447–7456. [Google Scholar] [CrossRef] [PubMed]
  39. Phuyal, S.; Farhan, H. Multifaceted Rho GTPase Signaling at the Endomembranes. Front. Cell Dev. Biol. 2019, 7, 127. [Google Scholar] [CrossRef] [PubMed]
  40. Ghafouri-Fard, S.; Noroozi, R.; Abak, A.; Taheri, M.; Salimi, A. Emerging Role of lncRNAs in the Regulation of Rho GTPase Pathway. Biomed. Pharmacother. 2021, 140, 111731. [Google Scholar] [CrossRef] [PubMed]
  41. Saliani, M.; Mirzaiebadizi, A.; Mosaddeghzadeh, N.; Ahmadian, M.R. RHO GTPase-Related Long Noncoding RNAs in Human Cancers. Cancers 2021, 13, 5386. [Google Scholar] [CrossRef] [PubMed]
  42. Cardone, R.A.; Casavola, V.; Reshkin, S.J. The Role of Disturbed pH Dynamics and the Na+/H+ Exchanger in Metastasis. Nat. Rev. Cancer 2005, 5, 786–795. [Google Scholar] [CrossRef] [PubMed]
  43. Webb, B.A.; Chimenti, M.; Jacobson, M.P.; Barber, D.L. Dysregulated pH: A Perfect Storm for Cancer Progression. Nat. Rev. Cancer 2011, 11, 671–677. [Google Scholar] [CrossRef] [PubMed]
  44. Sun, H.; Zhou, Y.; Skaro, M.F.; Wu, Y.; Qu, Z.; Mao, F.; Zhao, S.; Xu, Y. Metabolic Reprogramming in Cancer Is Induced to Increase Proton Production. Cancer Res. 2020, 80, 1143–1155. [Google Scholar] [CrossRef] [PubMed]
  45. Zhou, Y.; Chang, W.; Lu, X.; Wang, J.; Zhang, C.; Xu, Y. Acid-Base Homeostasis and Implications to the Phenotypic Behaviors of Cancer. Genom. Proteom. Bioinform. 2022. ahead of print. [Google Scholar] [CrossRef]
  46. Liu, Y.; White, K.A.; Barber, D.L. Intracellular pH Regulates Cancer and Stem Cell Behaviors: A Protein Dynamics Perspective. Front. Oncol. 2020, 10, 1401. [Google Scholar] [CrossRef] [PubMed]
  47. Gorbatenko, A.; Olesen, C.; Boedtkjer, E.; Pedersen, S. Regulation and Roles of Bicarbonate Transport in Cancer. Front. Physiol. 2014, 5, 130. [Google Scholar] [CrossRef] [PubMed]
  48. Ali, E.S.; Lipońska, A.; O’Hara, B.P.; Amici, D.R.; Torno, M.D.; Gao, P.; Asara, J.M.; Yap, M.N.F.; Mendillo, M.L.; Ben-Sahra, I. The mTORC1-SLC4A7 Axis Stimulates Bicarbonate Import to Enhance de Novo Nucleotide Synthesis. Mol. Cell 2022, 82, 3284–3298.e7. [Google Scholar] [CrossRef] [PubMed]
  49. Koe, J.C.; Hewton, K.G.; Parker, S.J. SLC4A7 and mTORC1 Raise Nucleotide Synthesis with Bicarbonate. Mol. Cell 2022, 82, 3121–3123. [Google Scholar] [CrossRef] [PubMed]
  50. Hu, J.; Li, G.; Liu, Z.; Ma, H.; Yuan, W.; Lu, Z.; Zhang, D.; Ling, H.; Zhang, F.; Liu, Y.; et al. Bicarbonate transporter SLC4A7 promotes EMT and metastasis of HNSCC by activating the PI3K/AKT/mTOR signaling pathway. Mol. Carcinog. 2023, 62, 628–640. [Google Scholar] [CrossRef]
  51. Toft, N.J.; Axelsen, T.V.; Pedersen, H.L.; Mele, M.; Burton, M.; Balling, E.; Johansen, T.; Thomassen, M.; Christiansen, P.M.; Boedtkjer, E. Acid-Base Transporters and pH Dynamics in Human Breast Carcinomas Predict Proliferative Activity, Metastasis, and Survival. eLife 2021, 10, e68447. [Google Scholar] [CrossRef] [PubMed]
  52. Chuang, T.H.; Xu, X.; Kaartinen, V.; Heisterkamp, N.; Groffen, J.; Bokoch, G.M. Abr and Bcr are multifunctional regulators of the Rho GTP-binding protein family. Proc. Natl. Acad. Sci. USA 1995, 92, 10282–10286. [Google Scholar] [CrossRef] [PubMed]
  53. Diekmann, D.; Brill, S.; Garrett, M.D.; Totty, N.; Hsuan, J.; Monfries, C.; Hall, C.; Lim, L.; Hall, A. Bcr encodes a GTPase-activating protein for p21rac. Nature 1991, 351, 400–402. [Google Scholar] [CrossRef] [PubMed]
  54. Cho, Y.J.; Cunnick, J.M.; Yi, S.J.; Kaartinen, V.; Groffen, J.; Heisterkamp, N. Abr and Bcr, two homologous Rac GTPase-activating proteins control multiple cellular functions of murine macrophages. Mol. Cell. Biol. 2007, 27, 899–911. [Google Scholar] [CrossRef] [PubMed]
  55. Dubash, A.D.; Koetsier, J.L.; Amargo, E.V.; Najor, N.A.; Harmon, R.M.; Green, K.J. The GEF Bcr activates RhoA/MAL signaling to promote keratinocyte differentiation via desmoglein-1. J. Cell Biol. 2013, 202, 653–666. [Google Scholar] [CrossRef] [PubMed]
  56. Olson, M.F.; Sahai, E. The actin cytoskeleton in cancer cell motility. Clin. Exp. Metastasis 2009, 26, 273–287. [Google Scholar] [CrossRef] [PubMed]
  57. Lawson, C.D.; Ridley, A.J. Rho GTPase signaling complexes in cell migration and invasion. J. Cell Biol. 2018, 217, 447–457. [Google Scholar] [CrossRef] [PubMed]
  58. Radu, M.; Semenova, G.; Kosoff, R.; Chernoff, J. PAK signalling during the development and progression of cancer. Nat. Rev. Cancer 2014, 14, 13–25. [Google Scholar] [CrossRef] [PubMed]
  59. Bustelo, X.R. RHO GTPases in cancer: Known facts, open questions, and therapeutic challenges. Biochem. Soc. Trans. 2018, 46, 741–760. [Google Scholar] [CrossRef] [PubMed]
  60. Cooke, M.; Kreider-Letterman, G.; Baker, M.J.; Zhang, S.; Sullivan, N.T.; Eruslanov, E.; Abba, M.C.; Goicoechea, S.M.; García-Mata, R.; Kazanietz, M.G. FARP1, ARHGEF39, and TIAM2 are essential receptor tyrosine kinase effectors for Rac1-dependent cell motility in human lung adenocarcinoma. Cell Rep. 2021, 37, 109905. [Google Scholar] [CrossRef]
  61. Bukhari, I.; Khan, M.R.; Li, F.; Swiatczak, B.; Thorne, R.F.; Zheng, P.; Mi, Y. Clinical Implications of lncRNA LINC-PINT in Cancer. Front. Mol. Biosci. 2023, 10, 1097694. [Google Scholar] [CrossRef] [PubMed]
  62. Li, S.; Lv, J.; Zhang, X.; Zhang, Q.; Li, Z.; Lu, J.; Huo, X.; Guo, M.; Liu, X.; Gao, R.; et al. ELAVL4 Promotes the Tumorigenesis of Small Cell Lung Cancer by Stabilizing LncRNA LYPLAL1-DT and Enhancing Profilin 2 Activation. FASEB J. 2023, 37, e23170. [Google Scholar] [CrossRef] [PubMed]
  63. Ghafouri-Fard, S.; Harsij, A.; Farahzadi, H.; Hussen, B.M.; Taheri, M.; Mokhtari, M. A concise review on the role of MIR100HG in human disorders. J. Cell. Mol. Med. 2023, 27, 2278–2289. [Google Scholar] [CrossRef] [PubMed]
  64. Wu, Y.; Wang, Z.; Yu, S.; Liu, D.; Sun, L. LncmiRHG-MIR100HG: A New Budding Star in Cancer. Front. Oncol. 2022, 12, 997532. [Google Scholar] [CrossRef] [PubMed]
  65. Sui, C.J.; Zhou, Y.M.; Shen, W.F.; Dai, B.H.; Lu, J.J.; Zhang, M.F.; Yang, J.M. Long noncoding RNA GIHCG promotes hepatocellular carcinoma progression through epigenetically regulating miR-200b/a/429. J. Mol. Med. 2016, 94, 1281–1296. [Google Scholar] [CrossRef] [PubMed]
  66. Zhang, X.; Mao, L.; Li, L.; He, Z.; Wang, N.; Song, Y. Long noncoding RNA GIHCG functions as an oncogene and serves as a serum diagnostic biomarker for cervical cancer. J. Cancer 2019, 10, 672–681. [Google Scholar] [CrossRef] [PubMed]
  67. He, Z.H.; Qin, X.H.; Zhang, X.L.; Yi, J.W.; Han, J.Y. Long noncoding RNA GIHCG is a potential diagnostic and prognostic biomarker and therapeutic target for renal cell carcinoma. Eur. Rev. Med. Pharmacol. Sci. 2018, 22, 46–54. [Google Scholar] [CrossRef] [PubMed]
  68. Nath, A.; Lau, E.Y.T.; Lee, A.M.; Geeleher, P.; Cho, W.C.S.; Huang, R.S. Discovering long noncoding RNA predictors of anticancer drug sensitivity beyond protein-coding genes. Proc. Natl. Acad. Sci. USA 2019, 116, 22020–22029. [Google Scholar] [CrossRef] [PubMed]
  69. Wang, Y.; Liu, Y.; Yang, B.; Cao, H.; Yang, C.X.; Ouyang, W.; Zhang, S.M.; Yang, G.F.; Zhou, F.X.; Zhou, Y.F.; et al. Elevated expression of USP9X correlates with poor prognosis in human non-small cell lung cancer. J. Thorac. Dis. 2015, 7, 672–679. [Google Scholar] [CrossRef] [PubMed]
  70. Pardali, K.; Moustakas, A. Actions of TGF-β as tumor suppressor and pro-metastatic factor in human cancer. Biochim. Biophys. Acta 2007, 1775, 21–62. [Google Scholar] [CrossRef] [PubMed]
  71. Berger, W.; Setinek, U.; Mohr, T.; Kindas-Mugge, I.; Vetterlein, M.; Dekan, G.; Eckersberger, F.; Caldas, C.; Micksche, M. Evidence for a role of FGF-2 and FGF receptors in the proliferation of non–small cell lung cancer cells. Int. J. Cancer 1999, 83, 415–423. [Google Scholar] [CrossRef]
  72. Marek, L.; Ware, K.E.; Fritzsche, A.; Hercule, P.; Helton, W.R.; Smith, J.E.; McDermott, L.A.; Coldren, C.D.; Nemenoff, R.A.; Merrick, D.T.; et al. Fibroblast growth factor (FGF) and FGF receptor-mediated autocrine signaling in non–small-cell lung cancer cells. Mol. Pharmacol. 2009, 75, 196–207. [Google Scholar] [CrossRef] [PubMed]
  73. Terai, H.; Soejima, K.; Yasuda, H.; Nakayama, S.; Hamamoto, J.; Arai, D.; Ishioka, K.; Ohgino, K.; Ikemura, S.; Sato, T.; et al. Activation of the FGF2-FGFR1 Autocrine Pathway: A Novel Mechanism of Acquired Resistance to Gefitinib in NSCLC. Mol. Cancer Res. 2013, 11, 759–767. [Google Scholar] [CrossRef] [PubMed]
  74. Jing, C.; Cao, H.; Wu, J.; Ma, R.; Zhang, J.; Liu, S.; Wang, Z. Long noncoding RNA ZMIZ1-AS1 promotes gefitinib resistance via binding to hnRNPA1. Precis. Med. Sci. 2021, 10, 133–137. [Google Scholar] [CrossRef]
  75. Martínez-Reyes, I.; Chandel, N.S. Cancer metabolism: Looking forward. Nat. Rev. Cancer 2021, 21, 669–680. [Google Scholar] [CrossRef] [PubMed]
  76. Sciacovelli, M.; Frezza, C. Metabolic reprogramming and epithelial-to-mesenchymal transition in cancer. FEBS J. 2017, 284, 3132–3144. [Google Scholar] [CrossRef] [PubMed]
  77. Fedele, M.; Sgarra, R.; Battista, S.; Cerchia, L.; Manfioletti, G. The Epithelial-Mesenchymal Transition at the Crossroads between Metabolism and Tumor Progression. Int. J. Mol. Sci. 2022, 23, 800. [Google Scholar] [CrossRef] [PubMed]
  78. Eltayeb, K.; La Monica, S.; Tiseo, M.; Alfieri, R.; Fumarola, C. Reprogramming of Lipid Metabolism in Lung Cancer: An Overview with Focus on EGFR-Mutated Non-Small Cell Lung Cancer. Cells 2022, 11, 413. [Google Scholar] [CrossRef] [PubMed]
  79. Wang, G.; Qiu, M.; Xing, X.; Zhou, J.; Yao, H.; Li, M.; Yin, R.; Hou, Y.; Li, Y.; Pan, S.; et al. Lung cancer scRNA-seq and lipidomics reveal aberrant lipid metabolism for early-stage diagnosis. Sci. Transl. Med. 2022, 14, eabk2756. [Google Scholar] [CrossRef] [PubMed]
  80. Yang, Y.; Zhu, T.; Wang, X.; Xiong, F.; Hu, Z.; Qiao, X.; Yuan, X.; Wang, D. ACSL3 and ACSL4, Distinct Roles in Ferroptosis and Cancers. Cancers 2022, 14, 5896. [Google Scholar] [CrossRef] [PubMed]
  81. Ha, N.T.; Lee, C.H. Roles of Farnesyl-Diphosphate Farnesyltransferase 1 in Tumour and Tumour Microenvironments. Cells 2020, 9, 2352. [Google Scholar] [CrossRef] [PubMed]
  82. Deng, H.; Li, W. Monoacylglycerol lipase inhibitors: Modulators for lipid metabolism in cancer malignancy, neurological and metabolic disorders. Acta Pharm. Sin. B 2020, 10, 582–602. [Google Scholar] [CrossRef] [PubMed]
  83. Liu, R.; Wang, X.; Curtiss, C.; Landas, S.; Rong, R.; Sheikh, M.S.; Huang, Y. Monoglyceride lipase gene knockout in mice leads to increased incidence of lung adenocarcinoma. Cell Death Dis. 2018, 9, 36. [Google Scholar] [CrossRef]
  84. Buczkowska, J.; Szeliga, M. Two Faces of Glutaminase GLS2 in Carcinogenesis. Cancers 2023, 15, 5566. [Google Scholar] [CrossRef]
  85. Ramirez-Peña, E.; Arnold, J.; Shivakumar, V.; Joseph, R.; Vidhya Vijay, G.; den Hollander, P.; Bhangre, N.; Allegakoen, P.; Prasad, R.; Conley, Z.; et al. The Epithelial to Mesenchymal Transition Promotes Glutamine Independence by Suppressing GLS2 Expression. Cancers 2019, 11, 1610. [Google Scholar] [CrossRef] [PubMed]
  86. Liu, S.H.; Zhu, J.W.; Xu, H.H.; Zhang, G.Q.; Wang, Y.; Liu, Y.M.; Liang, J.B.; Wang, Y.X.; Wu, Y.; Guo, Q.F. A novel antisense long non-coding RNA SATB2-AS1 overexpresses in osteosarcoma and increases cell proliferation and growth. Mol. Cell. Biochem. 2017, 430, 47–56. [Google Scholar] [CrossRef]
  87. Wu, G.; Wang, Q.; Zhu, T.; Fu, L.; Li, Z.; Wu, Y.; Zhang, C. Identification and Validation of Immune-Related LncRNA Prognostic Signature for Lung Adenocarcinoma. Front. Genet. 2021, 12, 681277. [Google Scholar] [CrossRef] [PubMed]
  88. Xu, M.; Xu, X.; Pan, B.; Chen, X.; Lin, K.; Zeng, K.; Liu, X.; Xu, T.; Sun, L.; Qin, J.; et al. LncRNA SATB2-AS1 inhibits tumor metastasis and affects the tumor immune cell microenvironment in colorectal cancer by regulating SATB2. Mol. Cancer 2019, 18, 135. [Google Scholar] [CrossRef] [PubMed]
  89. Ritchie, M.E.; Phipson, B.; Wu, D.; Hu, Y.; Law, C.W.; Shi, W.; Smyth, G.K. limma powers differential expression analyses for RNA-sequencing and microarray studies. Nucleic Acids Res. 2015, 43, e47. [Google Scholar] [CrossRef]
  90. Langfelder, P.; Horvath, S. Fast R Functions for Robust Correlations and Hierarchical Clustering. J. Stat. Softw. 2012, 46, i11. [Google Scholar] [CrossRef] [PubMed]
  91. Zhang, B.; Horvath, S. A general framework for weighted gene co-expression network analysis. Stat. Appl. Genet. Mol. Biol. 2005, 4, 17. [Google Scholar] [CrossRef] [PubMed]
  92. Huang, d.W.; Sherman, B.T.; Lempicki, R.A. Systematic and integrative analysis of large gene lists using DAVID bioinformatics resources. Nat. Protoc. 2009, 4, 44–57. [Google Scholar] [CrossRef]
Figure 1. Weighted gene correlation network analysis (WGCNA) of NSCLC cell lines sensitive and resistant to EGFR-TKI (erlotinib) and distinct EMT phenotypes. (A) WGCNA pipeline. (B) Plots of scale-free topology fitting index (left) and mean connectivity (right) as a function of soft thresholds. Red horizontal line indicates the fit parameter we chose to evaluate models (R2 = 0.9). The soft threshold β = 7 is the first value above R2 = 0.9 with good mean connectivity. (C) Hierarchical clustering of probes according to their Topological Overlapping Matrix (TOM) dissimilarity score. The color bars show the assignment of modules performed by Dynamic Tree Cut and Merged Dynamic algorithms (see Methods section for details). Each branch represents genes; colored bars represent the modules containing a group of highly connected genes.
Ijms 25 03863 g001
Figure 2. Identification of the key modules associated with ERL-resistance and intermediate EMT phenotypes. (A) Hierarchical clustering of NSCLC cell lines. Biological replicates show the highest degree of correlation within samples, represented by short vertical distances. Within each population, cell lines tend to cluster according to their biological features. Color bars indicate the phenotypes investigated: ERL-resistance indicates erlotinib-sensitive (red) and -resistant (green) cell lines; EMT phenotypes indicate epithelial (red), mesenchymal (dark green), and intermediate EMT (green) cell lines. (B) Heatmap of the module–trait relationships. Rows correspond to a module eigengene (ME), and columns correspond to the phenotypic traits. Each cell contains the corresponding correlation coefficient and p-value. The table is color-coded by correlation, according to the color gradient shown in the legend. (C) Heatmap of the module–trait relationships of selected modules. ERL-res = erlotinib resistance; I vs. E = intermediate EMT vs. epithelial cell lines; I vs. M = intermediate EMT vs. mesenchymal cell lines.
Ijms 25 03863 g002
Figure 3. Functional enrichment analysis of the brown4 and magenta4 modules. Gene Ontology biological processes (GO-BP, in red), as well as KEGG (green) and Reactome (blue) enriched pathways, are shown in the plot. Terms are ranked on the X-axis according to the p-value and on the Y-axis according to the fold-enrichment (reported inside the bubbles). Bubble size is proportional to the count of module genes belonging to the term, as indicated in the legend.
Ijms 25 03863 g003
Figure 4. qPCR analysis of selected lncRNAs. qPCR analysis of the lncRNAs indicated is normalized to RPL31 mRNA and expressed relative to their levels in parental (HCC827 or HCC4006) cell lines (mean ± SD). qPCR data are representative of three independent experiments. Asterisks indicate significant t-test p-values in the comparison of a given derived cell line with the corresponding parental cell line: * p < 0.05; ** p < 0.01; *** p < 0.001; n.s. no significant p-values. Colors indicate the module membership of the selected lncRNAs, from the top: brown4, magenta4, and plum4.
Ijms 25 03863 g004
Figure 5. Subnetworks of the brown4 module. Subnetwork of selected lncRNAs connected to mRNA of the Rho GTPase and/or Rho GTPase regulation pathways (A); apoptotic enriched processes and pathways (B) identified by the DAVID functional enrichment analysis of the brown4 module. The selected lncRNAs (green diamonds) and mRNAs (orange ellipses) at probe-level are connected by edges whose sizes are proportional to their WGCNA weights: the higher, the thicker. Node size is proportional to the intramodular connectivity measure (kWhithinScaled), and node border color and width indicate the fold-change between Erl-resistant/intermediate EMT and -sensitive/epithelial NSCLC cell lines: red = upregulation (|fold-change| > 1.5); blue = downregulation (|fold-change| < 0.5); white = no expression variation; thickness = the higher, the thicker.
Ijms 25 03863 g005
Figure 6. Subnetworks of the magenta4 module. Subnetwork of selected lncRNAs connected to mRNAs of cell adhesion, cell migration, cell–extracellular matrix pathways (A); metabolism, and/or lipid and phospholipid metabolism (B) identified by the DAVID functional enrichment analysis of the magenta4 module. The selected lncRNAs (green diamonds) and mRNAs (orange ellipses) at probe-level are connected by edges whose sizes are proportional to their WGCNA weights: the higher, the thicker. Node size is proportional to the intramodular connectivity measure (kWhithinScaled), and node border color and width indicate the fold-change between Erl-resistant/intermediate EMT and -sensitive/epithelial NSCLC cell lines: red = upregulation (|fold-change| > 1.5); blue = downregulation (|fold-change| < 0.5); white = no expression variation; thickness = the higher, the thicker.
Ijms 25 03863 g006
Figure 7. Network of the plum4 module. lncRNAs (diamonds) and mRNAs (ellipses) at probe-level are shown in an organic layout. Nodes are connected by edges whose sizes are proportional to their WGCNA weights: the higher, the thicker. Node size is proportional to the intramodular connectivity measure (kWhithinScaled), and node border color and width indicate the fold-change between Erl-resistant/intermediate EMT and -sensitive/epithelial NSCLC cell lines: red = upregulation (|fold-change| > 1.5); blue = downregulation (|fold-change| < 0.5); white = no expression variation; thickness = the higher, the thicker. Nodes of selected lncRNAs are filled in green.
Ijms 25 03863 g007
Table 1. Top lncRNAs of brown4 and magenta4 modules correlated to erlotinib resistance and intermediate EMT phenotypes.
Gene NameBiotypeCytoband LocationModule
LINC-PINTlincRNA7q32.3brown4
MIOS-DTdivergent lncRNA7p21.3
LYPLAL1-DTdivergent lncRNA1q41
LINC01547lincRNA21q22.3
MIR100HGmiRNA host gene11q24.1
ZNF436-AS1antisense lncRNAp36.12
LOC107984035uncharacterized9p11.2
LINC00653lincRNA20p11.23
LHX1-DTdivergent lncRNA17q12
GAPLINClincRNA18p11.31
PAN3-AS1antisense lncRNA13q12.2
LINC01004lincRNA7q22.3
ENSG00000261490uncharacterized4p16.1
ENSG00000232850antisense lncRNA9q34.11
C2CD4D-AS1antisense lncRNA1q21.3
NFE2L1-DTdivergent lncRNA17q21.32
MIR4435-2HGmiRNA host gene2q13
ENSG00000234141lncRNA7p21.3
ENSG00000287839uncharacterized1q22
GABPB1-AS1antisense lncRNA15q21.2
ENSG00000289039uncharacterized10q26.3magenta4
MHENCRlincRNA20q13.33
ENSG00000233085lincRNA6q27
ENSG00000251532lincRNA5p15.33
ENSG00000236453lincRNA7q21.3
SPART-AS1antisense lncRNA13q13.3
LINC00973lincRNA3q12.1
MAP3K2-DTdivergent lncRNA2q14.3
ZNF674-AS1antisense lncRNAXp11.3
GIHCGlncRNA12q14.1
MIR205HGmiRNA host gene1q32.2
ZMIZ1-AS1antisense lncRNA10q22.3
NEAT1lincRNA11q13.1
RAB30-DTdivergent lncRNA11q14.1
LINC01629lincRNA14q24.3
LOC100506124lncRNA2q24.3
ENSG00000267575lincRNA19q11
LINC00472lincRNA6q13
FAM95ClncRNA9p13.1
LINC02512lincRNA4q33
LINC01182lincRNA4p15.33
LASTRlincRNA10p15.1
ENSG00000268403antisense lncRNA11p15.4
ENSG00000257283antisense lncRNA12q22
KDM7A-DTdivergent LncRNA7q34
LINC00173lincRNA12q24.22
Table 2. Top lncRNAs of plum4 module correlated to erlotinib resistance.
Gene NameBiotypeCytoband LocationModule
LINC02814lincRNA1q42.13plum4
DPY19L3-DTdivergent lncRNA19q13.11
ENSG00000288989uncharacterized9q34.13
SATB2-AS1antisense lncRNA2q33.1
LINC01358lincRNA1p32.1
ENSG00000286905uncharacterized2p25.3
ZEB1-AS1antisense lncRNA10p11.22
LINC01004lincRNA7q22.3
Disclaimer/Publisher’s Note: The statements, opinions and data contained in all publications are solely those of the individual author(s) and contributor(s) and not of MDPI and/or the editor(s). MDPI and/or the editor(s) disclaim responsibility for any injury to people or property resulting from any ideas, methods, instructions or products referred to in the content.

